Abstract
Despite advancements in the characterization of forming limit curves (FLCs) with the development of stereoscopic digital image correlation (DIC), there is still uncertainty in the accuracy of the limit strains, especially in forming operations with out-of-plane bending. The ISO12004-2:2008 standard offers a standardized approach to FLC determination but is not without limitations and is not always applicable to new materials and forming processes (e.g., warm forming, hot stamping). In the present work, a physically based limit strain detection technique is developed, termed the Enhanced Curvature Method (ECM), based on the sheet surface curvature evolution at the onset of necking in sheet formability testing. The ECM is applied to the characterization of 1.1 mm AA5182-O sheet using Marciniak, Nakazima, and stretch–bend characterization tests, and its limit strains are compared with those from the linear best-fit (LBF) local strain-rate approach and the ISO-12004 standard. The ECM considers the physical nature of necking in sheet forming with the aid of thresholds defined in terms of an imperfection metric analogous to the well-known Marciniak–Kuczynski (MK) imperfection factor. By quantifying the evolution of necking, FLCs of different safety margins can be readily generated, enabling a more intuitive selection for the factor of safety. For lower and upper ECM thresholds, the Marciniak plane strain limiting strain was determined to lie between 0.173 and 0.198, respectively, which is comparable to the analytical prediction of 0.194 and in general agreement with the published literature for AA5182-O. Similar plane strain limits were obtained using the ISO and LBF methods with values of 0.188 and 0.208, respectively. The same rankings in limit strain values between methods were observed for plane strain loading in Nakazima and stretch–bend tests.
1. Introduction
Accurate characterization of the formability of sheet metals is essential for cost-effective design and fabrication of lightweight automotive components. Formability of sheet metals was discussed as early as 1944 [1] in simple terms of elongation under different conditions and later by Swift [2] who built upon the criterion of Considère [3] to predict the onset of diffuse necking in biaxial stretching. The analysis of Swift provides the strains at the onset of diffuse necking which were found too conservative for sheet metal forming. The development of a significant change in the surface curvature was found to better coincide with the formation of an acute or localized neck prior to fracture. The first forming limit diagram (FLD) was developed by Keeler [4] and Goodwin [5] in terms of the in-plane principal strains upon the formation of an acute neck under different proportional loading conditions.
In the initial development of the FLD [4,5], the limit strains were defined as the strains at which a visible neck or surface discontinuity were observed. However, the accurate identification of the onset of acute necking has remained challenging. Inherent in the early FLD approach was the assumption that strain histories were linear as in situ strain measurement techniques were not available. The effect of strain path (SP) nonlinearity was investigated in many studies [6,7,8], while the length scales used for strain measurement have also been known to influence measured strain gradients at the onset of necking [4,6,9]. Significant progress was made in analytical frameworks for predictive FLD determination, such as the bifurcation models of Marciniak and Kuczynski [10], Storen and Rice [11], and Hutchinson et al. [12]; however, these techniques were constrained by experimental limitations in measuring the limit strains.
Widespread standardization of limit strain detection was achieved with the ISO12004-2:2008 standard [13], referred to herein as the “ISO standard”, which incorporated stereoscopic digital image correlation (DIC) for in situ strain measurement of the entire deformation history. The ISO methodology employs an empirical approach to perform a parabolic fitting of the strain distribution perpendicular to the necking location at one image prior to fracture when using DIC. One source of uncertainty in the ISO method is the assumption of an approximately symmetric strain distribution across the neck since strain distributions can vary due to friction, elevated forming temperature, and dynamic strain-aging, that promote double necks in Nakazima [14] and Marciniak [10] tests. The formation of a neck away from the Nakazima punch apex is particularly challenging since the strain distribution becomes bimodal and not parabolic [15,16].
Since the introduction of DIC, new limit strain detection techniques have been proposed that are more consistent with the mechanics of localization [15,17,18,19,20,21,22]. Strain-rate-based methods as proposed by Volk and Hora [17,19], the statistics-based strain-rate method of Hotz et al. [20], and the approach of Martinez-Donaire et al. [15] are all time-dependent methods that attempt to detect an acute neck by tracking the history of either the major strain-rate or the thinning strain-rate on the sheet surface. An acceleration in the local strain-rate coincides with acute neck formation associated with unstable thinning prior to fracture. A deceleration of the strain-rate in a region adjacent to the crack location has also been used by Martinez-Donaire et al. [15] to ascertain the onset of localization. DiCecco et al. [23] observed that the onset of strain-rate deceleration outside of the neck occurs at different times at different locations. The methodology was found to be especially sensitive to DIC processing parameters, complicating the implementation and undermining confidence in the reported limit strains. Other issues with the application of strain-rate-based detection methods stem from the inherent noise in DIC-based strain-rate measurements, sensitivity to DIC analysis parameters, limited image acquisition speeds, and subjectivity associated with detection thresholds. Nonetheless, strain-rate methods are attractive for limit strain detection since they are local methods that are unaffected by the formation of multiple necks, consider the entire history of deformation, and are consistent with the mechanics of tensile localization. Additional complexity in elevated temperature forming arises since necking can evolve gradually as shown in DiCecco et al. [24] for the die-quenching of an AA7xxx-series alloy and Zhang et al. [25] in hot forming of AA6082.
A new class of limit strain detection methods has been proposed based upon the change in the surface curvature associated with onset of acute necking [15,21,22]. Curvature methods are analogous to the visual techniques applied by Keeler [4,26] and are physically intuitive. An acute neck will form a surface discontinuity and produce a change in the local curvature that can be quantified using stereoscopic DIC. One advantage of curvature-based detection algorithms is that the displacement data from DIC is directly used which has a higher spatial resolution compared to the strain resolution because of the additional filtering applied in the strain computation.
Curvature-based methods may also be sensitive to the choice of DIC analysis settings in terms of resolution and image acquisition rate. The formation of a local neck must be captured before fracture, which can happen rapidly for high-strength alloys with lower formability. The identification of an appropriate curvature threshold is also an open question. In the work of DiCecco et al. [27], a zero-curvature threshold in Nakazima tests was applied to define an acute neck. Prior to localization, the curvature of the sheet was approximately the same as the curvature of the hemispherical punch. The zero-curvature criterion, corresponding to local flattening of the sheet, can be interpreted as a physical upper bound for the limit strain since localization is already underway with the sheet about to become locally concave and form a visible neck. It can also be challenging to apply the zero-curvature criterion to Marciniak tests because the sheet remains approximately flat. The so-called flat valley method of Martinez-Donaire et al. [15] applied to stretch–bending is also analogous to a zero-curvature threshold. Min et al. [21] proposed a curvature threshold based on a statistical assessment of the curvature signal relative to the noise and applied this approach to Marciniak and Nakazima tests of an MP980 steel.
The objective of the present study is to investigate limit strain detection strategies that span three representative deformation modes in sheet metal forming: (i) in-plane stretching using Marciniak tests, (ii) out-of-plane deformation using Nakazima tests, and (iii) out-of-plane deformation using stretch–bending tests. The Marciniak test features primarily in-plane deformation without friction and punch contact. The Nakazima test introduces mild out-of-plane bending with friction and through-thickness contact stress from punch contact. The stretch bend test represents a more severe out-of-plane deformation process with significantly higher-thickness stress and strain gradients than the Nakazima. The Nakazima and stretch–bending tests complicate limit strain detection by inducing nonlinear strain paths (NLSPs), bending, and compressive contact stress that will delay necking to higher strain levels [28,29,30]. The limit strain detection methods that are evaluated include (i) the ISO method, (ii) the strain-rate-based LBF method of Volk and Hora [19], and (iii) an enhanced curvature method (ECM) developed as part of this study. The material of interest was AA5182-O, which was selected since it is commonly used for automotive inner panels and known to provide challenges in formability characterization due to its tendency to exhibit dynamic strain aging [31,32,33]. Limit strain predictions are compared for the three experiments and three detection methods, and the ability of the methods to accurately capture the onset of necking is comparatively assessed.
2. Material—Tensile Properties
Prior to presenting the formability methodology and results, this section describes the mechanical properties of 1.1 mm thick AA5182-O aluminum alloy sheet with a nominal composition of 4.5 weight percent magnesium and 0.35 weight percent manganese with the balance being aluminum. The mechanical properties were characterized using a tensile geometry with a reduced section width of 20 mm and length of 120 mm. All tensile testing was completed on a 100 kN MTS Criterion 45 test frame (MTS Systems Corporation, Eden Prairie, MN, USA) with stereoscopic DIC used for strain measurement. A discussion of the DIC system is included in Section 3.2. The axial and transverse strains were measured using 80 mm and 16 mm virtual extensometers, respectively. Tensile tests were performed at a nominal strain-rate of 0.01 s−1 in the rolling (RD), diagonal (DD), and transverse (TD) directions, with three repeated tests per orientation. All strains reported herein are true strains, unless otherwise indicated.
The engineering stress–strain curves from all tensile tests are presented in Figure 1a, in which the presence of the dynamic strain aging or Portevin-Le Chatelier (PLC) effect [32,33,34] is readily observed as serrations in the stress–strain response. Serrated flow is common in 5xxx-series aluminum alloys [31,32,35] as a result of the transient interaction between solute Mg atoms and dislocation motion. The major true strain-rate contours from an RD tensile test are presented in Figure 1b over an applied tensile strain range of 0.025 to 0.149 in which PLC effects are evident. At an applied tensile strain of 0.111, a PLC band occurs outside of the gauge region and in the shoulder of the tensile sample, which can promote localization. The Lankford coefficients (r-values) were determined as the average ratio of the plastic width to thickness strain from yield to the uniform elongation. The average r-values in the RD, DD, and TD were 0.67, 0.70, and 0.71, respectively, which corresponds to a normal anisotropy ratio of .
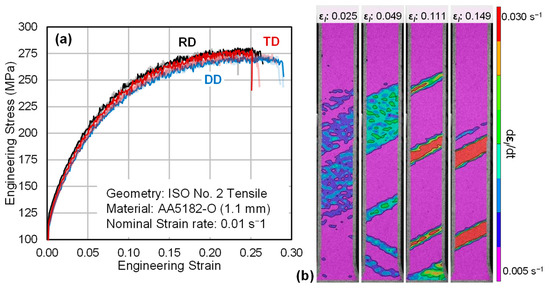
Figure 1.
(a) Repeated engineering stress–strain curves of AA5182-O (1.1 mm) in the rolling (RD), diagonal (DD), and transverse (TD) sheet directions. Major true strain-rate contours from the gauge region of an RD tensile sample are presented in (b) for applied tensile strains varying from 0.025 to 0.149 true strain. The strain-rate contours highlight the PLC effect in the material and result in the serrated flow observed in (a). At an applied tensile strain of 0.111, PLC bands are observed in the tensile shoulder, outside of the uniform gauge region.
The uniform elongation in the rolling direction was determined according to the Considère criterion, described by
where , is the true major stress (force over current area), and is the von Mises effective stress. For uniaxial tension, is equal to unity. H is the work hardening rate, and is the effective plastic strain, i.e., the total true strain less the elastic strain. Due to the oscillations in the stress response from the PLC effect, a constrained smoothing spline [36] was applied to the flow stress (true stress versus true plastic strain) to facilitate differentiation prior to computing the work hardening rate. The spline constraint ensured that H was monotonically decreasing (), as shown in Figure 2. Values for Equation (1) using a smoothing spline without the monotonically decreasing constraint are also shown for comparison purposes. The average plastic strain and applied engineering strain at the Considère point were calculated as 0.208 and 0.237, respectively, with Equation (1) applied to the three repeated tests in Figure 2.
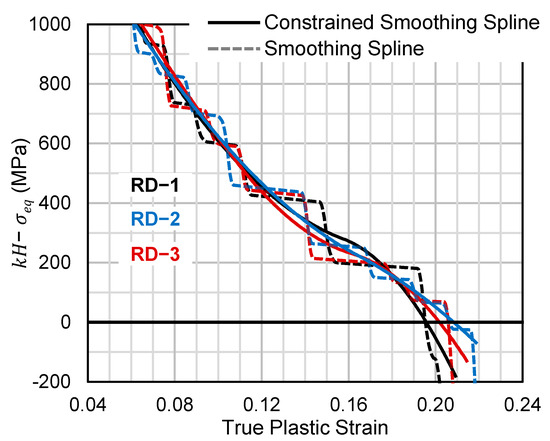
Figure 2.
The difference between the uniaxial work hardening rate (k = 1) and the flow stress, Equation (1), is plotted for each repeated tensile test in the rolling direction. The repeated curves were pre-conditioned with a monotonically decreasing constrained smoothing spline prior to evaluation. The same curves without the constraint are also shown.
For a rate-independent material [31] subjected to in-plane stretching, Equation (1) can be used to estimate the diffuse necking strain for the limiting formability condition of plane strain tension (FLC0). The diffuse and acute necking limits coincide for plane strain tension. For plane strain tension (PST), was estimated using the Constrained Logan–Hosford yield function of Fast-Irvine et al. [37]. Assuming an exponent of m = 8 for Face-Centered Cubic (FCC) materials and using , the major to effective yield strength ratio is
Substitution of Equation (2) into Equation (1) provides the plastic strain for the FLC0 which is = 0.190 (0.01). Since the FLC0 is typically reported as an applied true (total) strain, Hooke’s law is used for aluminum with and such that the FLC0 = 0.194 (0.01). PLC effects in AA5182-O are associated with a negative strain-rate sensitivity [31]; therefore, the analytical FLC0 of 0.194 is expected to be an upper bound. The analytical FLC0 is in excellent agreement with a survey of the literature [30,38,39,40,41,42,43,44,45,46,47] for AA5182-O with an average FLC0 of 0.193 (0.039). Additional details on the literature survey are provided in Appendix A.
3. Formability Experimental Methods
Formability was characterized using Marciniak and Nakazima tests, respectively. The effect of through-thickness strain gradients was investigated using cylindrical stretch–bend punches. Stereoscopic DIC was used to measure displacement gradients and surface strains. Relevant details on each of the formability tests are described, with a brief discussion on the data processing using smoothing splines to improve limit strain detection.
3.1. Formability Testing Procedures
All formability testing was conducted using dog-bone (DB)-type specimens in accordance with the ISO12004-2:2008 standard [13], with a 25.4 mm long gauge section and a 20 mm transition radius, and various widths, as shown in Figure 3 and summarized in Table 1. In the Marciniak and Nakazima testing, the specimen widths ranged from 25.4 mm to 177.8 mm to produce strain paths from uniaxial to biaxial stretching. Three repeated tests were completed per specimen width. For stretch–bend testing, only a 76.2 mm wide specimen was utilized which produced approximately plane strain bending and stretching. For each sample type, if fracture did not occur within the gauge region, additional tests were performed. All tests were performed in an MTS formability press with a constant punch velocity of 1 mm/s and binder load of 640 kN to limit draw-in. Lubrication in all testing consisted of placing three to four layers of 0.125 mm thick PTFE sheet between the punch and the DB samples. Both sides of each PTFE sheet were lightly coated in white petroleum jelly. The combination of PTFE sheets and white petroleum jelly was found to provide adequate lubrication during testing as evidenced by occurrence of necking near the center of the Nakazima punch.
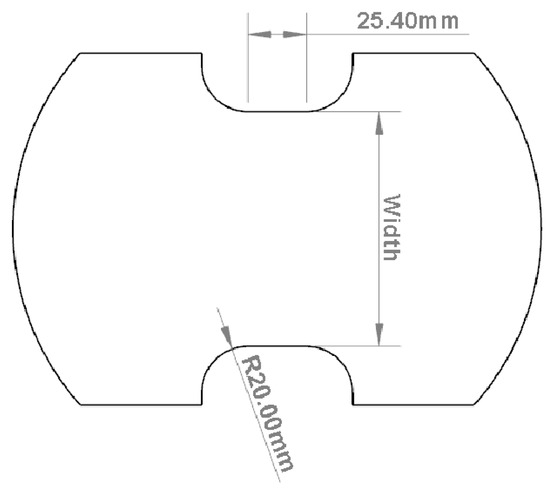
Figure 3.
Specimen geometry used in all formability testing. Widths are given in Table 1.

Table 1.
Specimen widths used for Marciniak, Nakazima, and Stretch–Bend testing. Widths used for FLC0 data collection in Nakazima and Marciniak tests are noted by the bolding in green.
The Marciniak and Nakazima (Figure 4) tooling conformed to the ISO12004-2:2008 standard [13] and was fabricated from tool steel hardened to 55–60 HRC. The Nakazima and stretch–bend tests employed an annular die set with an inner diameter of 106 mm and a die entry radius of 6.35 mm. The diameter of the hemispherical punch was 101.6 mm. In the stretch–bend testing, cylindrical punches with radii of 2 mm and 15 mm were used.
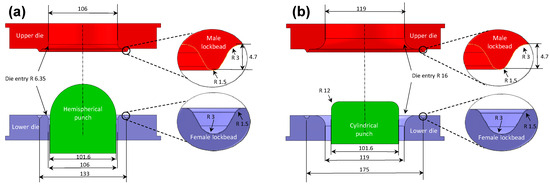
Figure 4.
Schematic of the (a) Nakazima and (b) Marciniak tools that conform to the ISO12004-2 standard [13]. All dimensions are in millimeters.
The Marciniak tests were performed in an annular die set with an inner diameter of 119 mm, a die entry radius of 16 mm, and a single annular lockbead with a height of 4.7 mm. The carrier blanks used in the Marciniak tests were 203.2 mm square, 1.0 mm in thickness, and had a 32 mm diameter central hole. The surface of the carrier blanks in contact with the test specimens were sandblasted to increase friction and improve stretching of the blank to promote failure within the central area of the carrier blank opening. Mild steel carrier blanks were used for tests ranging from uniaxial tension to plane strain, while stainless steel carrier blanks were used in biaxial stretching due to the relatively high formability of the AA5182-O alloy. The cylindrical Marciniak punch had a diameter of 101.6 mm, a profile radius of 12 mm, and a recessed central hole of 32 mm to match the hole size of the carrier blanks used in Marciniak testing. Additional details on the Nakazima and Marciniak tooling can be found in Noder and Butcher [30].
3.2. DIC Strain Measurement
Two four-megapixel Gazelle Camera Link cameras (Teledyne FLIR LLC, Wilsonville, OR, USA) were utilized with 35 mm focal length lenses for stereoscopic image acquisition in all tests, providing an image scale of approximately 0.04 mm/pixel or 25 pixels/mm. The image acquisition rate was at minimum 10 fps. The DIC software was from Correlated Solutions Inc. (Irmo, SC, USA) with Vic-Snap 8® (Version 8, build 526) for image acquisition and Vic-3d 8®(Version 8.6.2, build 661) for image analysis. Prior to testing, all samples were cleaned with isopropanol and allowed to dry before applying a random black and white speckle pattern using aerosol-based spray paints.
Relevant image processing parameters in the Vic-3D 8® software package include the subset size, strain filter size, and step size, all measured in pixels. The product of the step size, strain filter size, and image resolution is often termed the virtual strain gage length (VSGL) over which averaging occurs [48]. The respective step and strain filter sizes were 4 pixels and 5 pixels, with a subset size of 29 to 35 pixels. The image scale was 25 pixels/mm corresponding to an approximate VSGL of 0.8 mm.
It is important to note that the term thinning strain used throughout the paper is calculated using the measured strains on the exposed (convex) surface of the sample, using a volume conservation assumption, , and neglecting elastic strains. A positive sign convention for is adopted for convenience. It is noted that the thinning strain is only approximately uniform through-thickness in Marciniak testing.
Displacement and strain data were extracted using so-called ‘line inspector tools’ or line slices in Vic-3d 8®, an example of which is shown in Figure 5a. Consistent with ISO12004-2:2008, five line slices were positioned parallel to the length of the specimen in strain states from uniaxial tension to plane strain tension and were located perpendicular to the crack in biaxial stretching. The minimum length of the line is 20 mm on either side of the neck. The point density of the line slices was approximately 15 points per mm.
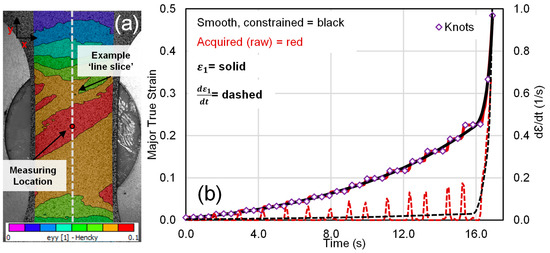
Figure 5.
(a) Lengthwise true strain contour of a 25.4 mm AA5182-O Marciniak dog-bone sample demonstrating the typical line slice location. In (b), symbols are measured major strain (from “Measuring location” in (a)) versus time, solid line is a fit to the measured data using a smooth and constrained spline, while dashed curves are time derivatives of the measured (red) and smoothed (black) major true strain using a central finite difference scheme.
3.3. Spline Interpolation
The consideration of time-dependent and curvature-based forming limit detection methods requires calculation of time and spatial derivatives that introduce noise in addition to fluctuations in the strain due to PLC effects, as evident in Figure 5b. Smoothing of the strain history was examined using a piece-wise cubic spline fit with knots at every fifth data point, as shown in Figure 5b.
The constrained splines were fit using the open-source toolbox SLM, of D’Errico [49] in Matlab® (R2021b). Constraints upon the derivatives of the splines were enforced to ensure that the spline has a physically realistic trend for the parameter of interest. For instance, the major strain at the crack location must always be positive and increasing in formability characterization tests. The same holds for the major strain-rate, as shown in Figure 5b). To monitor the underlying trend in the major strain to detect localization, the fluctuations in the strain-rate due to PLC effects can be minimized by enforcing the spline to be positive and continuously increasing.
4. Limit Strain Detection: The Enhanced Curvature Approach
In the curvature approach to limit strain detection, stereoscopic DIC is used to optically detect the development and growth of a localized neck in terms of a surface discontinuity. This method is analogous to the so-called finger test, employed in the early days of FLC development [4] where necking was determined by the touch of a fingernail over the surface of interrupted forming limit tests. An illustrated example is shown in Figure 6 to show the changes in curvature over the duration of a formability test. Figure 6a–c shows a conceptual evolution of the necking profile on the surface of a Marciniak sample during forming. Prior to necking, the curvature is relatively constant and close to zero, corresponding to uniform stretching of a nominally flat sheet. At the onset of localized necking, the curvature signal rapidly changes as a physical groove, i.e., acute neck, develops. The limit strains correspond to the sudden change in curvature relative to the baseline signal.
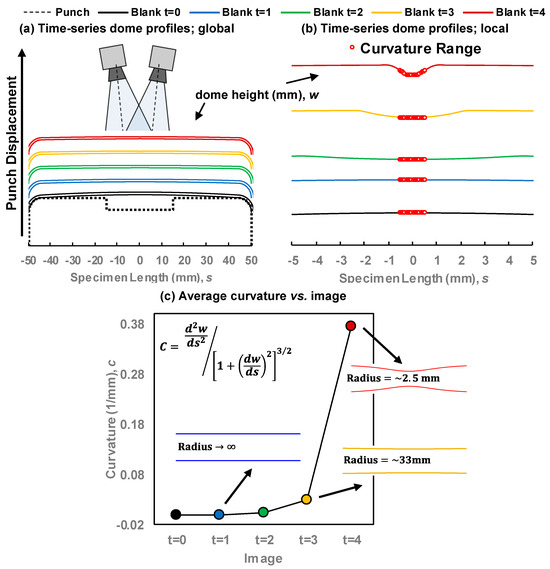
Figure 6.
Schematic to illustrate idealized development of a neck in a sheet metal specimen and detection of the neck based on local changes in the sheet curvature. (a) includes a macro-view of the punch and sheet profile, and while (b) shows the exaggerated close-up profile of the top surface of the shear near the punch center, (c) reflects the local curvature evolution for each time step with sample necked profiles.
The detection of necking by tracking curvature changes is an extension of the methodology of DiCecco et al. [22] and is termed the Enhanced Curvature Method (ECM). The ECM incorporates improvements in (i) the calculation of curvature and subsequent signal processing and (ii) thresholds for neck detection in terms of a thickness imperfection factor. In the paper, the ECM is applied to both in- and out-of-plane deformation modes and compared to limit strains determined using the LBF [19] and ISO limit strains.
4.1. Curvature Calculation
The curvature is calculated using Equation (3) over a distance equal to the sheet thickness at the fracture location. This length was selected to minimize the region to analyze for neck detection and follows the rule of thumb that the width of an acute neck is on the order of the sheet thickness. In Equation (3), is the displacement profile of the blank, and is the length of the sample over the area of interest. Both and are contained within the extracted line slices from the DIC analysis, which also dictates the orientation. By convention, is centered about the failure location and thus ranges over approximately ±0.55 mm for the 1.1 mm thick AA5182-O. The curvature is calculated at each point [50], , contained within the line slice over this range and the average of these points, , is taken.
In (3), first and second derivatives of the experimental data are required. A quintic spline is chosen to fit the measured curvature versus time data and used to perform time differentiation in order to mitigate noise inherent in the differentiation of the discrete surface profile data series. Min et al. [51] fit a circle to the necking region in their curvature calculations which serves the same purpose as the chosen spline approach. However, the former may yield an ill-conditioned fit in instances in which the neck is not locally circular. To illustrate this point, the calculated curvature evolution in a plane strain Marciniak test (127.0 mm DB specimen), calculated using either a quintic smoothing spline or a circle, both fit to the necking region, is compared in Figure 7a. When the total range is extended to twice the sheet thickness or 2.2 mm, there is a divergence between the spline and circle fits as necking initiates and progresses. The spline fit begins to capture the shoulders of the neck [22], and the signal becomes attenuated as it is averaged over a wider area. Fortunately, for the adopted fitting range of 1.1 mm, both methods produce a comparable signal. For reference, the sheet profiles used to calculate the curvature signals in Figure 7a are included in Figure 7b at the onset and progression of necking. The sheet profiles correspond to the displacement profiles as measured by the fixed stereoscopic DIC system. Note that the curves have been shifted vertically in the plot to account for the movement of the Marciniak punch.
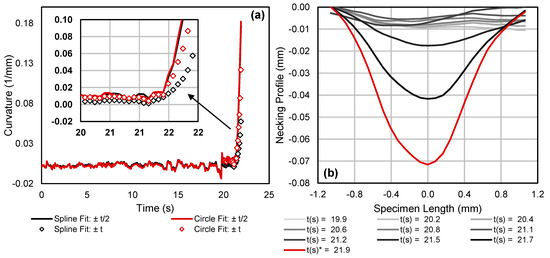
Figure 7.
(a) Comparison of calculated curvature evolution in a plane strain Marciniak test sample, as calculated using either a quintic smoothing spline or using a circle fit over ranges of 1.1 mm and 2.2 mm. The necking profiles at different instances in time at and after the onset of necking are included in (b), with the red curve corresponding to the profile from the image just prior to failure.
As can be seen in Figure 7a, the curvature history in a real test contains noise and requires signal processing and conditioning prior to detecting localization, much like the implementation of neck detection in the ISO12004-2 standard [13]. The need for signal processing is particularly important for materials with PLC effects like the AA5182-O.
Smoothing of the curvature signal, , from Figure 7a was performed by considering curvature as a function of thinning strain at the center of the neck, , as illustrated in Figure 8a. Here, the thinning strain, , versus time is first smoothed using the same procedures applied in Figure 5b. When curvature is plotted with respect to the thinning surface strain, the transition at necking onset can be more easily fit with a spline fit since is also accelerating, producing a more gradual transition.
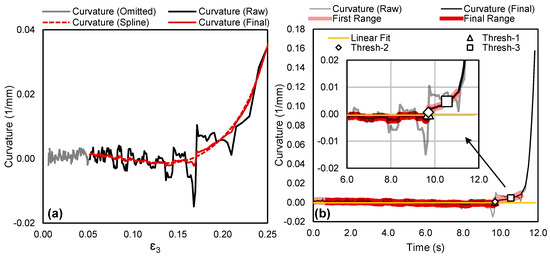
Figure 8.
(a) The measured curvature (C, raw) signal versus thinning strain (), portion of curvature data omitted (C, omitted), spline fit (Cs) using a constrained smoothing spline, and weighted average of the two curves is taken to produce the final curvature signal (Cf) for necking analysis. (b) shows the same data with the vertical axis range reduced for clarity. In (b), deviation from the linear region in curvature vs. time is used to identify necking for different threshold values.
Transient or nonlinear effects in the strain path, notably in Nakazima testing as the sheet wraps around the punch, as further detailed in Section 5.1, can complicate conditioning of the curvature signal. Therefore, the first 0.05 of thinning strain, corresponding to the grey curve in Figure 8a, is omitted. This cut-off value is appropriate for AA5182-O with its high ductility but may require study for lower-ductility materials or thicker sheets. A spline is then fit to the remainder of the - curve under a constraint to be concave up. The resulting spline, , is included in Figure 8a, in which the range of the -axis has been reduced to highlight the fit. Note that the mild concavity (negative curvature) early in the deformation history is expected since the Marciniak tests exhibit slight crowning that increases with deformation. To ensure that subtle transient effects in the measured curvature data () are not missed in the smoothed response (), the final signal () is taken as a weighted average of and . A weighting of 0.833 towards was adopted, selected largely based on a trial-and-error approach. Neck detection used the smoothed curvature data, . As outlined in the following section, the detection algorithm considers the smooth data (), but in the time domain, as plotted in Figure 8b, along with the original measured curvature signal, . The two curves are in close agreement, with PLC effects and noise both significantly reduced.
4.2. Neck Detection and Thresholding of the Curvature
Within the ECM framework, acute necking corresponds to an increase in curvature relative to the baseline trend established over the test. The challenge is to define and identify a meaningful level of deviation in the curvature that corresponds to onset of acute necking.
Figure 8b shows a threshold detection approach based on the history of versus time. Deviation from the baseline curvature signal is determined by comparing to a linear fit, , over the baseline range. An initial fitting range estimate for is identified by the points that satisfy the inequality of Equation (4) and a linear fitting estimator, , of is computed. The range established through Equation (4) is meant to encompass the entire linear range but can inherently contain points undergoing localization, as shown in Figure 8b. The linear estimator is compared to . Data points exhibiting deviation from the estimator as a result of localization or extraneous noise above a nominal value are also discarded, per Equation (5). The range established with Equation (5) is used in the final fitting of . A comparison of the initial and final fitting ranges is presented in Figure 8b, where the final range established with Equation (5) is shown to improve on the initial estimate. A bisquare linear least squares (LLS) regression fitting scheme with a positive slope constraint was followed to determine and that iteratively identifies and reduces the weighting of outliers on the fit.
The difference between and is defined as . Physically, this parameter corresponds to the change in curvature between time increments and is used to identify acute necking. A positive value for corresponds to an increasingly concave curvature and indicates that necking is occurring while the magnitude of corresponds to the severity of necking. To investigate the effect of curvature threshold on neck detection accuracy in the ECM, three thresholds of 0.0005 mm−1 (lower bound, Thresh-1), 0.001 mm−1 (Thresh-2), and 0.005 mm−1 (upper bound, Thresh-3) were considered. The threshold levels were selected to span an order of magnitude change in . The threshold limits are included in Figure 8b for the selected 127.0 mm AA5182-O plane strain Marciniak test. There, it can be seen that the largest threshold of 0.005 mm−1 considered is not reached until the curvature trend has accelerated due to localization. The relationship between thresholds and limit strains is further explored in Section 5.2.
4.3. Through-Thickness Imperfection Metric
Although thresholds are used to quantify/detect the limit strain using the ECM, a curvature threshold is not necessarily intuitive in FLC interpretation. An alternative imperfection metric is proposed, , which corresponds to the ratio of the sheet thickness in the neck region to the sheet thickness outside of the neck region, as illustrated in Figure 9.
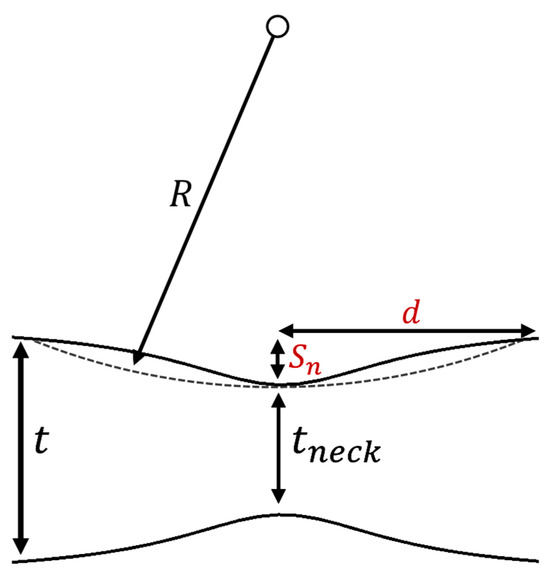
Figure 9.
Schematic (not to scale) showing the reduction in sheet thickness within the neck due to the formation of an exaggerated neck of average radius, R. Here, t is the current sheet thickness outside of the neck, d is one-half of the width of the neck (taken as ), Sn is the neck depth, and tneck is the reduced thickness within the neck.
The imperfection factor is calculated using Equation (6), where is the neck depth, and is an offset for tests with an initial bend (curvature), tneck is the minimum thickness at the center of the neck, and is the current sheet thickness, estimated from and the initial sheet thickness.
The neck depth, , is derived from a geometric approximation of the neck, assuming a constant necking radius of curvature for a given curvature threshold, as represented in Figure 9. The neck depth is computed using Equation (7) from the measured curvature, where is the reciprocal of the measured curvature at a given threshold, and is one-half of the neck width.
In Section 4.1, the selected region for curvature computation was because it produced a strong curvature signal in the fully convex part of the neck (Figure 7a); however, the neck width can gradually extend to the order of (Figure 7b), such that was assumed to be equal to the initial thickness. From Equation (7), and increases with reduced fitting windows; thus, the calculation of neck depth will be more conservative for using the calculated curvature from Section 4.1. is calculated in the same way as , but using , which acts to account for any conditions with initial bending or a small constant drift in . Substituting Equation (7) into Equation (6) with , the imperfection factor is
Applying Equation (6) to the plane strain example in Figure 7 and Figure 8 for the curvature thresholds of 0.0005 mm−1, 0.001 mm−1, and 0.005 mm−1, the corresponding values were calculated to be 0.9993, 0.9987, and 0.9933, for major limit strains of 0.168, 0.169, and 0.188. It is interesting to note that the curvature imperfection factor, , is of the same form as the initial thickness imperfection factor used in MK forming limit predictions [10]. Importantly, the reported imperfection in the current work is the result of the onset of necking as opposed to initial thickness surface imperfections, as in the case of the MK imperfection factor. In this way, the curvature imperfection factor, , acts as a tolerance for necking detection, as opposed to characterizing an initial defect that triggers necking.
4.4. Determination of Limit Strains Using ISO and Time-Dependent Methods
To obtain a basis of comparison between the limit strain values detected using the proposed ECM method and existing methods, two commonly used schemes were considered: (i) the ISO12004-2:2008 [13] method and (ii) the time-dependent method of Volk and Hora [19]. Relevant details on the implementation of the methods and commonalities with the ECM are discussed.
4.4.1. ISO12004-2:2008 Implementation
The ISO12004-2:2008 standard [13] for limit strain assessment performs a parabolic reconstruction of the first and third principal strain distributions from the DIC strain data one image prior to visible cracking. The methodology is based upon the work of Bragard et al. [52] for determining the limit strains using circle grid analysis. It is assumed that the major and thinning strain distributions across the neck are parabolic. The minor limit strain, , is obtained through assumed volume conservation. The fitting window for the selection of points to construct the parabolas is related to the cumulative strain path, , at the fracture location which assumes a linear strain path. The empirical ISO method was designed for approximately in-plane stretching and is not amenable to stretch–bend testing without modification [53]; thus, the ISO method is only considered for the Marciniak and Nakazima formability tests.
The ISO approach was implemented in Matlab® using the data from each of the five-line slices. The average of the five limit strain pairs is reported as the limit strains for that test. Figure 10 shows an example of the ISO methodology for a 127.0 mm width DB specimen tested using a Marciniak punch. The dynamic strain aging and PLC effects can influence the limit strains identified by the parabolic fitting process.
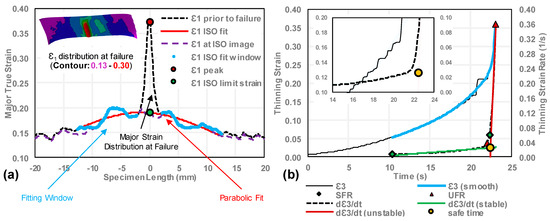
Figure 10.
Examples of (a) the ISO12004-2:2008 limit strain criterion and (b) the LBF approach of Volk and Hora [19] for an AA5182-O 127.0 mm width Marciniak dog-bone specimen, as implemented within this research.
4.4.2. Limit Strain Detection Based upon the Local Strain-Rate
The LBF method of Volk and Hora [19] was selected to provide a contrast with the ISO12004-2 method and the ECM. The LBF method monitors the thinning strain-rate at the fracture location where its acceleration is taken as the onset of acute localization. A bi-linear fit of the thinning strain-rate history is performed to identify a stable and unstable range of deformation. Stable refers to conditions prior to necking, while unstable refers to the post-necking response. The intersection of the two lines is taken as the time (DIC image) when the limit strain is reached. The implementation of the LBF method adopted in this work is detailed below.
In the current implementation, the thinning strain rate is computed by first fitting a constrained spline to the thinning strain vs. time at the failure location. As with the ECM, the first 0.05 thinning strain of the test is omitted in the analysis to avoid spurious effects induced by initial bending in the Nakazima and stretch–bend tests. Constraints on the spline consistent with the strain history associated with localization require the first and second time-derivatives to be positive, which serves to fit through the PLC-affected strain-time series data. It is then straightforward to obtain the time-derivative for the thinning strain-rate. The stable strain-rate fitting range (SFR) is established based on the median strain-rate of the test, bounded by twice the median absolute deviation, as shown in Figure 10b. The unstable strain-rate fitting range (UFR) is taken from the points beyond the SFR. Once the ranges are established, linear regression is performed to establish the stable and unstable line fits, after which the intersection of the lines is found. The DIC image corresponding most closely to, but not exceeding, the intersection time is identified as the safe image, from which the principal strains are taken as the limit strains for the test.
5. Results and Discussion
In this section, results from Marciniak, Nakazima, and stretch–bend tests are discussed. First, an analysis of the Nakazima and Marciniak strain paths is performed in Section 5.1. In Section 5.2, the effect of the imperfection factor is examined and used to select an appropriate curvature threshold for the limit strain. Section 5.3 presents formability results for comparisons between the ISO, LBF, and ECM limit detection sections under Marciniak and Nakazima testing conditions. Finally, performance of the LBF and ECM are evaluated in Section 5.4 under tight-radius stretch bend conditions.
5.1. Marciniak and Nakazima Strain Paths
The strain paths for all Nakazima and Marciniak tests are presented in Figure 11 with generally good repeatability for all sample widths.
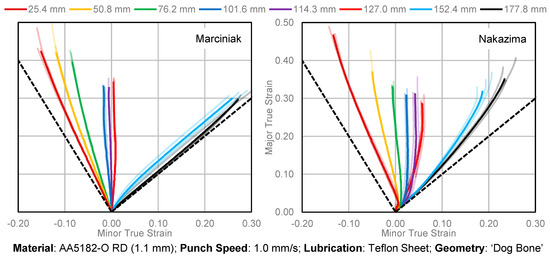
Figure 11.
The individual tested Marciniak and Nakazima strain paths are plotted with transparency, while an average strain path for each geometry is plotted as a solid color. Sample widths increase from left (uniaxial) to right (biaxial) for both the Marciniak and Nakazima plots.
In the Nakazima tests, necks tended to form on either side of the sample apex, leading to asymmetric strain distributions. Multiple necks were seldom observed in the Marciniak tests which exhibited a single centrally located neck. As expected, the Marciniak tests provided nearly linear strain paths since deformation is frictionless and approximately in-plane. The Nakazima tests have nonlinear strain paths due to out-of-plane deformation with bending, friction, and tool contact pressure effects that produce through-thickness stress and strain gradients. The initial strain path is biaxial due to biaxial bending over the hemispherical punch followed by a transition to the target strain path based upon the sample width as stretching becomes dominant.
5.2. On the Relationship between Curvature and the Imperfection Factor
To identify an appropriate curvature threshold for the ECM, the FLC0 geometries used in the Marciniak and Nakazima testing (101.6 mm to 127.0 mm) as listed in Table 1 are evaluated. Over this specimen range, all strain paths were close to the plane strain condition as seen in Figure 11. The average limit strains and corresponding imperfection factors, , for these three near-plane strain sample widths, are plotted in Figure 12 as a function of the adopted curvature threshold level. All data points are plotted with a 95% confidence interval for n = 9, i.e., three repeated tests and three geometries. For the Marciniak condition, the FLC0 ranged from 0.173 to 0.198 with values ranging from 0.9993 to 0.9933. The same trend was observed in the Nakazima plane strain condition, with the major limit strains shifted higher by about 0.02 strain, which is partially attributed to initial bending over the punch.
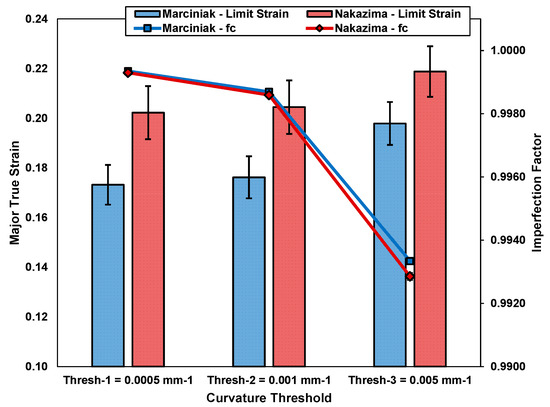
Figure 12.
Curvature limit strains and corresponding imperfection factors under plane strain loading (101.6 mm to 127.0 mm dog-bone widths) for Marciniak and Nakazima punches for different curvature thresholds. Note that the scatter in the ECM limit strains (95% confidence interval) is relatively consistent across all thresholds.
The evolution of the necking imperfection with major strain is examined in Figure 13a,b for the Marciniak and Nakazima plane strain tests. Data from a total of nine tests are shown for each punch geometry. Included in the figures are the average curve, along with a 95% confidence band (shaded region) that is indicated by the grey shaded region. In addition, the response for three tests were shown to highlight the variation. Note that the discrete curves exhibit oscillation and sudden step changes in the values as a function of true strain that are attributed to PLC effects. These irregularities and the statistical variation in the limit strain values between test samples make it challenging to select a representative of solely based the data in Figure 13a,b.
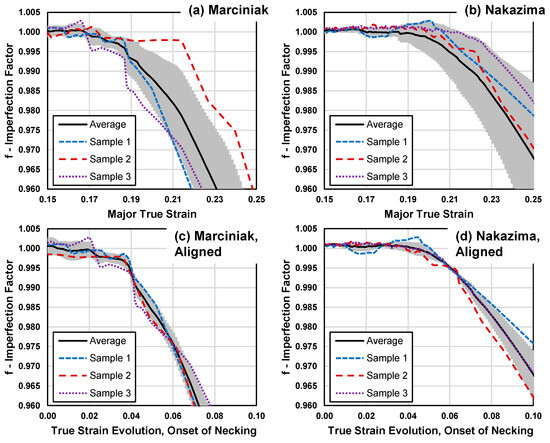
Figure 13.
Plot of imperfection factor as a function of applied strain. Results from three (of nine) repeat tests are plotted for each case, along with the average response (black curve) and 99% confidence intervals (shaded) for (a) AA5182-O tested with a Marciniak punch for plane strain samples (101.6 mm–127.0 mm), (b) AA5182-O tested with a Nakazima punch for plane strain samples (101.6 mm–127.0 mm). In (c,d), the individual and mean curves have been corrected to account for variability at the onset of necking by shifting all curves in the strain domain such that the individual curves overlap with the mean curves at strains corresponding to , the 0.005 mm−1 curvature threshold. The resulting curves are plotted (zeroed) as onset of necking strains.
To account for variance in onset of acute necking, a correction was applied to the individual curves in which the curves were shifted by the difference between the mean true strain and the individual true strains at , i.e., the average value in Marciniak testing for the 0.005 mm−1 curvature threshold. The shifted curves are plotted in Figure 13c,d, with the horizontal axis strains arbitrarily zeroed at 0.15 relative to Figure 13a,b to highlight the strain evolution in the vicinity of acute necking. The 95% confidence bands of the mean corrected curves of Figure 13c,d collapse, and the individual corrected curves closely approximate the averages, although some deviation is still present for AA5182-O for both punches. The convergence of the response for both Marciniak and Nakazima tests following this correction for the strain at which necking onset occurs is quite remarkable. This behavior suggests that the variability in the onset of necking is real, and, if accounted for, the geometric evolution of the necking region once necking initiates is quite comparable between tests. Of course, even when accounting for test-to-test variability, PLC effects add an additional layer of complexity to the analysis for this material. A similar analysis on an AA6013-T6 alloy [27] that does not have PLC effects was found to better highlight the trends in necking evolution compared to the AA5182-O in the present study.
With the ECM, the analyst can select a curvature threshold and corresponding imperfection factor depending upon the margin of safety desired to produce conservative limit strains. For the 1.1 mm thick AA5182-O, a curvature threshold of 0.005 mm−1, which corresponds to , produces an FLC0 in Marciniak and Nakazima tests of 0.198 and 0.214, respectively. The previously calculated theoretical upper bound for the FLC0 is 0.194. Additionally, the AA5182-O FLC0 from the survey of the literature given in Appendix A is 0.193 (0.039). Thus, the curvature threshold of 0.005 mm−1 was adopted for the remainder of the study, with the more conservative limit strains reported for the lower curvature threshold.
5.3. Determination of Forming Limit Curves
5.3.1. Formability Characterization for In-Plane Stretching Using Marciniak Tests
The limit strains identified from the Marciniak tests using the ISO, LBF, and ECM (with a threshold of 0.005 mm−1) are shown in Figure 14a alongside the average strain paths for each blank geometry. Average limit strain pairs for each specimen geometry and analysis scheme are plotted in Figure 14b. The curves drawn through the limit strain pairs in Figure 14b correspond to the forming limit curves. The corresponding numerical values of the strain pairs and 95% confidence intervals are summarized in Table 2. Under plane strain loading with sample widths from 101.6 to 127 mm, the variations in limit strains are all within 0.02, with ECM, ISO, and LBF values of 0.198, 0.188, and 0.208, respectively. The average values for the FLC0 using each methodology and the respective variations of about 0.01 are roughly in accordance with the literature survey for AA5182; however, the 0.208 value of the LBF exceeds the theoretical upper bound of 0.194 by more than the reported error bands.
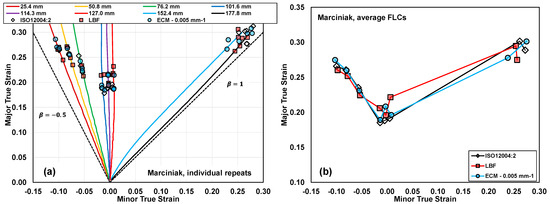
Figure 14.
(a) Individual limit strain points for each average strain path under Marciniak testing, as computed using the ISO12004-2:2008 standard [13], the LBF method of Volk and Hora [19], and the upper threshold of the ECM. In (b), average FLCs are plotted as a function of each necking detection scheme.
Table 2.
Average limit strains from Marciniak testing as a function of specimen width determined with the ISO12004-2 standard [13], the LBF method, and the Enhanced Curvature Method. 95% confidence intervals are included in brackets to represent the error in each measurement.
For uniaxial stretching conditions, the ISO and ECM approach resulted in nearly identical limit strains, while the LBF method, in contrast to plane-strain loading, was more conservative by approximately 0.01 true strain over the geometries ranging from 25.4 mm to 76.2 mm in width—indicating an expected slope difference on the draw-side of the LBF FLC compared to the ISO and ECM FLCs. Under biaxial stretching conditions, all methods showed good agreement in the limit strains with the ISO method being the least conservative. The ECM limit strains were intermediate to those of the ISO and LBF values. The LBF approach was challenging to apply to the biaxial Marciniak geometries for which the extent of necking was relatively limited prior to onset of fracture.
In Figure 15, the difference between the three limit strain detection schemes is computed relative to the ISO standard for the von Mises effective strains as a function of , where and are the average minor and major strain limits for each tested geometry. There is some variation in the limit strain predictions between the three methods, with the largest differences seen for plane strain loading, particularly for the LBF method which has a limit strain that is 15% higher than that detected using the ISO method. The ECM method is also 10% higher than the ISO method for the 114.3 mm near-plane strain geometry, but both other plane strain geometries more closely followed the ISO limit strains.
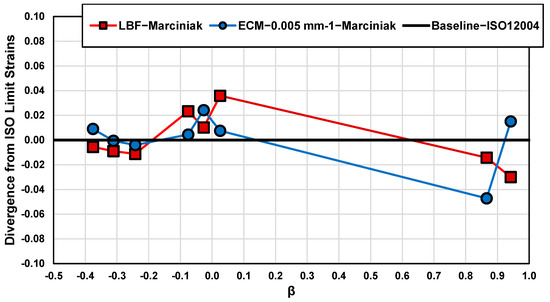
Figure 15.
Difference in von Mises equivalent limit strains between the LBF and ECM methods relative to the ISO12004-2 baseline as a function of strain path for Marciniak tested samples. Here, the strain path is characterized by , where and are the average minor and major ISO strain limits.
The values when the limit strains were reached for the curvature threshold of 0.005 mm−1 were in the range of 0.9933–0.9935. The imperfection factor evolves based upon thinning which is largest under biaxial loading and decreases the for a given ECM threshold. This gives rise to the physical interpretation that the same-sized imperfection will represent a larger neck for thinner parts or components experiencing a higher degree of thinning. One exception to this trend was for the 177.8 mm biaxial test using the upper bound curvature threshold which was not reached prior to fracture; as a result, the reported limit strain corresponds to the last recorded DIC fracture strain for this case. The lower bound curvature threshold showed the expected trend of a decreasing in biaxial stretching. Although a constant curvature threshold is considered in this work, it is possible that an analyst could select more or less aggressive thresholds for onset of necking for draw-side or stretch-side applications, as well as in-plane vs. out-of-plane loading; however, such approaches would require further study.
The variance in the reported limit strains with each methodology is also an important metric to consider for identifying the FLC for design and comparing between different test labs. The LBF and ECM had similar but higher variation than the ISO method, which is expected since they are local methods. The ISO method, with its parabolic fitting of the strain distribution, effectively imparts spatial smoothing of the data, which improves consistency but can also be conservative and non-physical. The ISO method will tend toward predicting a limit strain due to the parabolic construction even in a bending mode when necking does not occur. In this sense, the ISO method is expected to be conservative compared to local methods such as ECM and LBF. The tendency of the ISO method to understate the variance in formability may provide a misleading impression of the true formability of the material and negatively influence process design.
5.3.2. Formability Characterization Using Nakazima Tests
The Nakazima limit strains obtained using each limit strain detection technique are shown in Figure 16a, with corresponding average strain paths. The corresponding average limit strains for each specimen geometry and detection method and forming limit curves are plotted in Figure 16b, while the numeric values are summarized in Table 3, along with 95% confidence intervals. In the geometries ranging from 101.6 mm to 127.0 mm, the average major limit strains are 0.219, 0.204, and 0.222 for the ECM, ISO, and LBF methods, respectively. Thus, the same ordering in-plane strain formability under Marciniak testing is preserved in the Nakazima testing; however, the differences in LBF and ECM here are within the 95% error bands of the measurements. The ECM imperfection factors are similar to the Marciniak tests for these geometries with for Marciniak and for Nakazima, on average.
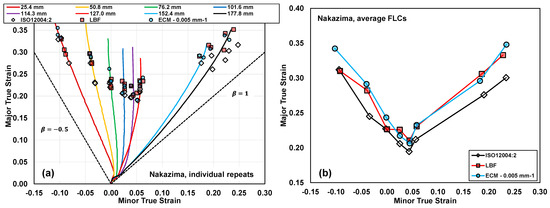
Figure 16.
(a) Individual limit strain points for each average strain path under Nakazima testing, as calculated using the ISO12004-2:2008 standard [13], the LBF method of Volk and Hora [19], and the upper threshold of the Enhanced Curvature Method. In (b), average FLCs are plotted as a function of each necking detection method.
Table 3.
Average limit strains from Nakazima testing as a function of specimen width determined with the ISO12004-2 standard [13], the LBF method, and the Enhanced Curvature Method. 95% confidence intervals are included in brackets to represent the error in each measurement.
Under conditions of uniaxial and biaxial loading, the chosen ECM upper bound (0.005 mm−1) is observed to predict the highest levels of formability of the three metrics, contrary to the trend in-plane strain loading for which the LBF methodology was the least conservative in formability estimates. In uniaxial loading (50.8 mm geometry), major average limit strains of 0.29, 0.28, and 0.25 were observed for the ECM (upper), LBF, and ISO methods, respectively. In biaxial loading, major average limit strains of 0.35, 0.33, and 0.30 were observed for the ECM, LBF, and ISO methods, respectively. The ECM lower bound predicts values in line with the LBF method in uniaxial tension but is markedly lower in biaxial tension.
For uniaxial tension geometries, the curvature was calculated parallel to the length of the specimen in accordance with ISO12004-2. However, the necks develop at an angle to the reduced section, as shown in Figure 5. Consequently, the curvature signal is weaker since it is not perpendicular to the neck, and the limit strains may be inflated when the curvature threshold is reached. The sensitivity of the ECM to line slice orientation was evaluated for various uniaxial geometries by extracting line slices perpendicular to the neck. Only the 25.4 mm wide samples showed sensitivity to line slice orientation, with major limit strains decreasing from 0.33 to 0.31 and 0.35 to 0.34 for the lowest and highest curvature thresholds, respectively. Thus, for the 25.4 mm uniaxial geometry, the perpendicular line slice orientation was adopted for limit strain computation. Both measurements are included in Table 3, but only the measurements from line slices oriented perpendicular to the neck are plotted in Figure 16 and Figure 17. Note that this issue is limited to the uniaxial geometries using the ECM and did not apply to biaxial stretching where the line slices are defined perpendicular to the neck consistent with ISO12004-2.
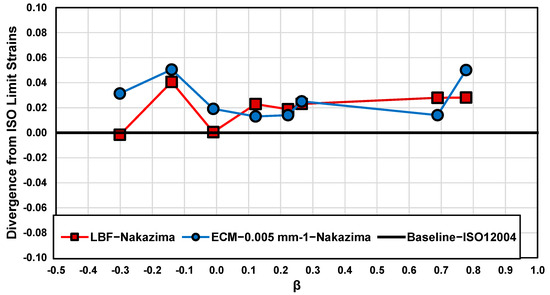
Figure 17.
Differences in von Mises equivalent limit strains between the LBF and ECM methods relative to the ISO12004-2 baseline as a function of strain path for Nakazima tested samples. Here, the strain path is characterized by , where and are the average minor and major strain limits for each geometry plotted in Figure 16, as determined using the ISO12004-2:2008 standard [13].
In biaxial loading, the ECM upper bound shows the highest limit strains of the three detection schemes. The values decrease from 0.9929 for the 114.3 mm width geometry to 0.9902–0.9902 for the biaxial geometries. A similar but muted trend was observed in Marciniak testing, where lower measurements in biaxial loading were attributed to a higher level of thinning.
On average, the LBF and ECM (upper) limit strain detection schemes predict von Mises equivalent limit strains that are 6.3% and 8.5% higher than the ISO method, respectively, as seen in Figure 17. On average, the three limit strain detection schemes were within 2% of one another for the Marcinak tests. However, there were significant differences between the detection schemes for some of the Nakazima sample widths. It is possible that the local approaches were less influenced by the occurrence of multiple necks when compared to the ISO standard. Figure 18 highlights typical Nakazima and Marciniak strain distributions at failure with the ISO fitting approach applied for geometry widths of 50.8 mm, 127.0 mm, and 177.8 mm. Single necks or a prominent primary neck with a mild secondary neck are evident for the Marciniak tests in Figure 18d–f with corresponding ISO parabolic fits. In Nakazima testing, the significant double necks shown in Figure 18a–c can skew the parabolic fitting process of the ISO method, which is noted as problematic within the ISO12004-2 standard [13] and can lead to the minor limit strain not laying upon the measured local strain path, as shown in Figure 16. Consequently, the double necking in the Nakazima tests serves to produce conservative limit strains. By contrast, the local LBF and ECM do not rely on the global strain distribution for their applications.
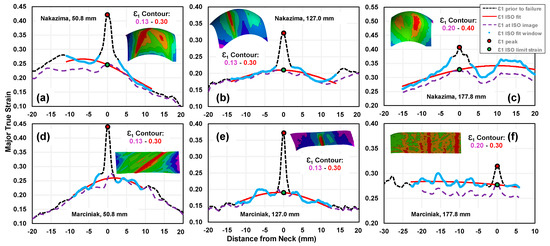
Figure 18.
Application of the ISO12004-2:2008 standard [13] to sample true strain profiles obtained from Nakazima, (a–c), and Marciniak (d-f) testing for sample widths of 50.8 mm (uniaxial), (a,d), 127.0 mm (plane strain), (b,e), and 177.8 mm (biaxial), (c,f). In all Nakazima samples, double necking occurs which skews the ISO12004-2 fitting process towards lower limiting strain values, while in Marciniak testing, only single, central necks were observed.
5.4. Application to Angular Stretch Bending with Through-Thickness Strain Gradients
The LBF and ECM limit strain detection schemes are applied to the analysis of a 76.2 mm dog-bone specimen subjected to stretch–bending (SB) with 15 mm and 2 mm radius cylindrical punches. Representative strain paths from each punch are included in Figure 19a, as well as reference strain paths for 127.0 mm width geometries from Nakazima and Marciniak testing. The intention here is to (i) quantify plane strain formability under severe through-thickness strain gradients and (ii) to evaluate the relative performance of each methodology. From Figure 19a, it is evident that the 2 mm stretch–bend punch produces a strain path that is very close to plane strain and aligns rather closely to the in-plane Marciniak plane strain path. Conversely, the 15 mm punch shows a strain path slightly shifted towards uniaxial stretching.
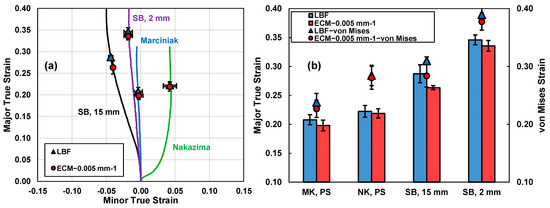
Figure 19.
(a) Average strain paths obtained from stretch–bend, Nakazima, and Marciniak (plane strain) testing with corresponding limit strains using the LBF and ECM approaches. (b) Corresponding limit strains (major and von Mises equivalent true strains) plotted in order of tooling bend severity from lowest to highest.
The average strain paths and limit strains in the SB tests are shown in Figure 19 along with the Marciniak and Nakazima plane strain tests. The limit strains increase as the tooling radius is decreased due to increased bending strain and tooling contact pressure, as discussed by Min et al. [29] and further explored by Noder and Butcher [54]. For both stretch–bend conditions, the LBF methodology results in slightly higher average limit strains than the ECM but is not statistically significant since the 95% confidence intervals overlap, as shown in Figure 19 for the both the major and von Mises effective limit strains.
6. Summary and Conclusions
The curvature-based methodology for limit strain detection, introduced by DiCecco et al. [22], was extended to account for a range of practical forming conditions. The developed Enhanced Curvature Method is physically based since it detects necking based on the onset of local necking curvature. For AA5182-O, a curvature threshold of 0.005 mm−1 was selected with an associated imperfection factor proposed to quantify the curvature thresholds based upon depth of the neck. The ECM was applied to quantify the formability of AA5182-O for uniaxial-to-biaxial strain paths under in-plane (Marciniak) and mild bending (Nakazima) testing conditions, as well as for formability conditions with severe through-thickness strain gradients, produced with tight-radius stretch–bend tooling.
The physically based ECM was benchmarked against the industry standard ISO12004-2:2008 [13], as well as the physically based local strain-rate approach of Volk and Hora [19]. It is encouraging to note the generally good agreement between these widely differing methodologies for the current Al-Mg alloy, particularly given the challenges introduced by the presence of PLC bands within AA5182-O. The ECM methodology presented in this paper is applicable to a wide range of metallic sheet alloys and forming conditions, and future work should address the accuracy and variability in measured FLCs in non-PLC alloys. Future work will also address the determination of curvature (necking) thresholds and application to elevated temperature forming.
The primary conclusions of the study are:
- The measured FLC0 strains for AA5182-O, using the Marciniak tooling, were 0.198, 0.188, and 0.208 for the ECM, ISO, and LBF approaches, respectively. These values were in good accord with previously published experimental data (0.193) and the theoretically predicted upper bound FLC0 (0.194).
- The Nakazima-tested samples often exhibited double necks which affected the ISO limit strains determined from parabolic fitting of the strain distribution. PLC effects on the final spatial strain distributions further degraded the ISO parabolic fitting. The local ECM and LBF were in good agreement. Similar agreement between the ECM and LBF methods was observed for the stretch–bend experiments for which the ISO approach is not applicable.
- Imperfection factor plots under plane strain conditions with Marciniak and Nakazima punches reveal that variance in formability measurements can be partially attributed to (a) PLC effects in AA5182-O and (b) test-to-test variability in the strain at which the onset of necking begins. Thus, for all necking detection schemes, there is a stochastic component to necking attributable to material and testing variability.
- In uniaxial tension, the 25.4 mm width geometry in combination with the Nakazima punch was found to be sensitive to the orientation of line slices, and a line slice orientation perpendicular to the neck width produced marginally lower ECM limit strains. Future ECM applications should consider the effect of neck/fracture orientation.
Author Contributions
Conceptualization, S.D., Z.D., M.W. and C.B.; formal analysis, S.D. and K.C.; funding acquisition, Z.D. and M.W.; investigation, S.D., K.C., F.K. and C.B.; methodology, S.D., K.C., F.K., M.W. and C.B.; project administration, M.W.; supervision, M.W. and C.B.; validation, C.B.; writing—original draft preparation, S.D.; writing—review and editing, K.C., Z.D., M.W. and C.B. All authors have read and agreed to the published version of the manuscript.
Funding
Funding for this research was provided by the Natural Sciences and Engineering Research Council of Canada (NSERC), (CRDPJ 532119-18), the Ontario Centres of Excellence (OCE #28486), the Canada Foundation for Innovation (36486), the Ontario Research Fund (36486), the Canada Research Chairs Secretariat (950-220425), and the Ontario Advanced Manufacturing Consortium (Transfer Payment, no reference number).
Data Availability Statement
The data presented in this study are available on request from the corresponding author. The data are not publicly available due to release approval by project sponsors.
Conflicts of Interest
Author Zhi Deng was employed by the company Commonwealth Rolled Products. The authors declare that this study received funding from Commonwealth Rolled Products. The funder was involved in the following aspects: study design, interpretation of data, writing and editing of the manuscript.
Appendix A
In order to facilitate a comparison between the current work and previously published data [30,38,39,40,41,42,43,44,45,46,47] on the formability of AA-5182-O, a non-exhaustive summary of measured plane strain forming limit strains is plotted in Figure A1 over binned intervals and with an included normal distribution. All recorded strains were reported as the lowest major strains when FLDs were presented or were mentioned in text as the plane strain limits in the absence of FLDs. The average experimental limit of AA5182-O is 0.193; however, the normal distribution is relatively wide. Some variance is to be expected based on different testing variables; however, in some cited publications, details on testing and analysis were vague or omitted, such as the type of punch used in formability testing. When the punch was reported, it was frequently a hemispherical type punch, which is known to produce nonlinear strain paths and other phenomena that can influence the plane strain limit [30], which can be problematic for predictive techniques calibrated from limit strains in the open literature unless adequate corrections are first made.
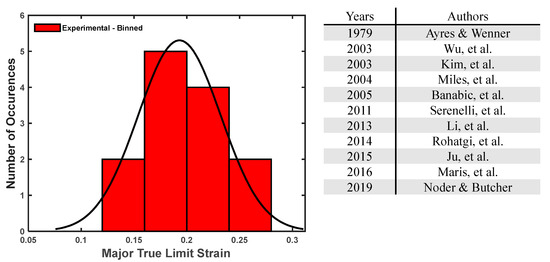
Figure A1.
A summary of plane strain limit strains, or otherwise reported minimum FLD strains, of sheet aluminum alloy AA5182-O [30,38,39,40,41,42,43,44,45,46,47] as reported in the literature.
References
- Mallet, F.M. The Design of Sheet for production metal aircraft parts. SAE J. 1944, 52, 526–533. [Google Scholar]
- Swift, H.W. Plastic Instability Under Plane Stress. J. Mech. Phys. Solids 1952, 1, 1–18. [Google Scholar] [CrossRef]
- Considere, M. L’emploi du Fer et Lacier Dans Les Constructio. Ann. Ponts Chausses 1885, 9, 574–775. [Google Scholar]
- Keeler, S.P. Determination of Forming Limits in Automotive Stampings. SAE Trans. 1966, 74, 1–9. [Google Scholar]
- Goodwin, G. Application of Strain Analysis to Sheet Metal Forming in the Press Shop. In Automotive Engineering Congress and Exposition; SAE International: Warrendale, PA, USA, 1968. [Google Scholar]
- Painter, M.; Pearce, R. Instability and Fracture in Sheet Metal. J. Phys. D Appl. Phys. 1974, 7, 992–1002. [Google Scholar] [CrossRef]
- Laukonis, J.V.; Ghosh, A.K. Effects of Strain Path Changes on the Formability of Sheet Metals. Metall. Trans. A 1978, 9, 1849–1856. [Google Scholar] [CrossRef]
- Kleemola, H.J.; Kumpulainen, J.O. Factors Influencing the Forming Limit Diagram: Part I—The Experimental Determination of the Forming Limits of Sheet Steel. J. Mech. Work. Technol. 1980, 3, 289–302. [Google Scholar] [CrossRef]
- Grumbach, M.; Sanz, G. Influence de quelques paramètres sur les courbes limites d’emboutissage. Rev. Métallurgie 1972, 69, 273–290. [Google Scholar] [CrossRef]
- Marciniak, Z.; Kuczyński, K. Limit Strains in the Process of Stretch-Forming Sheet Metal. Int. J. Mech. Sci. 1967, 9, 609–612. [Google Scholar] [CrossRef]
- Storen, S.; Rice, J.R. Localized Necking in Thin Sheets. J. Mech. Phys. Solids 1975, 23, 421–441. [Google Scholar] [CrossRef]
- Hutchinson, J.; Neale, K.; Needleman, A. Sheet Necking—I. Validity of Plane Stress Assumptions of the Long-Wavelength Approximation. In Mechanics of Sheet Metal Forming; Springer: Boston, MA, USA, 1978; Volume 1, pp. 111–126. [Google Scholar]
- ISO/DIS 12004-2:2008; Metallic Materials—Sheet and Strip—Determination of Forming Limit Curves—Part 2: Determination of Forming Limit Curves in the Laboratory. International Organization for Standardization: Geneva, Switzerland, 2008.
- Nakazima, K.; Kikuma, T.; Hasuka, K. Study on the Formability of Steel Sheets. Yamata Tech. Rep. 1968, 264, 8517–8530. [Google Scholar]
- Martínez-Donaire, A.; Garcia-Lomas, F.; Vallellano, C. New Approaches to Detect the Onset of Localised Necking in Sheets under Through-Thickness Strain Gradients. Mater. Des. 2014, 57, 135–145. [Google Scholar] [CrossRef]
- Vysochinskiy, D.; Coudert, T.; Hopperstad, O.S.; Lademo, O.-G.; Reyes, A. Experimental Detection of Forming Limit Strains on Samples with Multiple Local Necks. J. Mater. Process. Technol. 2016, 227, 216–226. [Google Scholar] [CrossRef]
- Eberle, B.; Volk, W.; Hora, O. Automatic Approach in the Evaluation of the Experimental FLD with a Full 2d Approach Based on a Time Depending Method. In Proceedings of the Numisheet 2007—Proceedings of the 7th International Conference and Workshop on Numerical Simulation of 3D Sheet Metal Forming Processes, Interlaken, Switzerland, 1–5 September 2008. Part A. [Google Scholar]
- Zhang, R.; Shi, Z.; Shao, Z.; Dean, T.A.; Lin, J. A Novel Spatio-Temporal Method for Determining Necking and Fracture Strains of Sheet Metals. Int. J. Mech. Sci. 2021, 189, 105977. [Google Scholar] [CrossRef]
- Volk, W.; Hora, P. New Algorithm for a Robust User-Indepdent Evaluation of Beginning Instability for the Experimental FLC Determination. Int. J. Mater. Form. 2011, 4, 336–346. [Google Scholar] [CrossRef]
- Hotz, W.; Merklein, M.; Kuppert, A.; Friebe, H.; Klein, M. Time Dependent FLC Determination Comparison of Different Algorithms to Detect the Onset of Unstable Necking before Fracture. Key Eng. Mater. 2013, 549, 397–404. [Google Scholar] [CrossRef]
- Min, J.; Stoughton, T.B.; Carsley, J.E.; Lin, J. An Improved Curvature Method of Detecting the Onset of Localized Necking in Marciniak Tests and Its Extension to Nakazima Tests. Int. J. Mech. Sci. 2017, 123, 238–252. [Google Scholar] [CrossRef]
- DiCecco, S.; Butcher, C.; Worswick, M.; Chu, E.; Boettcher, E.; Shi, C. Application of Time and Position Dependent Localized Necking Criteria to High Strength Aluminum Alloys at Elevated Temperatures. In Proceedings of the Forming Technology Forum, Ohlstadt, Germany, 12–13 September 2016. [Google Scholar]
- DiCecco, S.; Butcher, C.; Worswick, M.; Boettcher, E.; Chu, E.; Shi, C. Determination of Forming Limit Diagrams of AA6013-T6 Aluminum Alloy Sheet Using a Time and Position Dependent Localized Necking Criterion. IOP Conf. Ser. Mater. Sci. Eng. 2016, 159, 012009. [Google Scholar] [CrossRef]
- DiCecco, S.; Di Ciano, M.; Butcher, C.; Worswick, M. Limit Strain Characterization in an Aluminum Die-Quenching Process. In Proceedings of the IDDRG 2018, Waterloo, ON, Canada, 3–7 June 2018. [Google Scholar]
- Zhang, R.; Li, J.; Shi, Z.; Lin, J. Experimental Formability Evaluation for Aluminium Alloy Sheets under Hot Stamping Conditions. Mater. Res. Proc. 2024, 44, 90–99. [Google Scholar]
- Keeler, S.P.; Backofen, W.A. Plastic Instability and Fracture in Sheets Stretched over Rigid Punches. ASM Trans. Q. 1963, 56, 25–48. [Google Scholar]
- DiCecco, S.; Di Ciano, M.; Butcher, C.; Worswick, M. Numerical and Experimental Investigation of the Formability of AA6013-T6. In Proceedings of the IDDRG 2017, Munich, Germany, 2–6 July 2017. [Google Scholar]
- Ghosh, A.K.; Hecker, S.S. Stretching Limits in Sheet Metals: In-Plane versus out-of-Plane Deformation. Metall. Trans. 1974, 5, 2161–2164. [Google Scholar] [CrossRef]
- Min, J.; Stoughton, T.B.; Carsley, J.E.; Lin, J. Compensation for Process-Dependent Effects in the Determination of Localized Necking Limits. Int. J. Mech. Sci. 2016, 117, 115–134. [Google Scholar] [CrossRef]
- Noder, J.; Butcher, C. A Comparative Investigation into the Influence of the Constitutive Model on the Prediction of In-Plane Formability for Nakazima and Marciniak Tests. Int. J. Mech. Sci. 2019, 163, 105138. [Google Scholar] [CrossRef]
- Rahmaan, T.; Abedini, A.; Butcher, C.; Pathak, N.; Worswick, M. Investigation into the Shear Stress, Localization and Fracture Behaviour of DP600 and AA5182-O Sheet Metal Alloys under Elevated Strain Rates. Int. J. Impact Eng. 2017, 108, 303–321. [Google Scholar] [CrossRef]
- Tian, N.; Wang, W.; Feng, Z.; Song, W.; Wang, T.; Zeng, Z.; Zhao, G.; Qin, G. Portevin-Le Chatelier Characterization of Quenched Al-Mg Alloy Sheet with Different Mg Concentrations. Materials 2022, 15, 4965. [Google Scholar] [CrossRef] [PubMed]
- McCormick, P. The Portevin-Le Chatelier Effect in an Al-Mg-Si Alloy. Acta Metall. 1971, 19, 463–471. [Google Scholar] [CrossRef]
- Robinson, J.M.; Shaw, M.P. Microstructural and Mechanical Influences on Dynamic Strain Aging Phenomena. Int. Mater. Rev. 1994, 39, 113–122. [Google Scholar] [CrossRef]
- Wang, K.; Carsley, J.; He, B.; Li, J.; Zhang, L. Measuring Forming Limit Strains with Digital Image Correlation Analysis. J. Mater. Process. Technol. 2014, 214, 1120–1130. [Google Scholar] [CrossRef]
- Reinsch, C. Smoothing by spline functions. Numer. Math. 1967, 10, 177–183. [Google Scholar] [CrossRef]
- Fast-Irvine, C.; Abedini, A.; Noder, J.; Butcher, C. An Experimental Methodology to Characterize the Plasticity of Sheet Metals from Uniaxial to Plane Strain Tension. Exp. Mech. 2021, 61, 1381–1404. [Google Scholar] [CrossRef]
- Ayres, R.A.; Wenner, M.L. Strain and Strain-Rate Hardening Effects in Punch Stretching of 5182-O Aluminum at Elevated Temperatures. Metall. Trans. A 1979, 10, 41–46. [Google Scholar] [CrossRef]
- Wu, P.D.; Jain, M.; Savoie, J.; MacEwen, S.R.; Tugcu, P.; Neale, K.W. Evaluation of Anisotropic Yield Functions for Aluminum Sheets. Int. J. Plast. 2003, 19, 121–138. [Google Scholar] [CrossRef]
- Kim, K.J.; Kim, D.; Choi, S.H.; Chung, K.; Shin, K.S.; Barlat, F.; Oh, K.H.; Youn, J.R. Formability of AA5182/Polypropylene/AA5182 Sandwich Sheets. J. Mater. Process. Technol. 2003, 139, 1–7. [Google Scholar] [CrossRef]
- Miles, M.P.; Nelson, T.W.; Decker, B.J. Formability and Strength of Friction-Stir-Welded Aluminum Sheets. Metall. Mater. Trans. A 2004, 35A, 3461–3468. [Google Scholar] [CrossRef]
- Banabic, D.; Aretz, H.; Paraianu, L.; Jurco, P. Application of Various FLD Modelling Approaches. Model. Simul. Mater. Sci. Eng. 2005, 13, 759–769. [Google Scholar] [CrossRef]
- Serenelli, M.J.; Bertinetti, M.A.; Signorelli, J.W. Study of Limit Strains for FCC and BCC Sheet Metal Using Polycrystal Plasticity. Int. J. Solids Struct. 2011, 48, 1109–1119. [Google Scholar] [CrossRef]
- Li, J.; Carsley, J.E.; Stoughton, T.B.; Hector, L.G.; Hu, J. Forming Limit Analysis for Two-Stage Forming of 5182-O Aluminum Sheet with Intermediate Annealing. Int. J. Plast. 2013, 45, 21–43. [Google Scholar] [CrossRef]
- Rohatgi, A.; Soulami, A.; Stephens, E.V.; Davies, R.W.; Smith, M.T. An Investigation of Enhanced Formability in AA5182-O Al during High-Rate Free-Forming at Room-Temperature: Quantification of Deformation History. J. Mater. Process. Technol. 2014, 214, 722–732. [Google Scholar] [CrossRef]
- Ju, L.; Mao, T.; Li, H. An Experimental and Numerical Study of Forming Limits of AA5182-O. Int. J. Adv. Manuf. Technol. 2015, 79, 221–228. [Google Scholar] [CrossRef]
- Maris, C.; Hassannejadasl, A.; Green, D.E.; Cheng, J.; Golovashchenko, S.F.; Gillard, A.J.; Liang, Y. Comparison of Quasi-Static and Electrohydraulic Free Forming Limits for DP600 and AA5182 Sheets. J. Mater. Process. Technol. 2016, 235, 206–219. [Google Scholar] [CrossRef]
- Reu, P. Virtual Strain Gage Size Study. Exp. Tech. 2015, 39, 1–3. [Google Scholar] [CrossRef]
- D’Errico, J. SLM—Shape Language Modeling. Available online: https://www.mathworks.com/matlabcentral/fileexchange/24443-slm-shape-language-modeling (accessed on 5 October 2019).
- Kreyszig, E. Differential Geometry; Dover Publications: New York, NY, USA, 1991; ISBN 978-0-486-66721-8. [Google Scholar]
- Min, J.; Stoughton, T.B.; Carsley, J.E.; Lin, J. A Method of Detecting the Onset of Localized Necking Based on Surface Geometry Measurements. Exp. Mech. 2017, 57, 521–535. [Google Scholar] [CrossRef]
- Bragard, A.; Baret, J.; Bonnarens, H. A simplified technique to determine FLD at the onset of necking. Rapp. Du Cent. De Rech. Mettallurgiques 1972, 33, 53–63. [Google Scholar]
- Kitting, D.; Ofenheimer, A.; Jain, M.; Rabler, G.; Pauli, H. Experimental Characterisation of Failure of Stretch-Bend Steel Sheets. In Proceedings of the Numisheet 2008, 7th International Conference and Workshop on Numerical Simulation of 3D Sheet Metal Forming Processes, Interlaken, Switzerland, 3–5 September 2008. [Google Scholar]
- Noder, J.; Butcher, C. On the Influence of Tool Contact Stress on Tensile Instabilities in Plane Strain Stretching and Bending of Sheet Metals. Mech. Mater. 2023, 184, 104669. [Google Scholar] [CrossRef]
Disclaimer/Publisher’s Note: The statements, opinions and data contained in all publications are solely those of the individual author(s) and contributor(s) and not of MDPI and/or the editor(s). MDPI and/or the editor(s) disclaim responsibility for any injury to people or property resulting from any ideas, methods, instructions or products referred to in the content. |
© 2024 by the authors. Licensee MDPI, Basel, Switzerland. This article is an open access article distributed under the terms and conditions of the Creative Commons Attribution (CC BY) license (https://creativecommons.org/licenses/by/4.0/).