1. Introduction
Nickel-based alloys, specifically, Ni600 (Inconel 600, UNS N06600) and Ni625 (Inconel 625, UNS N06625), are characterized by their superior corrosion resistance, a property attributed to the presence of chromium, which acts to form a passive layer that resists further oxidation in oxidizing environments [
1]. These alloys are extensively utilized in industries where high corrosion resistance is required, such as the aerospace and nuclear industries. In the nuclear industry, Ni600 and Ni625 are of significant importance since Ni600 exhibits exceptional resistance to corrosion from high-purity water and mitigates corrosion cracking in water reactor systems, and Ni625 is used in control rods or components in the water reactor core due to its high strength, uniform corrosion, good stress-cracking resistance, and superior pitting resistance in water, with temperatures ranging from 260 °C to 316 °C [
1]. The elemental composition of Ni600 and Ni625 confers remarkable resistance to various environmental conditions [
2]. As a consequence, Ni600 is also suitable for equipment used in the processing and production of acids or other chemical reagents in the heat-treating industry, while Ni625 is typically employed in seawater equipment, chemical plants, and the aircraft industry. Ni600 and Ni625 alloys are often chosen for their exceptional properties, which make them suitable for demanding applications. The mechanical properties of these alloys are intrinsically linked to their microstructure, particularly the distribution and characteristics of their carbides. Although carbides can add to the strength of the matrix by inhibiting grain boundary creep at elevated temperatures, they can also serve as dislocation or crack nucleation sites [
3], leading to increased deformation. Therefore, the characterization of different types of carbides through selective etching is of considerable value.
The grain size of an alloy is a fundamental factor influencing its mechanical properties. Alloys with fine grain sizes are typically favored due to their enhanced mechanical properties, as the development of intergranular carbides is intimately linked with the properties of grain boundaries (GBs) and the residual stress fields around them. Smaller grain sizes in materials imply an increased number of GBs, which consequently leads to a corresponding rise in the number of carbides present within these GBs. Therefore, researching the distribution of carbides along GBs is also important.
Chromium segregates at GBs, and concurrently Ni and Fe deplete when chromium-rich carbides, such as M
23C
6 and M
7C
3, precipitate [
4]. Ni600 and Ni625 are austenitic solid-solution alloys, primarily comprising three precipitated phases: titanium nitrides, titanium carbides, and chromium carbides. Despite the varying concentrations of niobium, titanium, aluminum, and other elements in these alloys, the primary types of carbides are largely confined to MC, M
6C, M
7C
3, and M
23C
6 (where M represents the metal elements) [
1,
5,
6]. Ni625 predominantly contains MC, M
6C, and M
23C
6, while Ni600 contains M
7C
3 and M
23C
6 [
7,
8,
9,
10,
11]. Titanium nitrides are readily identifiable, as they are visible when the magnification exceeds 50 times (i.e., micrometer-sized objects can be resolved), and they are observed as particles with orange color under an optical microscope. The chromium carbides are smaller and are expected to contribute to greater strength of the material at elevated temperatures [
12]. It is observed that MC is consistently located within grains, whereas M
6C and M
23C
6 are situated on the GBs. The carbides of MC are inherently stable as a face-centered cubic (fcc) structure and exhibit a blocky shape [
12]. The stability of materials varies with different elements M [
3,
13,
14,
15]. In conjunction with the time–temperature transformation diagram of nickel alloy, the production of carbides varies with different heat-treatment processes. However, since the samples have already undergone heat treatment, it is challenging to differentiate the transformation routes of the phases, and further heat treatment will introduce unforeseen changes. Various carbides are distributed throughout the matrix, each adhering to its own principle and exhibiting distinct shapes. At elevated temperatures, the MC decomposes and transitions to the carbides of M
6C [
12]. Upon a decrease in temperature, it is anticipated to observe the dispersion of chromium-rich carbide M
23C
6 throughout the matrix.
In these alloys, there are grain boundaries that are considered ‘special’, in that they behave differently from a random high-angle grain boundary, typically because they have a low-energy structure and local atomic configuration. With the help of electron backscatter diffraction (EBSD) analysis, the misorientation between grains can be used to identify many of these boundaries and some of them can be described with coincident site lattice (CSL) notation. Specifically, a CSL boundary with the notation ΣN describes a grain boundary where one in N lattice sites are shared between the two crystals and these boundaries can be low-energy [
16]. Notably, the ∑3
n boundaries are related to the FCC annealing twin, where a ∑3 boundary occurs when the lattice changes have ABCBA close-packed {111} planes and the angle and axis of misorientation between is 60° about <111>. These boundaries are associated with less distortion and lower energy, making them more thermodynamically stable compared to higher Σ boundaries [
17]. In many applications, the microstructural control to enhance the proportion of Σ3 boundaries can be a key factor in phase precipitation and improving the performance of nickel-based alloys [
18,
19]. Thus, grain boundary engineering was developed to optimize both the grain boundary network and the distribution of precipitates along grain boundaries [
20]. The history of deformation and heat treatment plays a significant role in the precipitation of carbides at grain boundaries, while the characteristics of grain boundaries can also impact the formation patterns of carbides along these boundaries [
21].
Given the minute size of most significant phases, it is crucial that samples are polished to a fine and shiny surface. However, the flat surface also eliminates the contrast of different phases; thus, etchants are employed to enhance the contrast and reveal these phases. They are particularly effective in highlighting metallic phases, inclusions, and the appearance of grains. The detailed information obtained post-etching enables a more comprehensive understanding of the mechanical properties and features closely related to the quantity, distribution, and behavior of these phases [
22]. The preparation of nickel alloy surfaces was undertaken to enhance the characterization of sample surfaces and to conduct a thorough investigation of their carbides. It is acknowledged that the processing can potentially alter the properties of the sample, such as electrical discharge machining, which can introduce different energy by different settings [
23]. As a result, ensuring consistency in the sample preparation process is of high importance. Certain phases on the sample surface are not visible through direct observation; thus, etching the surface reveals a distinct distribution of carbides that are more susceptible to corrosion. Chemical and electrolytic etching stand as the foremost techniques in etching, extensively utilized in material science and engineering. These methods play a crucial role in various applications, including surface cleaning, transferring patterns, and material thinning. Chemical etching involves combining a base or acid with an oxidizing or reducing agent in a solute, while electrochemical etching merges chemical etching with an electrical current. Chemical methods are more straightforward to implement than electrolytic methods for corrosion-resistant alloys such as Ni600, while electrolytic etching is anticipated to lead to more discernible results [
1]. Key parameters in controlling the extent of etching and the volume of material removed include the concentration of the acid or alkali, the etching duration, the temperature of the target materials, and the agitation methods.
The primary objective of this paper was to characterize the microstructure and carbides of Ni600 and Ni625 nickel alloys using a variety of etchants to unveil diverse structures and precipitates inherent in the materials. A comparative analysis was conducted to evaluate the grain size and carbide distribution between Ni600 and Ni625. Some previous studies have summarized and compared etchants for nickel alloys [
24,
25,
26,
27,
28], but this paper aimed to systematically compare, more intuitively, the effects of several etchants effective on Ni600 and Ni625. Specifically, it focused on the morphologies they produce on the sample surfaces and their distinct impacts on carbides. The findings from this study will serve as a valuable reference for future research focused on specific carbides or other phases. Furthermore, this paper sought to develop an optical method for identifying different carbides and titanium nitrides within nickel alloys.
2. Methodology
Samples from the Ni600 bar and Ni625 plate were securely mounted into 25 mL of Bakelite to ensure stability during the grinding and polishing processes. The mounting procedure involved a heating phase at 180 °C and 250 bar for 3 min, followed by a 2 min cooling phase. The Tegrapol-15 machine (Struers, Ballerup, Denmark) was employed for sample grinding, with SiC grit grinding papers of various sizes. The force was consistently set at 10N, with a co-rotation between the grinding head and grinding paper, both operating at 150 rpm. Grinding pads with standard grit sizes of 500, 800, 1200, and 2000 grit were used, with the duration of polishing dependent on the surface condition. If the surface scratches align in the same direction or show a pattern, grinding pads with a smaller grit grain size can be used. The goal is to achieve a flat surface, free of noticeable scratches after the 2000 grit grinding. Then, an automatic diamond polishing process using Tegrapol-20 (Struers, Ballerup, Denmark) was implemented to enhance the surface quality. Extending the polishing duration and employing the DP-suspension with a smaller diamond grain size in conjunction with a compatible polishing cloth, MD-Dur (Struers, Ballerup, Denmark) and MD-Nap (Struers, Ballerup, Denmark), is advisable. Subsequently, the samples underwent a colloidal silica polishing process in neutralized (pH = 7) colloidal silica (OPS) under a pressure of 15 N for a duration of 45 min. These processes involved a counter-rotation at 150 rpm using Tegrapol-20, as listed in
Table 1. The OPS solution comprised a ratio of OPS, H
2O
2, and H
2O at 7:3:10. Following this, the samples were further polished using water and a minimal quantity of soap at 10 N and 150 rpm on the polishing cloth of MD-CHEM (Struers, Ballerup, Denmark). After each etching session, the samples were repolished using the final two colloidal silica polish steps to restore the flat surface.
A literature survey was used to identify reliable etchants, and etching methods utilized on nickel alloys and summarized from various works [
24,
25,
26,
27,
28] are shown in
Table 2, encompassing both chemical and electrolytic etching methods. The etching time was incrementally increased for each etchant from a brief duration to establish a time step. This enabled the identification of an optimal etching time between under-etched and over-etched conditions. When certain alloys demonstrate exceptional corrosion resistance, alternative composition ratios can be explored to achieve the original objectives if the commonly used ratio proves ineffective [
15,
22].
Before etching, it is essential to inspect the polished surface for scratches. However, etching can unintentionally make previously unnoticed scratches stand out. This happens because the etching solution interacts more with the scratches, removing material around them more extensively and making them more prominent. Also, the etchants that have filled in the scratches are more difficult to clean after etching, which makes the etch marks more visible. As the frequency of etching and repolishing increases, the number of scratches diminishes, resulting in an improved surface. The polishing procedure should be flexibly adjusted to accommodate these changes [
26]. In this study, an electrolytic etching solution was prepared, and the samples were affixed to the anode. The cathode was coated with a conductive metal, and the insulation was painted to the metals to restrict the diffusion of current and shield a portion of the surface from the etchant. This allowed for a comparison with the etched area in subsequent optical figures and facilitated the comparison of different etching time steps. The cathode was maintained in the solution, and the DC power supply was activated. The positive electrode was then immersed in the etchant for a predetermined duration to accomplish the purpose of electrolytic etching.
For electrolytic etching, the etching time, temperature, and current density can be adjusted in stages to attain the most suitable etching method and optimal performance, leading to an enhanced grain boundary and microstructure. Chemical methods for etching nickel-based alloys can lead to a superior microstructure surface and provide more detailed information due to the superior corrosion resistance and mechanical properties of nickel-based alloys.
After the etching process, an optical microscopy examination was performed using an Olympus BX53M (Olympus, Tokyo, Japan), and images were analyzed using ‘Image J v1.53k’. Surface characterization was also conducted through scanning electron microscopy (SEM), electron backscatter diffraction, and energy-dispersive X-ray diffraction (EDX) using a JOEL JSM6010LA InTouchScope (JOEL, Tokyo, Japan). Additionally, hardness testing was executed using Indentec hardness testing machines (Indentec Hardness Testing Machines Ltd., Brierley Hill, UK) and the corresponding software ‘Indentec C.A.M.S. Testing system by Newage’. This suite of equipment facilitated the surface characterization and hardness testing of the samples for further research.
3. Results and Discussion
The diamond polishing process and sample preparation procedure play an important role in the analysis of the optical micrograph after the preparation method. The proportion of precipitates that can be found on the sample surface escalates from 0.0386% to 0.3053%, indicating a more detailed exposure of carbides. Moreover, this process significantly mitigates the scratches induced by coarse polishing, which become particularly conspicuous post-etching. Furthermore, the contrast in the optical microscope reveals clear differences in grain orientation attributable to the sample preparation method, specifically the diamond polish and aggressive OPS polish.
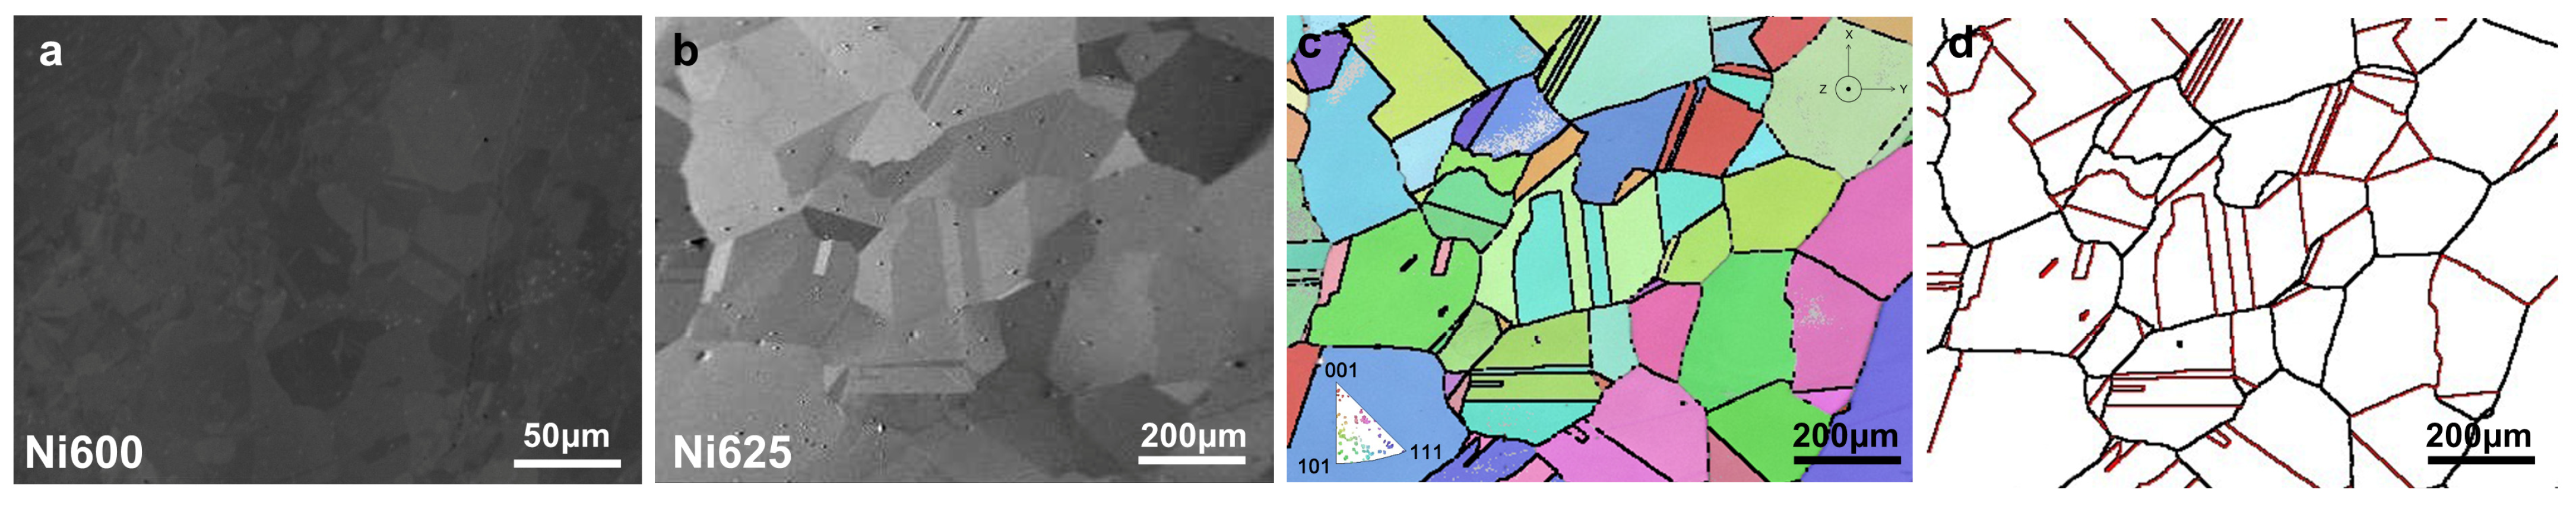
Given the close relationship between grain size and carbon distribution, it is beneficial to have a general understanding of the rough grain size.
Figure 1 illustrates the SEM and EBSD mapping, showing the grain sizes of Ni625 and Ni600. Ni600 exhibited a grain size of 14.3 μm, while Ni625 displayed a grain size of 93 μm directly and 198 μm with CSL taken into account. The grain size of Ni625 is larger than that of Ni600, which could fundamentally account for its lower hardness. Hardness tests were conducted at three points under a load of 1kg for 10 s, concurrently with the placement of point markers on the surface. The comparative hardness of the nickel-based alloys Ni600 and Ni625 was tested, and a mean hardness value of 1530 ± 85.3 MPa for Ni600 and that of 1219 ± 31.5 MPa for Ni625 were achieved.
When considering the CSL boundaries, the grain size approximately doubles. The percentages of ∑ phases of Ni625 with the highest frequency are tabulated in
Table 3, and the ∑3 phase constitutes a significant percentage among all the CSL boundaries.
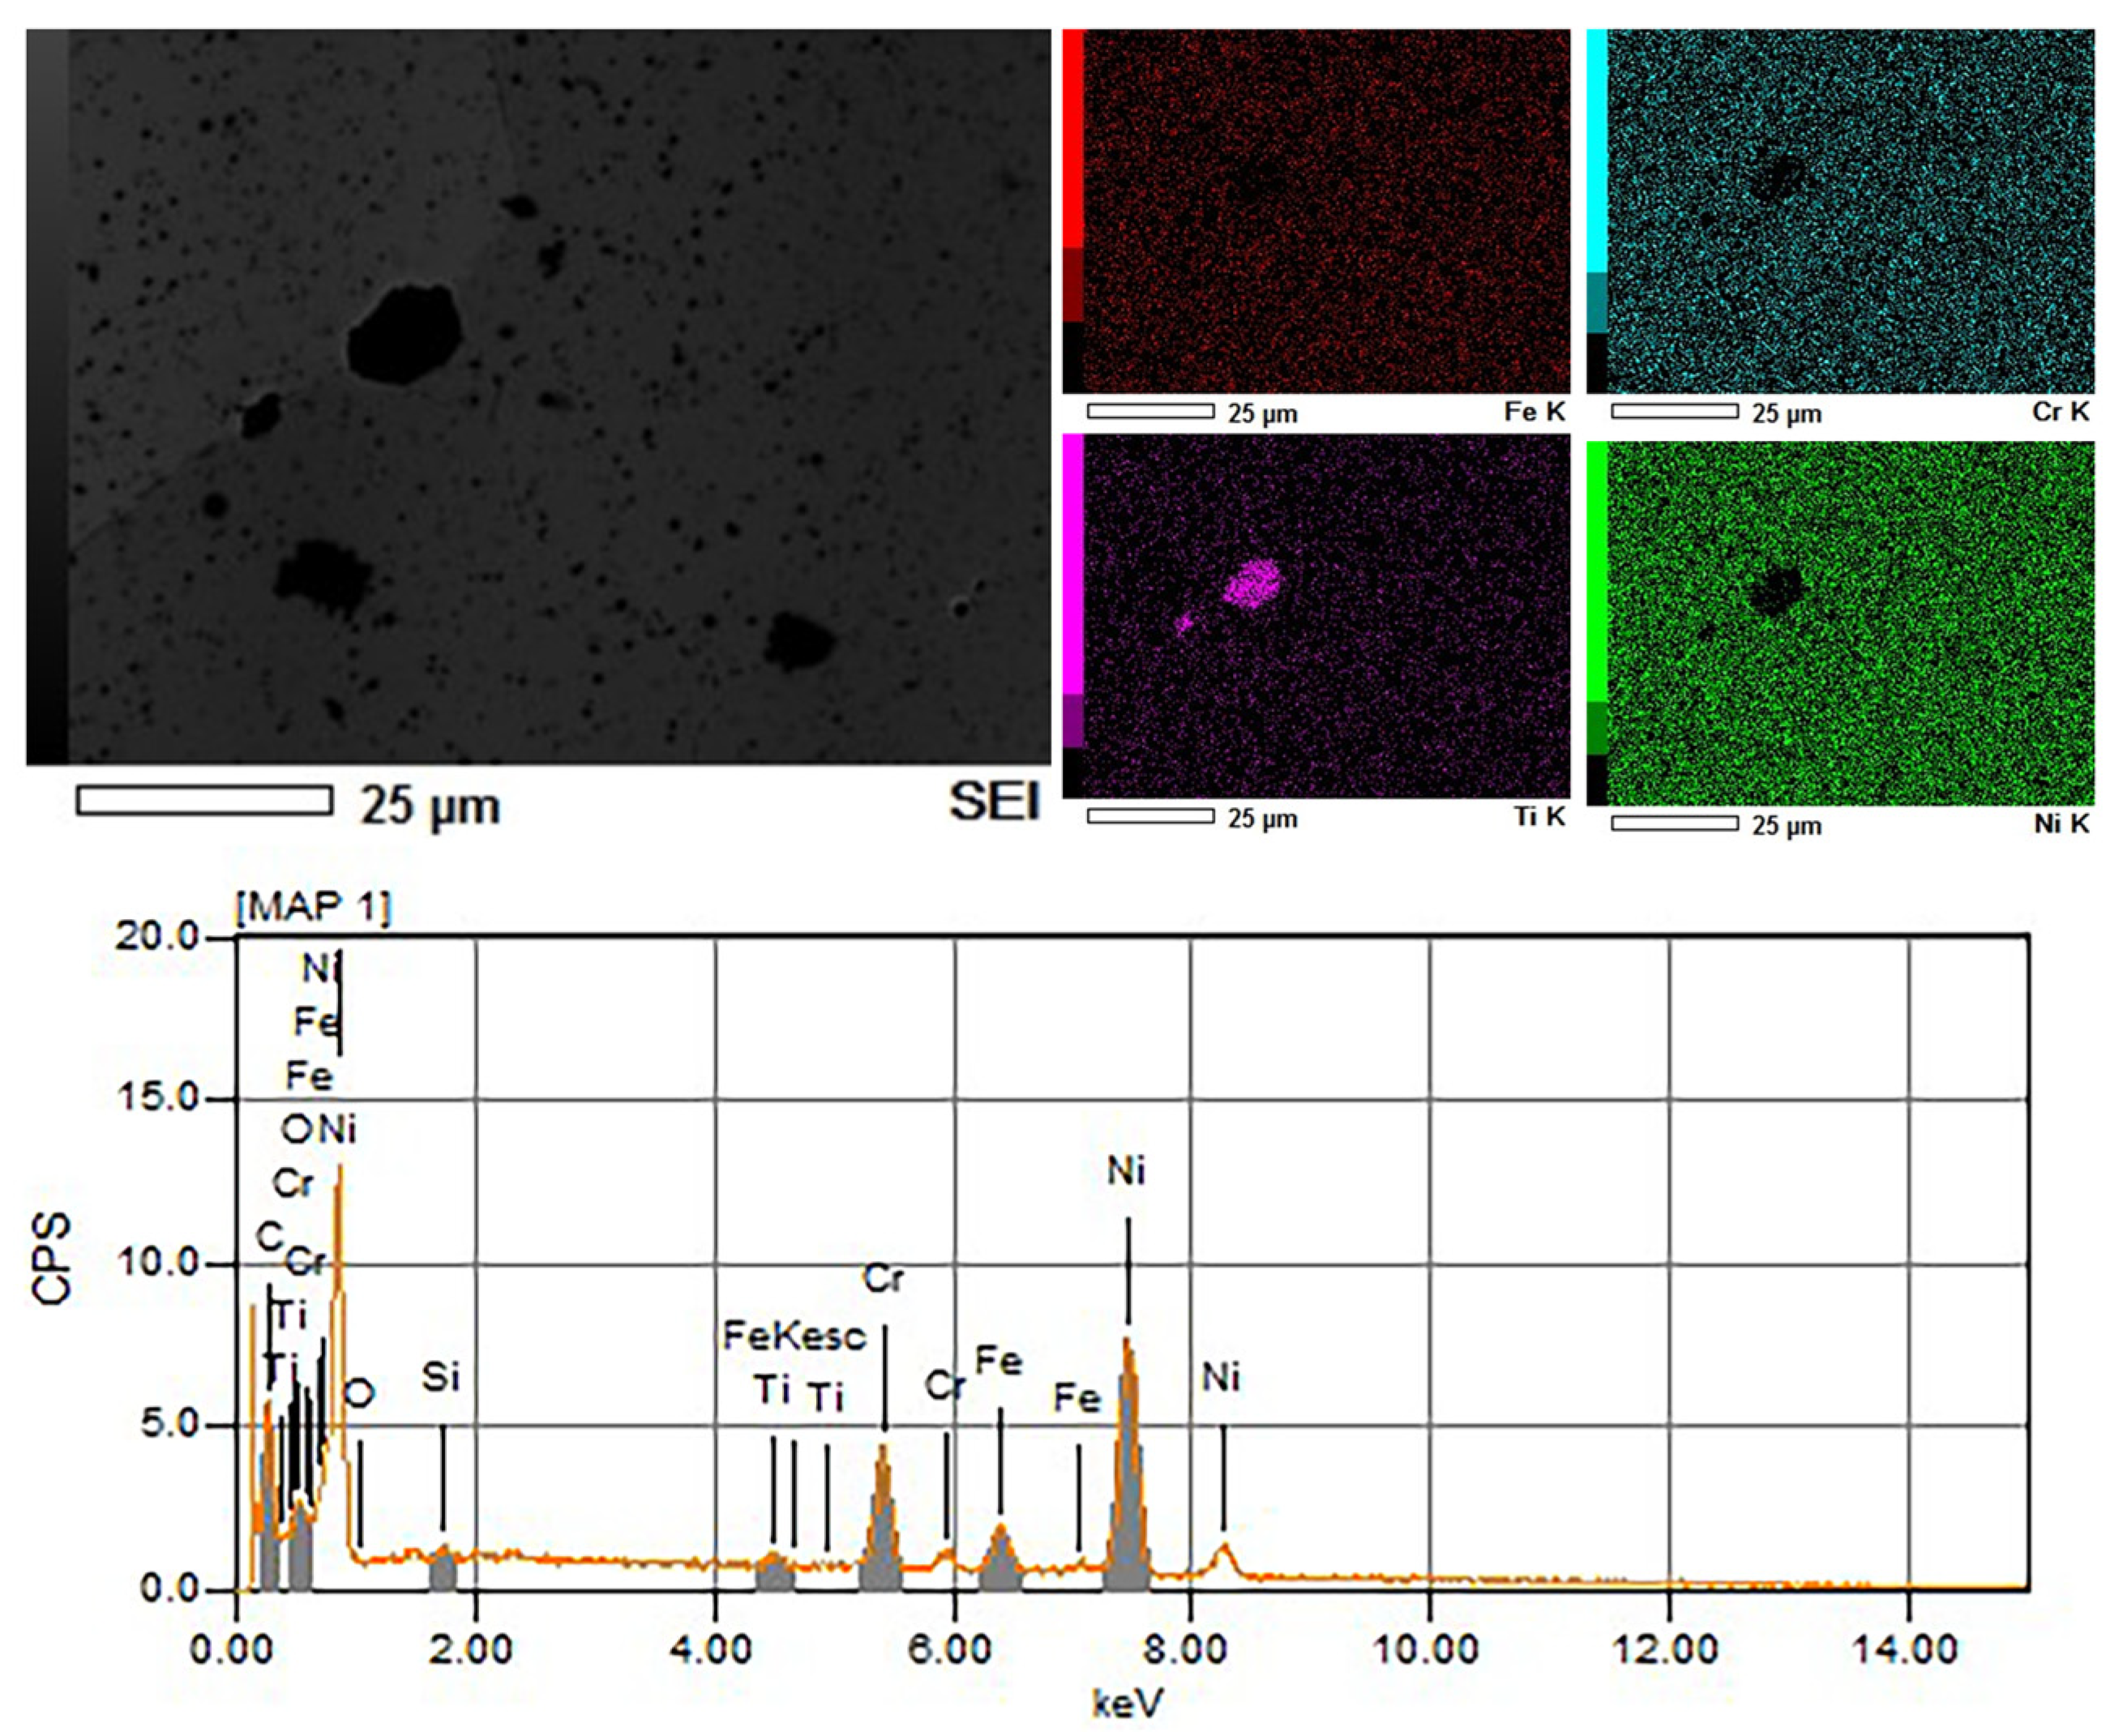
Before etching, the energy-dispersive spectroscopy (EDS) analysis of Ni625 was conducted and the results are depicted in
Figure 2. A comparison of the optical figures with the scanning electron microscopy (SEM) figure revealed that the relatively large and black geometric polygon in the SEM figure corresponded to the orange phases in the optical figures. These black phases were predominantly located at GBs, although they were also observed within grains. The polygonal area was deficient in chromium and nickel but exhibited a high percentage of titanium, which was identified as titanium nitride.
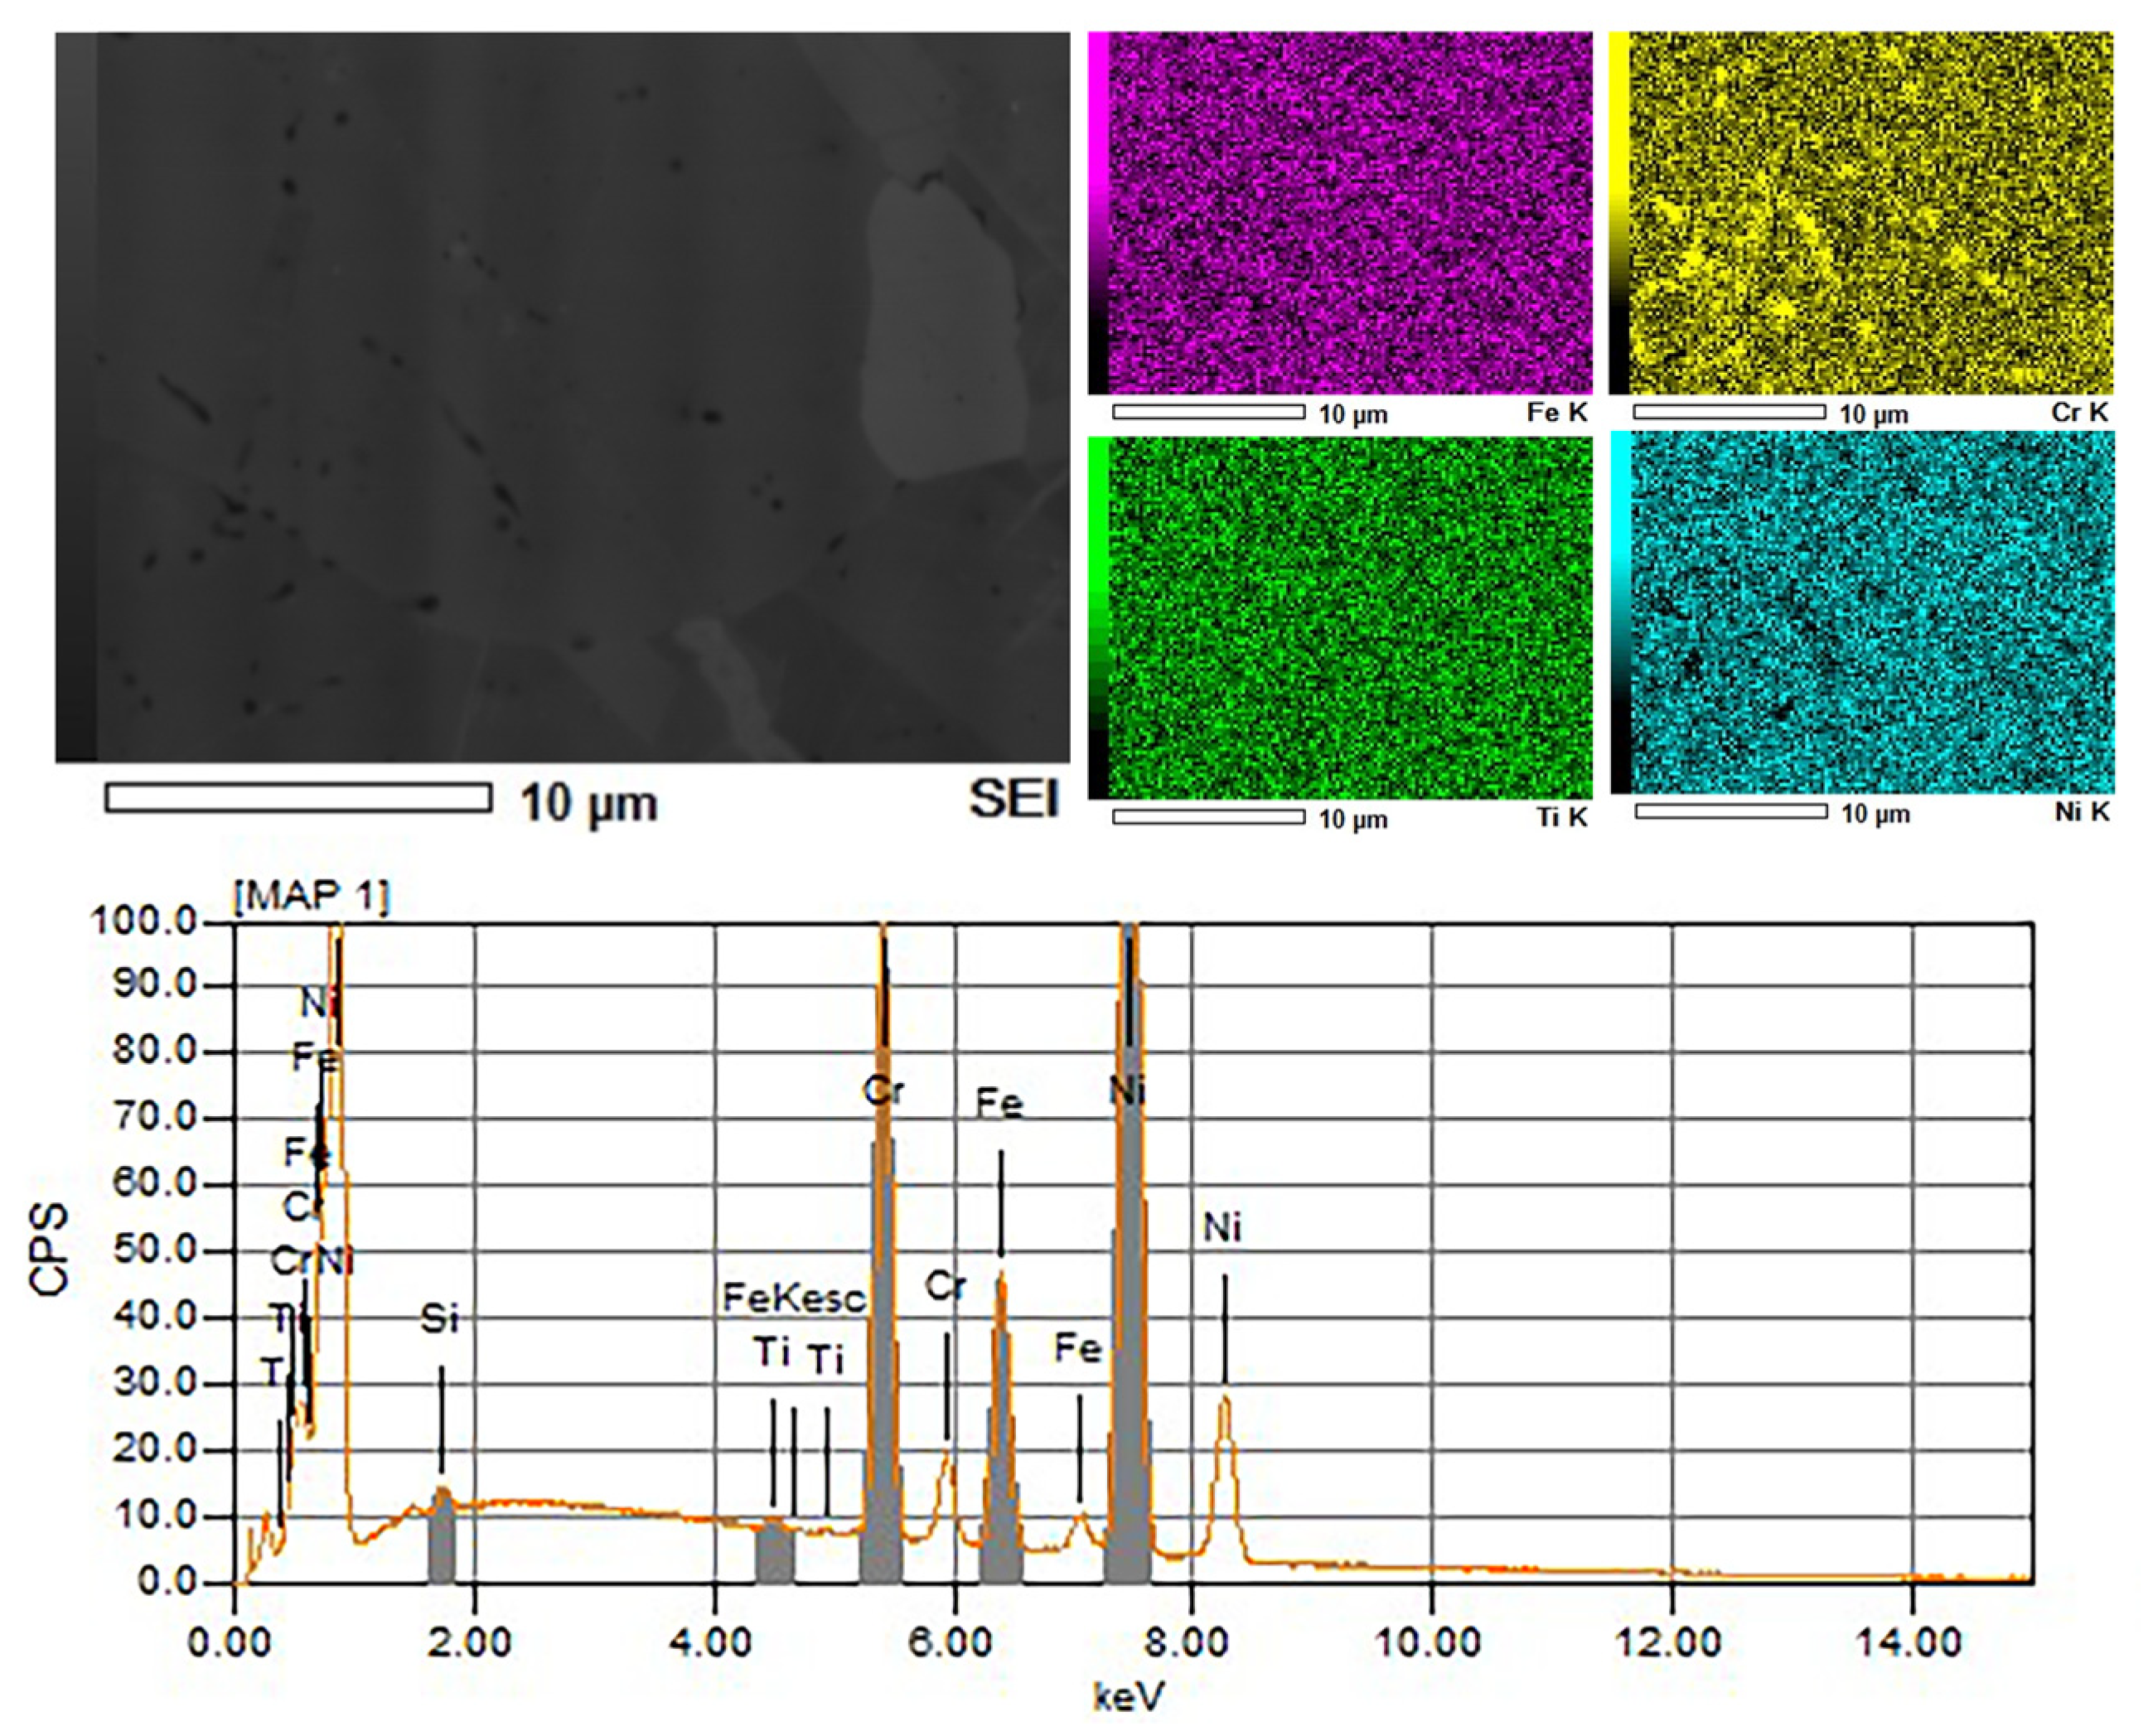
The SEM figure of Ni600 with the finely polished sample surface revealed black phases on the GBs that were considered to be chromium carbides [
29], as is shown in
Figure 3. The presence of these carbides can lead to intergranular corrosion and stress corrosion cracking [
30]. The formation of chromium carbides is influenced by precipitations at GBs and the formation of chromium depletion regions.
After determining the composition of these black phases, different etchants were used to etch the carbides. Glyceregia is a commonly used etchant for alloys that exhibit corrosion resistance due to its mild aggression. It consistently outlines GBs and reveals precipitates, making it the etchant of choice for revealing grains in nickel superalloys.
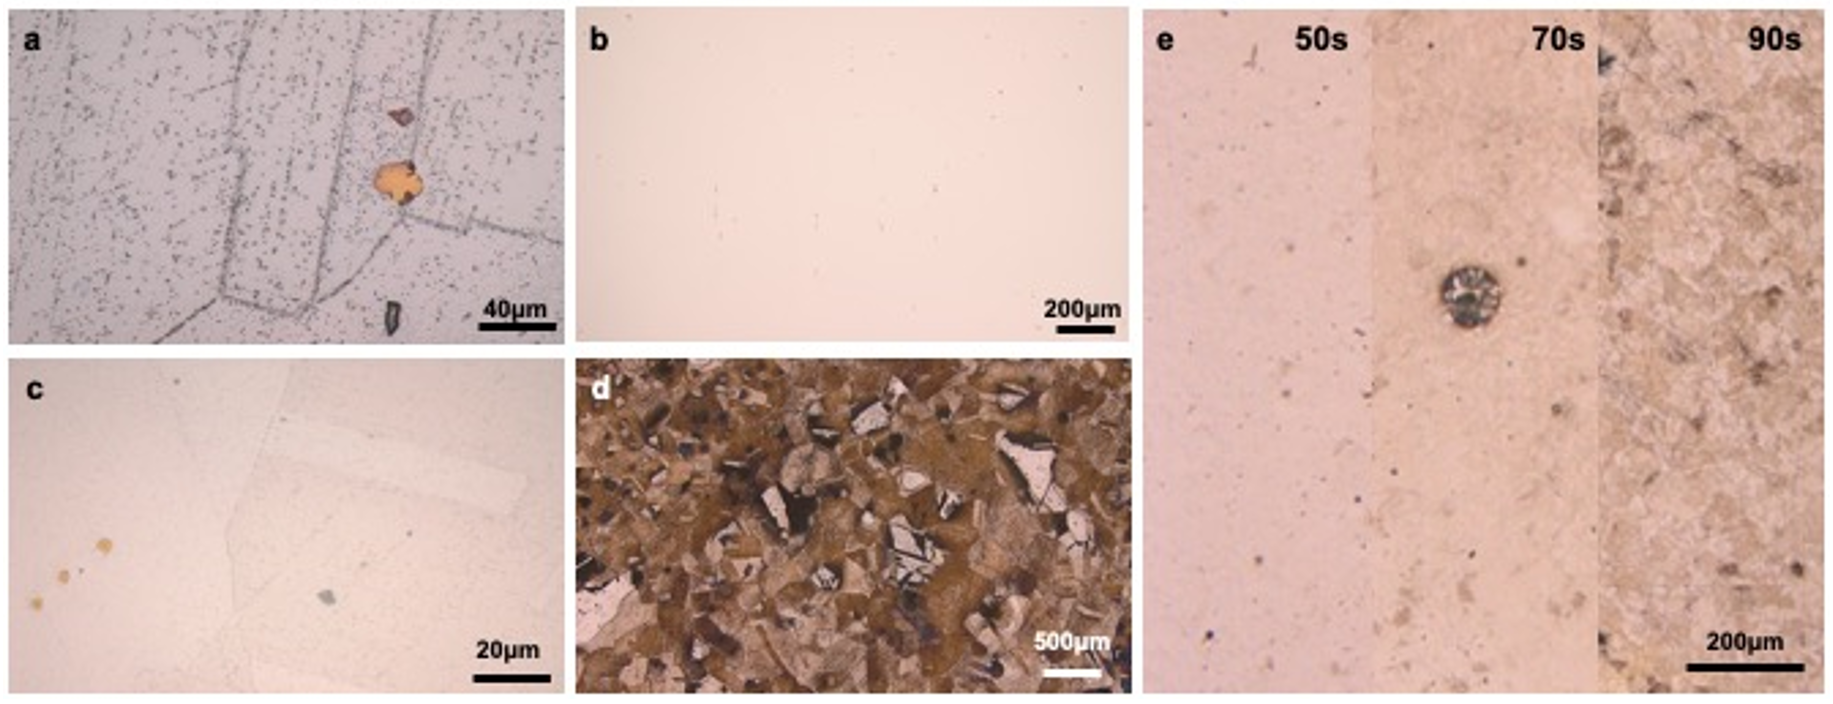
Figure 4a shows that the GBs and twins were clearly visible after Glyceregia etching for 175s if the sample was prepared without diamond polishing. The small black phases were distributed not only within the grains but also along the GBs. Notably, the black dots are dispersed throughout the figures, especially on the scratches. This shows that the scratches appear to significantly influence the distribution of carbides. Therefore, additional diamond polishing is imperative to eliminate these scratches and obtain a more accurate representation of the carbide distribution.
After further diamond polishing and etching, the surface of the sample was captured before and after etching, as shown in
Figure 4b,c. The optical figures not only directly show the grains, but also color different orientations with different contrast. This is a significant improvement in showing the different orientations of grains, compared with
Figure 4a. After etching, the twins and titanium carbide phases were apparent. GBs present an intermittent dotted line, indicating that the arrangement of carbides on GBs is by intervals. The presence of these carbides can lead to intergranular corrosion and stress corrosion cracking. The formation of chromium carbides is influenced by precipitation at GBs and the formation of chromium depletion regions. Upon extending the etching duration to a total of 60 s, the resultant morphology is depicted in
Figure 4d, exhibiting characteristics of over-etching beyond a certain threshold. Notably, in areas unaffected by over-etching, the ∑3 boundaries and twin structures within some grains were distinctly contrasted, as evidenced by the pronounced variation in color attributed to diverse crystallographic orientations. Similarly, the application of Glyceregia on Ni600 samples, as illustrated in
Figure 4e, produced a discernible emergence of black phases along GBs, particularly evident on the surface etched for 50 s. However, over-etching became apparent at 70 s. By 90 s, a differential etching effect was observed among grains of varying orientations, manifesting in diverse coloration, albeit with partial over-etching. This phenomenon was absent in the optimally etched samples shown in
Figure 4e. The increasing prominence of scratches during this process underscores the criticality of meticulous polishing in the initial stages of sample preparation.
After experimenting with various etchants,
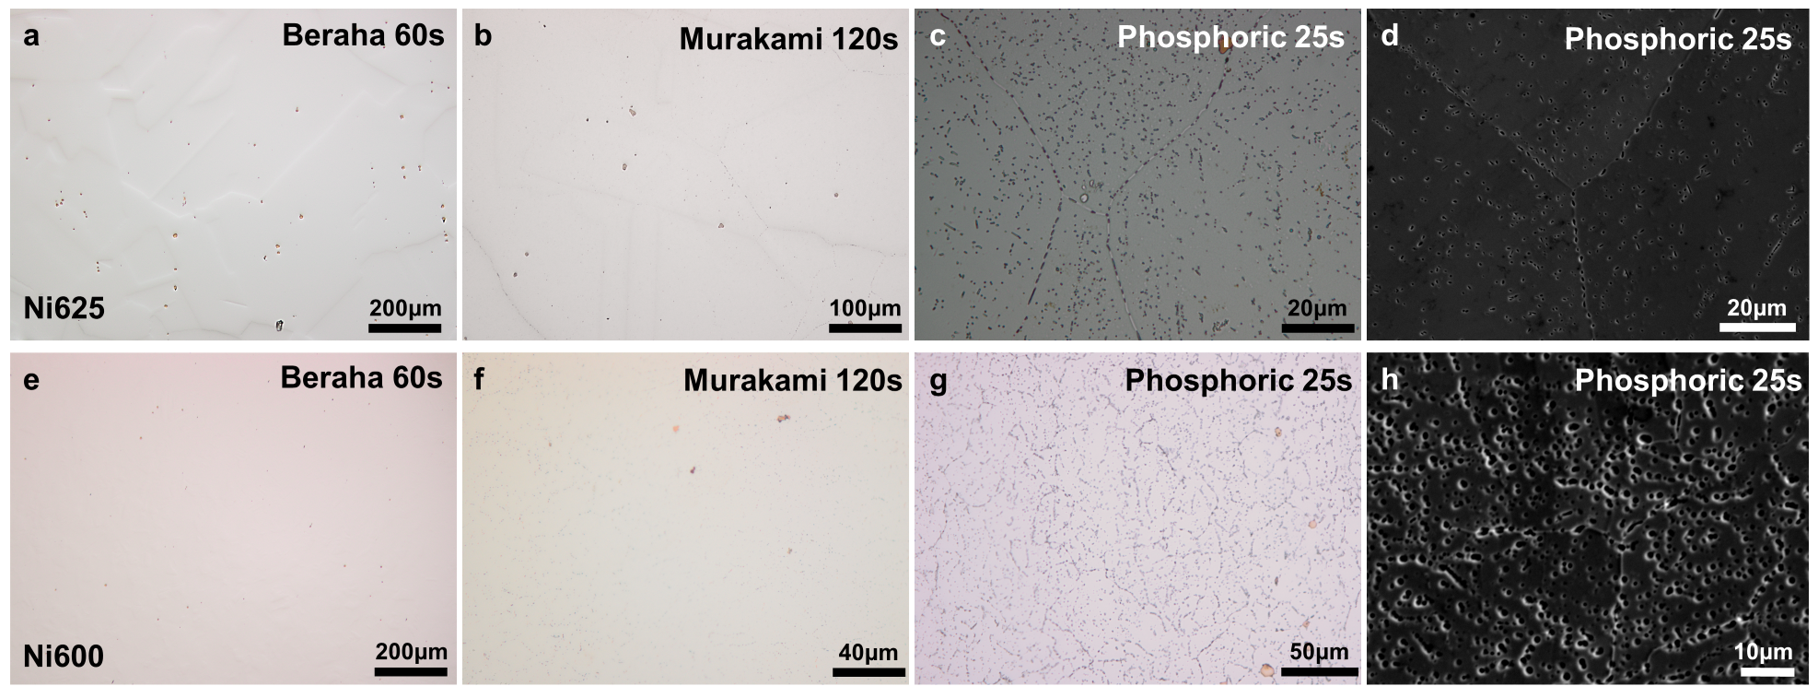
Figure 5a shows that the Beraha etchant facilitated the effortless identification of titanium phases, while the application of Murakami etchant slightly highlighted GBs in
Figure 5b, though the depth of etching was comparatively superficial and the incidence of black spots within the grains was lower than that observed with other etchants. Despite these limitations, Murakami etchant demonstrated superior efficacy in accentuating titanium compounds, as evidenced in
Figure 5b where the sample etched for 120 s is displayed. However, the performance of these two etchants in Ni600 is not obvious, as demonstrated in
Figure 5e,f.
In contrast to chemical etching, electrolytic etching can lead to uniformly etched GBs, characterized by a number of ‘bubbles’, as illustrated in
Figure 5c,d,g,h. Notably, carbon is absent in the bubbles located at GBs, yet some carbon residues persist within the black phases inside the grains, and the lighter areas surrounding the bubbles correspond to chromium-depleted zones, as determined with the help of EDS analysis. Kalling’s No2 and Aqua regia were also tested on the surface of Ni600 and Ni625, as listed in
Table 2. Upon application, both etchants exhibited strong corrosive properties. While they helped to pop out carbides, they also removed the matrix, making distinguishing different phases on the sample surface challenging. This outcome did not align with the main objective of highlighting the GBs and carbides, and hence was not elaborated further. However, for other purposes, such as the substantial removal of surface material and obtaining better characterization and indexing, these etchants, including others mentioned in the literature, also hold significant value [
31,
32]. The exploration of their etching duration is also worthwhile.
These figures indicate the different effects caused by the Beraha, Murakami’s chemical etching, and phosphoric electrolytic etching on the GBs and within the grains of Ni600 and Ni625. For a more detailed analysis, three intragranular regions in each figure corresponding to these etchants were selected, and the number of carbides within each region was counted. The data pertaining to the quantity and area of carbides identified within a consistent region of 2500 μm
2 for each etchant were systematically compiled. A larger disparity in data points suggested a more uneven distribution, whereas a smaller variance indicated a relatively uniform distribution of carbides. Beyond these distributional aspects, additional factors influence the data. One such factor is the ‘ending point’ of etching before the onset of over-etching. Moreover, local variations in etching time, attributable to differences in infiltration duration, also play a significant role. This is particularly pertinent when handling aggressive etchants and during the critical phase of removing samples from the etchant, where timing can have a marked impact on the etching process. Therefore, the average area of each carbide particle can be calculated. A notable observation from
Table 4 was that electrolytic etching tends to result in larger particle sizes, attributed to the bubble-like shape of the etched areas. The performance of Glyceregia and Murakami’s etchant showed varying effects on Ni600 and Ni625, suggesting a degree of selectivity towards specific carbide phases. To enhance the reliability of these findings, increasing the number of samples for analysis is recommended. This approach would help to generate more data groups, thereby reducing variance and yielding more accurate results. Such an expanded dataset would provide a more comprehensive understanding of the etchants’ effectiveness and their interaction with varied materials.
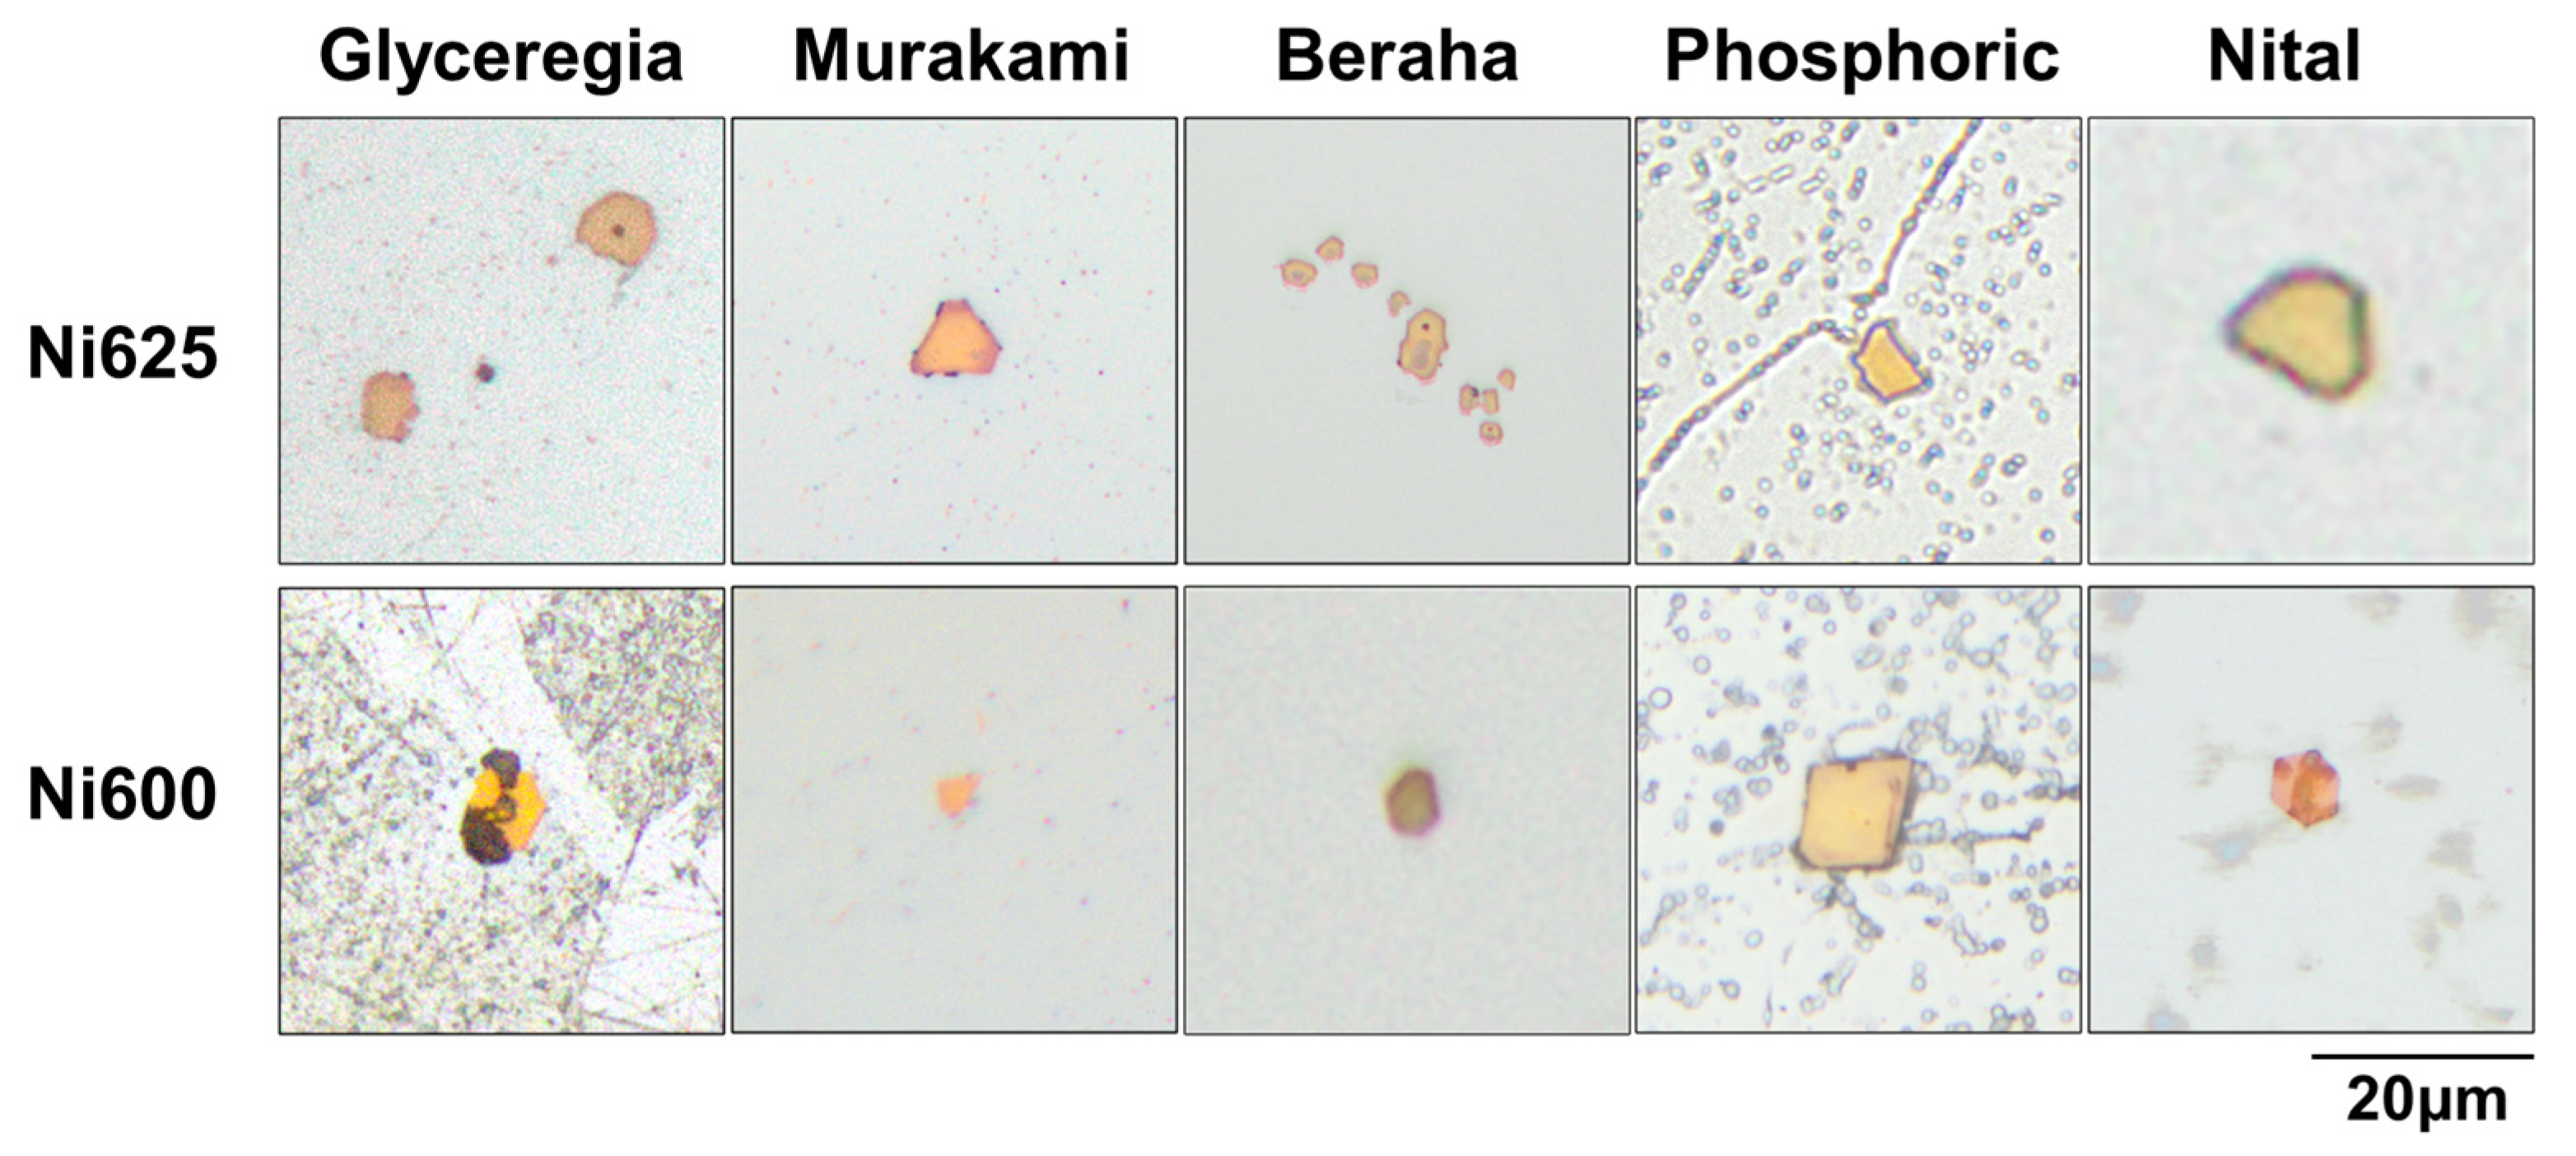
In the optical microscopy analysis comparing the titanium phases in Ni625 and Ni600, as shown in
Figure 6, a distinct observation emerges. In Ni625, the titanium phase is encircled by chromium carbides that are co-located with it, while it is a structural feature absent in Ni600. This contrast in microstructural characteristics may be attributed to the divergent processing methods applied to these materials or could stem from their inherent differences in elemental composition. Notably, Ni600 and Ni625 are characterized by fundamentally distinct types of carbides. However, to accurately identify the specific types of carbides that are associated with the titanium phases in Ni625, a more refined and precise indexing is required, focusing on smaller scale measurements.


