Communication

Design of Near α-Ti Alloys with Optimized Mechanical and Corrosion Properties and Their Characterizations

1
School of Materials Science and Engineering, Shijiazhuang Tiedao University, Shijiazhuang 050043, China
2
Department of Mechanical Materials Engineering, Hiroshima University, Higashi-Hiroshima 739-8527, Japan
*
Author to whom correspondence should be addressed.
Metals 2024, 14(1), 81; https://doi.org/10.3390/met14010081
Submission received: 29 November 2023 / Revised: 19 December 2023 / Accepted: 23 December 2023 / Published: 10 January 2024

Abstract

:
The designed alloy Ti-10.56%Al-2.08%Zr-0.80%Sn-0.88%Mo-0.51%Si (mol%), modified alloy Ti-10.81%Al-4.80%Zr-1.23%Sn-0.76%Cu-0.35%Si (mol%) and reference alloy Ti-10.52%Al-2.07%Zr-1.1%Sn-0.2%Mo-0.76%Si (mol%) with the same bond order (Bot) value of 3.49 and different d-orbital energy level (Mdt) values of 2.43, 2.42 and 2.42 were proposed and their mechanical and corrosion properties were compared in the present study. The ultimate tensile strength (σUTS) and fracture strain (ɛf) values of the three near α-Ti alloys at both as-cast and solution-treated conditions were 989 and 1118 MPa and 11.6% and 3.4% for the designed alloy, 993 and 1354 MPa with 13.5% and 2.3% for the modified alloy and 991 and 1238 MPa with 12.7% and 3.1% for the reference alloy, respectively. The thickness of corrosion layers of the solution-treated designed, modified and reference near α-Ti alloys after immersion in hot salts for 28.8 ks were measured at 3.06, 3.68 and 4.89 µm. The comparable mechanical properties and improved hot salt corrosion resistance ability of designed and modified alloys compared to those of the reference alloy were obtained by considering their Bot and Mdt values; this might lead to the development of alternative near α-Ti alloys to conventional materials.

1. Introduction

Near α titanium (near α-Ti) alloys, containing small amounts of β stabilizing elements with a β phase fraction of usually less than 10 wt.%, are commonly utilized in high-temperature applications due to their exceptional combination of high-temperature strength and lightweight properties [1]. For example, in the compressor of jet engines, replacing nickel-based alloys with titanium alloys could reduce the weight of the fuselage [2]. However, at elevated temperatures (300–650 °C), the interactions between α-Ti alloys and the salts present in the atmosphere above the ocean lead to a reduction in their service lifespan and limit their applications [2,3]. Responding to the above-mentioned challenge, researchers have to continue to develop further strategies to enhance both the mechanical strength and the resistance to hot salt corrosion. For near α-Ti alloys, adjusting the kinds and contents of alloying elements is a possible approach to optimize their mechanical and corrosion properties [4,5,6]. It was reported that the alloying elements Mo and Cu were added to develop high-temperature titanium with high heat resistance and especially good oxidation behavior up to 600 °C [7,8]. Furthermore, to regulate the functionalities of Ti alloys, it is crucial to achieve extremely low levels of interstitial impurities. Impurities or contaminants from the crucible and/or atmosphere would greatly affect the mechanical properties of Ti alloys [9,10]. Cold Crucible Levitation Melting (CCLM) technology offered an effective means of preventing contaminants from the crucible and efficiently managing the vacuum within the furnace [11,12]. The molten metals were raised by the eddy current of CCLM and were melted without contact with the crucible. An even distribution of solute elements in Ti alloys was attained by diffusion mixing and the strong stirring induced by electromagnetic forces, and the solidification cooling processes for molten alloys could be controlled by CCLM [13,14,15].
Prior to the proposal of some alloy design approaches, the development of titanium alloys relied heavily on laborious experimental trials and empirically derived rules that were costly and inefficient [16]. The commonly used titanium alloy design theories include electron-to-atom (e/a) ratio, d-electron alloy design and Mo equivalent numbers [17,18,19]. The stability of the β phase with respect to the e/a ratio and Mo equivalent numbers were an effective way to predict the phase stability and the mechanical properties of β-Ti alloys, including Zr, Mn and Cr alloying elements [20,21,22,23,24]. For the metastable β-Ti alloys developed for orthopedic applications, their electron-to-atom (e/a) ratio is about 4.24, which can ensure that they have a lower elastic modulus to alleviate the “stress shielding” effect [25]. M. Morinaga et al. calculated Mdt and Bot values of varied elements using the MTi14 cluster and MTi18 models, respectively [26]. High temperature alpha-type alloys, high strength beta-type alloys, and high corrosion resistant alloys have been developed by considering their Bot and Mdt values and positions in the Mdt-Bot diagram [27]. Therefore, the applications of Discrete variational-Xα (DV-Xα) cluster calculation theory to design binary and multielement Ti alloys were widely used and accepted [28,29]. However, the research on the design of optimized compositional near α-Ti alloys with high corrosion, high mechanical performance and low cost by using Bot and Mdt parameters still showed them to be inefficient, suggesting an effective approach for the development of new α-Ti alloys.
In the present study, one widely applied commercial near α-Ti alloy Ti-10.52%Al-2.07%Zr-1.1%Sn-0.2%Mo-0.76%Si (mol%), TIMETAL 1100, was chosen as the reference alloy. The modified near α-Ti alloy Ti-10.81%Al-4.80%Zr-1.23%Sn-0.76%Cu-0.35%Si (mol%) possessed the same Bot value of 3.49 and Mdt value of 2.42 to the reference alloy. In addition, to estimate the influence of Mdt value on designing high mechanical and corrosion resistance near α-Ti alloys, the designed alloy Ti-10.56%Al-2.08%Zr-0.80%Sn-0.88%Mo-0.51%Si (mol%) was prepared with the same Bot value of 3.49 and a different Mdt value of 2.43. The CCLM technique was applied to control the same melting and cooling process for preparing the three near α-Ti alloys. The mechanical properties and the hot salt corrosion resistance abilities of the three near α-Ti alloys were compared at both as-cast and after solution-treated conditions.

2. Alloy Design and Experimental Procedures

The raw materials with Ti, Al, Sn, Zr, Cu, Mo and Si purities of 99.8, 99.9, 98.5, 98.0, 99.0, 99.0 and 99.0 mass%, respectively, were used to produce the three near-Ti alloys. The mean values of Bot and Mdt of the three near-Ti alloys were calculated on the basis of the MTi14 cluster model, using Equations (1) and (2) [30].
Bot = ∑Xi(Bo)i
Mdt = ∑Xi(Md)i
where Xi is the molar fraction of component i in the alloy, (Md)i and (Bo)i are the numerical values of Bot and Mdt for each component i, respectively. The designed alloy Ti-10.56%Al-2.08%Zr-0.80%Sn-0.88%Mo-0.51%Si (Mdt: 2.43, Bot: 3.49), modified alloy Ti-10.81%Al-4.80%Zr-1.23%Sn-0.76%Cu-0.35%Si (Mdt: 2.42, Bot: 3.49) and reference alloy Ti-10.52%Al-2.07%Zr-1.1%Sn-0.2%Mo-0.76%Si (Mdt: 2.42, Bot: 3.49) were proposed and discussed in the present study.
The CCLM method with the same processing parameters was applied to prepare the ingots of the three near-Ti alloys. The capacity of copper crucibles for CCLM is 1 kg Fe (Fuji-CCLMFe, Aichi, Japan). The upper electric coils with a rated power of 100 kW and the lower electric coils with a rated power of 60 kW provided energy for the melting and levitation of alloys. The levitation of molten titanium alloys avoided direct contact with the copper crucible during the production process. The three near-Ti alloys were kept at 2300 K for 300 s under an argon (Ar) atmosphere with a purity of 99.99%. Then, the electrical supply of both the upper and lower coils was gradually turned off until it was switched off. After 1800 s, the ingots cooled and solidified in the copper crucible. The as-cast specimens of the three near-Ti alloys were processed from the rectangle blocks cut from the ingots. The β phase transition temperature of the three near α-Ti alloys was determined using thermal expansion equipment (NETZSCH, Selb, German), as depicted in Figure 1. The measurements of the coefficient of thermal expansion revealed that the β phase transition temperature of the three near α-Ti alloys were 1200 K, 1220 K, and 1250 K, respectively. Therefore, the three near α-Ti alloys were subjected to solution treatment under an inert argon atmosphere at 1280 K for a duration of 7.2 ks. Prior to the solution treatment, all ingots were encased in quartz tubes, which were then shattered, resulting in a water-quenched process. The microstructure observation of alloys was carried out by Optical Microscopy (OM) analysis. Sandpaper from 80 to 2500 mesh was applied to grind the OM specimens, and polishing paper was used to polish the OM specimens. Distilled water, nitric acid, and hydrofluoric acid with volume percentages of 95%, 3% and 2% were mixed for etching OM specimens. The X-ray diffraction (XRD) was carried out to identify the phases and lattice constants of the three near-Ti alloys. The Cu Kα radiation of XRD was generated at 40 kV and 30 mA under room temperature. The Vickers hardness was tested with a load of 9.8 N for 10 s. For tensile test specimens, the gauge sizes were consistent with the diameter of 6 mm and length of 20 mm, and the grips diameter was 10 mm. The initial strain rate for the tensile tests was 1.9 × 10⁻⁴ s−1 at ambient temperature. The stress–strain curves were recorded by the tensile test machine (Autograph DCS-R-5000, Shimadzu Corporation, Kyoto, Japan), ultimate tensile strength (σUTS) and fracture strain (ɛf) of specimens were obtained by an extensometer (Shimadzu SG 10–50) during the tensile test.
The hot salt corrosion samples, measuring 10 mm × 5 mm × 1.5 mm, were carefully prepared by wire cutting. Each surface was gently sanded with abrasive papers with grit ranging from 80–2000. These samples were precisely measured before the hot salt corrosion test. Next, the test was conducted in Na2SO4-45 mol% NaCl at 923 K for 43.2 ks, with weight loss recorded every two hours. The selected temperature was based on the applications of titanium alloy in aerospace engines. The crucible holding the melted salt is made from high-purity alumina, with dimensions of a 46 mm outer diameter, a 36 mm height and a capacity of 30 mL. The salt is directly exposed to the air, mirroring the actual application conditions. The samples were hung from a platinum wire on six sides to ensure full contact. Then, they were immersed in 9.4 mol% NaOH-0.67 mol% KMnO4 boiling solution for 30 min to dissolve the solidified salts. After thorough washing in 0.88 mol% (NH4)2HC6H5O7 boiling solution for 20 min, residues and KMnO4 were removed. The specimens were then thoroughly rinsed for 3 min and dried for 2 min to remove any contaminants. Finally, the cleaned and dried samples were weighed. The investigation of the hot salt corrosion process of the near α-Ti alloy was further deepened by observing the microstructures of the hot salt corrosion layer on the specimens through an electron probe micro-analyzer (EPMA, (JEOL JXA-8200, JEOL, Tokyo, Japan)) after they were continuously immersed in hot salts for a period of 28.8 ks.

3. Results and Discussion

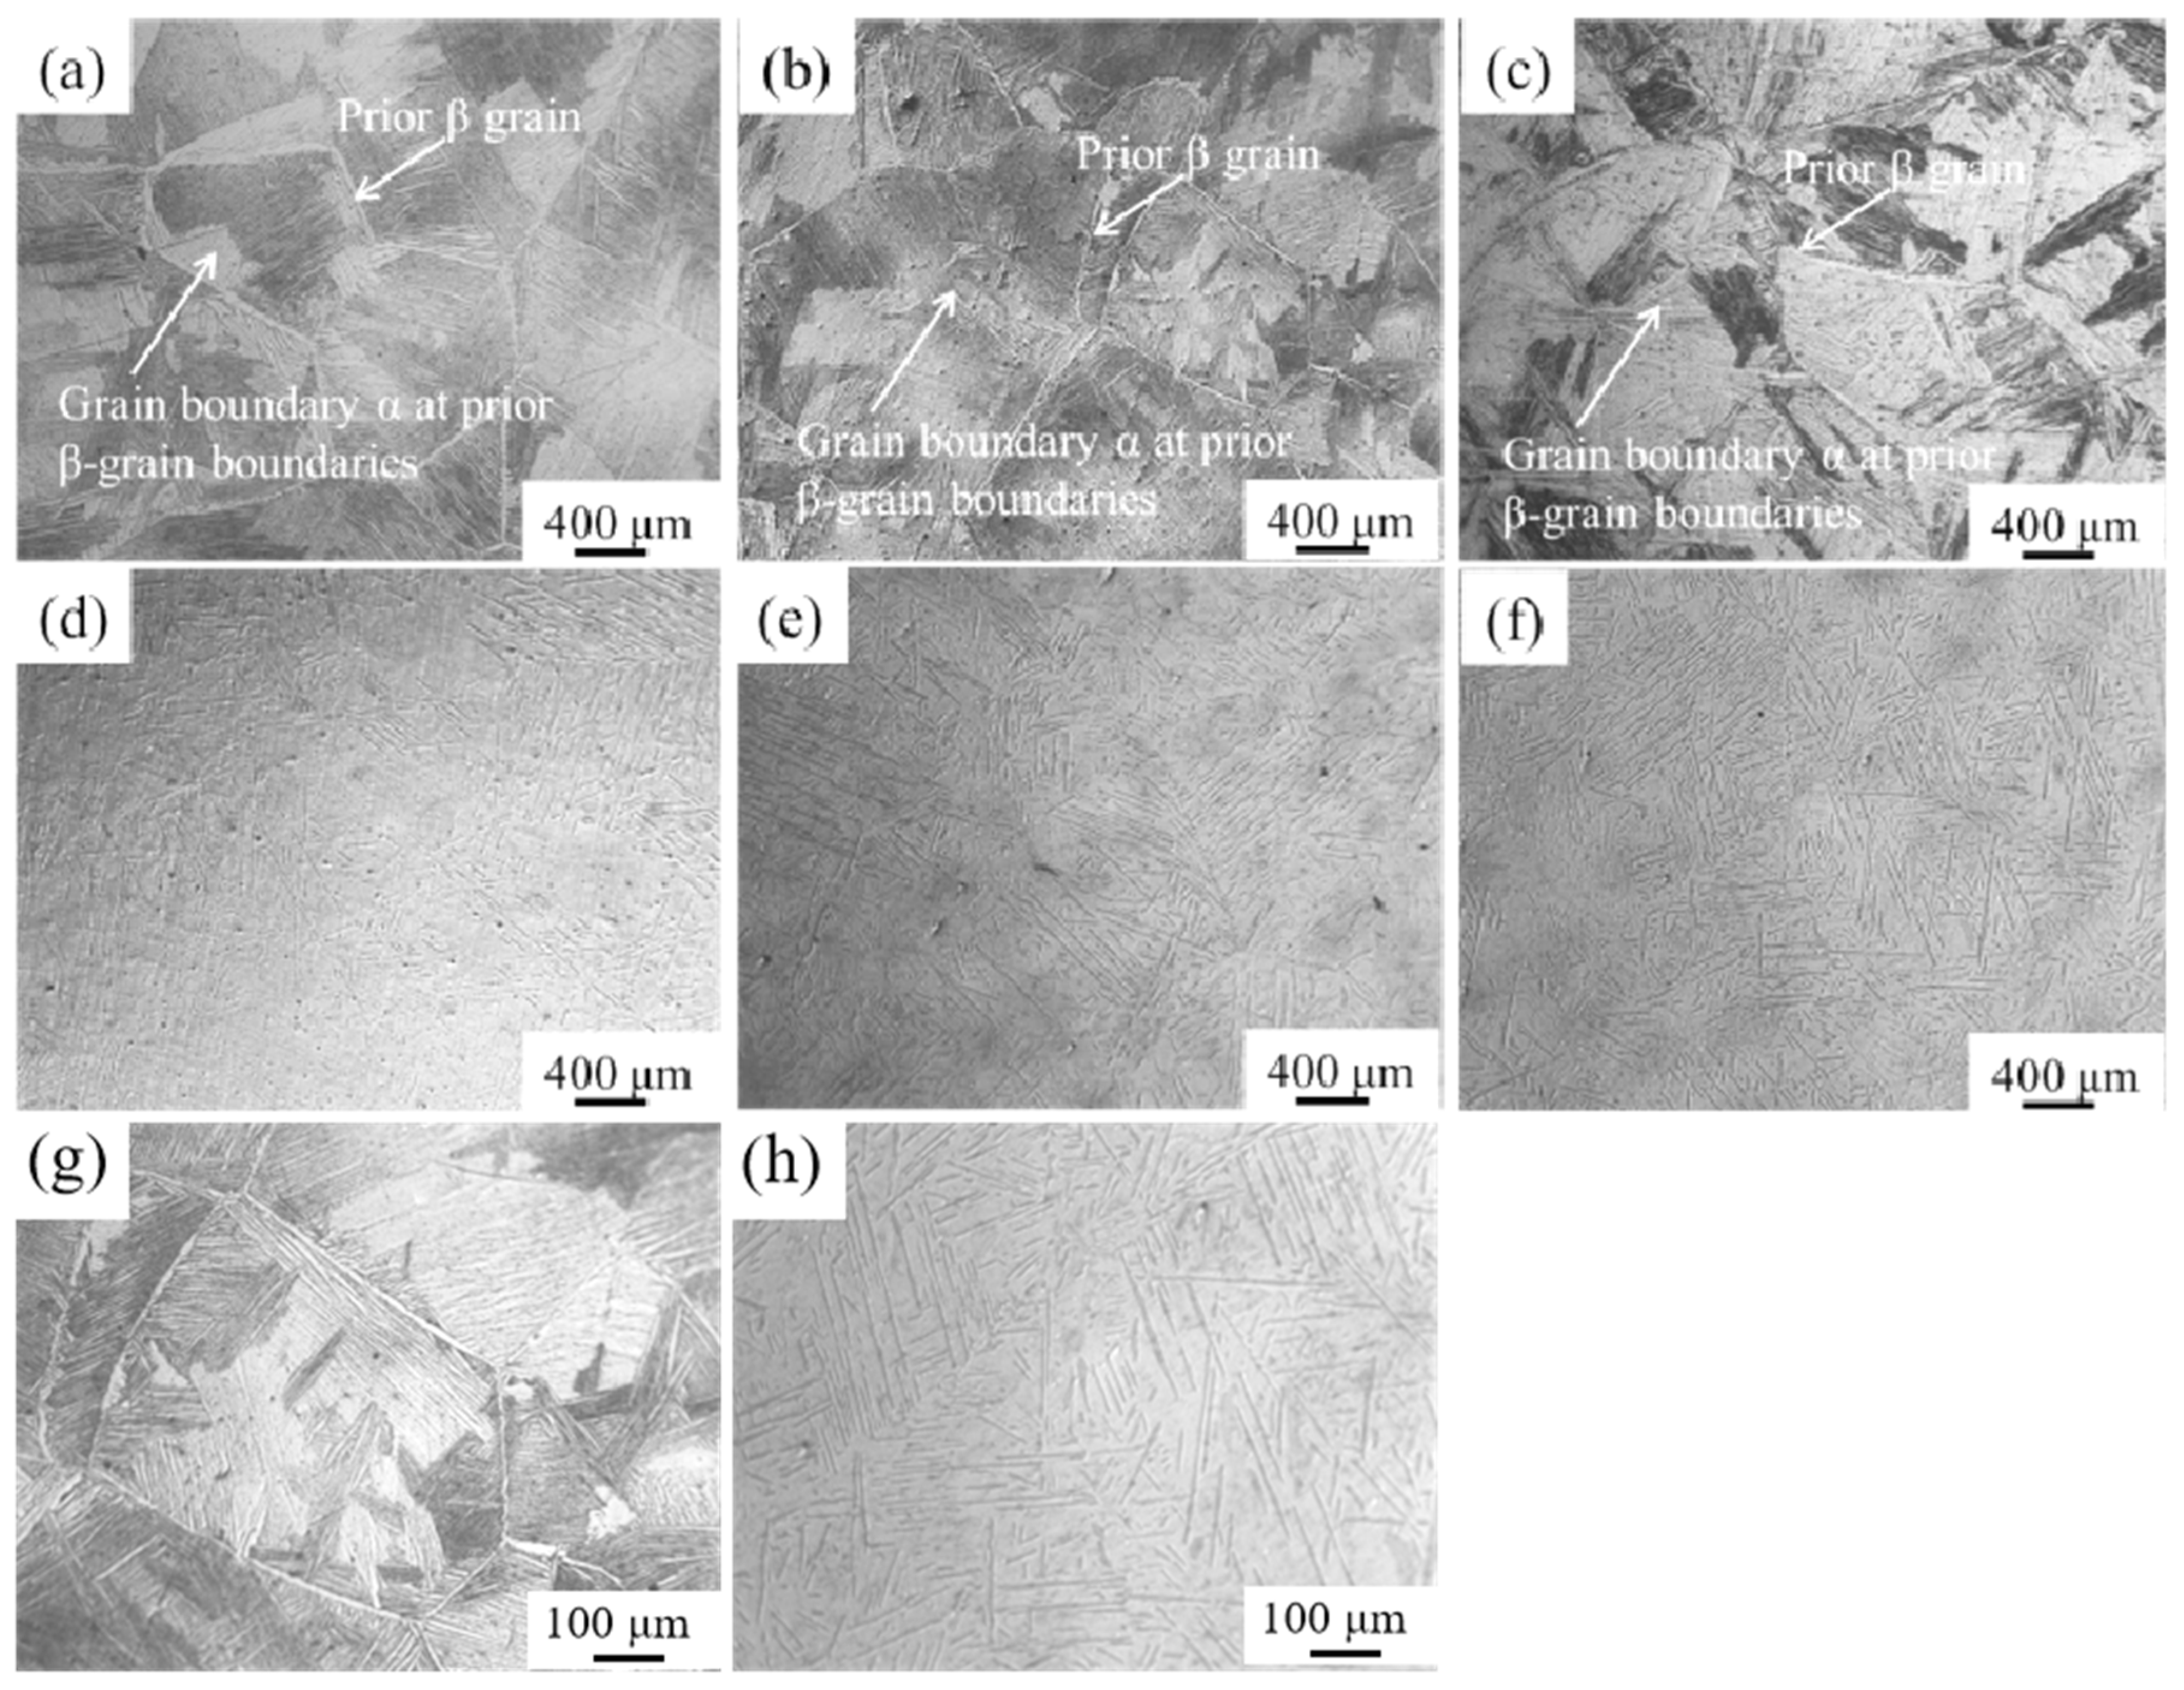
Figure 2 showed the OM images of the as-cast and solution-treated near α-Ti alloys. For the three as-cast near α-Ti alloys, the thin films of β phase at the α interfaces with various orientations and the prior β boundaries were observed in Figure 2a–c [31,32]. The similar grain size and microstructures in the three near α-Ti alloys at as-cast conditions were attributable to the same producing parameters. The occurrence of acicular α or α’ phases in the three near α-Ti alloys after solution treatment were displayed in Figure 2d–f [33]. The lamellar structure was a distinctive feature of near α-Ti alloys, resulting from the transformation of a β to α phase during the cooling process. In order to provide clear observation, Figure 2g,h showed higher magnifications of Figure 2b,e, respectively. The two slip directions and six slip planes of the Ti unit cell provided 12 possible orientations. The solution treatment with water quenching process frequently results in local elevations of the α-stabilizing elements and the formation of acicular α or α’ phases [34,35]. Simultaneously, the three solution-treated near α-Ti alloys also showed similar microstructures with the absence of prior β grain boundaries, which were attributed to the transformation of β phase.
Figure 3 showed the XRD profiles of the three as-cast and solution-treated near α-Ti alloys. The diffraction patterns obtained from the XRD analyses reveal the presence of both α and β phases in all three near α-Ti alloys, as illustrated in Figure 3a–f. The three as-cast near α-Ti alloys exhibited a higher peak intensity of β phase than α phase. However, after solution treatment, the peak area ratio of β to α phase decreased in the XRD profile. The different XRD profiles between as-cast and solution-treated specimens were attributed to the transformation of the β phase into either the α or α’ phase. The XRD results also showed high agreement with their respective OM observations.
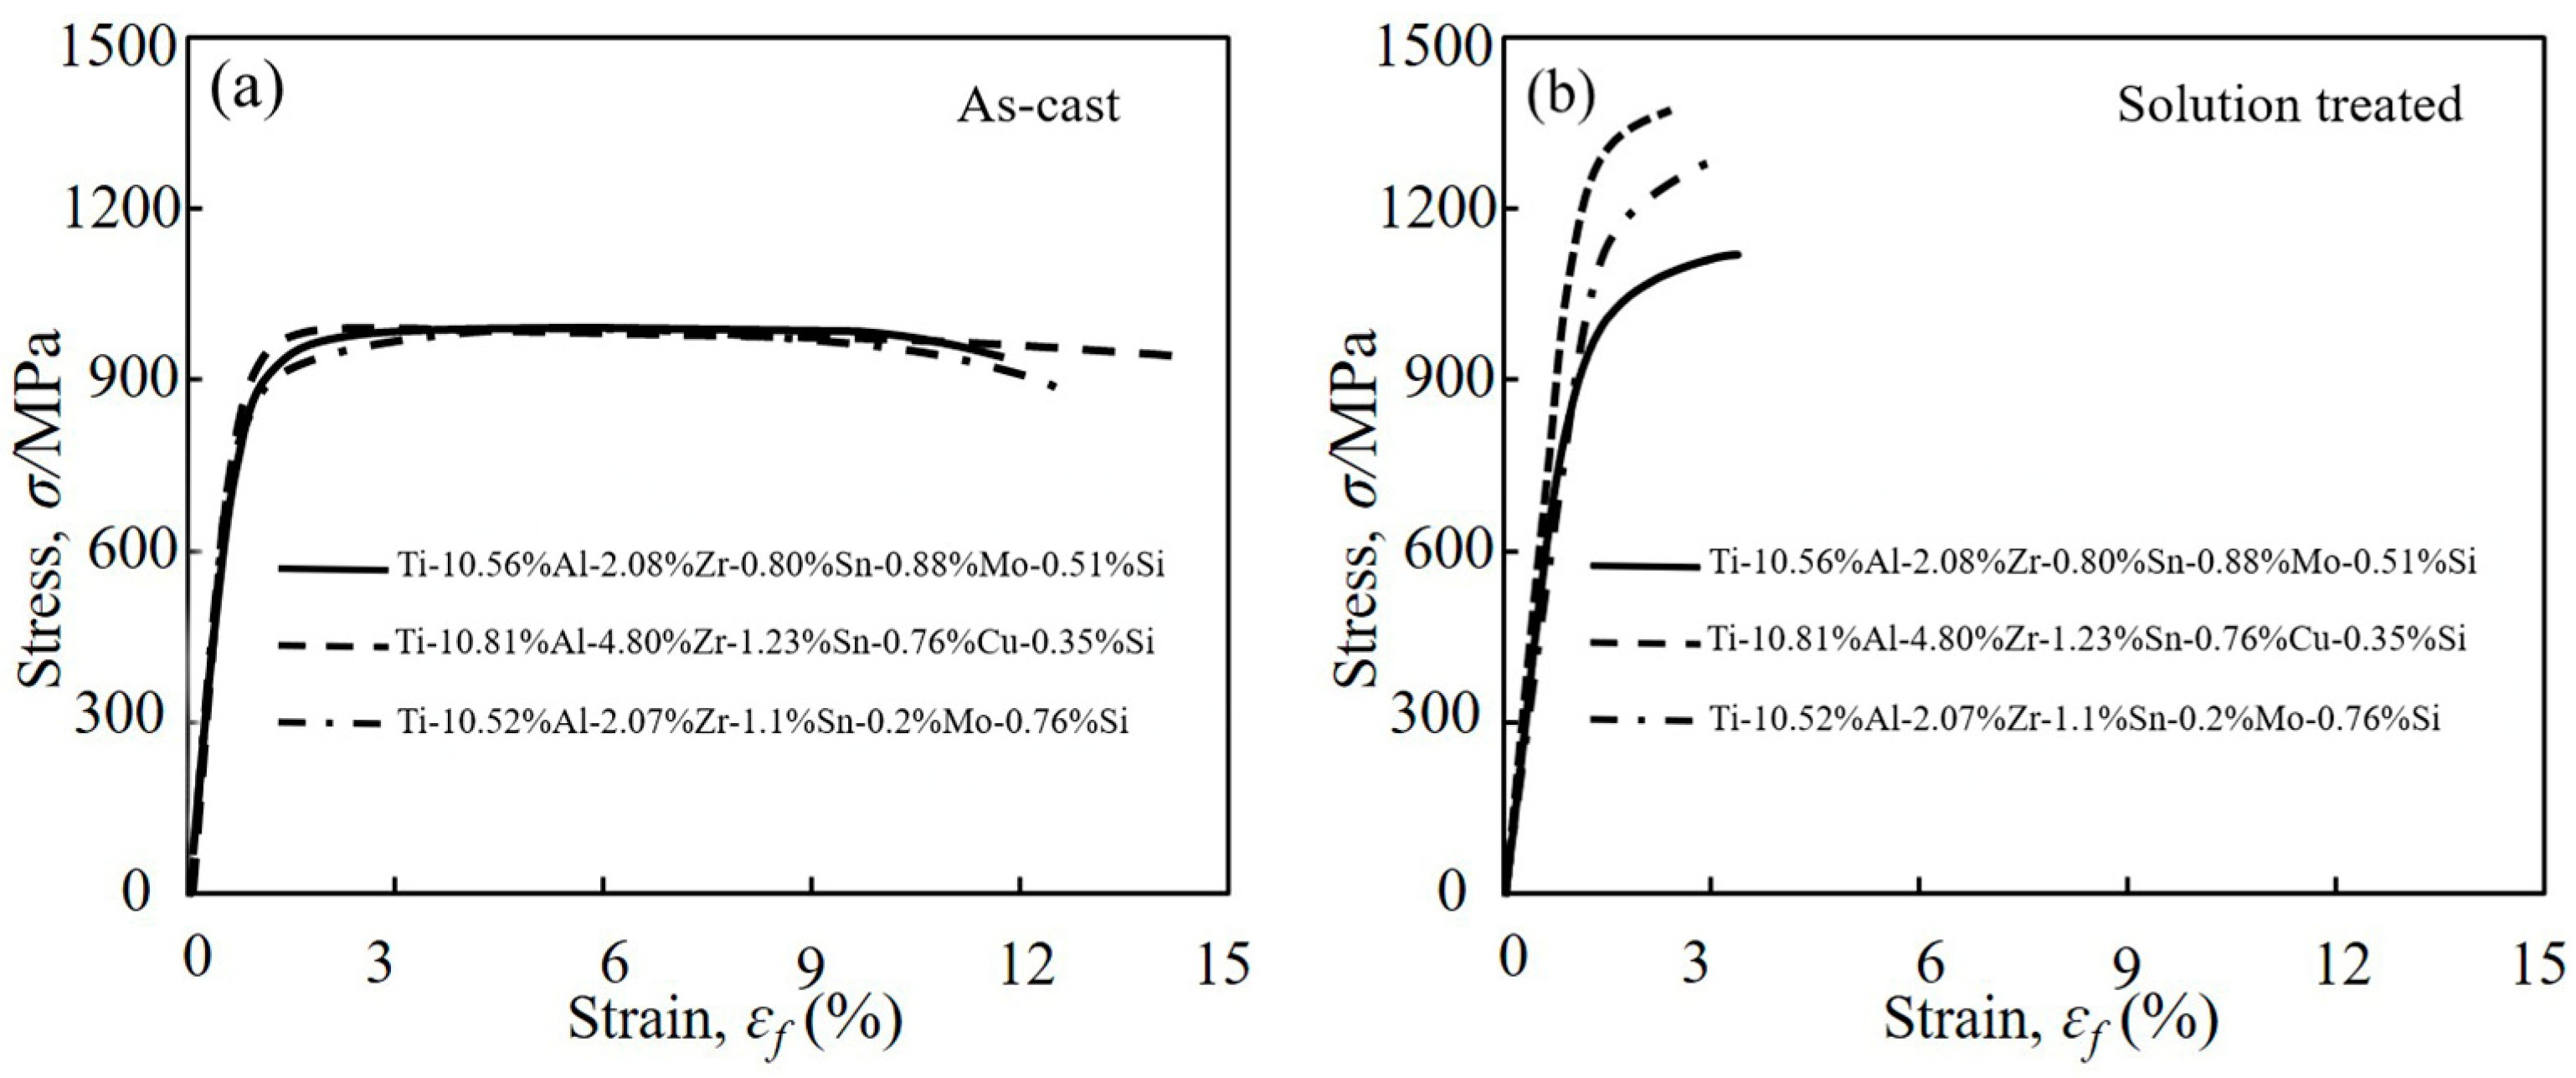
The stress–strain curves of the three as-cast and solution-treated near α-Ti alloys were shown in Figure 4a,b, respectively. The σUTS and ɛf values of the three near α-Ti alloys were discussed in the present study. At as-cast conditions, the σUTS and ɛf values were 989 MPa and 11.6% of designed alloy, 993 MPa and 13.5% of modified alloy and 991 MPa and 12.7% of reference alloy, respectively. In addition, after solution treatment, the σUTS and ɛf values were 1118 MPa and 3.4% of designed alloy, 1354 MPa and 2.3% of modified alloy and 1238 MPa and 3.1% of reference alloy, respectively. The results showed that the designed and modified alloys with comparable tensile properties to the reference alloy were proposed by considering the Bot and Mdt values of near α-Ti alloys. The observed increase in σUTS and significant decrease in ɛf of the three near α-Ti alloys after solution treatment were attributed to the presence of acicular α or α’ phase. It was reported that the precipitate of silicide in the grain boundaries was also one of the major reasons for the drastic decrease of ɛf of solution-treated near α-Ti alloys [36].
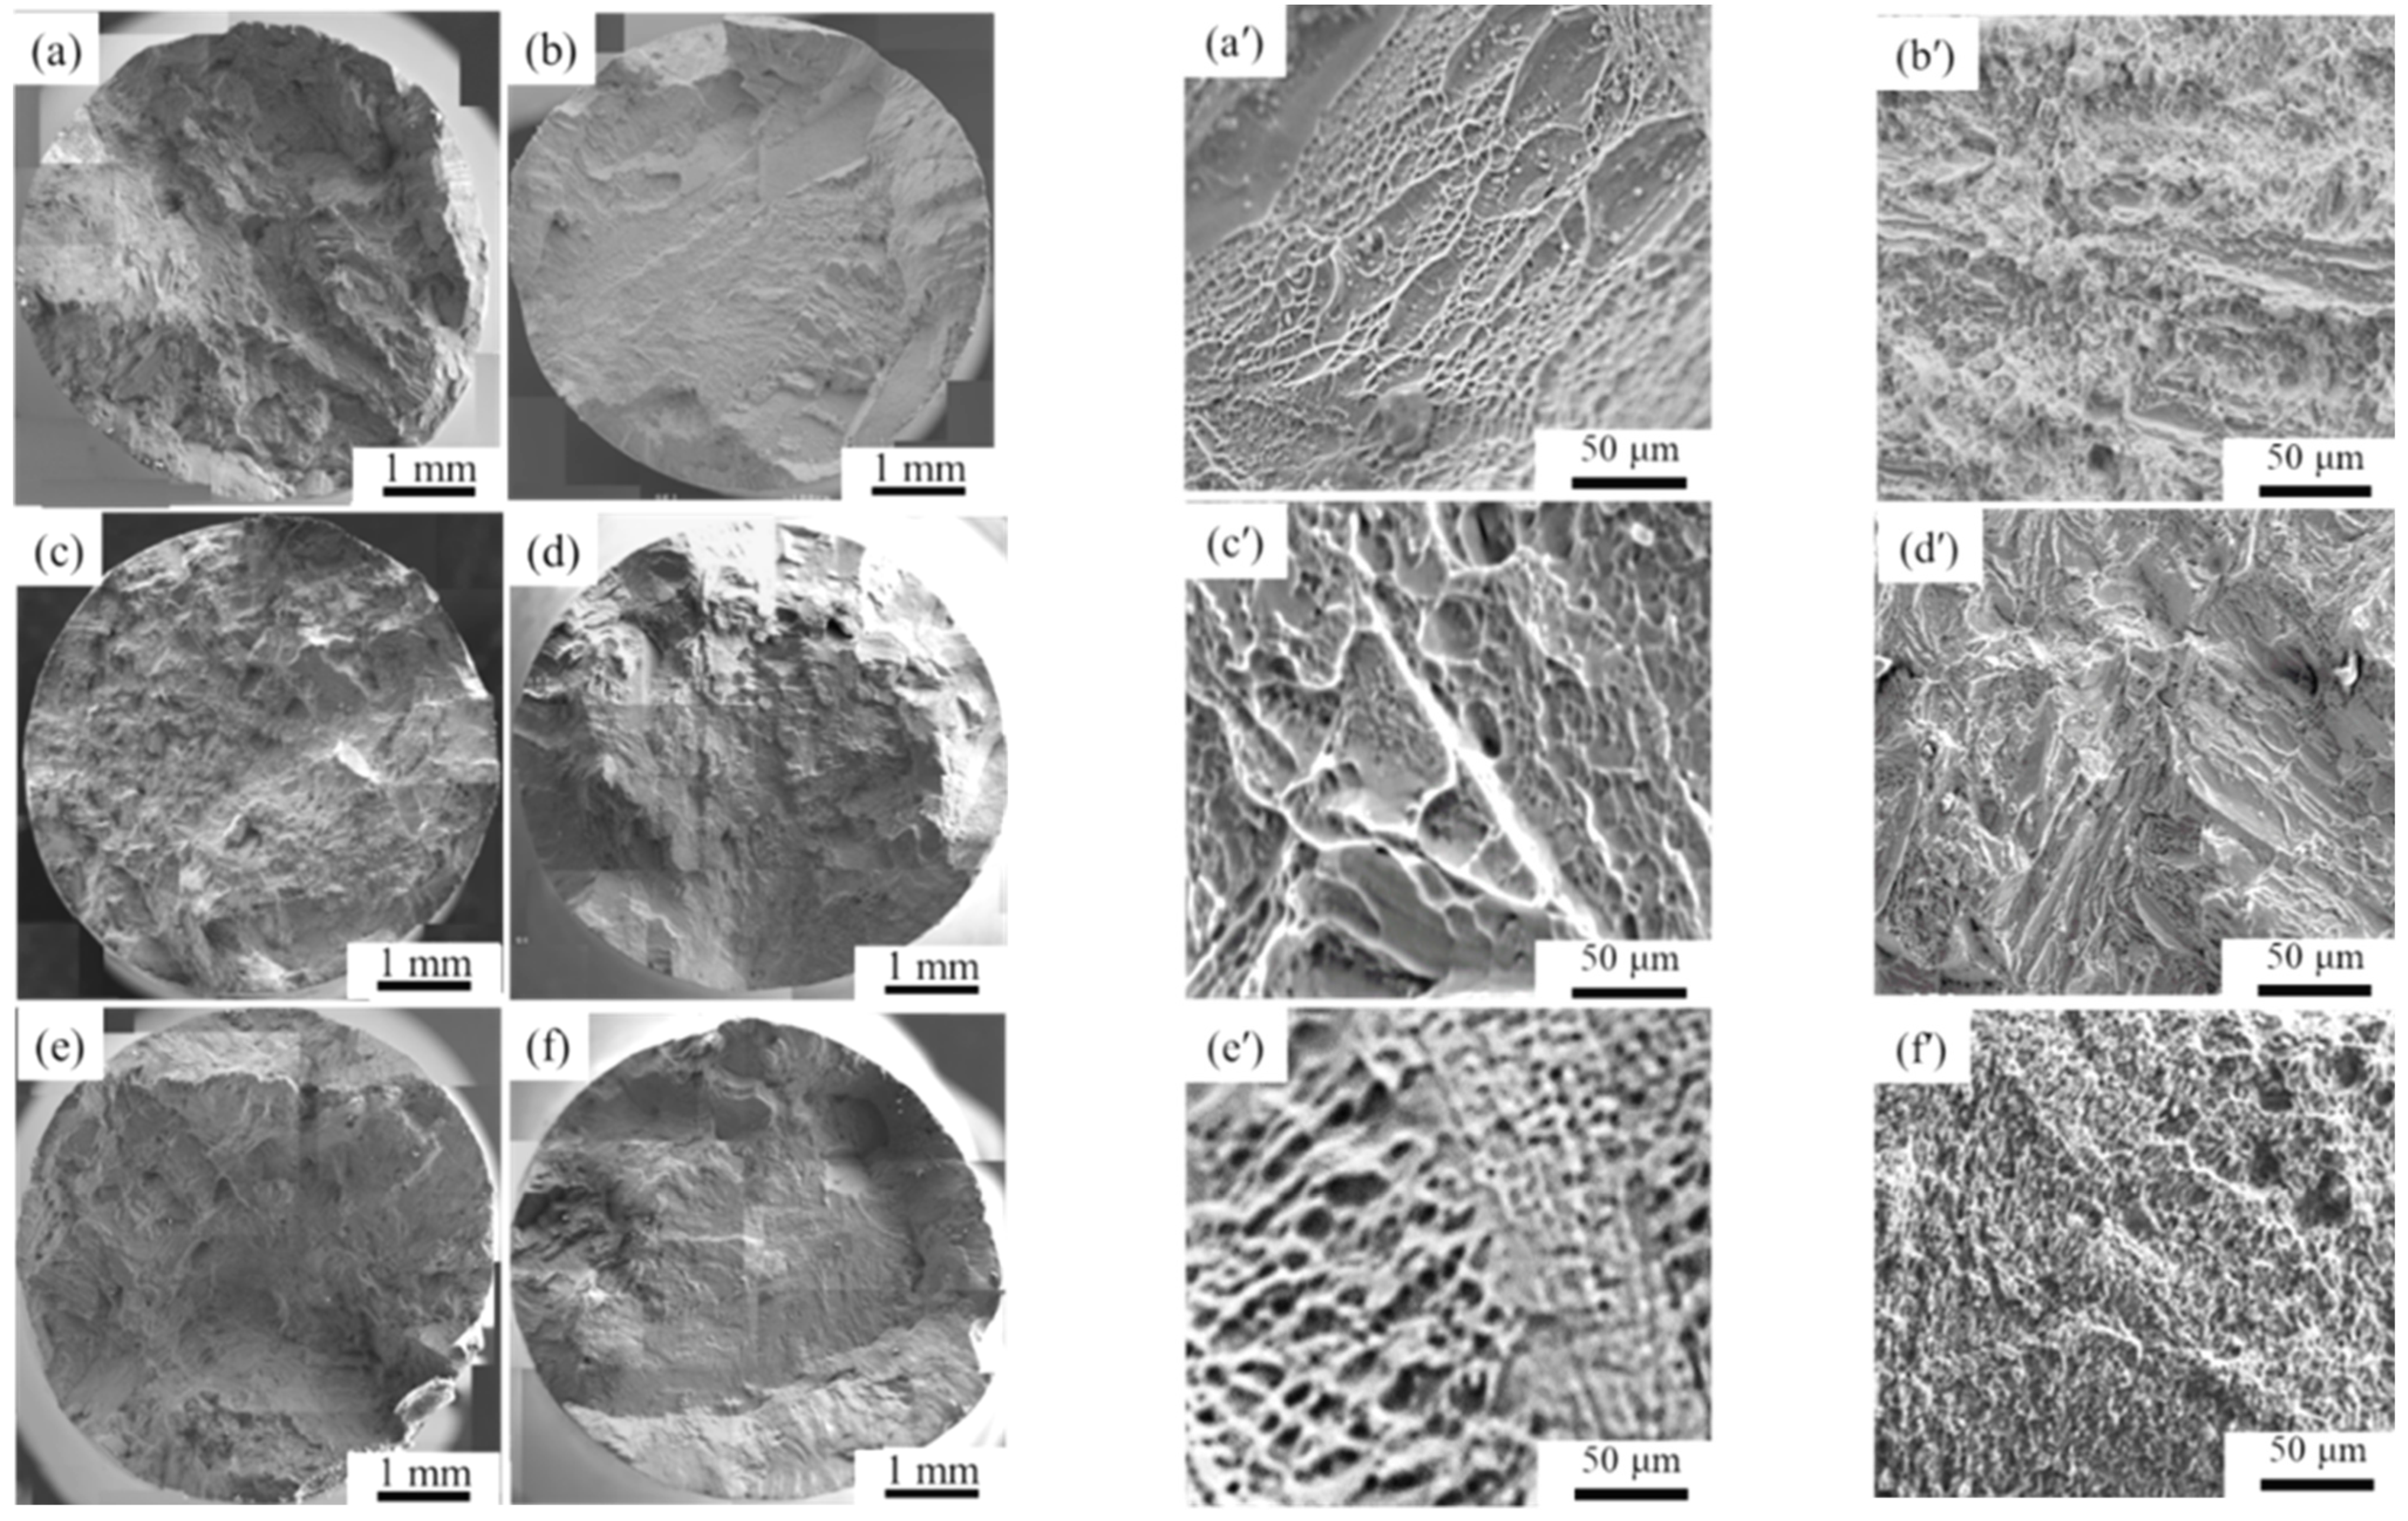
The fracture morphologies of the three near α-Ti alloys were illustrated in Figure 5a–f, with corresponding high magnified images appearing in Figure 5a′–f′. Dimple fracture patterns were observed in the three near α-Ti alloys in their as-cast condition, indicating a satisfactory level of fracture elongation (ɛf). Conversely, brittle fracture patterns were noticed in the three near α-Ti alloys after undergoing solution treatment. As shown in Figure 5b′,d′,f′, the brittle trans-granular fracture patterns were visible in the three near α-Ti alloys, respectively. In the as-cast state, the designed, modified and reference near α-Ti alloys experienced 13.5, 16.7, and 18.3% area reduction at the fracture surface, respectively. The area reduction at fracture for the three near α-Ti alloys was almost negligible in their solution-treated state, corresponding to their inferior tensile behaviors.
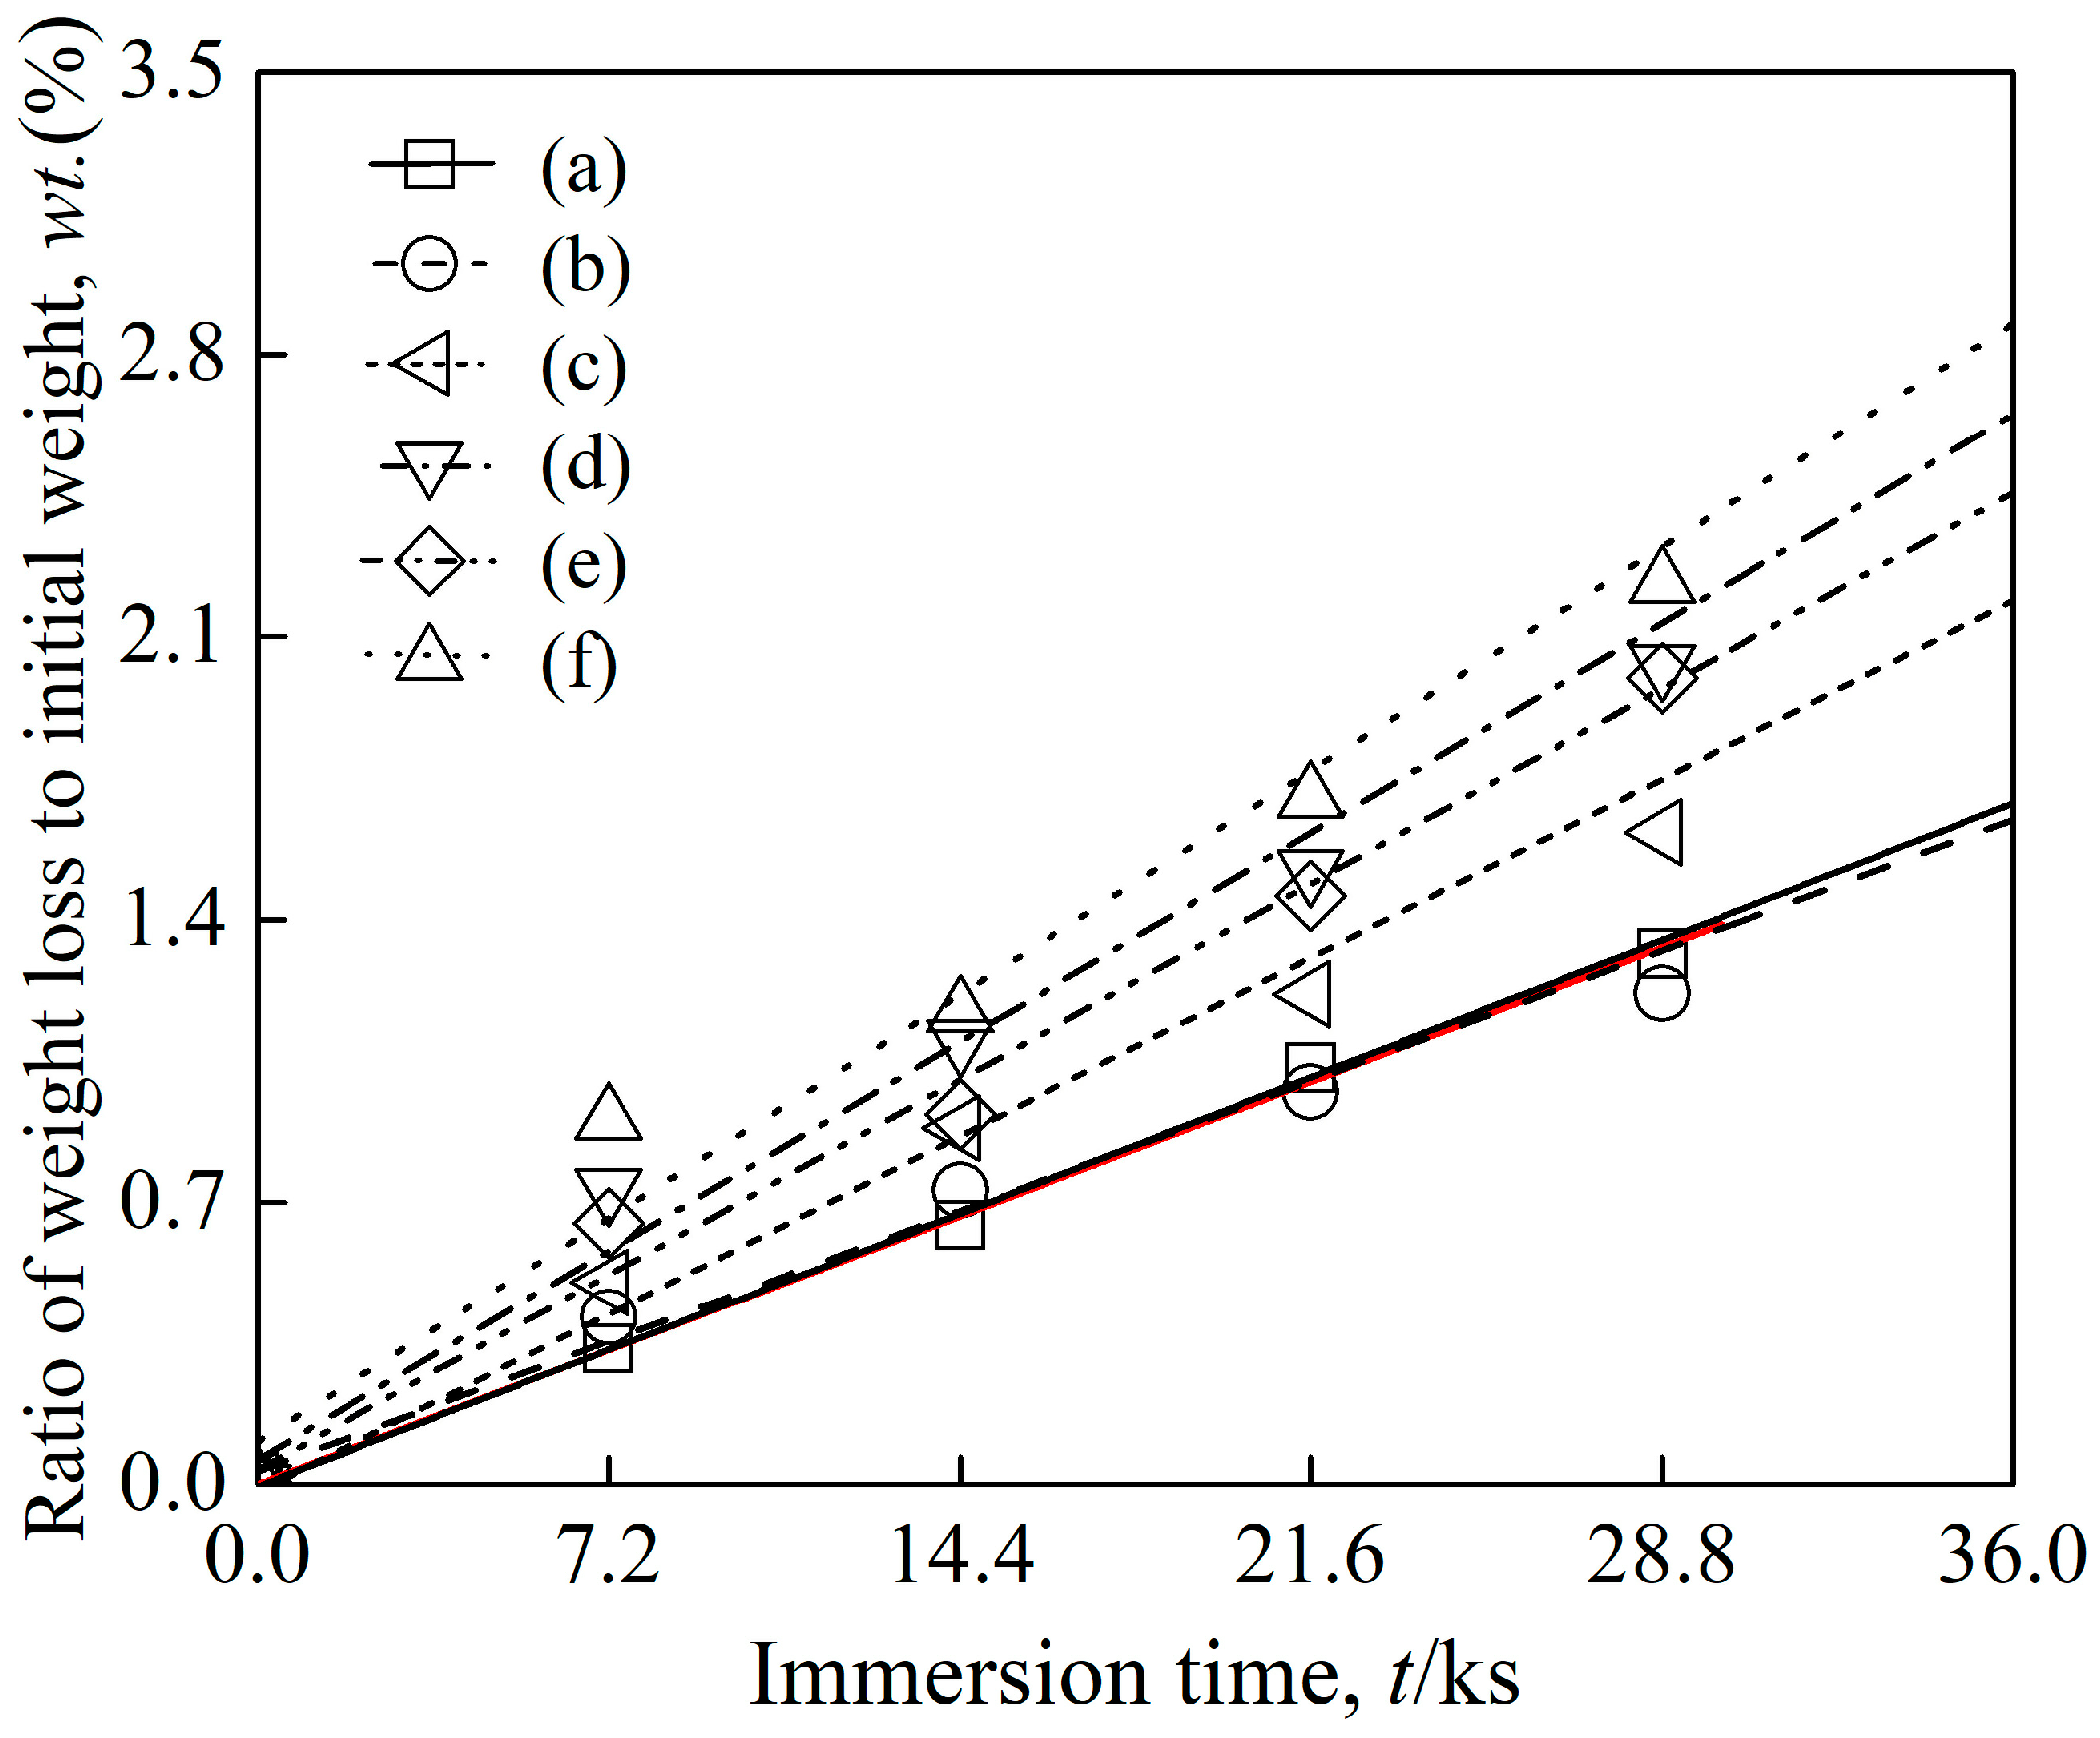
To evaluate the degree of corrosion reaction and the reduction in weight of α-Ti alloys, the ratio of weight loss to initial weight after the 28.8 ks hot salt corrosion test is shown in Figure 6 for the three near α-Ti alloys. The ratio of weight loss of the as-cast designed, modified and reference near α-Ti alloys was 1.31, 1.99 and 2.23% respectively. In addition, the ratio of weight loss of solution-treated near α-Ti alloys was 1.21, 1.61 and 2.03%, respectively. The weight loss ratios of the three near α-Ti at as-cast and after solution treatment showed an approximately linear increase with an increase of corrosion time, with an interval of every 7.2 ks. Moreover, the weight loss ratios of the three solution-treated near α-Ti alloys decreased compared with as-cast specimens, because of the difference in microstructures and phase compositions. The improvement of hot salt corrosion resistance ability of designed and modified alloys compared with reference alloy might result from the different types and quantities of alloying element, such as the addition of different contents of Mo, Zr and Cu elements in alloys [7,8,20].
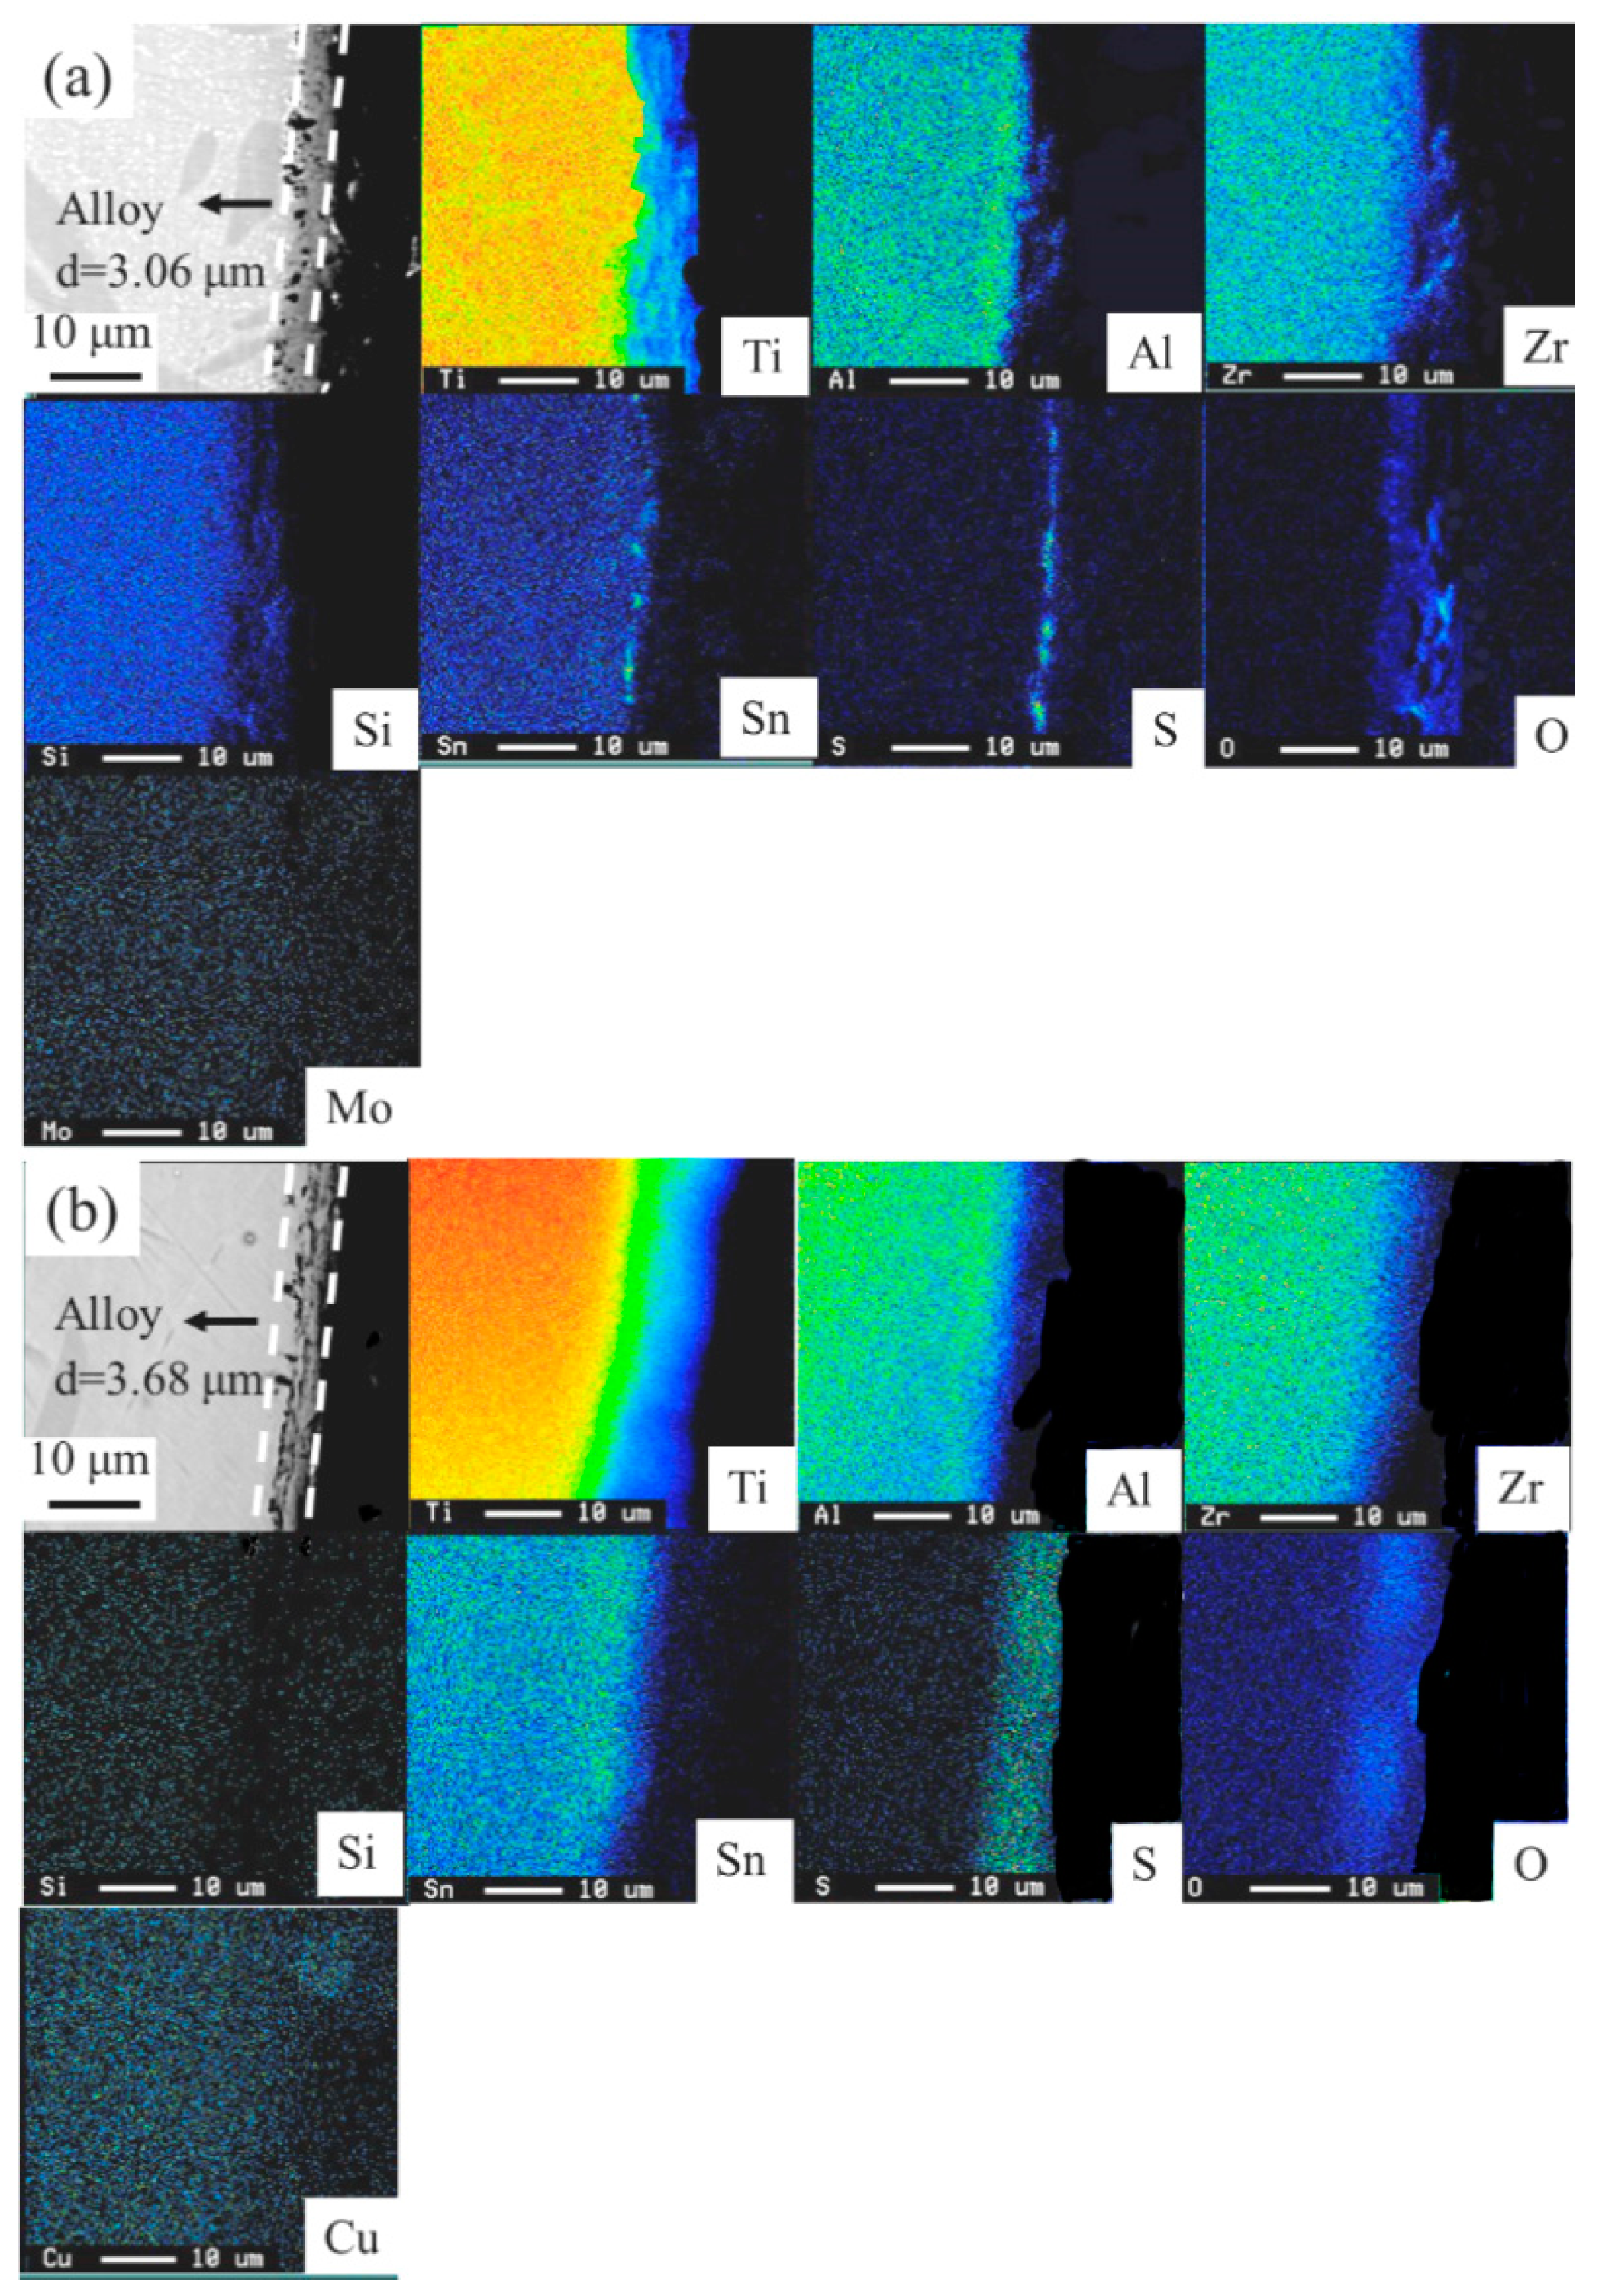
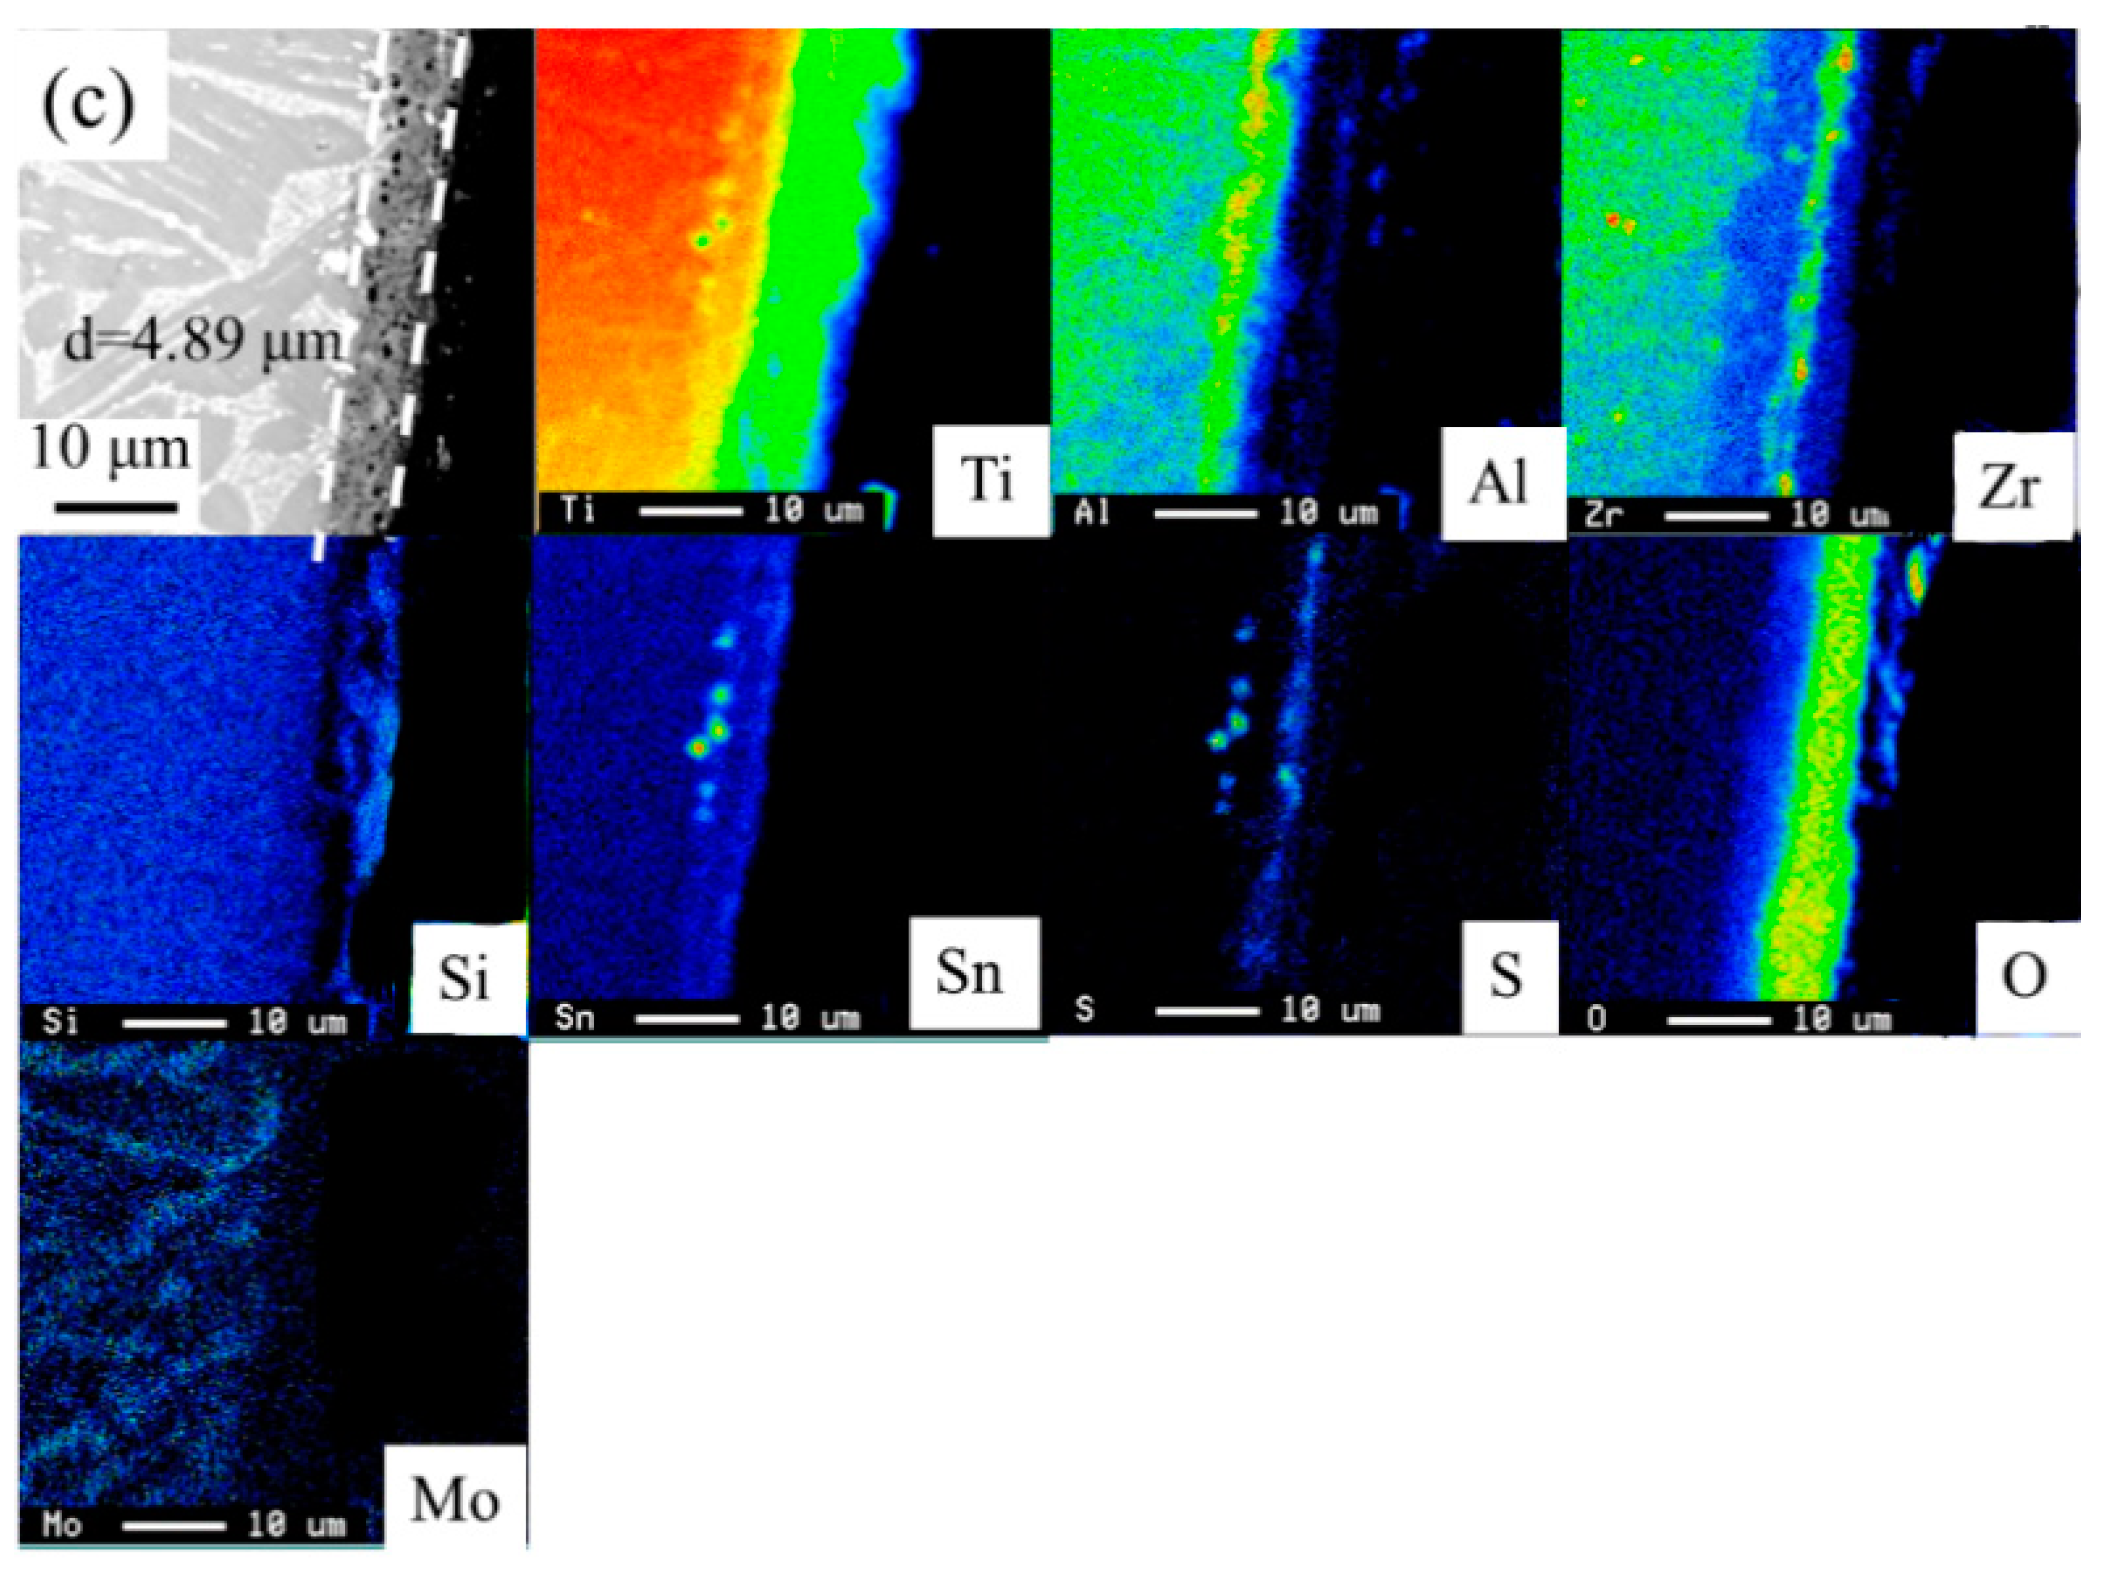
In order to delve deeper into the process of hot salt corrosion reactions and evaluate the dependence of weight loss ratio results, Figure 7 demonstrated the compositional images and EPMA mappings of the three solution-treated near α-Ti alloy alloys after continuous immersion in molten salt for 28.8 ks. The cross-section of the solution-treated specimens indicated the corrosion degrees and the distributions of alloying elements in the respective alloys. The immersion duration was ascertained before the corrosion layer began to shed from the specimen surface. According to the compositional images in Figure 7a–c, the corrosion layers thickness of the three solution-treated near α-Ti alloys were measured at 3.06, 3.68 and 4.89 µm, respectively. Furthermore, based on the EPMA mapping findings, it was observed that reactions occurred at the surface of specimens where near α-Ti alloys were in contact with fused salts. It was discovered that the specimens featured a thick outer oxide layer of oxidation products and a porous inner oxide layer as a result. There was no diffusion behavior of solute elements near or away from the alloy-salt interface, or salt element diffusion into the specimens among three near α-Ti alloys. The different rates of corrosion reactions happened on the entire contact surface between the specimens, and the fused salt was attributed to the following: electrochemical attack in local and concentration-cell corrosion occurred, referring to the corrosion of metal or alloy by a stagnant solution with a small volume [37,38]; severe corrosion occurred in locations where there was little ZrO2 and Al2O3, where chlorine ions encountered little resistance in colliding with titanium oxide [39]; slight corrosion was seen on regions coated by refractory oxides, which exhibited protective behavior. The entire surface of the specimens suffered general corrosion, indicating widespread metal loss throughout the surface. The synergistic effects of alloying elements enhanced the corrosion resistance of the Ti alloys, demonstrating the importance of alloy design and composition in improving the mechanical properties and corrosion resistance of Ti alloys in harsh environments.

4. Conclusions

(1)
The mechanical and corrosion properties of the three near α-Ti alloys, including two newly designed and one commercial near α-Ti alloy, were compared by considering their Bot and Mdt values; the three near α-Ti alloys were fabricated by CCLM with the same processing parameters. The three near α-Ti alloys showed thin films of β phase at the α interfaces in the as-cast condition and acicular α or α’ phase after solution treatment.
(2)
The tensile results indicated that both the designed and modified near α-Ti alloys exhibited comparable mechanical properties to the reference near α-Ti alloy at both as-cast and after solution treatment conditions. The hot salt corrosion test after 28.8 ks revealed that the designed and modified near α-Ti alloys displayed improved hot salt corrosion resistance ability compared to the reference near α-Ti alloy.
(3)
The consideration of d-electrons was a possible approach for the development of new near α-Ti alloys with optimized tensile properties and hot salt corrosion resistance. The modified alloy Ti-10.81%Al-4.80%Zr-1.23%Sn-0.76%Cu-0.35%Si showed σUTS and ɛf values at both as-cast and solution-treated conditions that were 993 and 1354 MPa higher than those of the reference (commercial) alloy. The thickness of corrosion layers of the solution-treated designed, modified and reference near α-Ti alloys after immersion in hot salts for 28.8 ks were measured at 3.06, 3.68 and 4.89 µm.

Author Contributions

X.-L.M.: literature search, figures, study design, data collection, data analysis, data interpretation and writing. K.M.: study design and data analysis. Y.L.: data collection and data analysis. All authors have read and agreed to the published version of the manuscript.

Funding

The authors would like to thank the Natural Science Foundation of Hebei Province of China (E2021210114) and Project of Hebei Province Department of Human Resources and Social Security of China (C20220325) for funding.

Data Availability Statement

The data presented in this study are available on request from the corresponding author. The data are not publicly available due to privacy.

Conflicts of Interest

The authors declare no conflict of interest.

References

  1. Veiga, C.; Davim, J.P.; Loureiro, A.J.R. Properties and Applications of Titanium Alloys: A Brief Review. Rev. Adv. Mater. Sci. 2012, 32, 133–148. Available online: https://www.researchgate.net/publication/283863116_Properties_and_applications_of_titanium_alloys_A_brief_review (accessed on 23 November 2023).
  2. Hardt, S.; Maier, H.J.; Christ, H.-J. High-temperature fatigue damage mechanisms in near-α titanium alloy IMI 834. Int. J. Fatigue 1999, 21, 779–789. [Google Scholar] [CrossRef]
  3. Gurrappa, I. Mechanism of Degradation of Titanium Alloy IMI 834 and its Protection under Hot Corrosion Conditions. Oxid. Met. 2003, 59, 321–332. [Google Scholar] [CrossRef]
  4. Jinwen, L.; Peng, G.; Yongqing, Z. Recent Development of Effect Mechanism of Alloying Elements in Titanium Alloy Design. Rare Met. Mater. Eng. 2014, 43, 0775–0779. [Google Scholar] [CrossRef]
  5. Zhao, Z.; Zhou, R.; Wang, Z.; Cai, J.; Chen, B. High temperature fatigue behavior of a near-alpha titanium alloy. Int. J. Fatigue 2022, 161, 106918. [Google Scholar] [CrossRef]
  6. Fu, B.; Wang, H.; Zou, C.; Wei, Z. The effects of Nb content on microstructure and fracture behavior of near a titanium alloys. Mater. Des. 2016, 106, 371–379. [Google Scholar] [CrossRef]
  7. Cai, C.; Song, B.; Xue, P.; Wei, Q.; Yan, C.; Shi, Y. A novel near α-Ti alloy prepared by hot isostatic pressing: Microstructure evolution mechanism and high temperature tensile properties. Mater. Des. 2016, 106, 371–379. [Google Scholar] [CrossRef]
  8. Akbarpour, M.R.; Mirabad, H.M.; Hemmati, A.; Kim, H.S. Processing and microstructure of Ti-Cu binary alloys: A comprehensive review. Prog. Mater. Sci. 2022, 127, 100933. [Google Scholar] [CrossRef]
  9. Liang, C.P.; Gong, H.R. Fundamental Influence of Hydrogen on Various Properties of α-Titanium. Int. J. Hydrogen Energy 2010, 35, 3812–3816. [Google Scholar] [CrossRef]
  10. Joost, W.J.; Ankem, S.; Kuklja, M.M. Interaction between oxygen interstitials and deformation twins in alpha-titanium. Acta Mater. 2016, 105, 44–51. Available online: https://www.sciencedirect.com/science/article/abs/pii/S1359645415301282#:~:text=Oxygen%20%28O%29%20has%20up%20to%2033%20at%25%20solubility,the%20shearing%2Fshuffling%20process%20associated%20with%20twin%20growth%20%5B7%5D (accessed on 20 November 2023). [CrossRef]
  11. Matsugi, K.; Kashiwagi, T.; Choi, Y. Property-Control of TiNi System Intermetallics and Their Characteristics. Mater. Trans. 2011, 52, 2189–2196. Available online: https://www.jstage.jst.go.jp/article/matertrans/52/12/52_F-M2011827/_article (accessed on 23 November 2023). [CrossRef]
  12. Ma, X.L.; Matsugi, K.; Xu, Z.F. Possibility of As-Cast Applications on β-Type Titanium Alloys Proposed in the Newly Expanded Area of Bot-Mdt Diagram. Mater. Trans. 2020, 61, 740–749. Available online: https://www.jstage.jst.go.jp/article/matertrans/61/4/61_F-M2020803/_article/-char/en (accessed on 23 November 2023). [CrossRef]
  13. Morinaga, M.; Yukawa, N.; Maya, T. Theoretical Design Of Titanium-Alloys. In Proceedings of the 6th World Conference on Titanium, TMS, Cannes, France, 6–9 June 1988; pp. 1601–1606. Available online: https://xueshu.baidu.com/usercenter/paper/show?paperid=3469458852026c21a0fe7a145cb8be3f (accessed on 23 November 2023).
  14. Ma, X.L.; Matsugi, K.; Xu, Z.F. Applicability of As-Cast on β Type Titanium Alloys Proposed in the Compositional Region with Different Tensile Deformation Types. Mater. Trans. 2019, 60, 2426–2434. Available online: https://www.jstage.jst.go.jp/article/matertrans/60/11/60_F-M2019848/_article/-char/en (accessed on 23 November 2023). [CrossRef]
  15. Matsugi, K.; Kishimoto, H.; Yamakawa, D.; Xu, Z.F.; Choi, Y.B. Mater. Compositional Optimization of β Type Titanium Alloys with Shape Memory Ability and Their Characteristics. Mater. Trans. 2015, 56, 1747–1755. [Google Scholar] [CrossRef]
  16. Minghang, L.; Yong, G.; Gang, L.; Ziyan, G.; Xue, R.; Shijiang, X. Uncovering spatiotemporal evolution of titanium in China: A dynamic material flow analysis. Resour. Conserv. Recycl. 2022, 180, 106166. [Google Scholar] [CrossRef]
  17. Li, C.C.; Xin, C.; Wang, Q.; Ren, J.Q.; Zhao, B.; Wu, J.P.; Pan, X.L.; Lu, X.F. A novel low-cost high-strength β titanium alloy: Microstructure evolution and mechanical behavior. J. Alloys Compd. 2023, 959, 170497. [Google Scholar] [CrossRef]
  18. Guo, Y.H.; Niu, J.Z.; Cao, J.X.; Sun, Z.G.; Dan, Z.H.; Chang, H. Relative strength of β phase stabilization by transition metals in titanium alloys: The Mo equivalent from a first principles study. Mater. Today Commun. 2023, 35, 106123. [Google Scholar] [CrossRef]
  19. Zhang, M.; Tang, B.; Wang, L.M.; Li, K.D.; Yin, B.Q.; Zhang, Z.H.; Li, J.H. Investigation of strain partition behavior in the lamellar microstructure of dual-phase titanium alloy based on crystal plasticity simulations. Mater. Sci. Eng. A 2023, 880, 145321. [Google Scholar] [CrossRef]
  20. Sidhu, S.S.; Singh, H.; Gepreel, M.A.-H. A review on alloy design, biological response, and strengthening of β-titanium alloys as biomaterials. Mater. Sci. Eng. C 2021, 121, 111661. [Google Scholar] [CrossRef]
  21. Wang, Q.; Dong, C.; Liaw, P.K. Structural Stabilities of β-Ti Alloys Studied Using a New Mo Equivalent Derived from [β/(α+β)] PhaseBoundary Slopes. Metall. Mater. Trans. A 2015, 46, 3440–3447. [Google Scholar] [CrossRef]
  22. Gouthamraj, K.; Venkatesan, S. A review on β-Ti alloys for biomedical applications: The influence of alloy composition and thermomechanical processing on mechanical properties, phase composition, and microstructure. Sage J. 2022, 237, 1251–1294. [Google Scholar] [CrossRef]
  23. Boraei, N.F.E.; Ibrahim, M.A.; Rehim, S.S.A.E.; Elshamy, I.H. Electrochemical corrosion behavior of β-Ti alloy in a physiological saline solution and the impact of H2O2 and albumin. J. Solid State Electrochem. 2023. [Google Scholar] [CrossRef]
  24. Elshamy, I.H.; Ibrahim, M.A.M.; Abdel Rehim, S.S. Electrochemical Characteristics of a Biomedical Ti70Zr20Nb7.5Ta2.5 Refractory High Entropy Alloy in an Artificial Saliva Solution. J. Bio Tribo Corros. 2023, 9, 10. [Google Scholar] [CrossRef]
  25. Xiao, X.; Yang, K.; Lei, S.; Zhang, D.; Guo, L.; Dai, Y.; Lin, J. A β-type titanium alloy with high strength and low elastic modulus achieved by spinodal decomposition. J. Alloys Compd. 2023, 963, 171270. [Google Scholar] [CrossRef]
  26. Morinaga, M.; Saito, J.; Morishita, M. Design of titanium alloys by means of a d-electrrons theory. Light Met. 1992, 42, 614–621. [Google Scholar] [CrossRef]
  27. Masao, M.; Masahiro, C.; Yoshio, A.; Masahiko, M.; Natsuo, Y.; Hirohiko, A. Electronic States of the Cathodes of Titanium-based Alloys in Aqueous Corrosion. Mater. Trans. 1991, 32, 264–271. [Google Scholar] [CrossRef]
  28. Jiang, X.J.; Zhou, Y.K.; Feng, Z.H. Influence of Zr content on β-phase stability in α-type Ti–Al alloys. Mater. Sci. Eng. A 2015, 639, 407–411. [Google Scholar] [CrossRef]
  29. Laheurte, P.; Prima, F.; Eberhardt, A. Mechanical properties of low modulus β titanium alloys designed from the electronic approach. J. Mech. Behav. Biomed. Mater. 2010, 3, 565–573. [Google Scholar] [CrossRef]
  30. Morinaga, M. Alloy Design Based on Molecular Orbital Method. Mater. Trans. 2016, 57, 213–226. [Google Scholar] [CrossRef]
  31. Ramachandra, C.; Singh, A.K.; Sarma, G.M.K. Microstructural Characterisation of near α-Ti Alloy Ti-6Al-4Sn-4Zr-0.70Nb-0.50Mo-0.40Si. Metall. Trans. A 1993, 24, 1273–1280. [Google Scholar] [CrossRef]
  32. Sridhar, G.; Arma, D.S. Structure and Properties of a Near-α Titanium Alloy After β Solution Treatment and Aging at 625 °C. Metall. Trans. A 1988, 19, 3025–3033. [Google Scholar] [CrossRef]
  33. Guo, G.S.; Meng, Q.; Cheng, X.; Zhao, X. α′ martensite Ti–10Nb–2Mo–4Sn alloy with ultralow elastic modulus and High strength. Mater. Lett. 2014, 133, 236–239. [Google Scholar] [CrossRef]
  34. Eylon, D.; Fujishiro, S.; Postans, P.J.; Froes, F.H. High-Temperature Titanium Alloys-A Review. J. Met. 1984, 11, 55–62. [Google Scholar] [CrossRef]
  35. Leyens, C.; Peters, M. Titanium and Titanium Alloys. Fundamentals and Applications; Wiley-VCH Verlag GmbH & Co. KGaA: Weinheim, Germany, 2003; pp. 1–36. [Google Scholar]
  36. Zhao, E.; Sun, S.; Zhang, Y. Recent advances in silicon containing high temperature titanium alloys. J. Mater. Res. Technol. 2021, 14, 3029–3042. [Google Scholar] [CrossRef]
  37. Weck, A.; Wilkinson, D.S.; Maire, E. Observation of void nucleation, growth and coalescence in a model metal matrix composite using X-ray tomography. Mater. Sci. Eng. A 2008, 488, 435–445. [Google Scholar] [CrossRef]
  38. Myers, J.R.; Bomberger, H.B.; Froes, F.H.E. Corrosion Behavior and Use of Titanium and Its Alloys. J. Miner. Met. Mater. Soc. 1984, 36, 50–60. [Google Scholar] [CrossRef]
  39. Dai, J.J.; Zhu, J.Y.; Chen, C.H.; Weng, F. High temperature oxidation behavior and research status of modifications on improving high temperature oxidation resistance of titanium alloys and titanium aluminides: A review. J. Alloys Compd. 2016, 685, 784–798. [Google Scholar] [CrossRef]
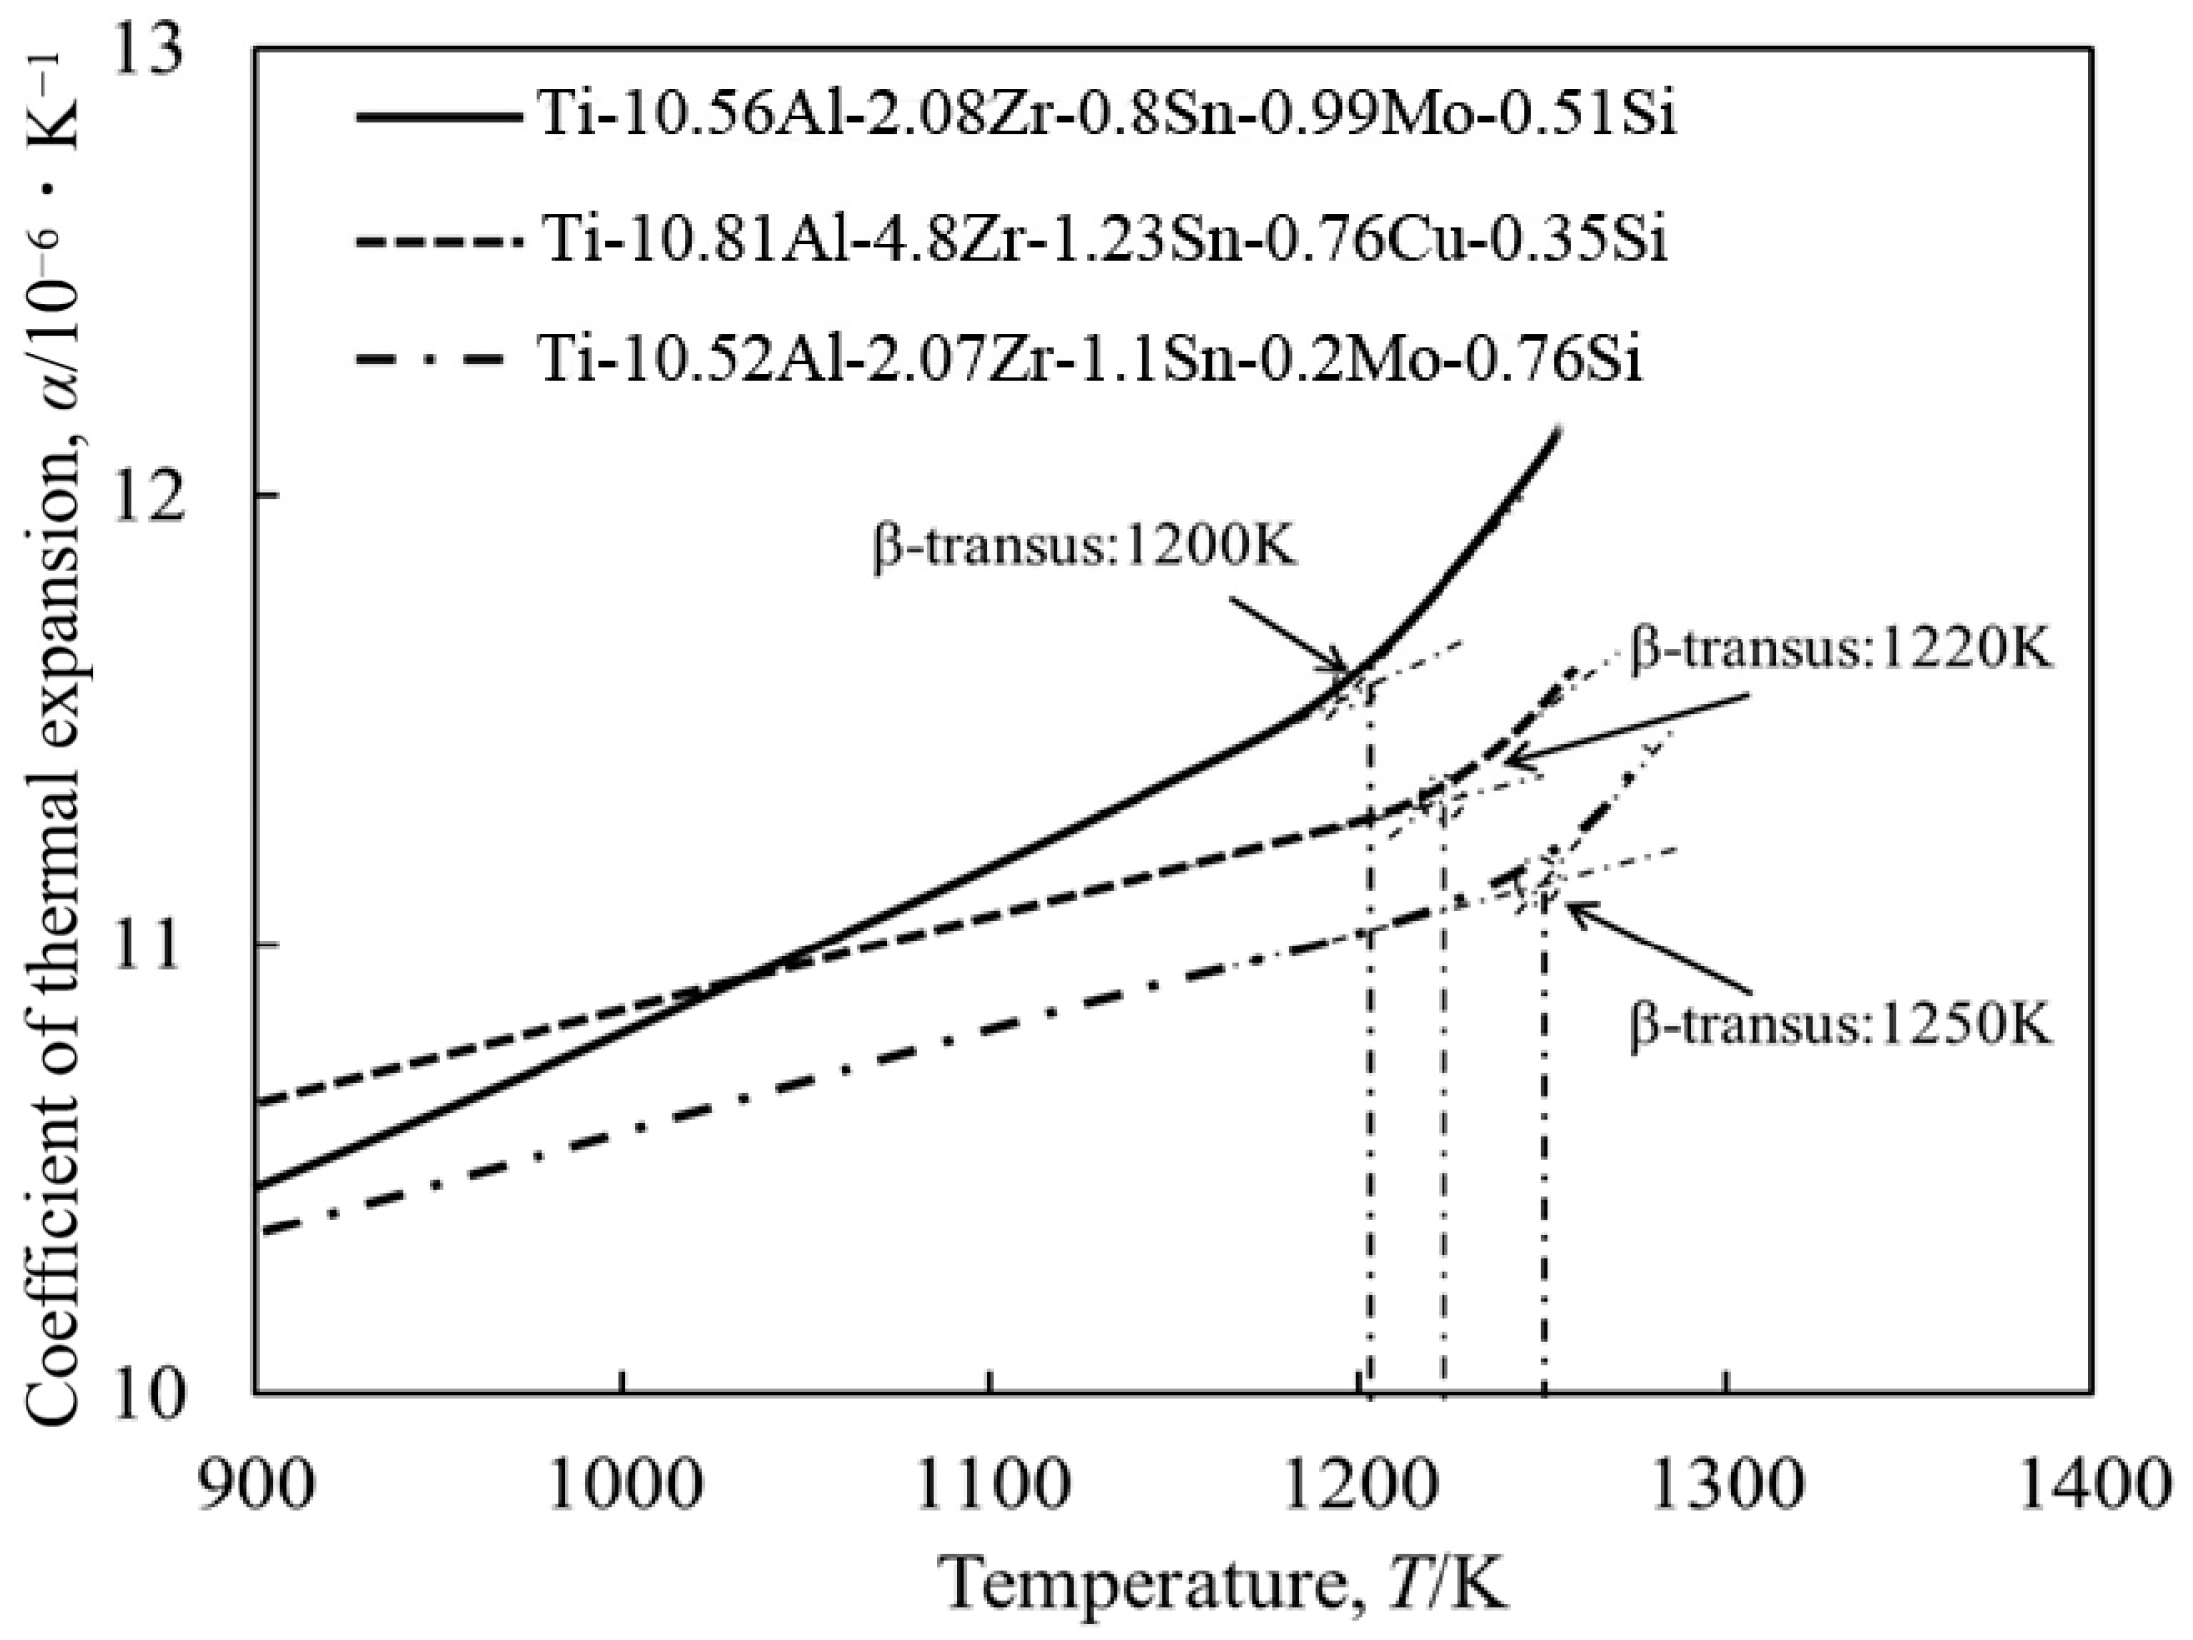
Figure 1. Coefficient of thermal expansion of the three near α-Ti alloys.
Metals 14 00081 g001
Figure 2. OM images for (a,d) of Ti-10.56%Al-2.08%Zr-0.80%Sn-0.88%Mo-0.51%Si, (b,e) of Ti-10.81%Al-4.80%Zr-1.23%Sn-0.76%Cu-0.35%Si, and (c,f) of Ti-10.52%Al-2.07%Zr-1.1%Sn-0.2%Mo-0.76%Si near α-Ti alloys in as-cast and solution-treated conditions, and (g,h) are the higher magnifications of (b,e), respectively.
Metals 14 00081 g002
Figure 3. XRD profiles of (a,b) Ti-10.56%Al-2.08%Zr-0.80%Sn-0.88%Mo-0.51%Si, (c,d) Ti-10.81%Al-4.80%Zr-1.23%Sn-0.76%Cu-0.35%Si and (e,f) Ti-10.52%Al-2.07%Zr-1.1%Sn-0.2%Mo-0.76%Si alloys in as-cast and solution-treated conditions.
Metals 14 00081 g003
Figure 4. Stress–strain curves of Ti-10.56%Al-2.08%Zr-0.80%Sn-0.88%Mo-0.51%Si, Ti-10.81%Al-4.80%Zr-1.23%Sn-0.76%Cu-0.35%Si and Ti-10.52%Al-2.07%Zr-1.1%Sn-0.2%Mo-0.76%Si alloys in (a) as-cast and (b) solution-treated conditions.
Metals 14 00081 g004
Figure 5. Fractographies of (a,b) for Ti-10.56%Al-2.08%Zr-0.80%Sn-0.88%Mo-0.51%Si, (c,d) for Ti-10.81%Al-4.80%Zr-1.23%Sn-0.76%Cu-0.35%Si and (e,f) for Ti-10.52%Al-2.07%Zr-1.1%Sn-0.2%Mo-0.76%Si alloys in as-cast and solution-treated conditions with corresponding high magnified images of tensile specimens of (a′,b′) for Ti-10.56%Al-2.08%Zr-0.80%Sn-0.88%Mo-0.51%Si, (c′,d′) for Ti-10.81%Al-4.80%Zr-1.23%Sn-0.76%Cu-0.35%Si and (e′,f′) for Ti-10.52%Al-2.07%Zr-1.1%Sn-0.2%Mo-0.76%Si alloys in as-cast and solution-treated conditions, respectively.
Metals 14 00081 g005
Figure 6. Relationship between the duration and weight loss ratios of the three as-cast and solution-treated near α-Ti alloys immersed in molten salt at a temperature of 923 K for (a,b) of Ti-10.56%Al-2.08%Zr-0.80%Sn-0.88%Mo-0.51%Si, (c,d) of Ti-10.81%Al-4.80%Zr-1.23%Sn-0.76%Cu-0.35%Si and (e,f) of Ti-10.52%Al-2.07%Zr-1.1%Sn-0.2%Mo-0.76%Si, respectively.
Metals 14 00081 g006
Figure 7. Compositional images of corrosion interface of solution-treated (a) Ti-6Al-2Sn-5Zr-1Mo-0.3Si, (b) Ti-10.81%Al-4.80%Zr-1.23%Sn-0.76%Cu-0.35%Si and (c) Ti-10.52%Al-2.07%Zr-1.1%Sn-0.2%Mo-0.76%Si near-α alloys after immersion in molten salts for 28.8 ks and EPMA mappings showing the distribution of alloying elements.
Metals 14 00081 g007aMetals 14 00081 g007b
Disclaimer/Publisher’s Note: The statements, opinions and data contained in all publications are solely those of the individual author(s) and contributor(s) and not of MDPI and/or the editor(s). MDPI and/or the editor(s) disclaim responsibility for any injury to people or property resulting from any ideas, methods, instructions or products referred to in the content.