Article

Investigation of Surface Integrity of Conical Hole in Laser Polishing 440C Stainless Steel

1
School of Mechanical Engineering, Shandong University, Jinan 250014, China
2
Key National Demonstration Center for Experimental Mechanical Engineering Education/Key Laboratory of High Efficiency and Clean Mechanical Manufacture of MQE, Jinan 250014, China
*
Author to whom correspondence should be addressed.
Metals 2024, 14(1), 58; https://doi.org/10.3390/met14010058
Submission received: 29 November 2023 / Revised: 25 December 2023 / Accepted: 28 December 2023 / Published: 3 January 2024
(This article belongs to the Section Metal Casting, Forming and Heat Treatment)

Abstract

:
In the machining process of 440C stainless steel using ball-end milling, the generation of machined traces is an inevitable outcome. Traditional polishing methods, when applied to the milling surfaces of small conical holes, exhibit significant limitations. However, the application of nanosecond pulsed laser polishing while maintaining dimensional integrity has proven effective in mitigating these issues. The parameters for the laser and scanning strategy were empirically determined through planar experiments. The results showed a reduction in surface roughness to a minimum value, representing a decrease of approximately 41.7%. Further validation experiments were conducted on the ball-milled surface of small conical holes. The rate of roughness reduction in these experiments surpassed that of planar surface polishing with an improvement of approximately 73.6%. The scanning strategy’s applicability was confirmed, and the post-polishing surface morphology was found to be largely in line with the prediction. The remelt layer and heat-affected zone resulting from nanosecond laser polishing were observed to be below 5 μm, significantly preserving the dimensional integrity of the conical hole’s internal surface. Moreover, nanosecond laser polishing was found to substantially enhance the surface hardness of the material, with an increase ranging from 100% to 180%. This study underscores the efficacy of nanosecond laser polishing in enhancing the internal surface of small conical holes, thereby improving the surface properties. Consequently, this method presents a reliable solution for the removal of machined traces from complex internal surfaces.

1. Introduction

Micro-milling is an indispensable technique in the fabrication of miniature components. However, the process invariably results in the formation of machined traces and minute burrs, particularly in the context of ball-end milling [1,2,3]. The 440C stainless steel, known for its superior plasticity, is frequently employed in the production of components such as micronozzles, valves, bearings, and precision scalpels. Despite its advantage, 440C, being one of the hardest types of stainless steel, is susceptible to the formation of machining traces and small burrs on the milled surface. This leads to elevated surface roughness, which can compromise the operational efficiency of the miniature components. As a result, components machined from 440C stainless steel surface parts typically necessitate a polishing process to ensure optimal performance. The polishing process aids in the reduction in surface roughness and the removal of machining traces and burrs, thereby enhancing the functional characteristics of the components.
For intricate internal surfaces such as those found in micronozzles and similar components, traditional polishing techniques, including mechanical, chemical, electrochemical, and abrasive flow polishing, often fail to deliver optimal results or suffer from low efficiency [4,5]. Chemical and electrochemical polishing can achieve comprehensive polishing effects on the internal surfaces of minuscule conical holes [6,7,8]. However, these methods result in a material loss of up to several tens of microns, which significantly compromises the dimensional integrity of the tiny conical holes. Abrasive flow polishing is a viable alternative for internal surface polishing of components [9,10,11], and the process is time-consuming and requires a substantial duration to achieve a satisfactory surface finish. Laser polishing, on the other hand, offers numerous advantages, such as high efficiency, non-pollution, and the ability to selectively polish specific areas [12,13,14]. It has also demonstrated effectiveness on inclined surfaces and complex surface geometry [15,16,17]. In the context of internal surface polishing of small conical holes, laser polishing not only circumvents the uncertainties associated with contact-based polishing mediums but also enhances polishing efficiency. Therefore, laser polishing is a more suitable technique for polishing the internal surface of micro-milled 440C stainless steel small conical holes.
Laser polishing can be broadly classified into two categories based on the type of laser used, pulse and continuous. The primary mechanisms employed for surface roughness reduction are Shallow Surface Melting (SSM) and Surface Over Melting (SOM). In the SSM region, due to the capillary force and the curvature of the liquid surface, a portion of the molten metal on the surface flows toward and fills the surface valleys [18,19]. The thickness of the melt zone (MZ), in this case, is less than the peak–valley distance. However, as the laser energy density increases, the thickness of the melt pool surpasses the peak-to-valley distance, causing the entire metal surface to enter the melt pool. This is referred to as SOM. When comparing continuous laser polishing with pulse laser polishing, the latter can maintain the polishing process in SSM with a lower power output [20]. Therefore, pulse laser polishing, which is predominantly governed by SSM, is typically employed for surfaces with minor initial roughness. In contrast, continuous laser polishing, where SOM is the prevalent mechanism, is generally applied to surfaces with significant initial roughness [21]. Given these considerations, pulse laser polishing dominated by SSM is deemed suitable for internal surface polishing of small conical holes.
Numerous studies have been undertaken on the application of pulse laser polishing on various materials, including steel [22,23,24], titanium alloy [25,26], and other alloys [27,28], yielding promising results. Chen et al. [29] performed laser polishing experiments on ASP23 steel surfaces exhibiting low roughness using a picosecond pulse laser. These findings indicated that picosecond lasers can significantly mitigate the thermal deformation of the workpiece. However, their efficiency is inferior to that of nanosecond laser polishing, rendering them suitable only for enhancing surface accuracy in situations of low initial roughness. Yi et al. [30] implemented pulsed laser polishing on nickel-based alloys, resulting in an increase in the surface roughness Ra from 0.702 μm to 0.354 μm. By examining the impact of polishing frequency and scanning speed on the polishing process, they achieved high-quality and efficient laser polishing of nickel-based alloys. Yao et al. [31] investigated the polishing mechanism of a nanosecond pulse laser on wire-cut surfaces with high roughness. They observed that the smoothness of narrow convex peaks on the surface led to a roughness reduction of up to 74.9%. However, the inability to smooth macroscopic surface fluctuations restricted further reduction in roughness. Jaritngam et al. [32] conducted nanosecond laser polishing on the surfaces of additively manufactured Ti6Al4V parts with varying morphologies and roughness exceeding 10 μm. They studied the effects of initial surface roughness, laser parameter scanning strategy, and argon flow rate on surface roughness and morphology. Under appropriate polishing conditions, the roughness of the laser-polished surface was reduced by 73%.
Despite the successful application of pulsed laser polishing in previous studies, these were predominantly conducted on flat materials. The transferability of these experimental results to complex geometric surfaces remains unexplored. Specifically, the unique advantages of Shallow Surface Melting (SSM) generated by pulsed lasers in polishing the internal surfaces of tiny conical holes have not been comprehensively analyzed. This study conducted nanosecond pulse laser polishing on the high roughness surface of 440C stainless steel post-micro-milling. Through a series of experiments, we established a correlation between the polishing effect and the laser parameters. Utilizing the dynamic focusing function of the galvanometer, we achieved path projection on the tracing surface, thereby reinforcing the correlation between the flat surface and the conical surface in laser polishing via energy density. The optimized polishing parameters and strategies were applied to the inner surface polishing of small cone holes to verify its feasibility and enhance the efficiency of the inner surface treatment of small conical holes. Furthermore, an evaluation of microhardness, residual stress, microstructure, and surface elements of 440C stainless steel polished by nanosecond laser in an atmospheric environment was performed.

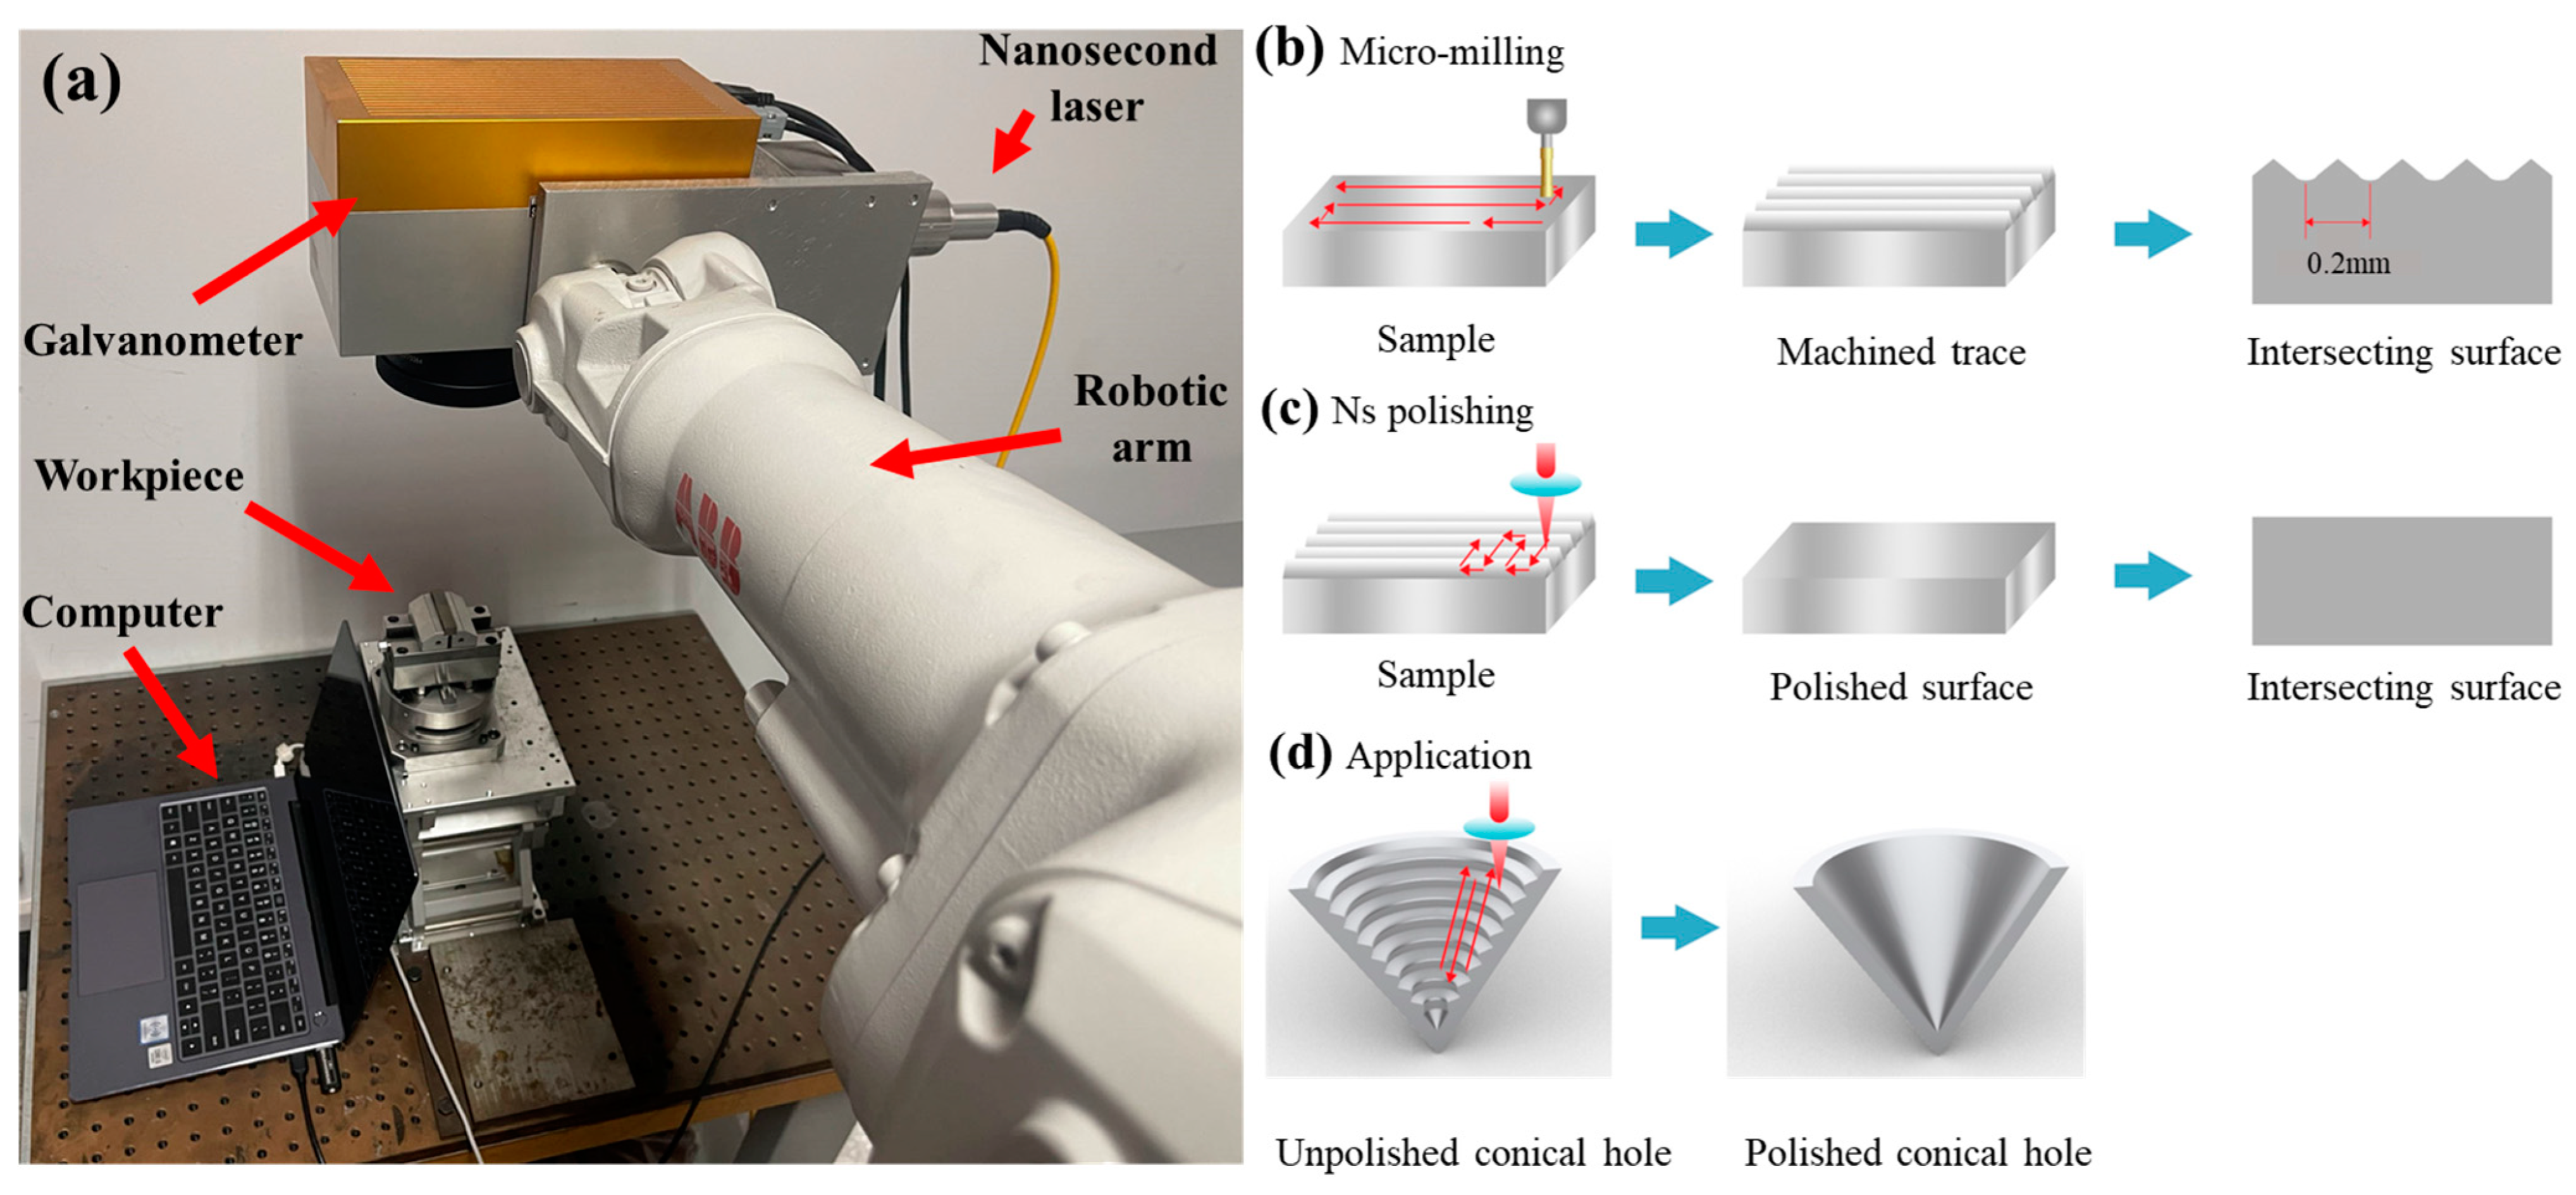
2. Experimental Setup

2.1. Materials and Experimental Procedure

The 440C stainless steel was used as the experimental material in the form of a rectangular block (50 × 20 × 10 mm3). Table 1 shows the chemical elements in the 440C samples [33]. For the 440C stainless steel, the substrate hardness was 244.7 HV. The laser polishing process utilized an infrared nanosecond laser (IPG, Oxford, MA, USA) with a Gaussian beam output. The specific parameters of the laser are presented in Table 2. A three-dimensional (3D) galvanometer (Beijing JCZ Technology, Beijing, China) fixed to the robotic arm (ABB, Zurich, Switzerland) was employed to move the laser beam in the horizontal direction, and the focus of the spot was maintained when the surface was moving according to the 3D modeling imported software to complete the laser polishing process (Figure 1a).
A micro-milling machine was used to cut the surface with high roughness, and a plane milling cutter (NS Tool, Tokyo, Japan) with a diameter of 4 mm was used to obtain a smooth surface. A ball-end milling cutter (NS Tool, Tokyo, Japan) with a diameter of 0.8 mm was employed to obtain the preset surface with machine trace (Figure 1b). According to the parameters commonly used in 440C machining and the machining characteristics of micro ball-end milling, the milling experiment parameters were proposed. Table 3 displays the parameters of ball-end milling. Ultrasonic cleaning was carried out on the surface after ball-end milling. The path of laser scanning was extended perpendicular to the direction of micro-milling residues, presenting an s-shaped cross-scanning path. The laser beam radius was set as the path overlap width to ensure comprehensive scanning of the material surface. The laser beam diameter was determined based on the focal offset distance. Figure 1c,d shows the laser polishing process and its application to the internal surface polishing of small conical holes. The small cone hole has a diameter of 1 mm, a depth of 0.75 mm, and a taper of 60°.

2.2. Laser Polishing Experiment

The samples were polished with a nanosecond pulse laser with different parameters in an area (10 × 10 mm2). After polishing, the effects of various laser factors on surface roughness were determined to identify the optimal set of parameters. To explore the effects of different parameters on surface roughness, preliminary experiments and the melting characteristics of stainless steel 440C [34] were conducted to randomly assign laser parameters within the appropriate range, and an orthogonal experimental table (Table 4) was established in which P was the laser power (W); V was the scanning speed (mm/s); f was the repetition frequency (kHz); FOD was the focal offset distance (mm), and ED was the average energy density of the region (J/cm2). The most important influence factor of laser polishing is the average energy density of the region, that is, the energy generated by the laser acting on the surface per unit area. Equations (1)–(3) [35] describe the relationship between the focal offset distance and the average energy density of the region.
Z r = π r 0 2 λ
r z = r 0 1 + ( z z r ) 2
E D = E L · 2 r z × 1 1 % T = P v · 2 r z × 1 1 % T
where Z is focal offset distance, and λ , Z r , r 0   , r z and % T are the wavelength, Rayleigh range, waist radius, laser beam radius at the focal offset distance, and trajectory overlap rate, respectively. In this experiment, % T is 50%. Average energy density was determined by the laser power, scanning speed, and laser beam radius. The groups with excellent polishing results were used to analyze the effect of the number of scans on the polishing effect and chemical element changes that have occurred.

2.3. Surface Integrity Analysis

The surface morphology of the sample before and after laser polishing was analyzed by a laser confocal microscope (LSCM, VK-250K). The surface roughness (Sa), peak curvature (Spc), peak volume per unit area (Vmp), peak limit height (Sxp), and peak average height (Spk) were measured based on the surface morphology of the sample. Scanning electron microscope (SEM, JSM-7610F) and energy dispersive spectroscopy (EDS, X-MAX50) were employed to obtain high-resolution images of the intersecting surface and detect changes in the material composition after laser polishing. A Micro-Vickers sclerometer (FM-800) was used to measure the hardness of specimens, and the test force was set to 100 gf, and the holding time was 20 s. The residual stress on the material surface was measured by a metal surface stress measuring instrument (XSTRESS3000).

3. Result and Discussion

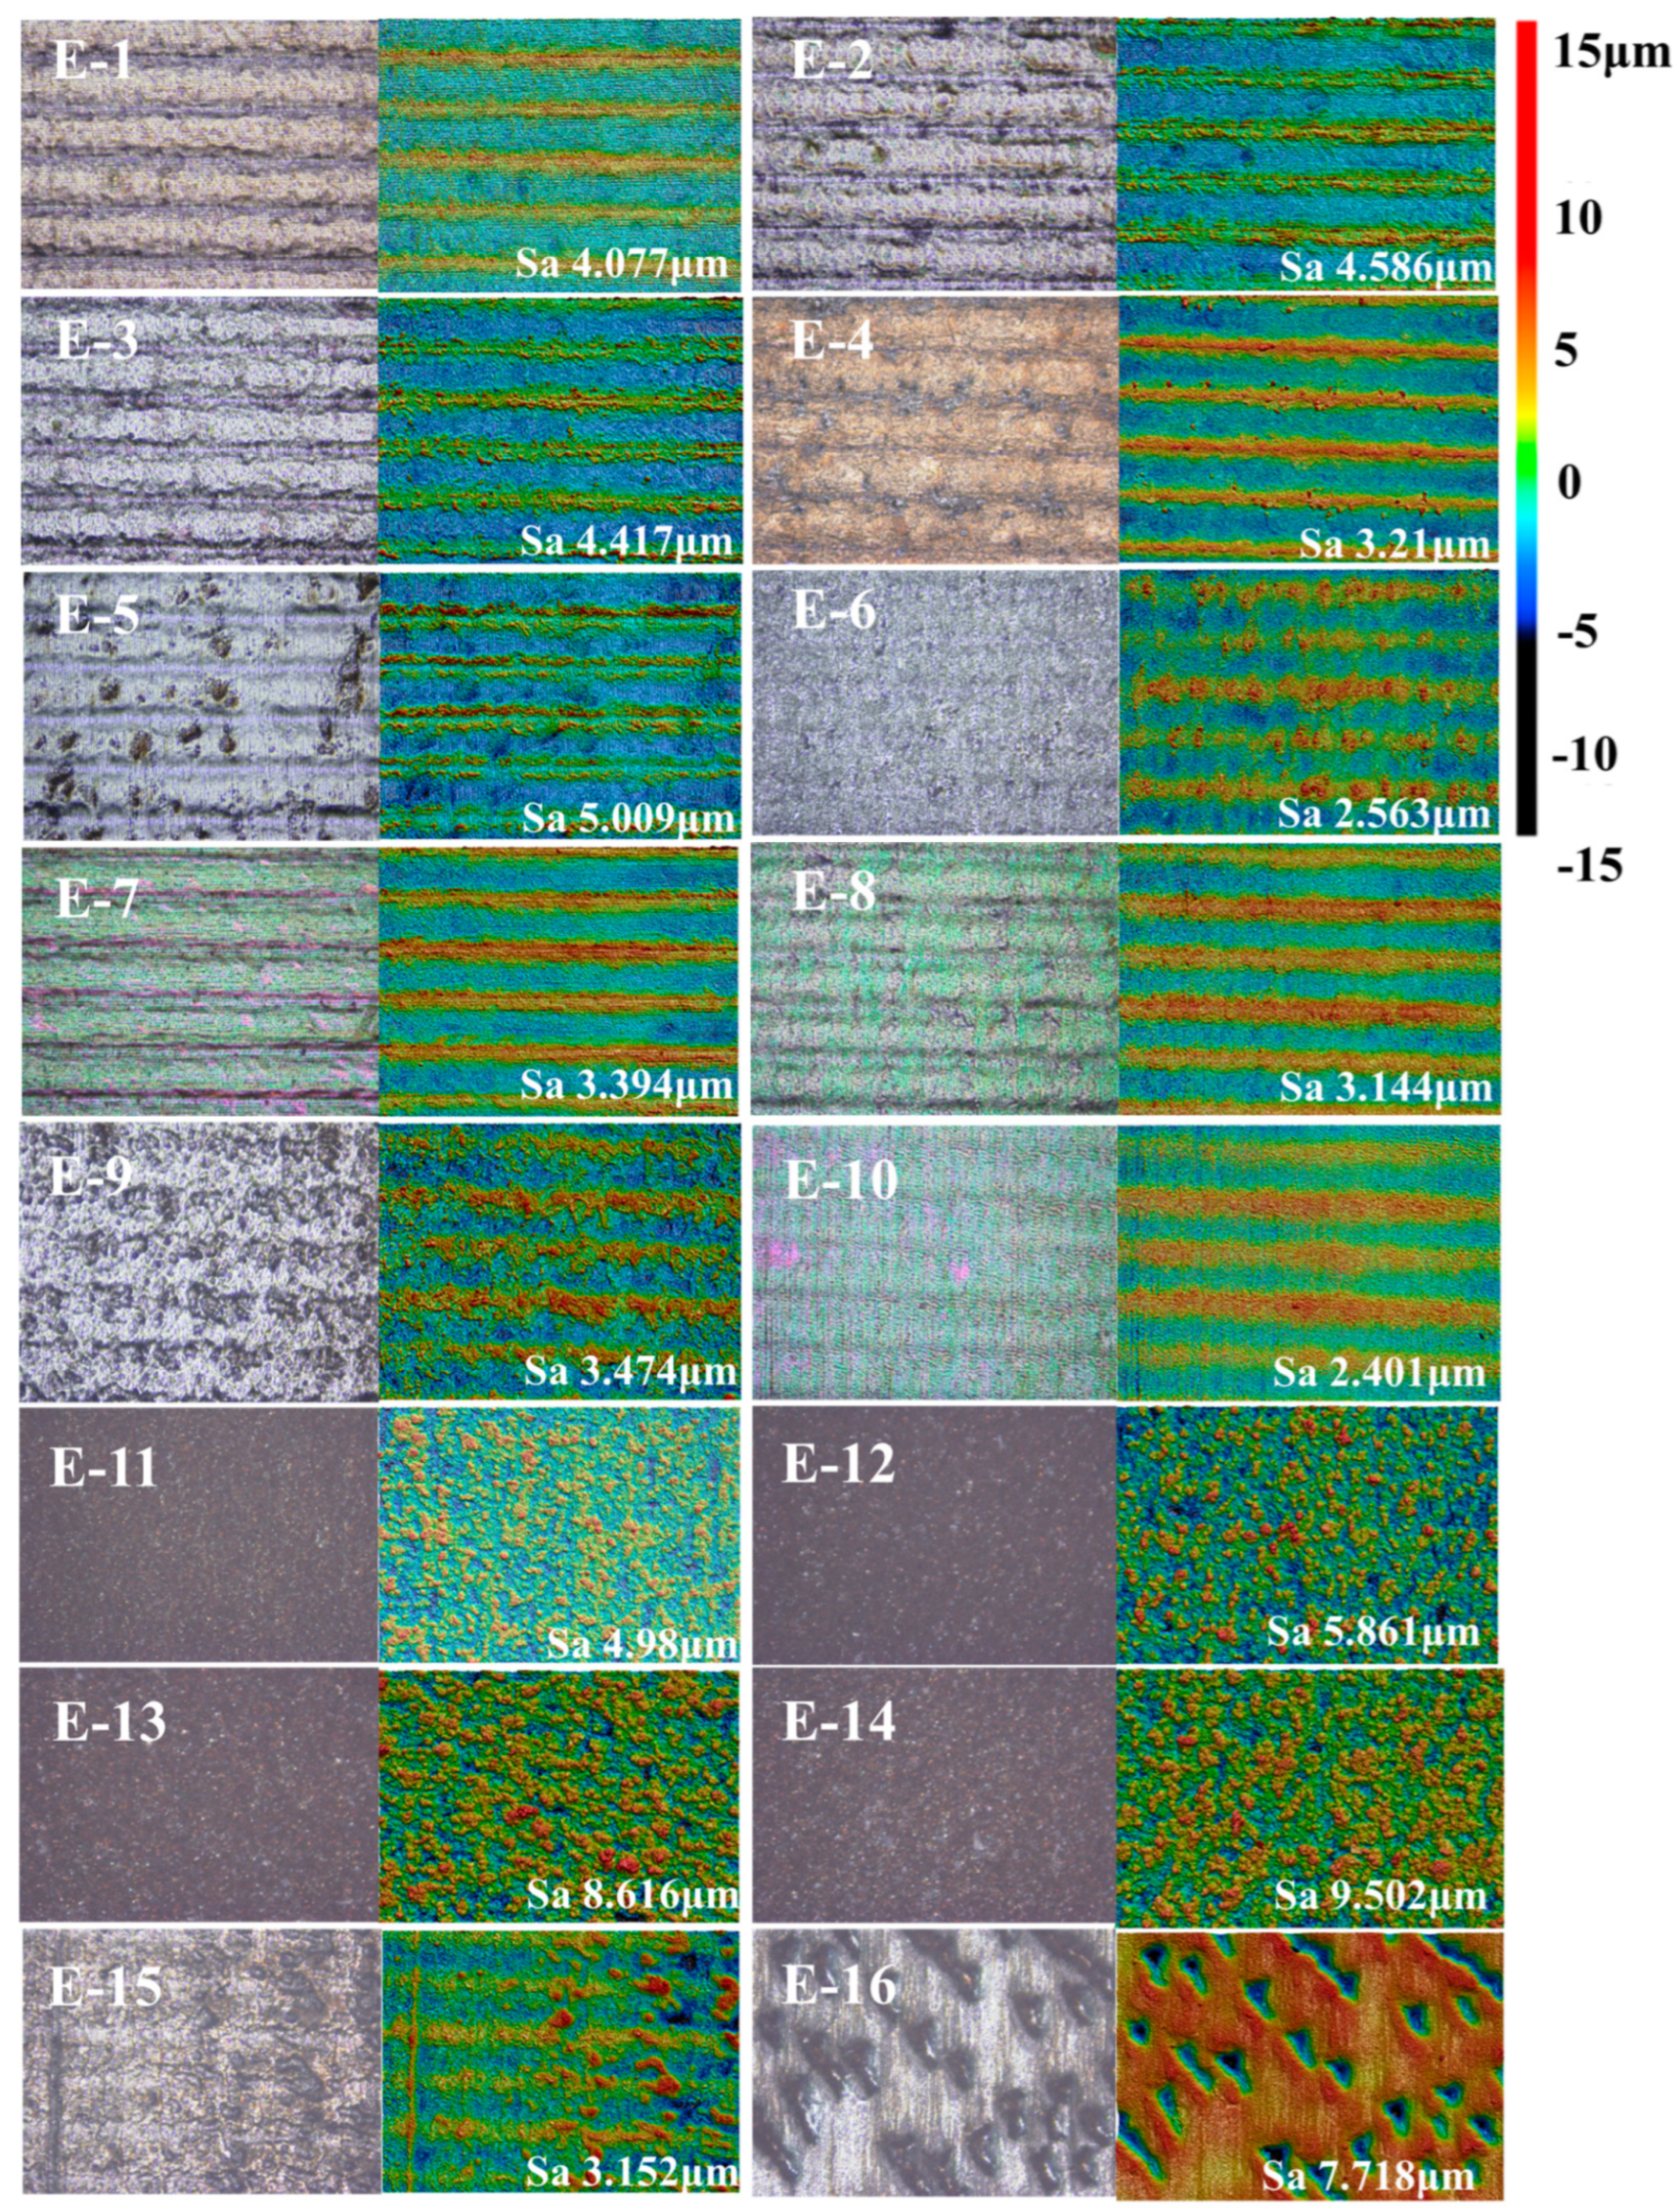
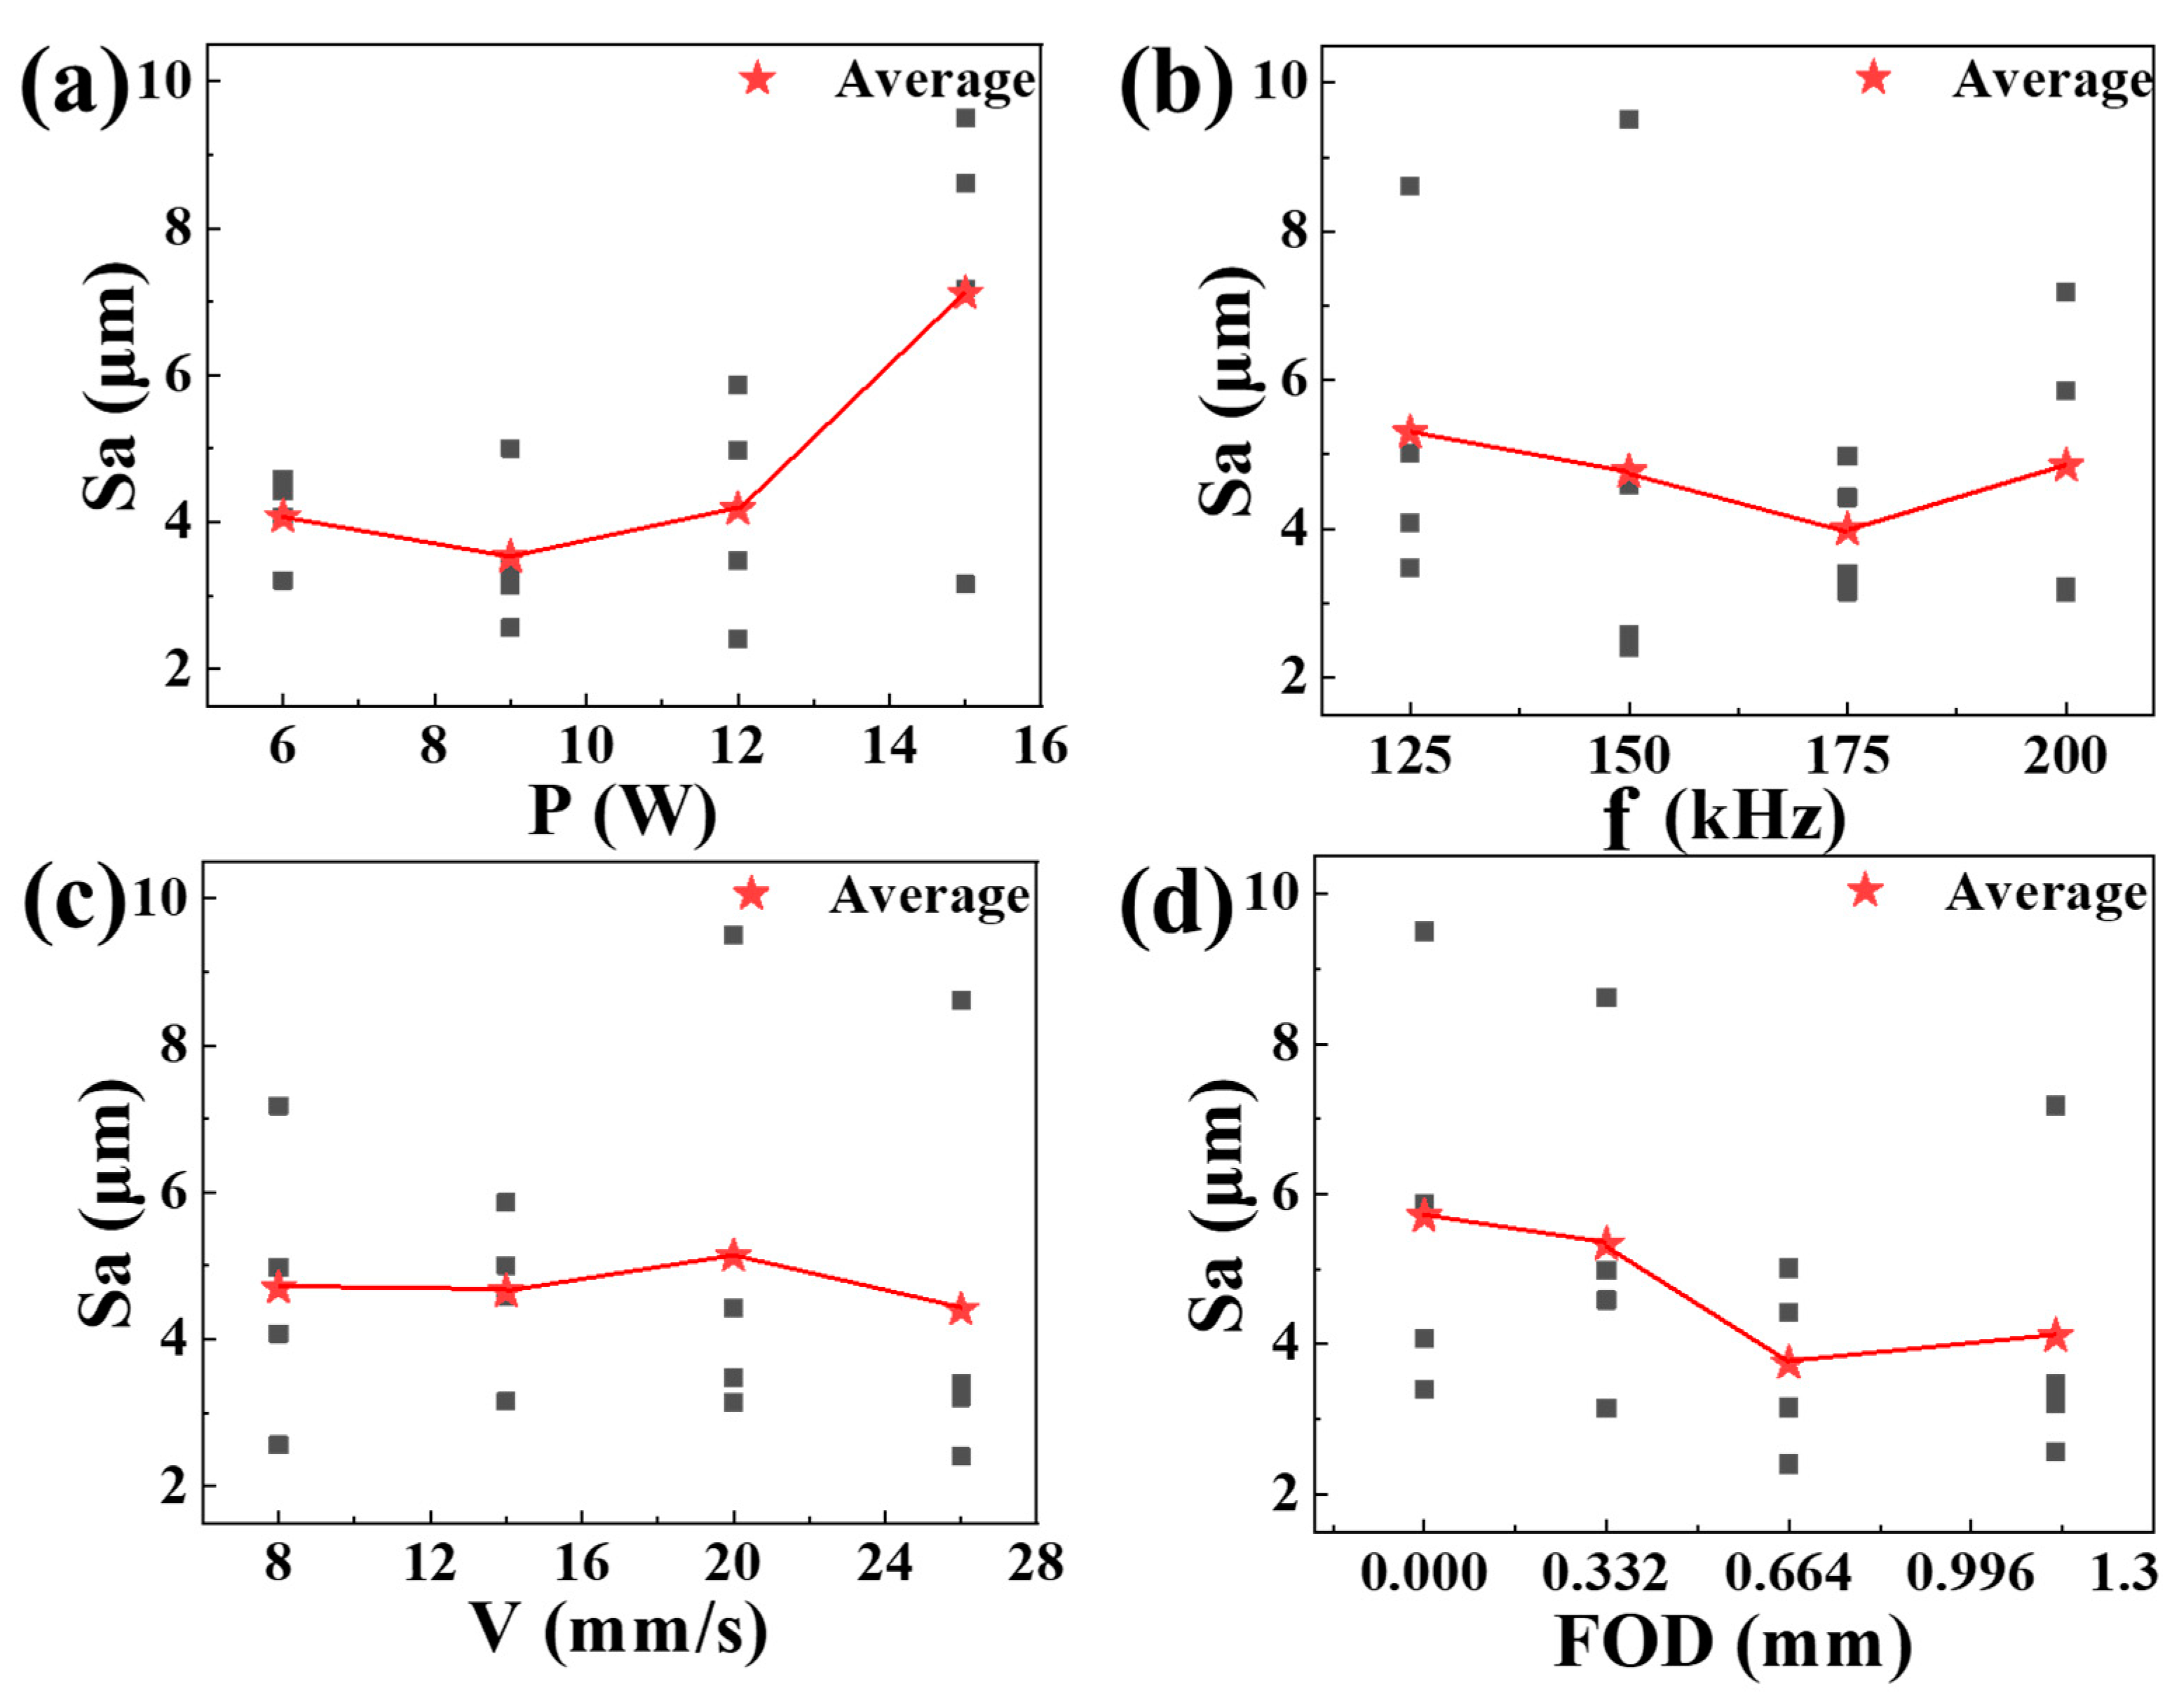
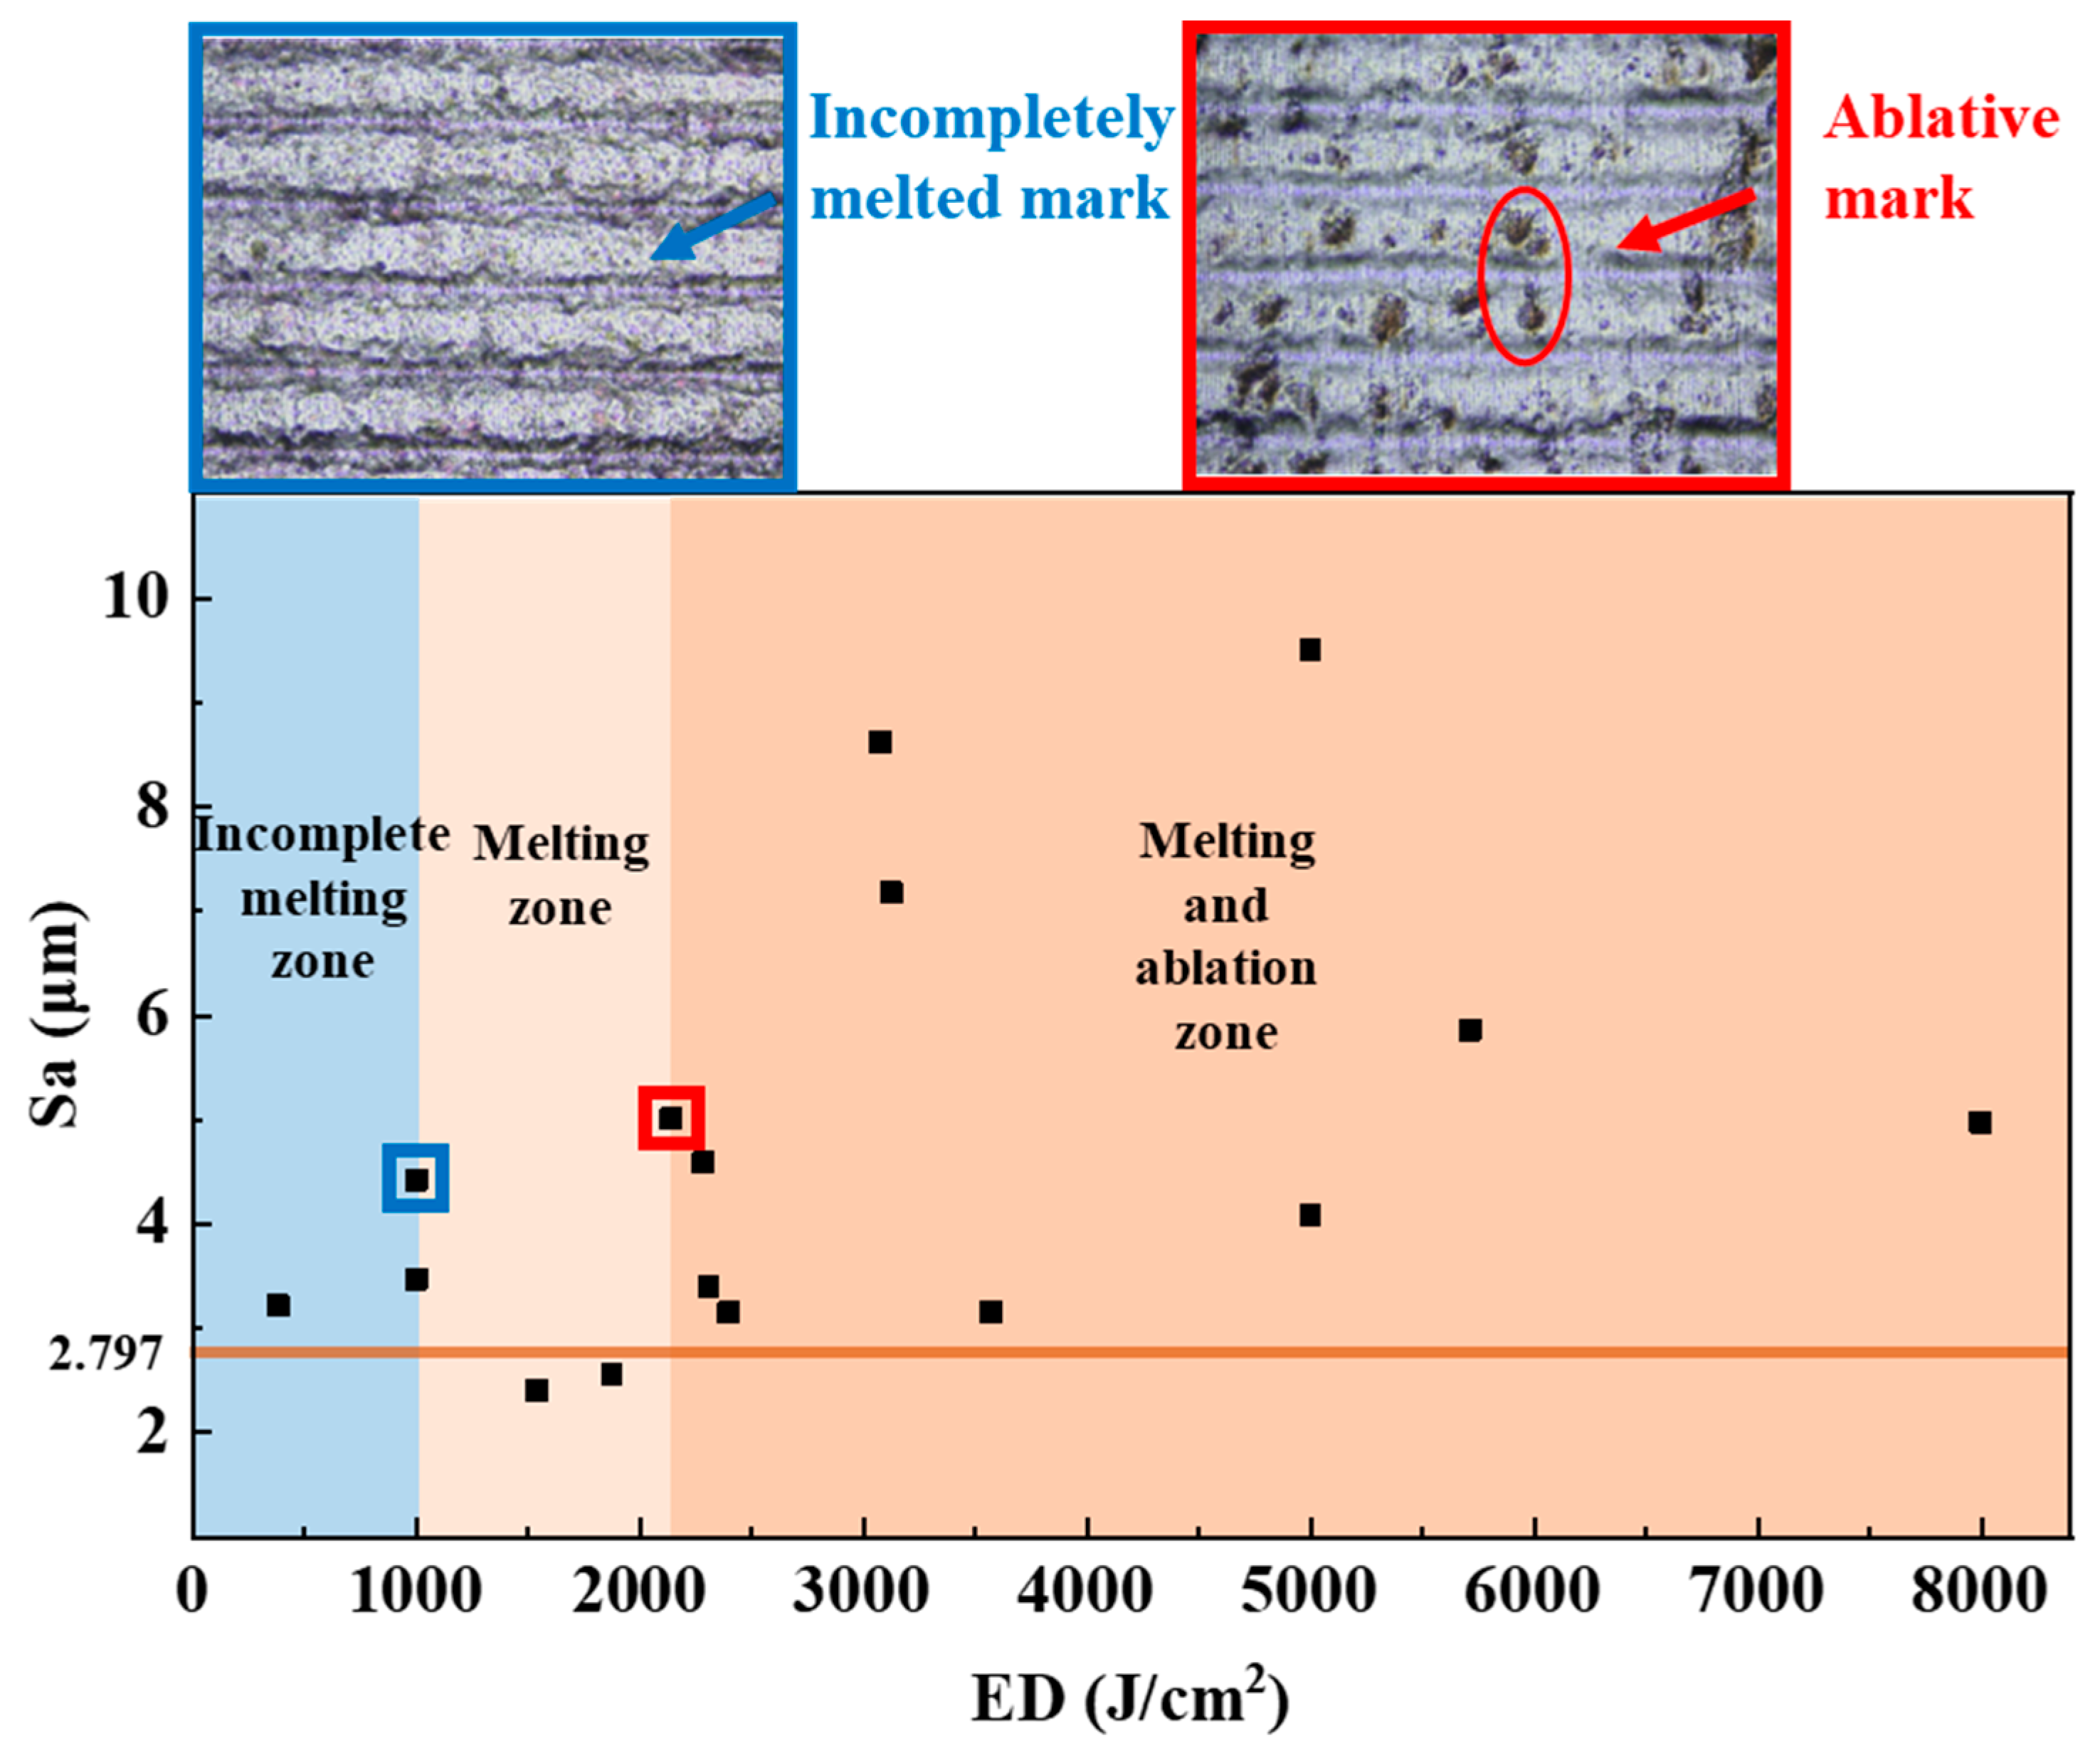
3.1. Effects of Laser Polishing Parameters on Surface Morphology and Roughness

3.1.1. Surface Morphology of Ball-End Milling Surface and Laser-Polished Surface

Figure 2 shows the surface and three-dimensional (3D) morphologies of the milling specimen. After the ball-end milling process, the machining trace was mainly composed of regularly distributed crust and trough. The surface morphology of pretreatment depended on the height and width of micro milling and its uneven distribution. Post-polishing, the surface machining residues predominantly generated during micro-milling were largely eliminated. When contrasted with a conventional rough surface, the morphology of the polished micro-milled surface exhibited greater regularity and distinctness. The transformation of the surface post-laser scanning was significantly more pronounced, indicating the effectiveness of the laser polishing process in enhancing surface properties.
Upon examination of the unpolished sample surface, numerous banded textures were discernible. These textures contributed to an initial surface roughness, quantified by the Sa parameter, of 2.797 μm. The microscopic image and three-dimensional morphologies, as depicted in Figure 2, provide a comprehensive visual representation of these surface characteristics.
Orthogonal experiments were conducted without considering the influence of the number of scans on polishing results. Figure 3 shows the 3D morphologies of each parameter after polishing and after scanning once. The surface roughness of E-6 to E-10 improved, in which the E-6 and E-10 reduced roughness, with Sa values of 2.563 and 2.401 μm, respectively. The melt flow of E-5 and its previous groups was not obvious, the polishing effect was not achieved, and surface deterioration was severe in E-11 and its subsequent groups. Analysis of variance (ANOVA) was performed for each factor in the orthogonal experiment to quantify its impact on the polishing effect, define the null hypothesis of each factor, assume that the factor has no significant influence on the laser polishing effect, and then calculate the corresponding probability value (p-value) of each hypothesis, as shown in Table 5. Among the p-values of the four factors in the orthogonal test, only the p-value of P is less than 0.05, so only the factor P rejects the null hypothesis. The ANOVA shows that the change in P has a significant impact on the reduction in the surface roughness, while the influence of V, f, and FOD is not significant. This finding can be observed in Figure 4a, which shows that the group before the examination had less power, and the average roughness after polishing was still higher than that after polishing. The group with 9 W power had the best average roughness after polishing with increased laser power and exhibited flat roughness. In terms of repetition frequency, theoretically, a high overlap at the repetition rate is beneficial for improving the polishing effect. However, due to the low power of the laser used in this study, the increase in repetition rate reduces the single-pulse energy and may result in poor surface polishing [35]. The most suitable repetition frequency for polishing was 175 kHz (Figure 4b). As shown in Figure 4c, the change in scanning speed at low speeds had a minimal direct influence on the polishing effect and a direct relationship with the change in the average energy density, thus affecting the polishing results. The focal offset distance affected polishing by changing the laser beam diameter. After the focus shifted upward by 0.664 mm, the laser beam radius measurement was twice that of the focus (Figure 4d), and the focal offset distance was 0.664 mm, with the least average roughness. The group with the best polishing effect was also observed.
Due to the inevitable melting accompanied by ablation during pulsed laser polishing, the ED was evaluated according to the orthogonal test results, as shown in Figure 5. They were scattered in three regions, respectively: incomplete melting zone; melting zone where melting is the majority; and melting and ablation zone where ablation cannot be ignored. The change in the average energy density of the region greatly influenced the molten metal flow during polishing. When the average energy density of the region increased to 1000 J/cm2, the surface was close to the ideal melting state, but there were marks of incomplete melting, so the group below 1000 J/cm2 was divided into incomplete melting zones. When the average energy density of this region increased to 2142 J/cm2, there were ablative marks on the surface, so the groups exceeding 2412 J/cm2 were divided into melting and ablation zones. When the average energy density of the region was increased to between 1000 and 2142 J/cm2, the surface reached the ideal melting state, the polishing effect was improved, and the surface polishing morphology was produced at a higher energy density. When the energy increased from 1538 to 1875 J/cm2, the roughness of the polished surface decreased most significantly.

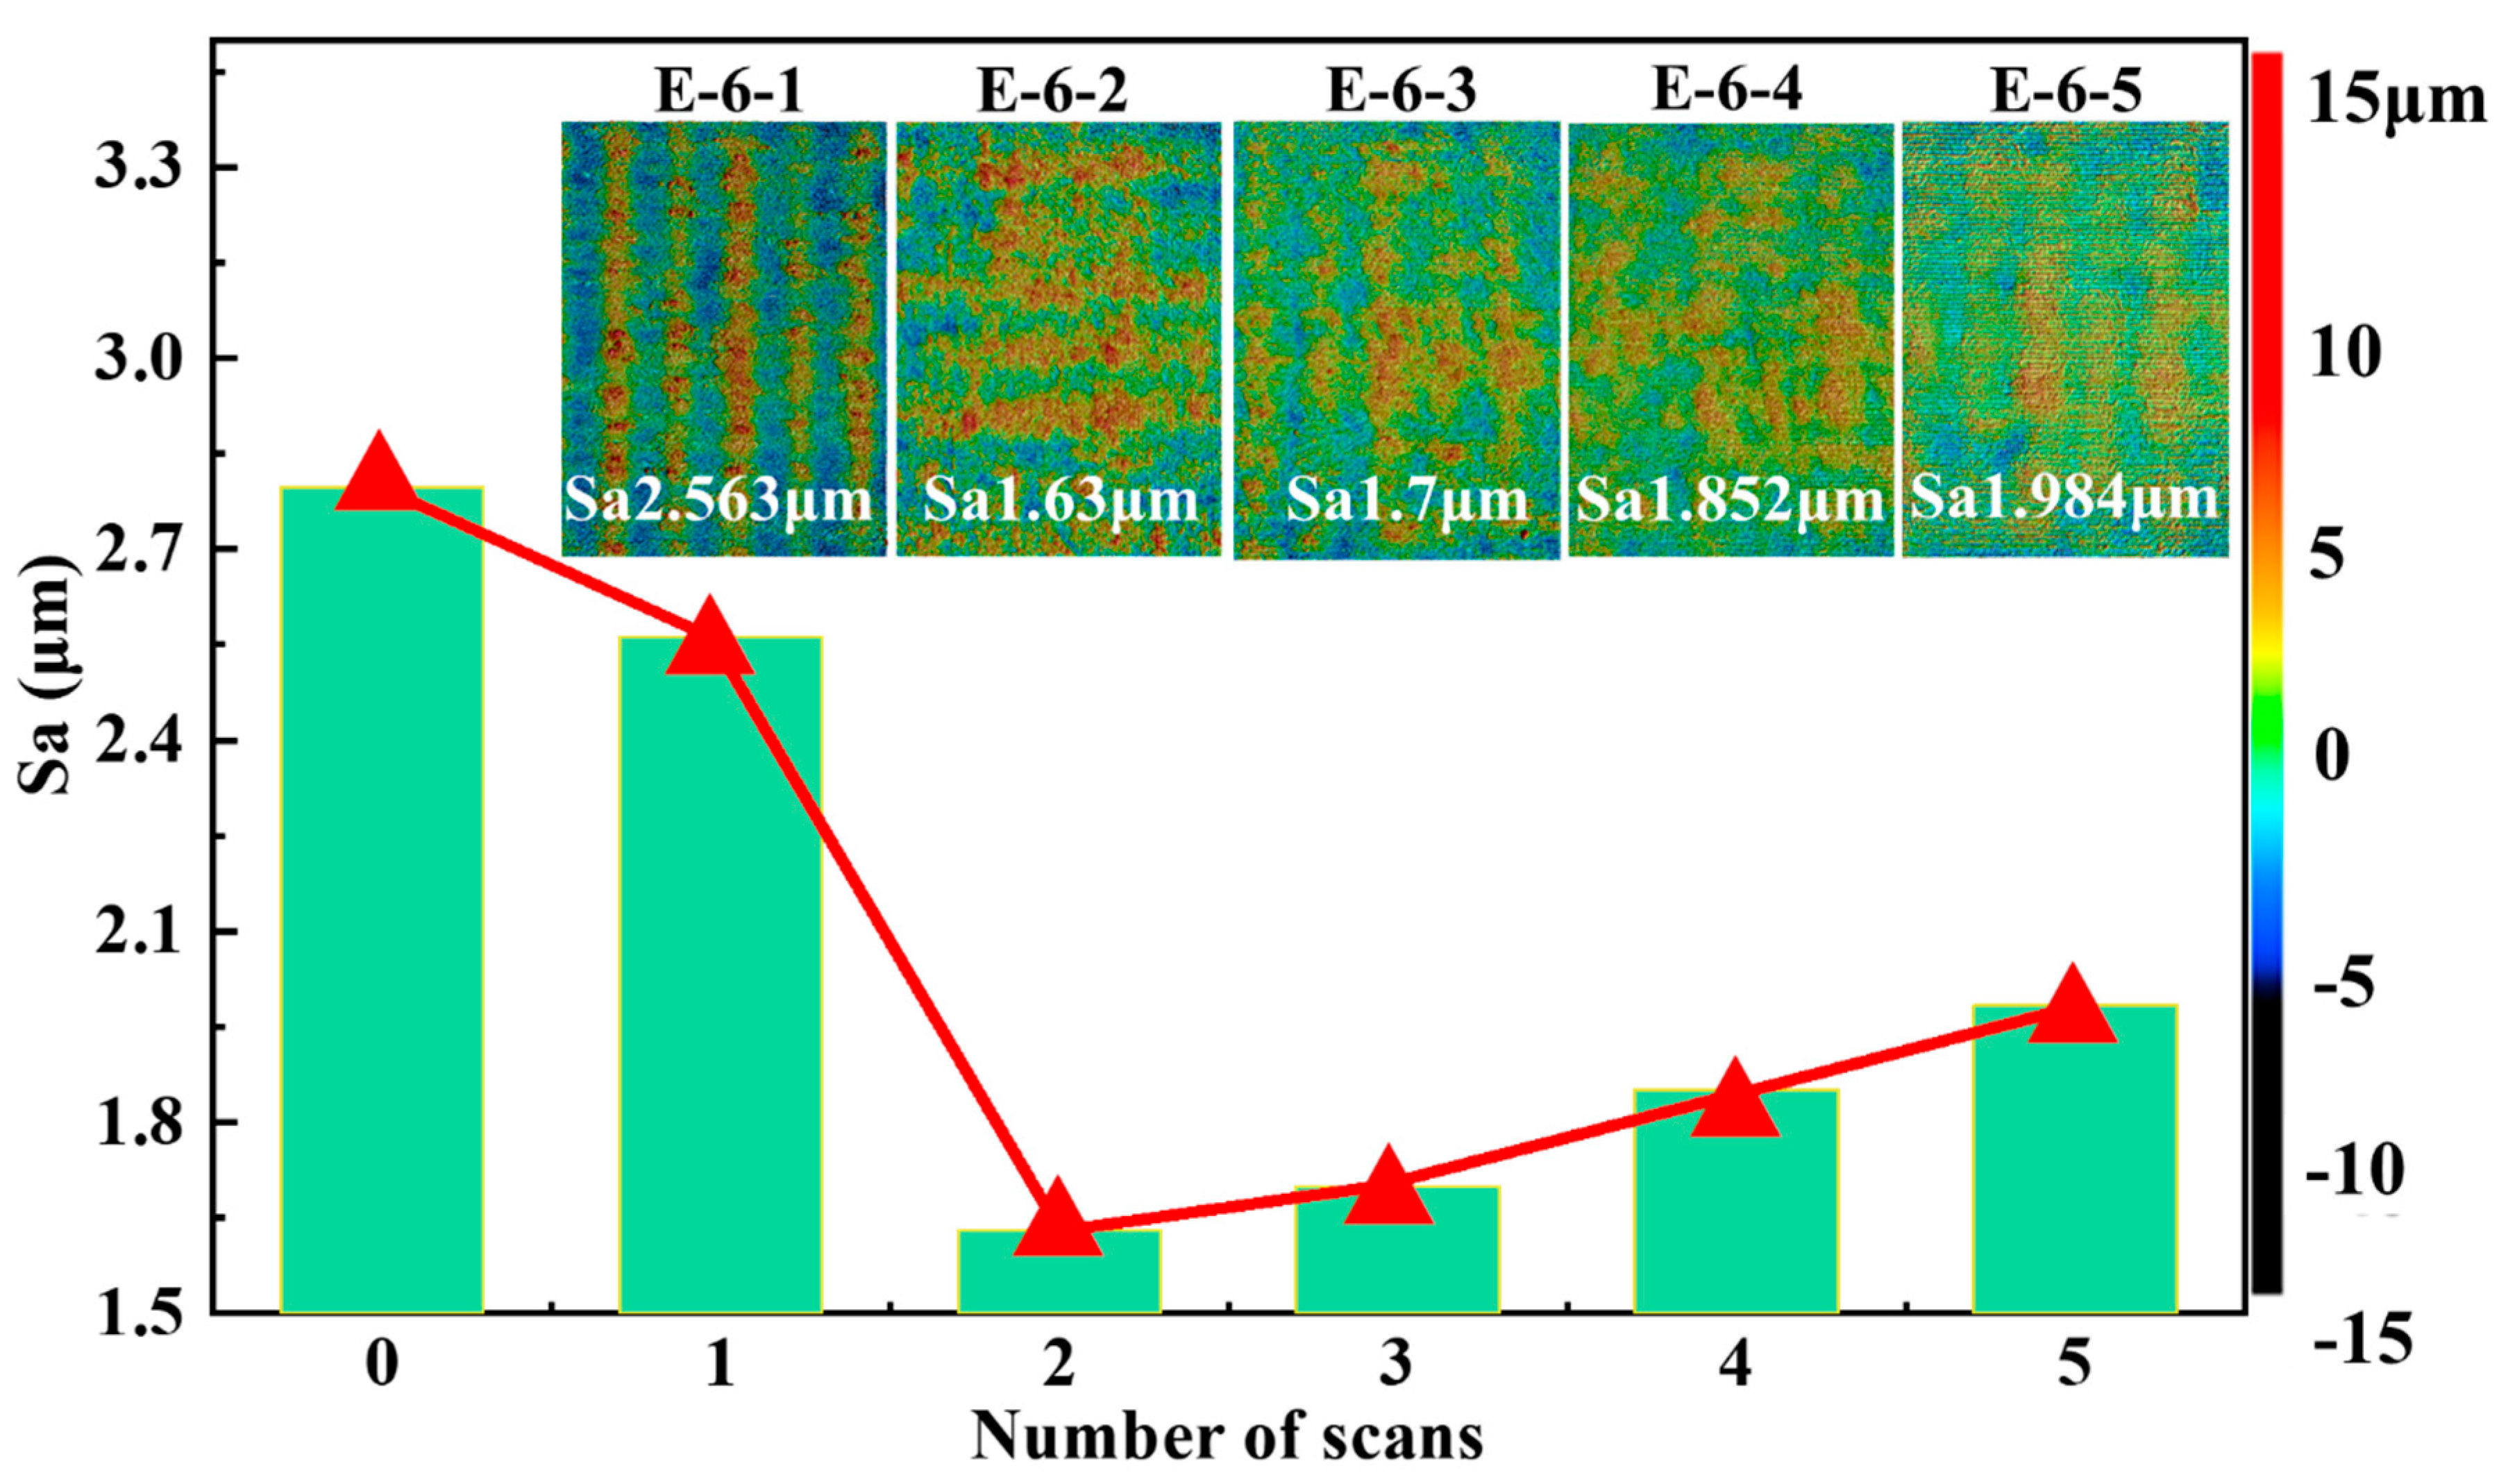
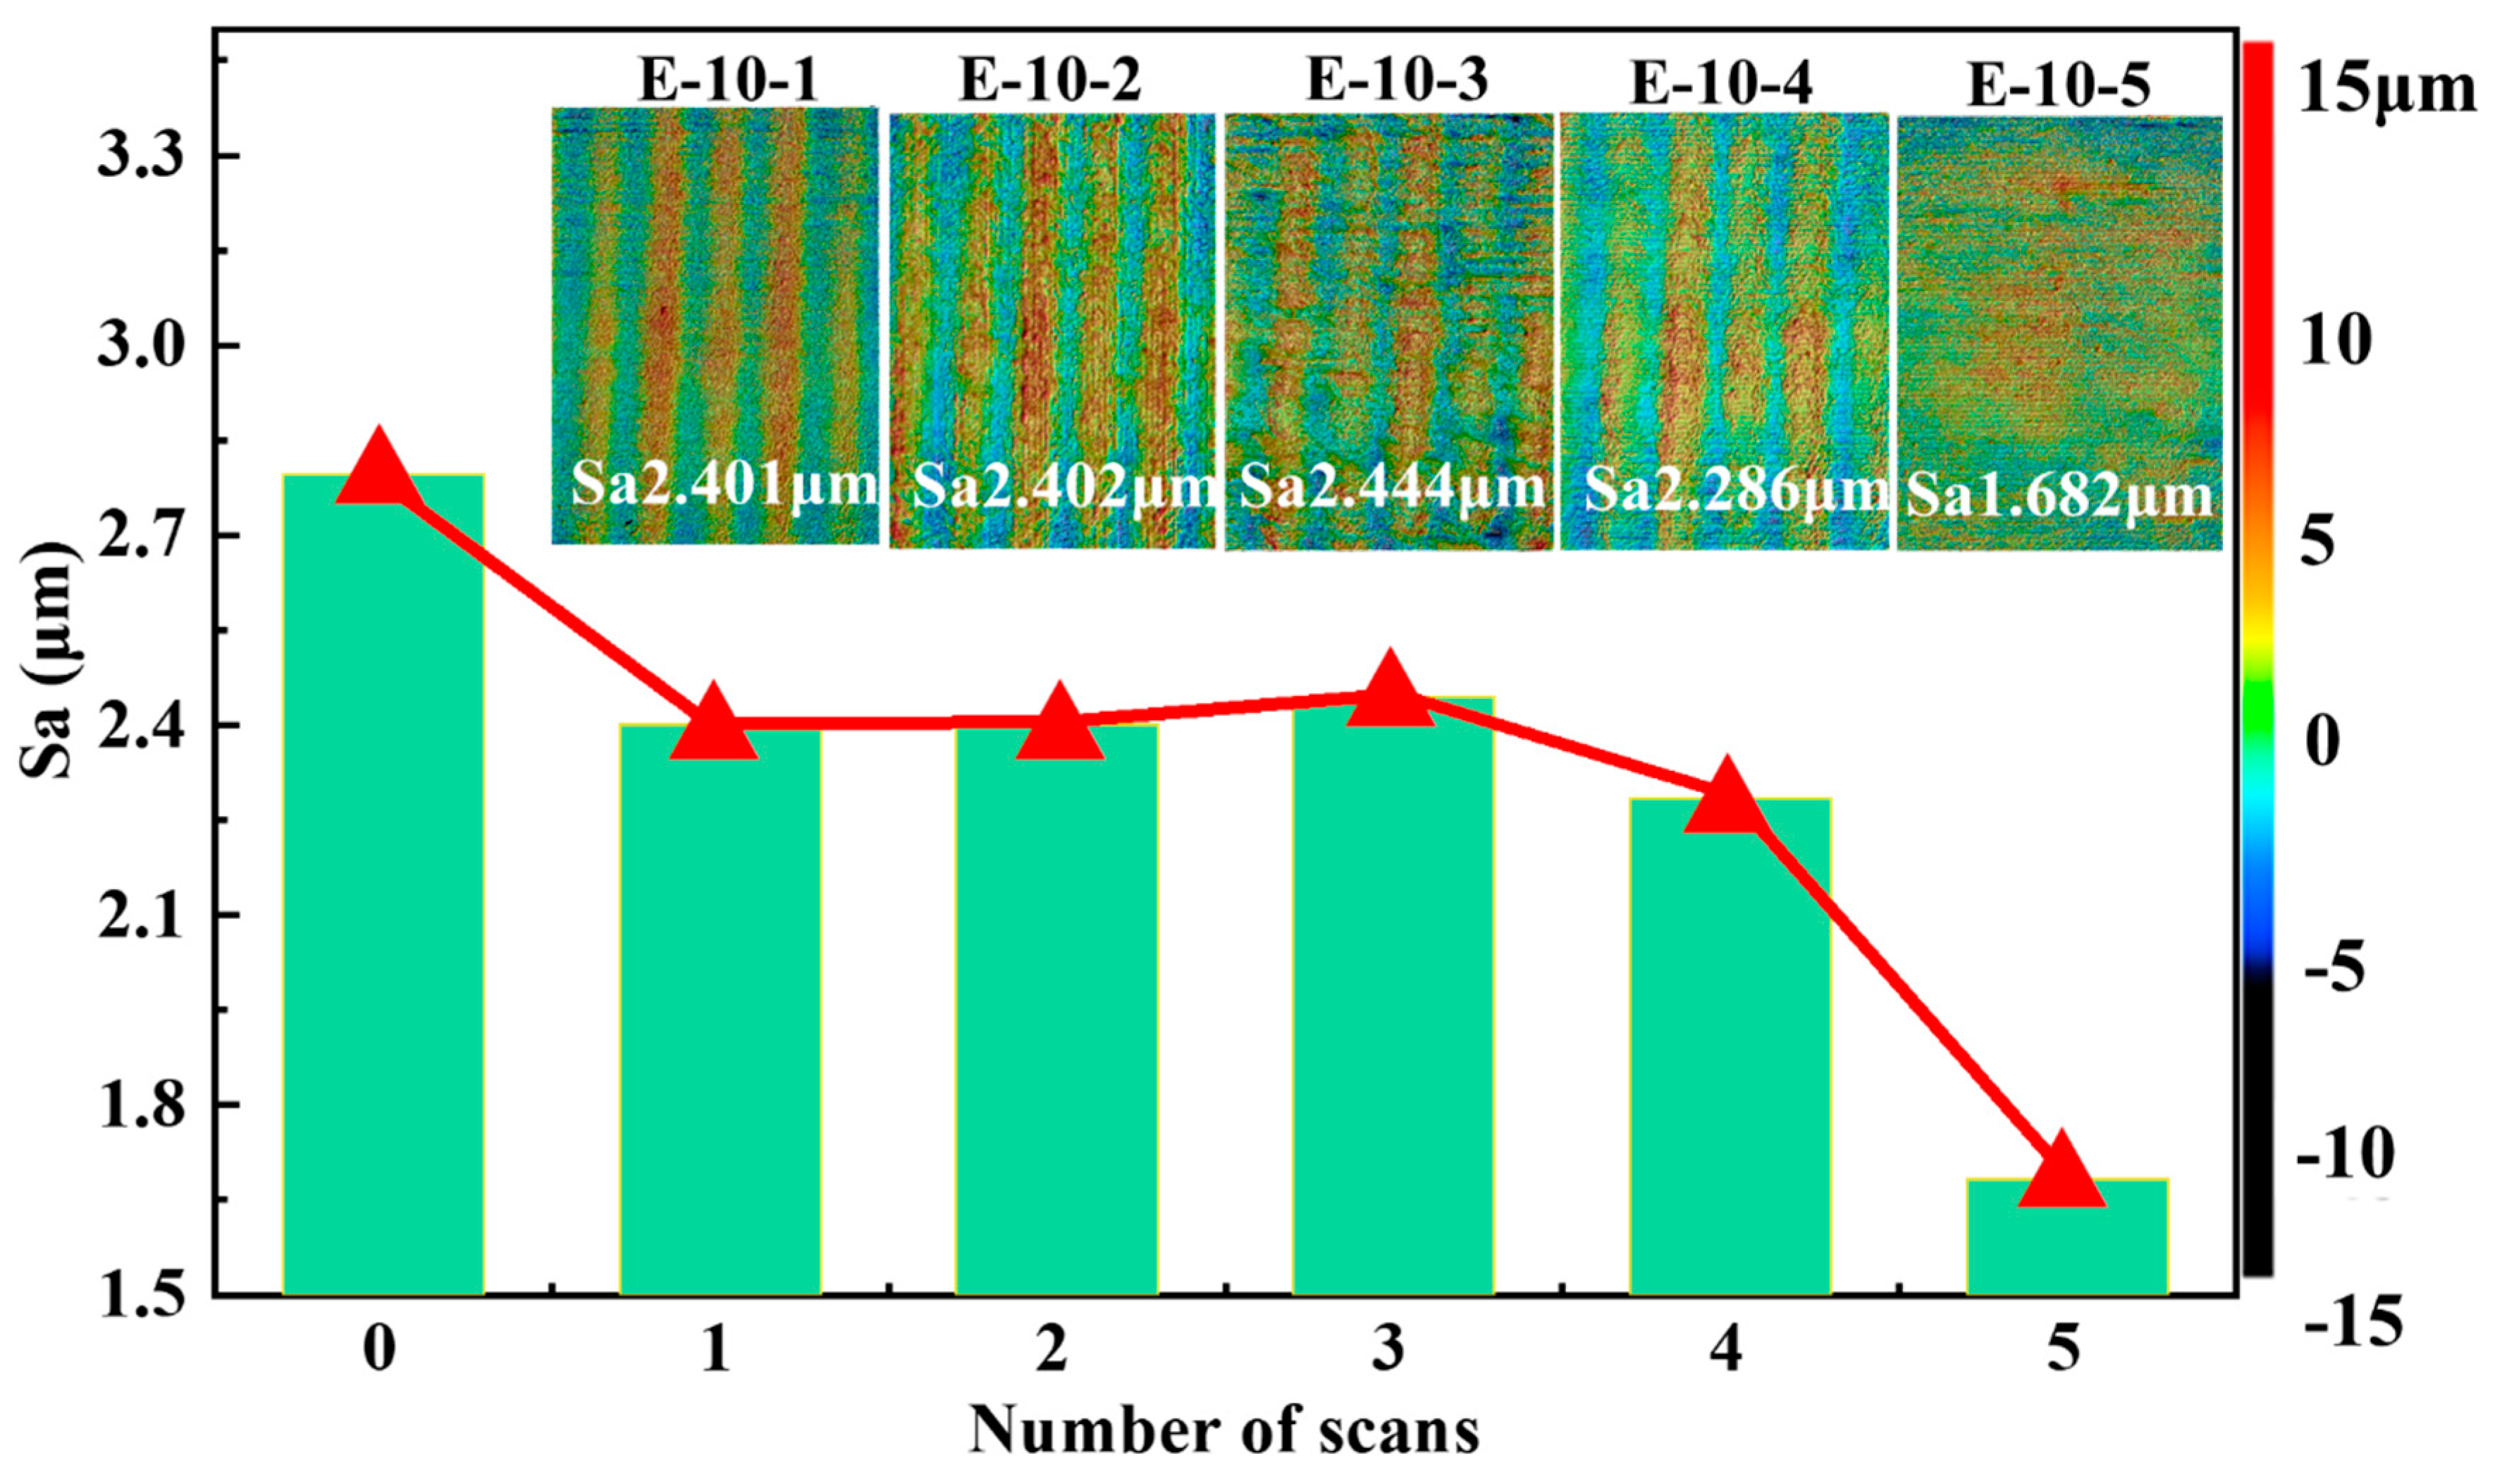
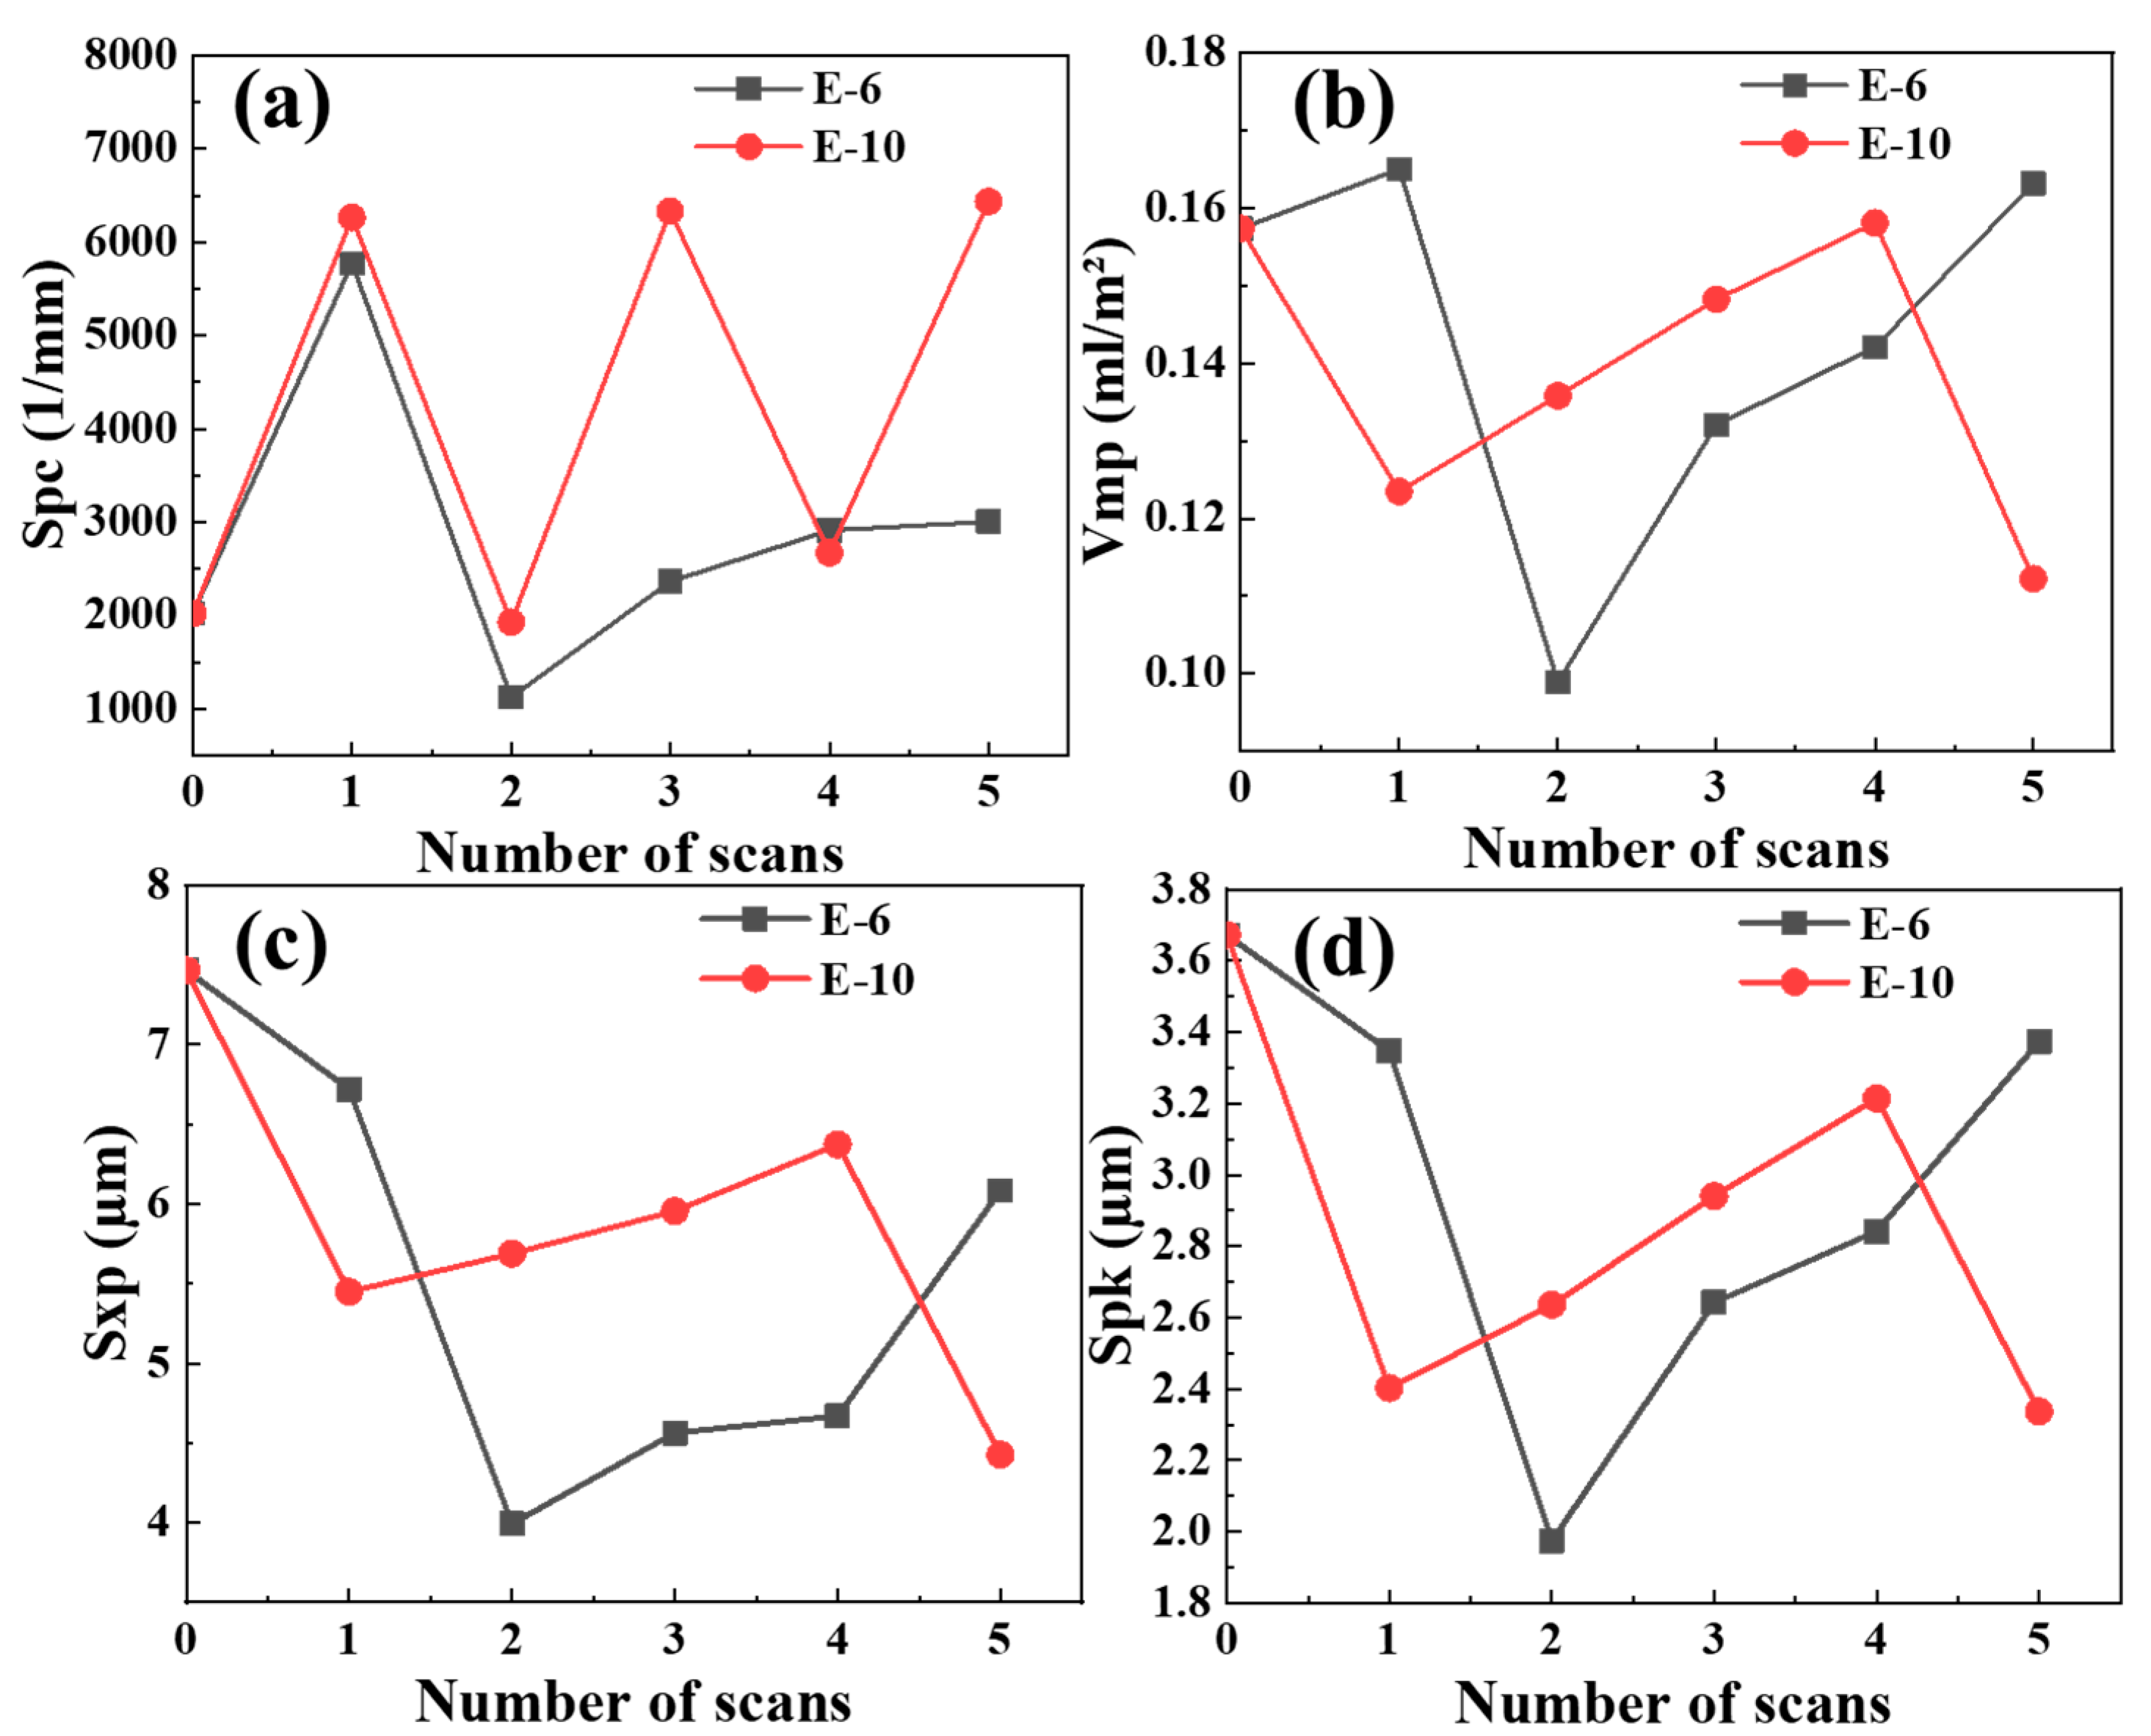
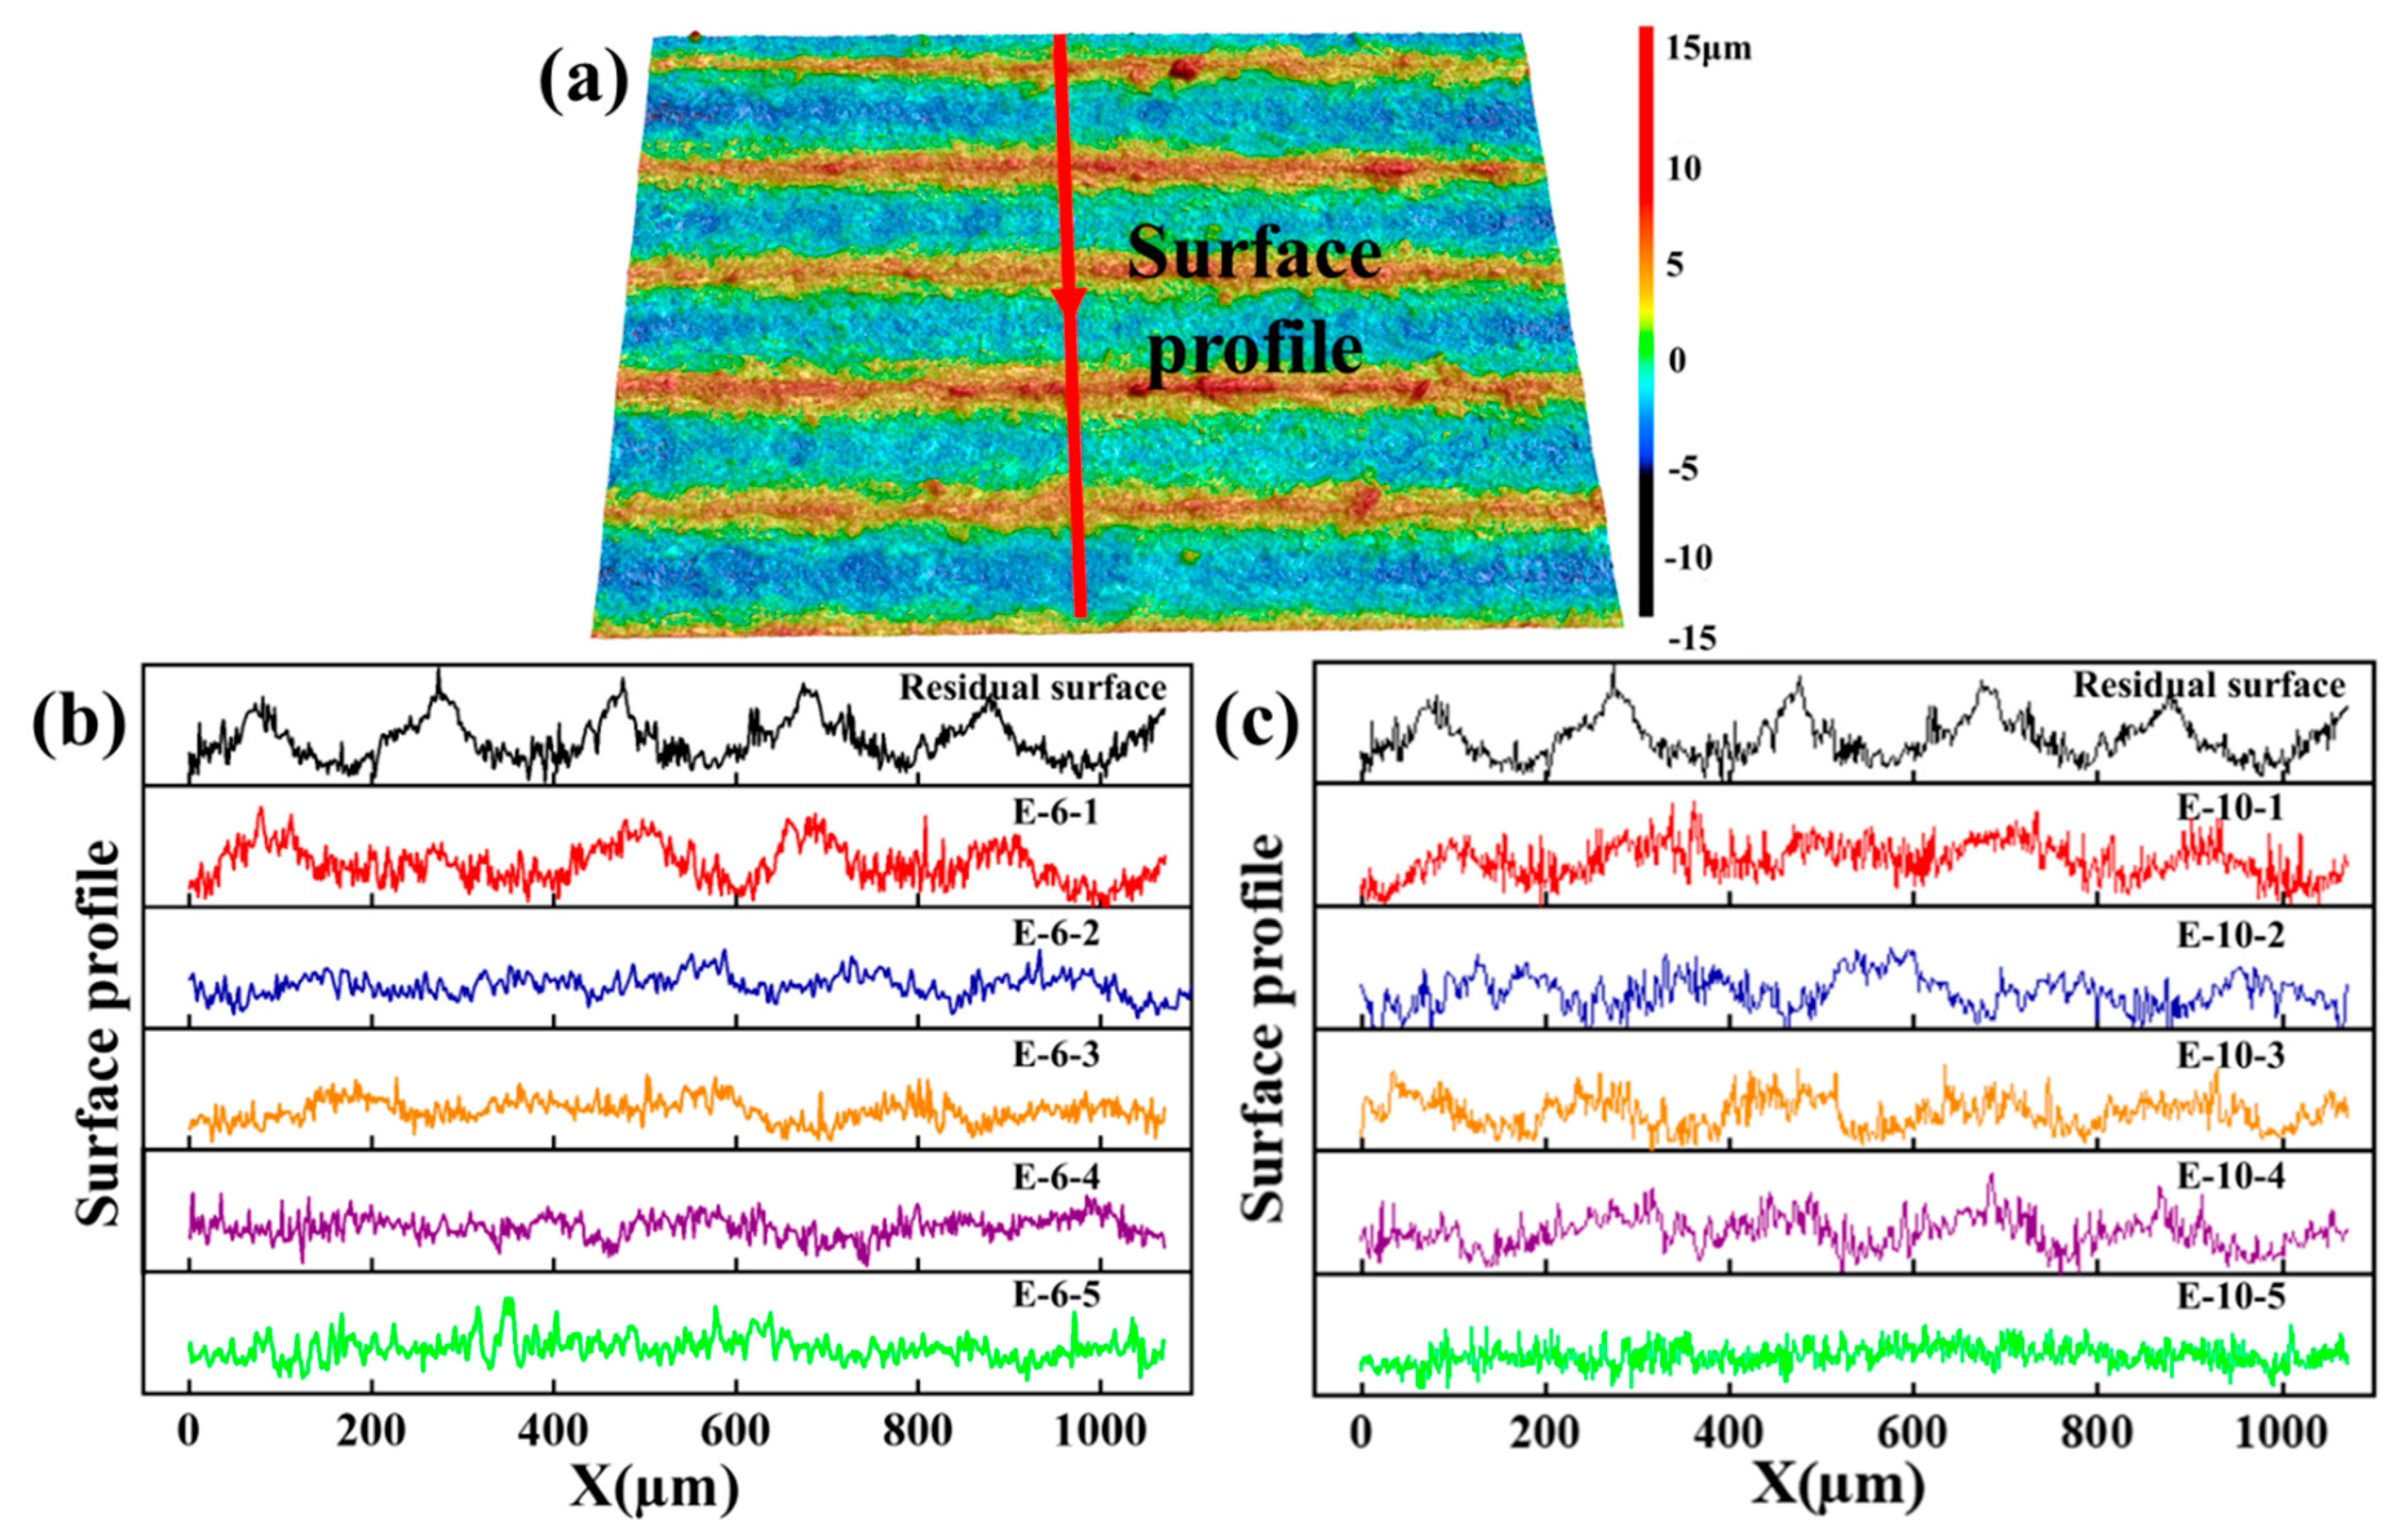
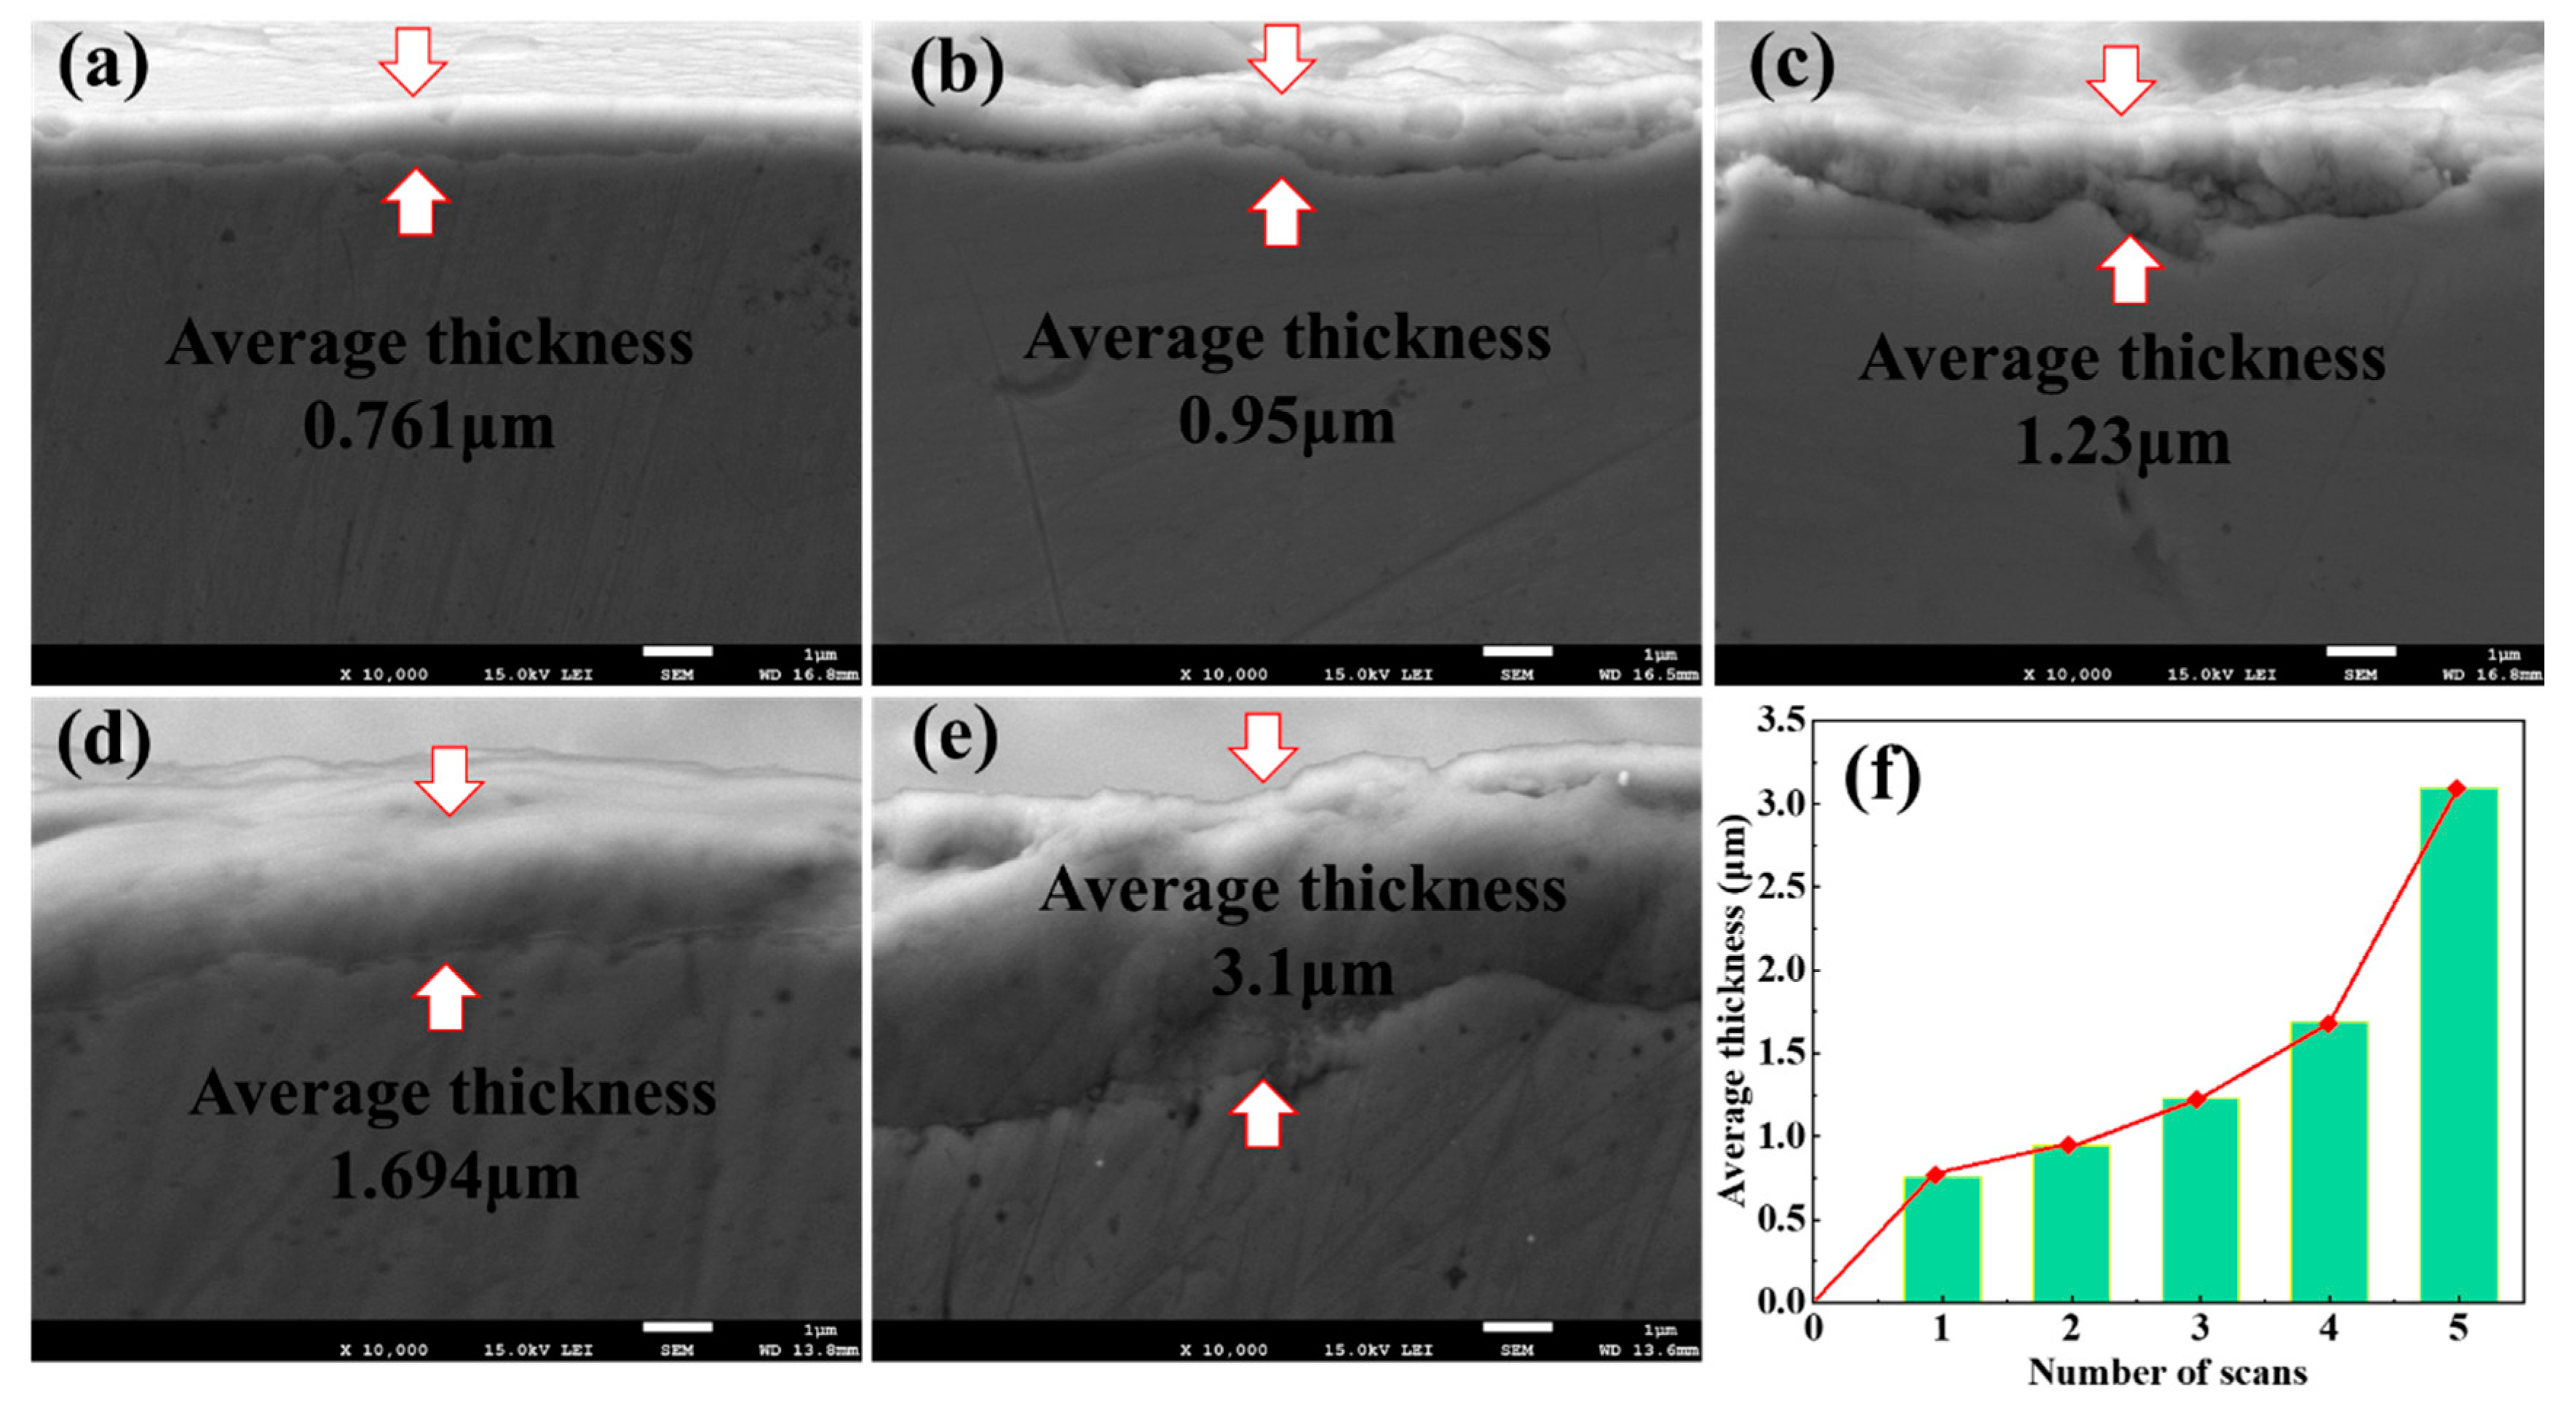
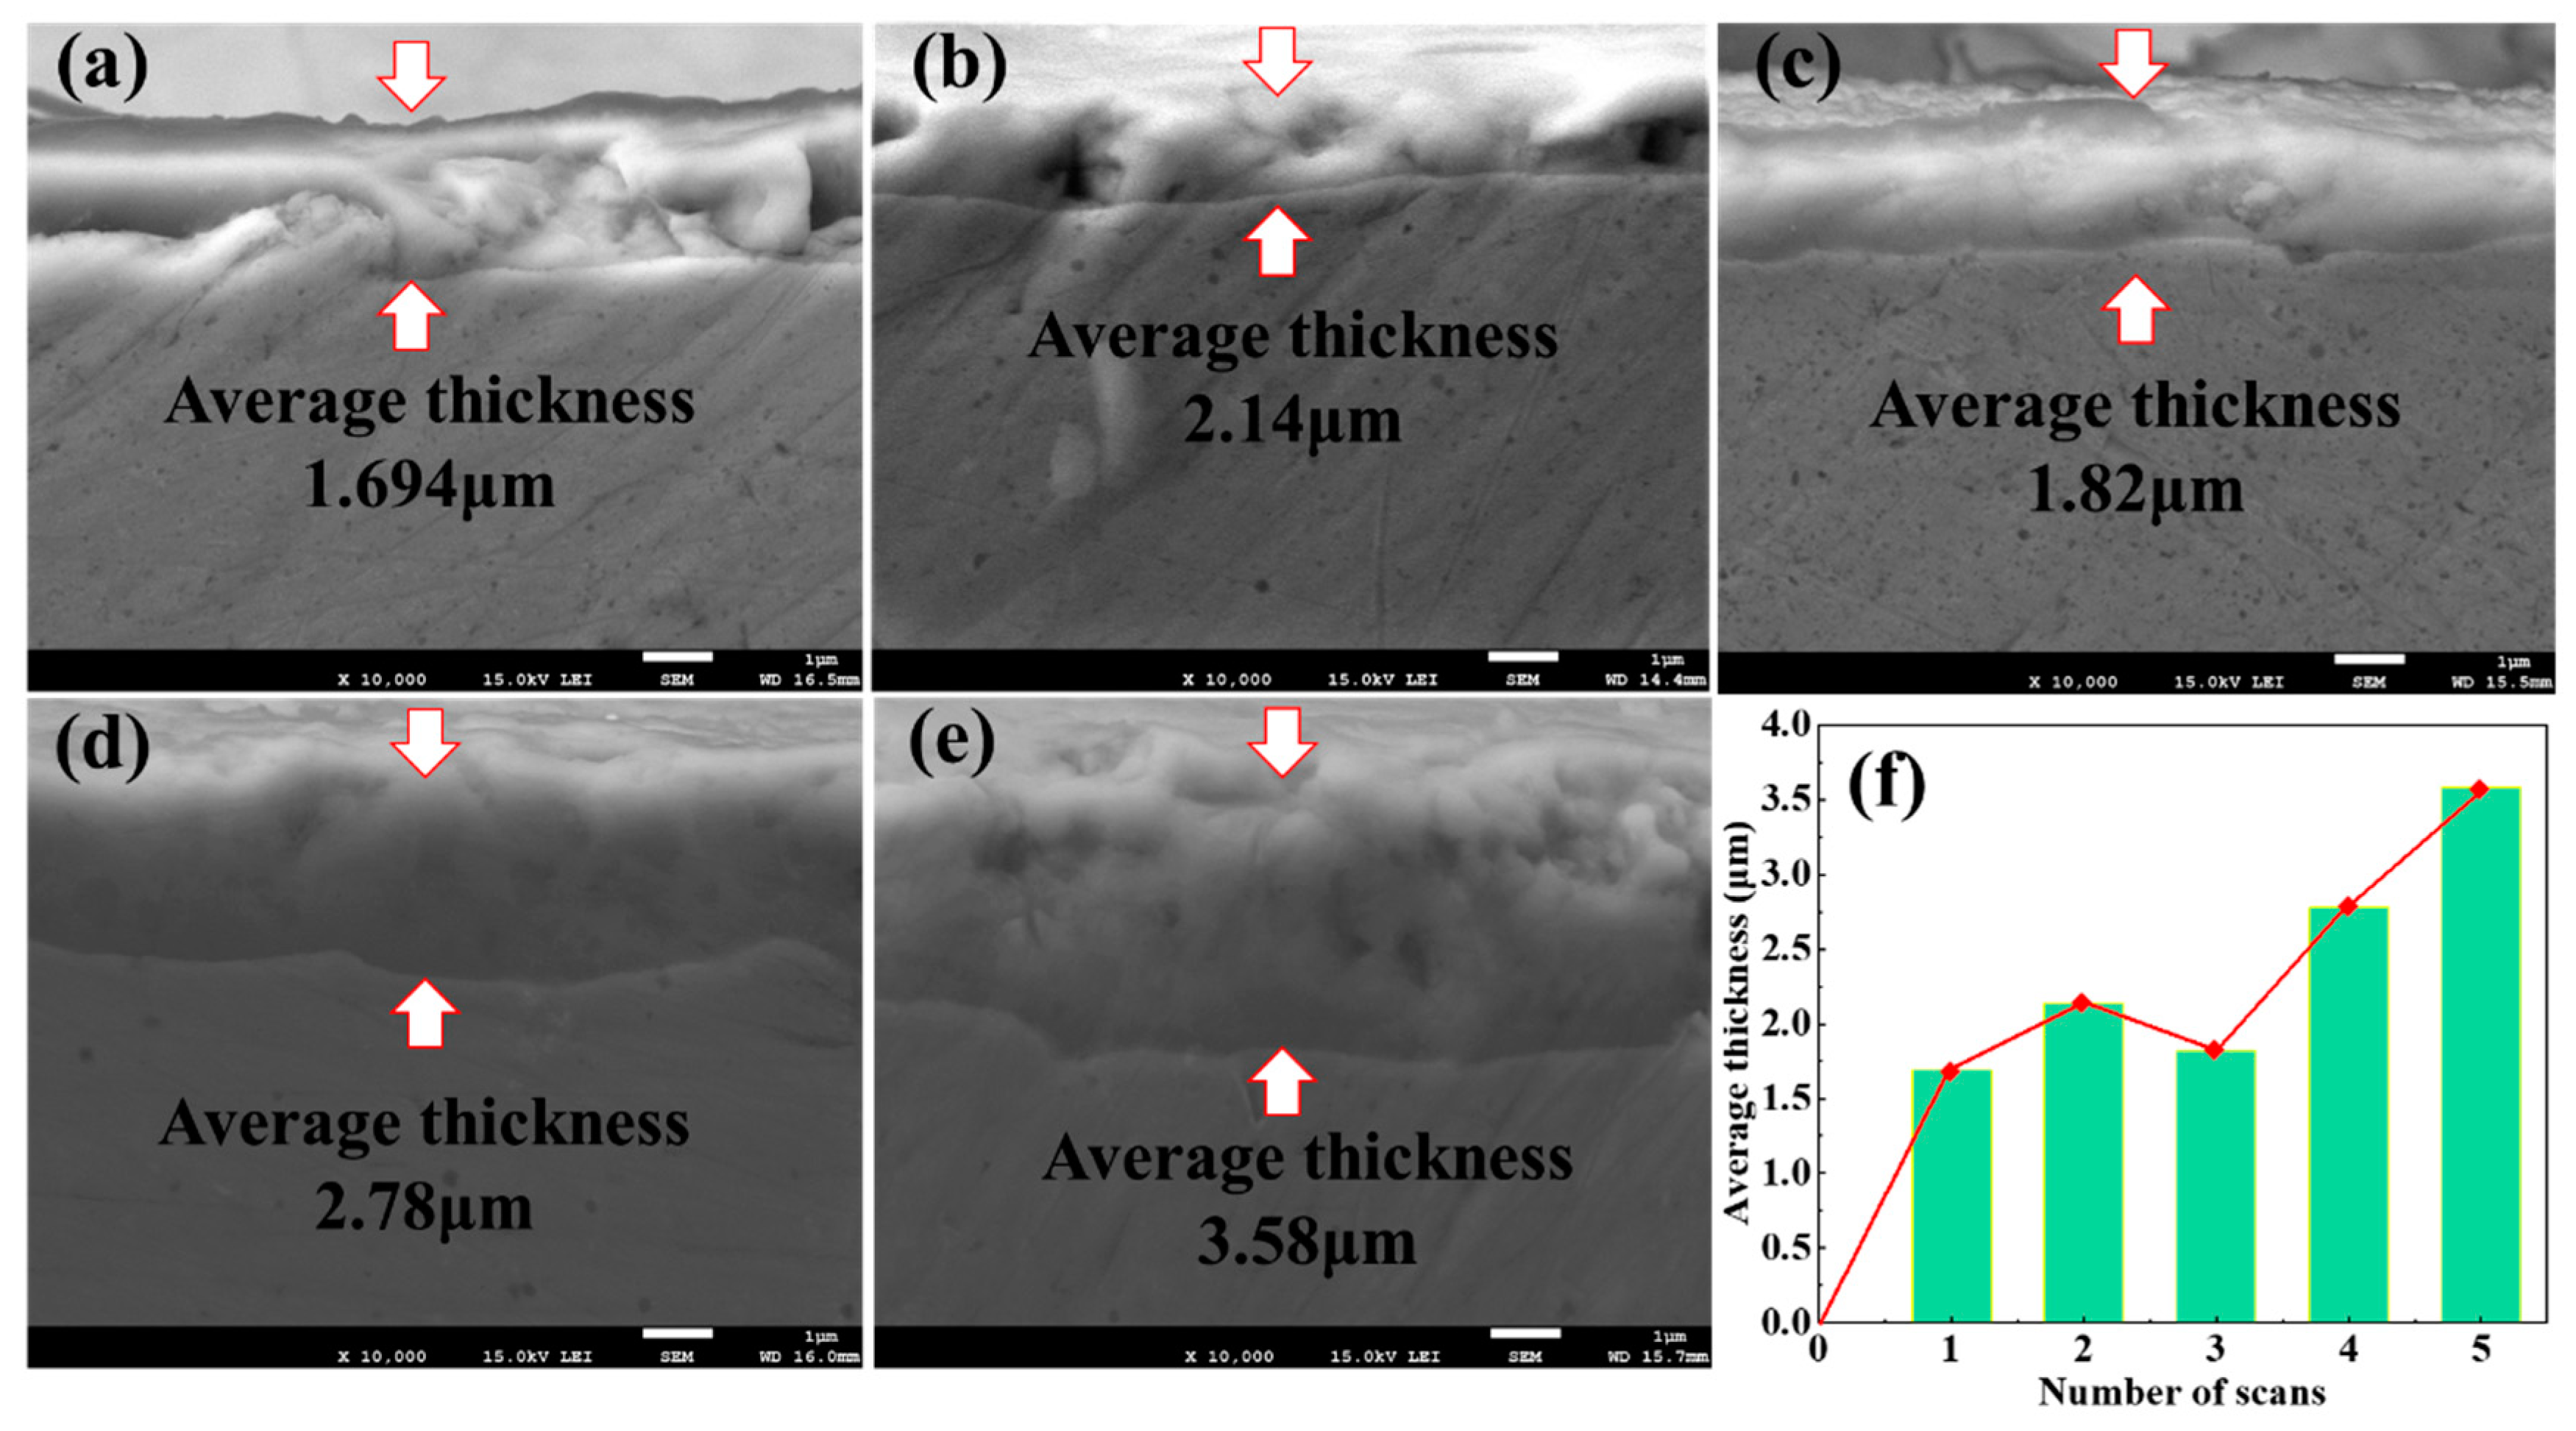
3.1.2. Analysis of the Effect of Multiple Scans

In order to investigate the superior polishing effects of E-6 and E-10 with laser polishing, a series of multiple polishing experiments, ranging from 1 to 5, were systematically conducted. The primary objective of these experiments was to elucidate the governing principles underlying the removal of surface peaks during the polishing process.
Under the parameters of E-6, fewer scanning times were needed to melt the surface, given the larger average energy density. Figure 6 shows that the optimal roughness reduction effect was achieved after the second polishing, and the roughness was the lowest at Sa of 1.68 μm and decreased by 39.93%. As the number of scans increased, the roughness rose slightly after two scans, and a high-average energy density disadvantage was exhibited. Figure 6 also shows that most of the original peak structures on the surface were gradually replaced by scanning traces, and a new, dense, small peak structure appeared at the coincidence of the scanning trajectory, which caused a small increase in roughness.
Operating under the parameters of E-10, the absorbed energy per unit area was minimal, attributable to the low average energy density and the reduced melting quantity of the surface apex structure. This led to a less pronounced decrease in roughness during each scanning iteration. Figure 7 illustrates the significant reduction in roughness following the initial polishing process. This observation underscores the efficacy of the E-10 parameters in facilitating surface smoothness, albeit at a gradual pace, thereby preserving the structural integrity of the surface during the polishing process. However, this reduction was insignificant as the number of scans increased from two to four times. A portion of the original peak structure of the surface was slightly diminished but did not fill the valley, and after four scans, the large peak became flatter. At this time, the material has achieved initial flow, and with laser irradiation of the material, under the action of capillary force and thermal capillary force, the material can achieve complete flow, consistent with the phenomenon found by Yi et al. [29]; the surface structure tends to be flat, and the corresponding roughness is reduced to Sa of 1.63 μm (41.72%).
The numerical value of Spc represents the peak apex curvature and the smoother surface with smaller curvature (Figure 8a). Under the parameters of E-6 with the same phenomenon characterized by roughness, the smoothest surface was observed after scanning twice, and small peaks increased slightly with continued scanning of the surface. The value of E-10 explained the slight decrease in roughness, and under this set of parameters, the original surface scan was followed by a large peak changing into smaller ones. The small peaks were removed by one scan, which left a substantially flatter large peak that was reduced to the lowest roughness after scanning the quartic.
Vmp, Sxp, and Spk are numerical values that characterize the variation in surface peaks. Figure 8b–d shows that the numerical variation trend of groups E-6 is positively correlated with the variation trend of roughness, and the numerical rising roughness characterizing the sections of peaks is also promoted. Combining the values of the groups of E-10 with the values of Spc allowed us to verify the above surface changing process, with the curvatures characterized by Spc at the low points for the values of Vmp, Sxp, and Spk all at the high points, demonstrating that the large peaks with small curvatures changed to small peaks with large curvatures but smaller volumes after scanning.
The scanning results under the two sets of parameters in Figure 9 show that the evident peak–valley structure of the ball-end milling-residual surface was remarkably eliminated after scanning, and a slight depression was produced. The valley bottom was not as smooth as the original one, and denser bumps were observed. With the increase in scanning times, the original peaks were eliminated, forming smaller and denser peaks, and the valley bottom was filled in front of the smaller and denser peaks. The above changes can be observed from the profile of the two sets of parameters scanned five times, and no evident machined trace can be detected, and the slight bulges caused by the scanning track generated after pulse laser scanning replaced it. As mentioned above, the average energy density of E-6 parameters was enormous. As shown in Figure 9b, after scanning three times under the parameters of E-6, the residual traces of ball-end milling in the surface profile were almost completely removed. Four and five times of scanning melted the newly generated small peak structure into smaller peaks. As shown in Figure 9c, under the parameters of E-10 with low average energy density, the scanned surface showed the above rules more clearly. The peak structure was removed continuously with the increase in scanning times, and after four times of scanning, the approximate structure of the original ball-milling wheel profile can still be observed. After five times of scanning, the surface attained a small peak structure.

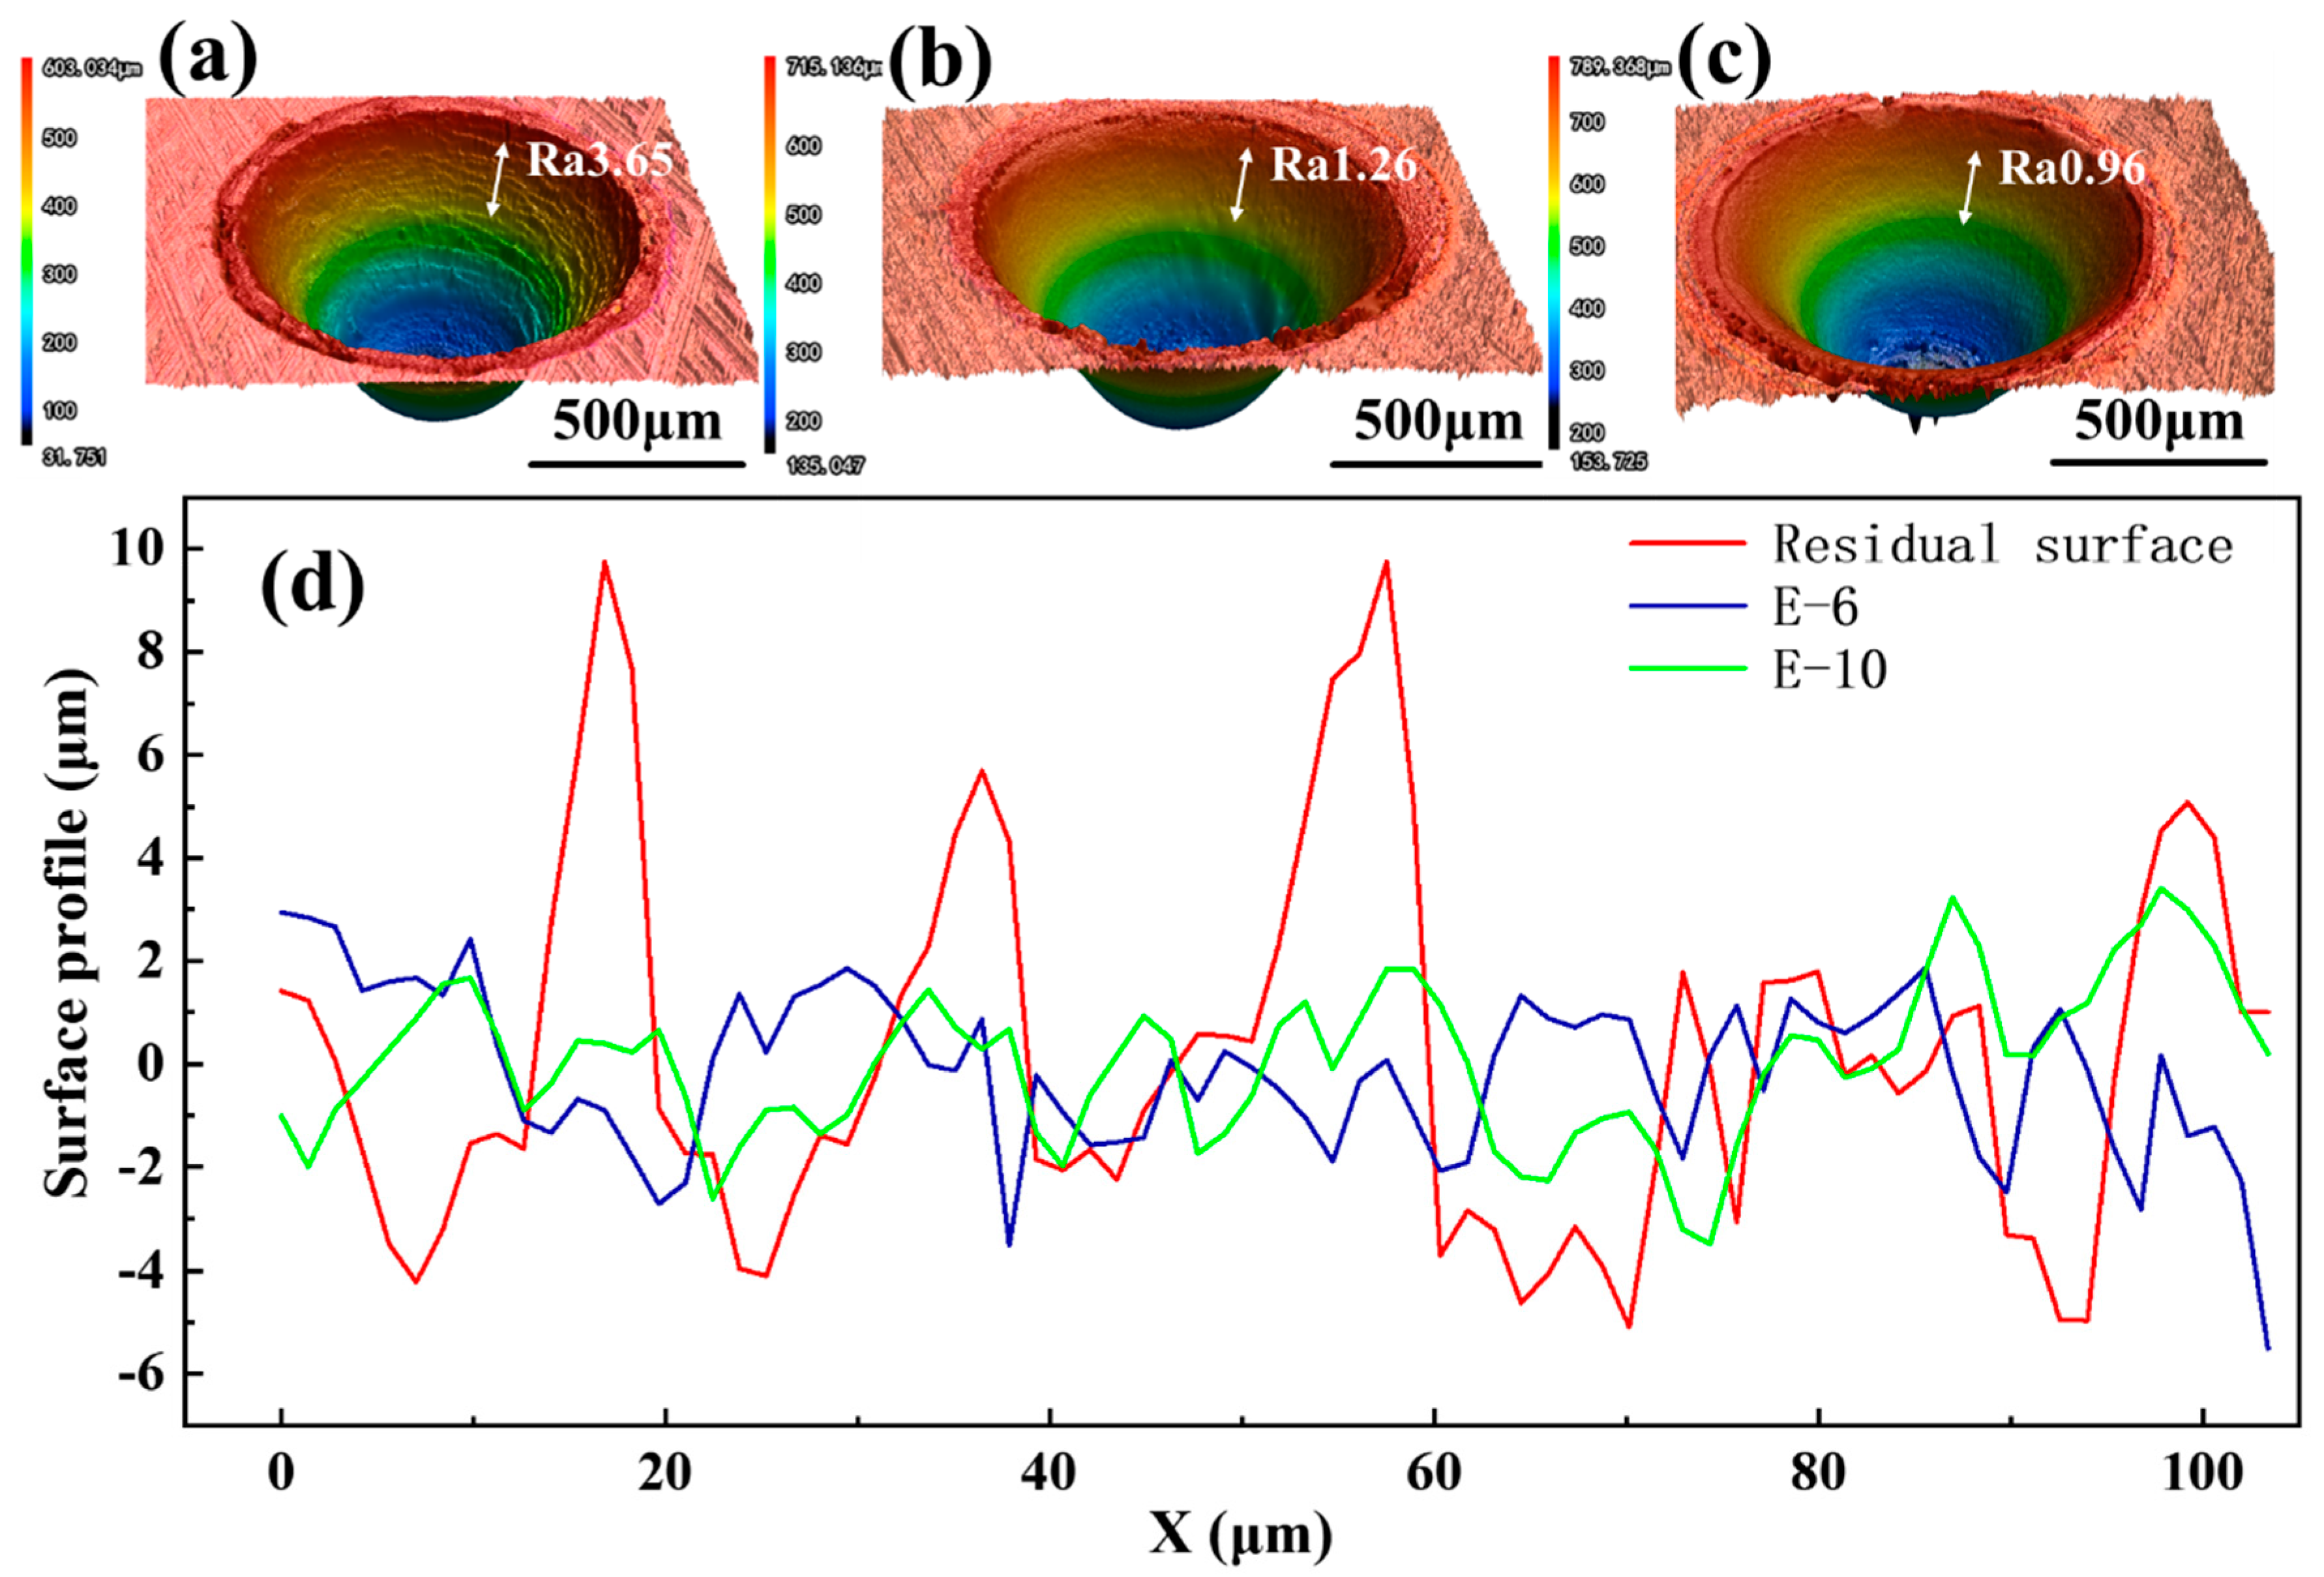
3.1.3. Application of Laser Polishing on Conical Hole

Figure 10 shows two sets of parameters, E-6 and E-10, and the scanning strategy used to polish a small hole with a diameter of 1 mm. The small hole was machined by ball-end milling cutters with the same micro-milling parameters in Table 2. The dynamic focusing function of the 3D galvanometer was utilized to keep the FOD constant during the conical surface polishing process, but the problem with laser polishing of the conical surface was that the light spot was deformed on the conical surface. The laser spot will be elongated along the inclined direction of the conical hole, but the diameter of the spot along the aperture direction is almost unaffected. The key to whether the average energy density on the plane can be applied to the cone is whether the overlap rate of the spot is large enough. The calculation formula of the overlap rate of the spot is shown in Equation (4) [25].
% S o = [ 1 V f · 2 r z ] × 100 %
The overlap rate of the two groups of parameters selected is 99.95% and 99.7%, respectively, so the two groups of preferred parameters are introduced into the cone polishing for verification based on the same average energy density. It can be clearly seen that the machining residue on the surface of the conical hole is eliminated after polishing, achieving the effect of reducing roughness (Figure 10a–c). Comparing the surface profile and roughness changes in a conical hole wall with a length of 103 μm, the average line roughness decreased from Ra 3.65 μm to Ra 1.26 and 0.96 μm; the reduction rate of roughness was 60.4% and 73.6% respectively, and the effect was even better than the polishing on the planar surface under the same conditions. The surface profile changes are shown in Figure 10d, which are basically consistent with the surface profile changes after plane polishing. The changes in roughness and surface profile effectively demonstrated the applicability of nanosecond laser polishing ball-milling residual surfaces on small conical hole surfaces. The scanning time required by the two optimal strategies and parameters is 10.4 s and 16.9 s, respectively, for polishing the surface of the conical hole, which significantly improves the surface finishing efficiency of the small conical hole after rough machining.

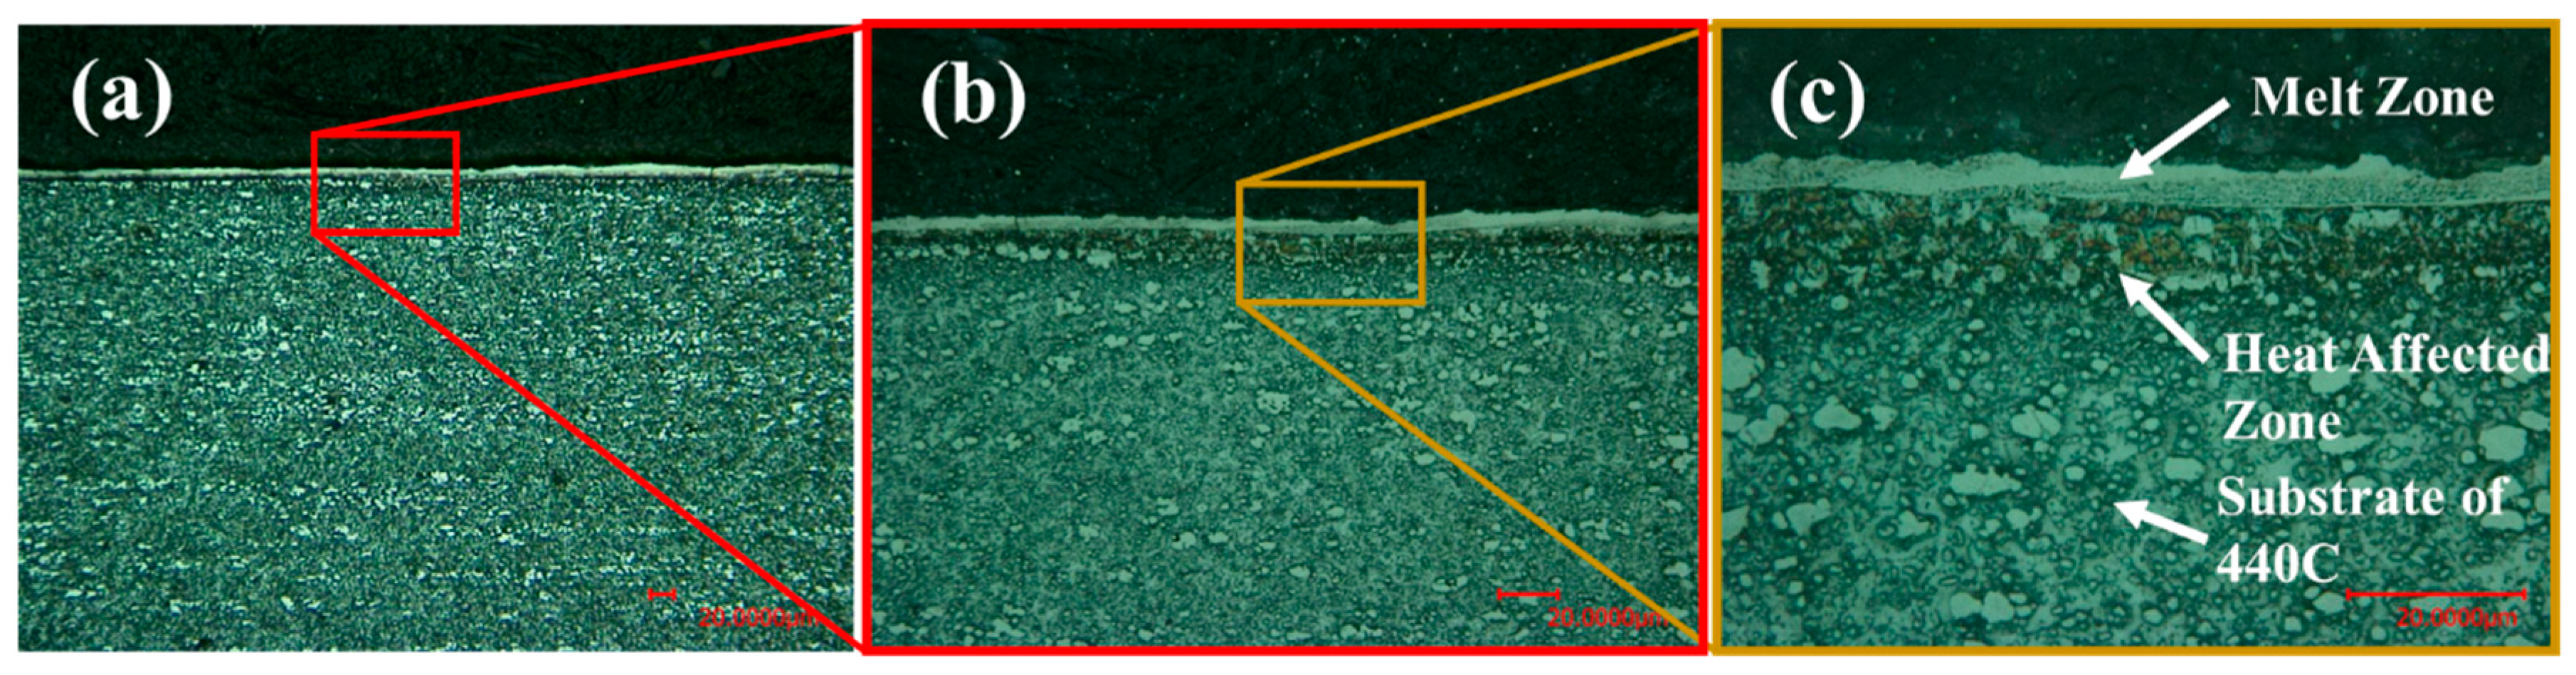
3.2. Analysis of Microstructure and Metallography

As observed from the variation in roughness and surface profile discussed above, the surface melting effect after nanosecond laser polishing was not as rapid as continuous-wave laser polishing, but it gradually melted the flow; thus, the surface MZ was shallow, and the common continuous-wave laser polishing molten pool was deep; the depth produced by normal continuous-wave laser polishing was 50–150 µm [28,36,37,38], with the lowest depth exceeding 20 µm [39]; for the part surface with smaller basic size, continuous-wave laser polishing, although it could reduce the surface roughness to a low level, had a large effect layer on the material substrate. The nanosecond laser was different; the microstructure and metallography of the polished section are shown in Figure 11. Phase changes in the MZ, heat-affected zone (HAZ), and substrate can be observed (Figure 11c). The thickness of the MZ was maintained below 5 μm, and the average thickness of the HAZ was 7–9 μm.
The thickness of the MZ was the most intuitive measure for determining the material’s influence (Figure 12 and Figure 13). The cross-section view of group E-6 is shown in Figure 12a–e, and E-10 in Figure 13a–e. As shown in Figure 12f and Figure 13f, the average thickness of the MZ gradually increased; the shallowest MZ of the two groups were 0.85 and 1.69 µm, and the thickest layers were 3.09 and 3.58 µm. The thickness of the MZ multiplied during subsequent scans was controlled below 4 µm; with the measured molten pool depth by Jang et al. [22], the effect of nanosecond laser polishing differed slightly. Therefore, compared with high-power continuous wave laser polishing, it is suitable for polishing the internal surface of small conical hole parts.

3.3. Analysis of Surface Components

The cross-sectional areas in Figure 12b and Figure 13e were scanned to obtain the EDS. These groups had the best polishing effect, and thus, the elemental changes on their surfaces were observed. As shown in Figure 14, the surface after laser polishing oxygen had the highest content under atmospheric conditions, which indicated that the surface oxide of Fe, the oxide of chromium, and the oxides of other components existed after laser polishing. The superficial layers had varying degrees of increased chromium and carbon, in addition to the increase in the oxygen content. Element enrichment is often observed on surfaces after laser treatment; for example, laser treatment of aluminum alloys can lead to surface Si enrichment due to the melting of the aluminum phase before silicon [27]. As the melting point of chromium was higher than that of iron, during the laser-swept cooling process, chromium in the molten pool solidified first to the upper surface layer, which caused the enrichment of chromium in the MZ.
The changes in surface elements were not limited to the precipitation of chromium. Polishing of stainless steel materials without protective gas inevitably introduced other elements, such as oxygen and carbon; the introduction of oxygen and carbon during the polishing process showed no positive effect on the material surface. The oxygen content introduced by the first polishing process was 32%, and the carbon content was approximately 10% (Figure 15). After multiple subsequent scans, the changes in the surface element content were concentrated on the fluctuations of Fe and chromium. The oxygen was maintained at around 32%; the carbon was maintained at around 10%, and the content did not increase due to multiple scans.

3.4. Analysis of Microhardness and Residual Stress

The hardness of the material surface after polishing was measured by a microhardness instrument, and the values were expressed as Vickers hardness. The surface hardness change can be side-evaluated by the effect of temperature on the polished surface. The surface microhardness after laser scanning was considerably higher than that of the substrate in both titanium alloy and stainless steel 316L [37,39,40]. After scanning and polishing under the parameters of E-6 and E-10, the surface hardness increased considerably to 679.1 and 404.1 HV, respectively. After laser polishing, the surface underwent secondary heating and cooling, which changed the phase near the surface, generating some chromium oxides and iron–chromium intermetallic compounds. The hardness of chromium oxides is considerably higher than that of the 440C matrix. Thus, after laser polishing, the surface hardness improved considerably. Under the parameters of E-6, the average energy density was higher than that of E-10, which resulted in a greater energy per unit area, a greater temperature rise, and more significant phase changes per unit area. Figure 16 reveals that the increase in surface hardness under the parameters of E-6 was greater than that under the parameters of E-10.
The microhardness values of the two groups stabilized in subsequent scans because oxygen and carbon did not show significant changes as the number of scans increased. The surface layer underwent several cycles of melting and remelting, and the surface image remained unchanged, which resulted in a stable surface hardness. The maximum hardness of E-6 was 679.1 HV, which was 177.5% higher than before polishing. The maximum hardness of E-10 was 493.5 HV, and a value of 101.7%, which was higher than that before polishing, was observed. Therefore, laser polishing can considerably improve the surface hardness of the 440C surface while smoothing it.
The residual stresses on the initial surface and the laser-polished surface are shown in Figure 17, where two residual stresses parallel to the milling direction and scanning direction are measured, respectively. The residual stress on the initial surface is very small, and the residual stress parallel to the milling direction is slightly greater than the scanning direction, and the residual stress on the surface after laser polishing also shows such a trend, but the residual tensile stress increases, and the residual stress after polishing of the two groups of optimal groups is in the range of 600~800 MPa. Due to the residual tensile stress on the polished surface caused by the rapid cooling and solidification of the material after melting, the results are independent of the direction of milling and laser polishing.

3.5. Summary

The Sa of the pre-machined residual surface was measured to be 2.797 μm and was reduced to 2.563 and 2.401 μm, respectively, by laser scanning with two sets of optimized parameters. When the average energy density is 1538~1875 J/cm2, the polishing effect is obvious. After several scans, the surface roughness was further optimized to a minimum Sa of 1.63 µm. The same parameters and scanning strategy were used to polish the milling cone hole at the ball end. The original roughness Ra of the inner surface of the cone hole was 3.65 μm. After polishing, Ra decreased to 1.26 μm and 0.96 μm, respectively. Compared with continuous laser polishing, the MZ of nanosecond laser polishing is very shallow. With the increase in scanning times, its shallowest value is only 0.85 μm, and it is relatively stable below 4 μm. The surface elements change with the laser polishing in the atmospheric environment, and the oxygen and carbon elements increase to 32% and 10%, respectively, and tend to be stable. Due to the precipitation of chromium elements in the polishing process, the formation of new compounds increases the hardness, and the maximum surface hardness increases by 177.5% and 101.7%, respectively. Due to the rapid cooling and solidification, the residual tensile stress is increased to the range of 600~800 MPa after laser polishing.

4. Conclusions

Research into the application of nanosecond laser polishing on high-roughness surfaces following ball-end milling of stainless steel materials is notably sparse. The 440C stainless steel was chosen for this study due to its widespread use in the fabrication of small components and its frequent employment in ball-end milling for inner surface machining. To mitigate the impact of residual surfaces on the inner surface properties of components, nanosecond laser polishing was applied to the residual surfaces post-ball-end milling. The primary conclusions drawn from this study are as follows:
  • A correlation was established between laser parameters and the surface polishing effect through a series of experiments. The findings indicate that the average energy density directly influences the polishing effect. Following multiple scanning iterations, the maximum roughness reduction rate achieved was 41.72%. Owing to variations in average energy density, the number of scans required to attain a specific roughness level differs. An analysis of the curvature, height, and volume of the surface peaks revealed the evolution trends of these two types of surfaces under different laser energy densities;
  • Identical parameters and scanning strategy were employed to polish the ball-end milled conical hole. Post-polishing with optimized parameters and scanning strategy, the maximum roughness reduction rate achieved was 73.6%. The applicability of the scanning strategy was validated, and the surface morphology post-polishing was found to be largely consistent with predictions. The melt layer and heat-affected zone resulting from nanosecond laser polishing were observed to be extremely shallow, thereby affirming the suitability of nanosecond laser polishing for the inner surface of small conical components and significantly preserving the dimensional integrity;
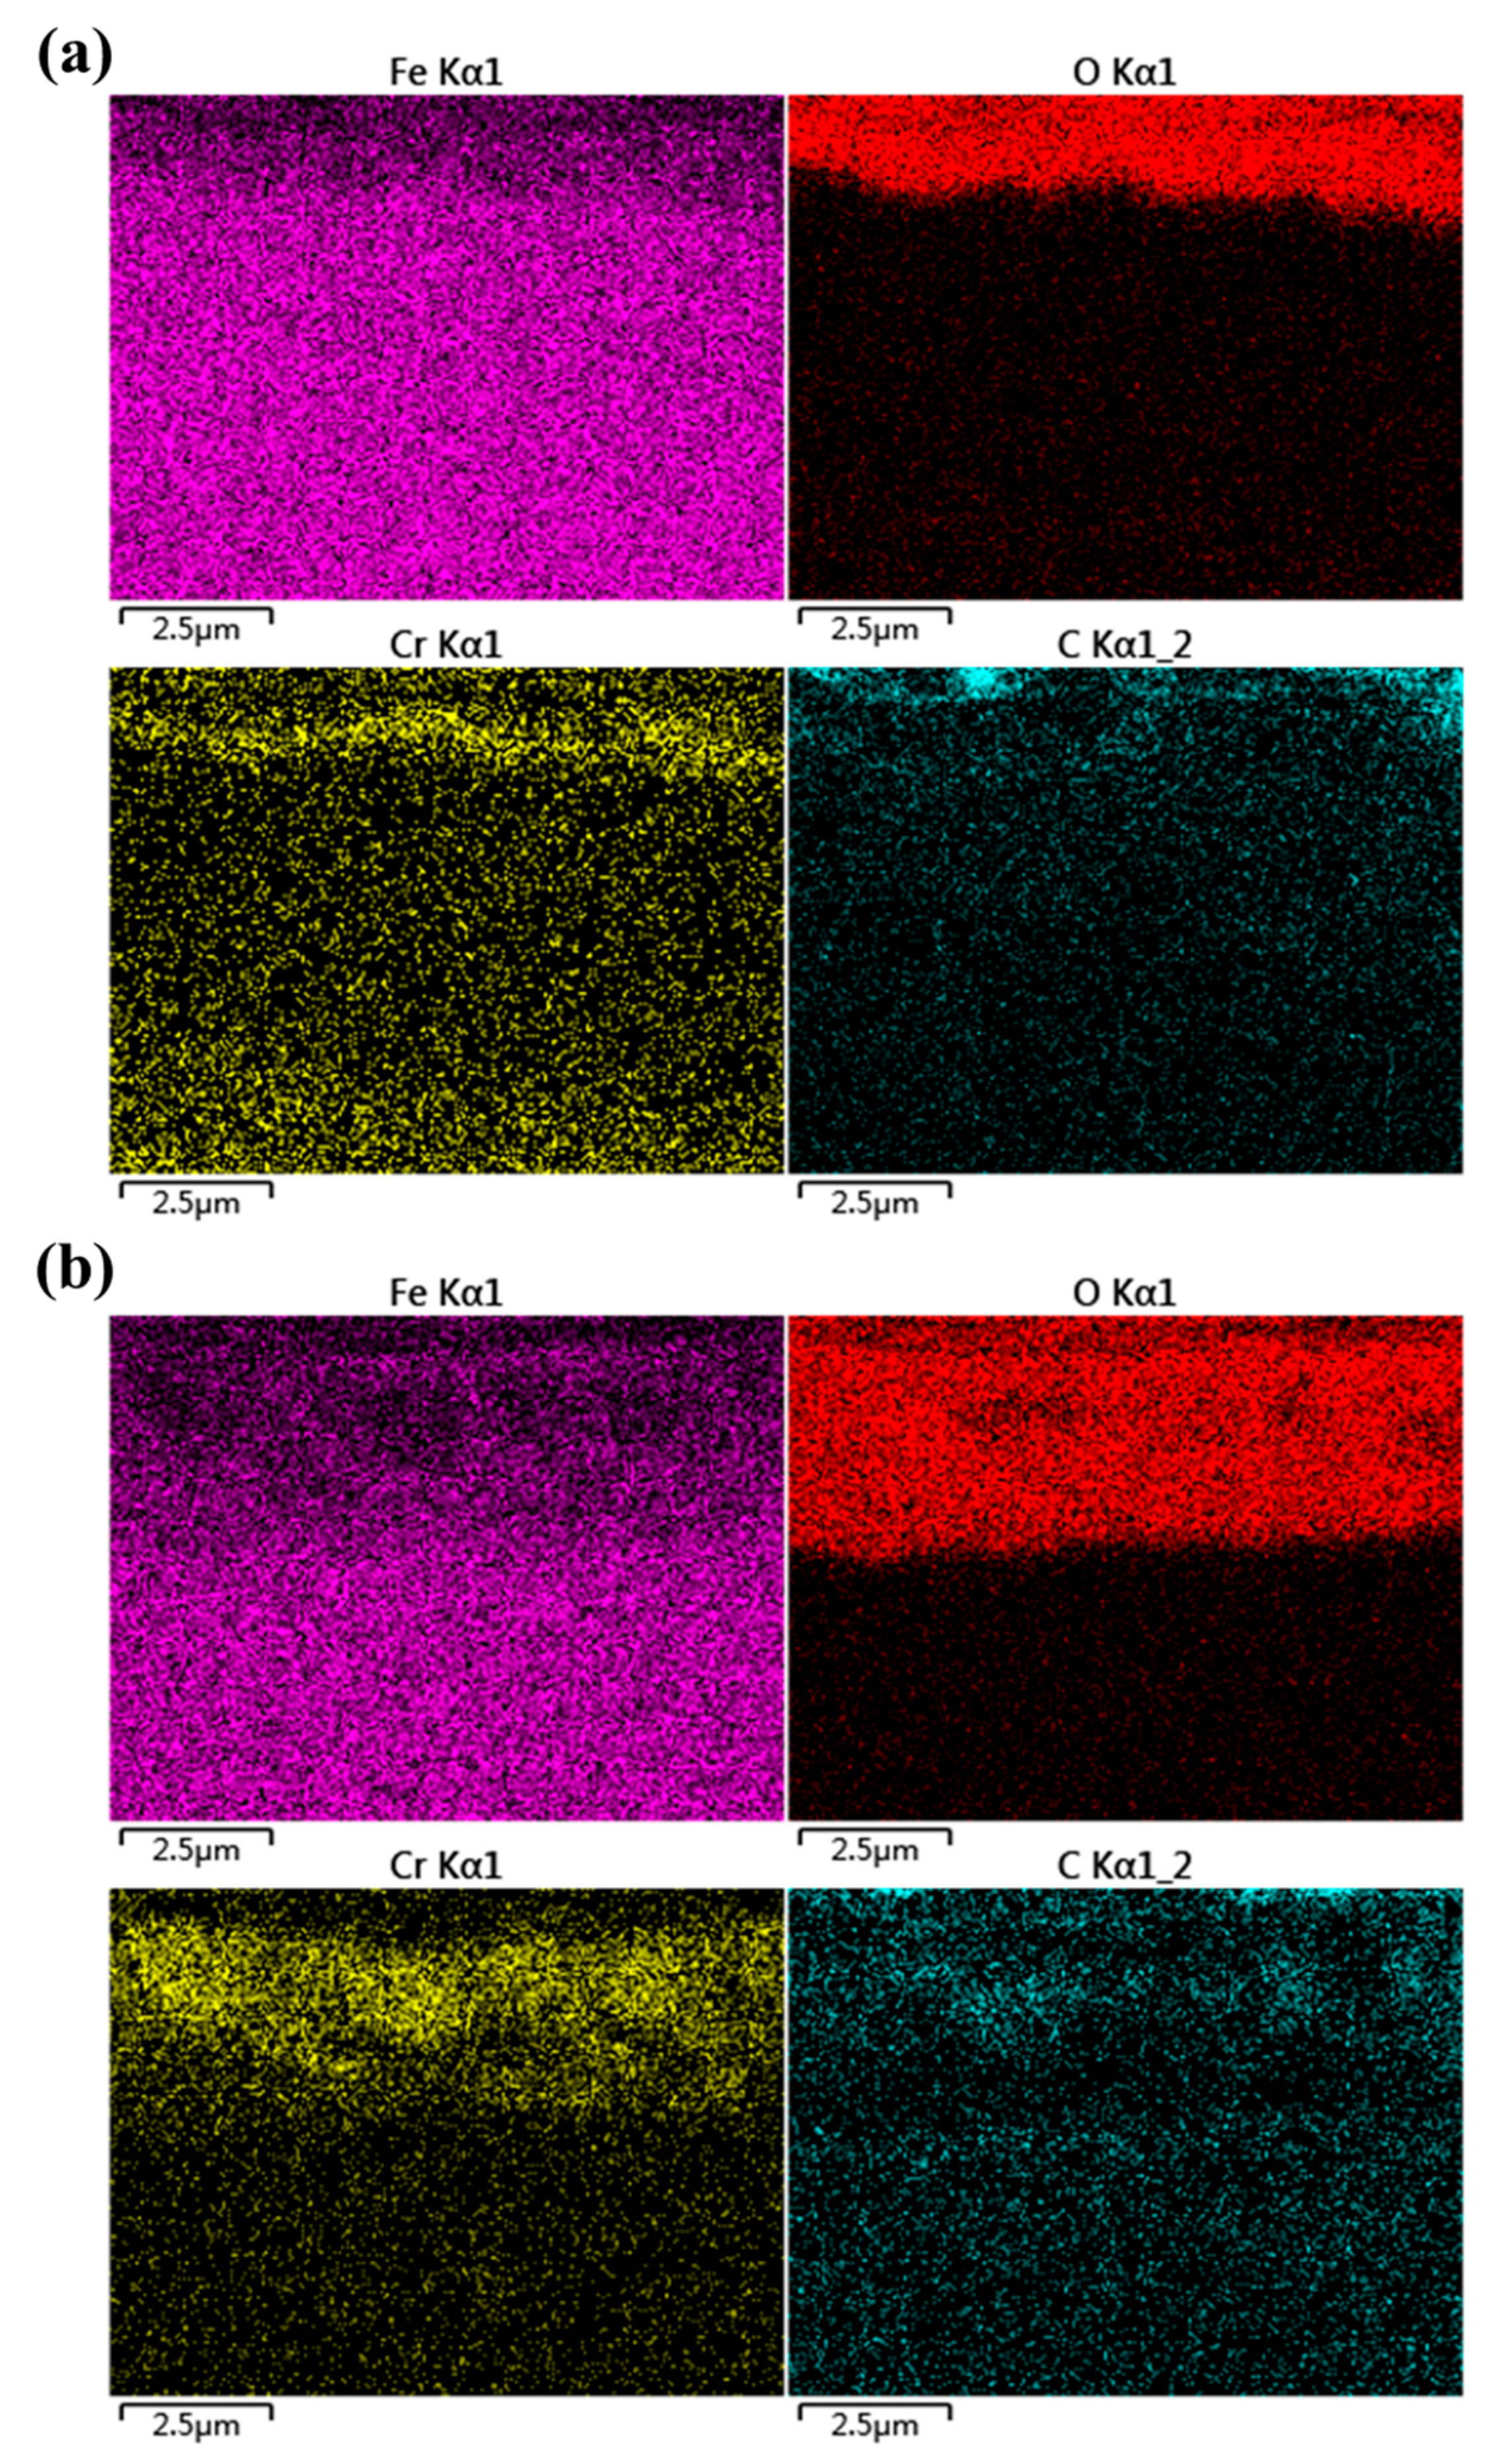
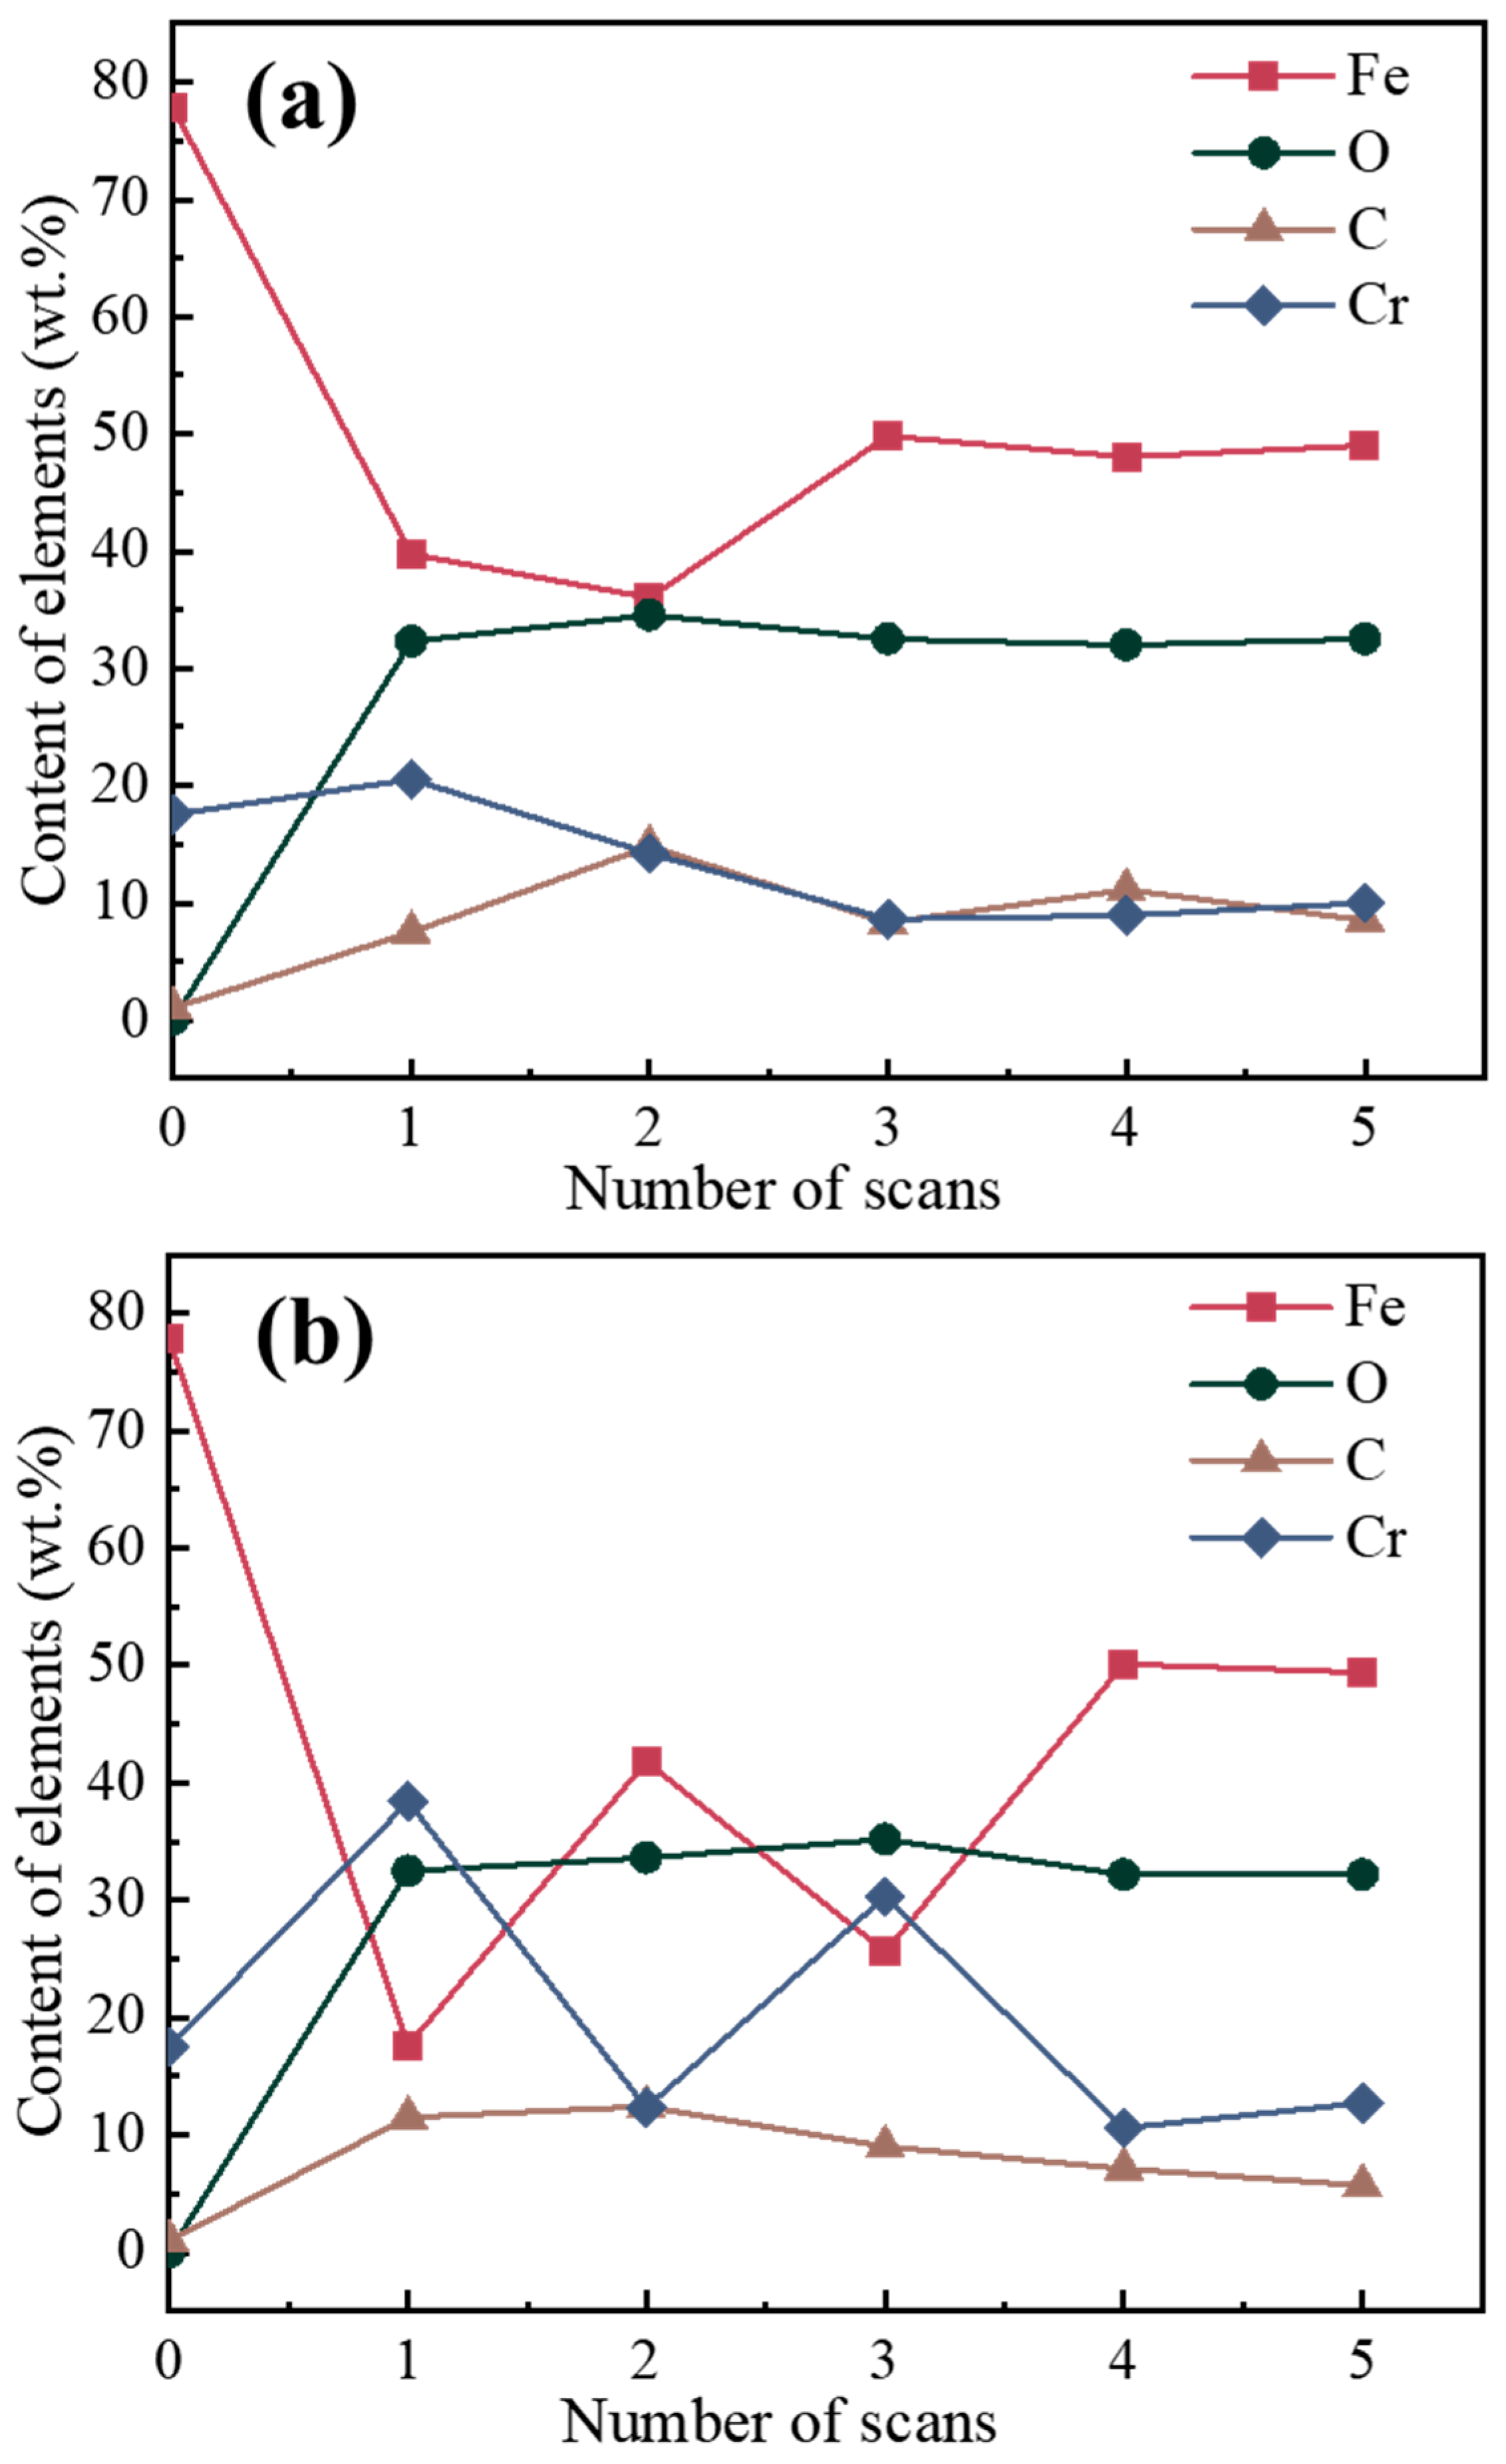
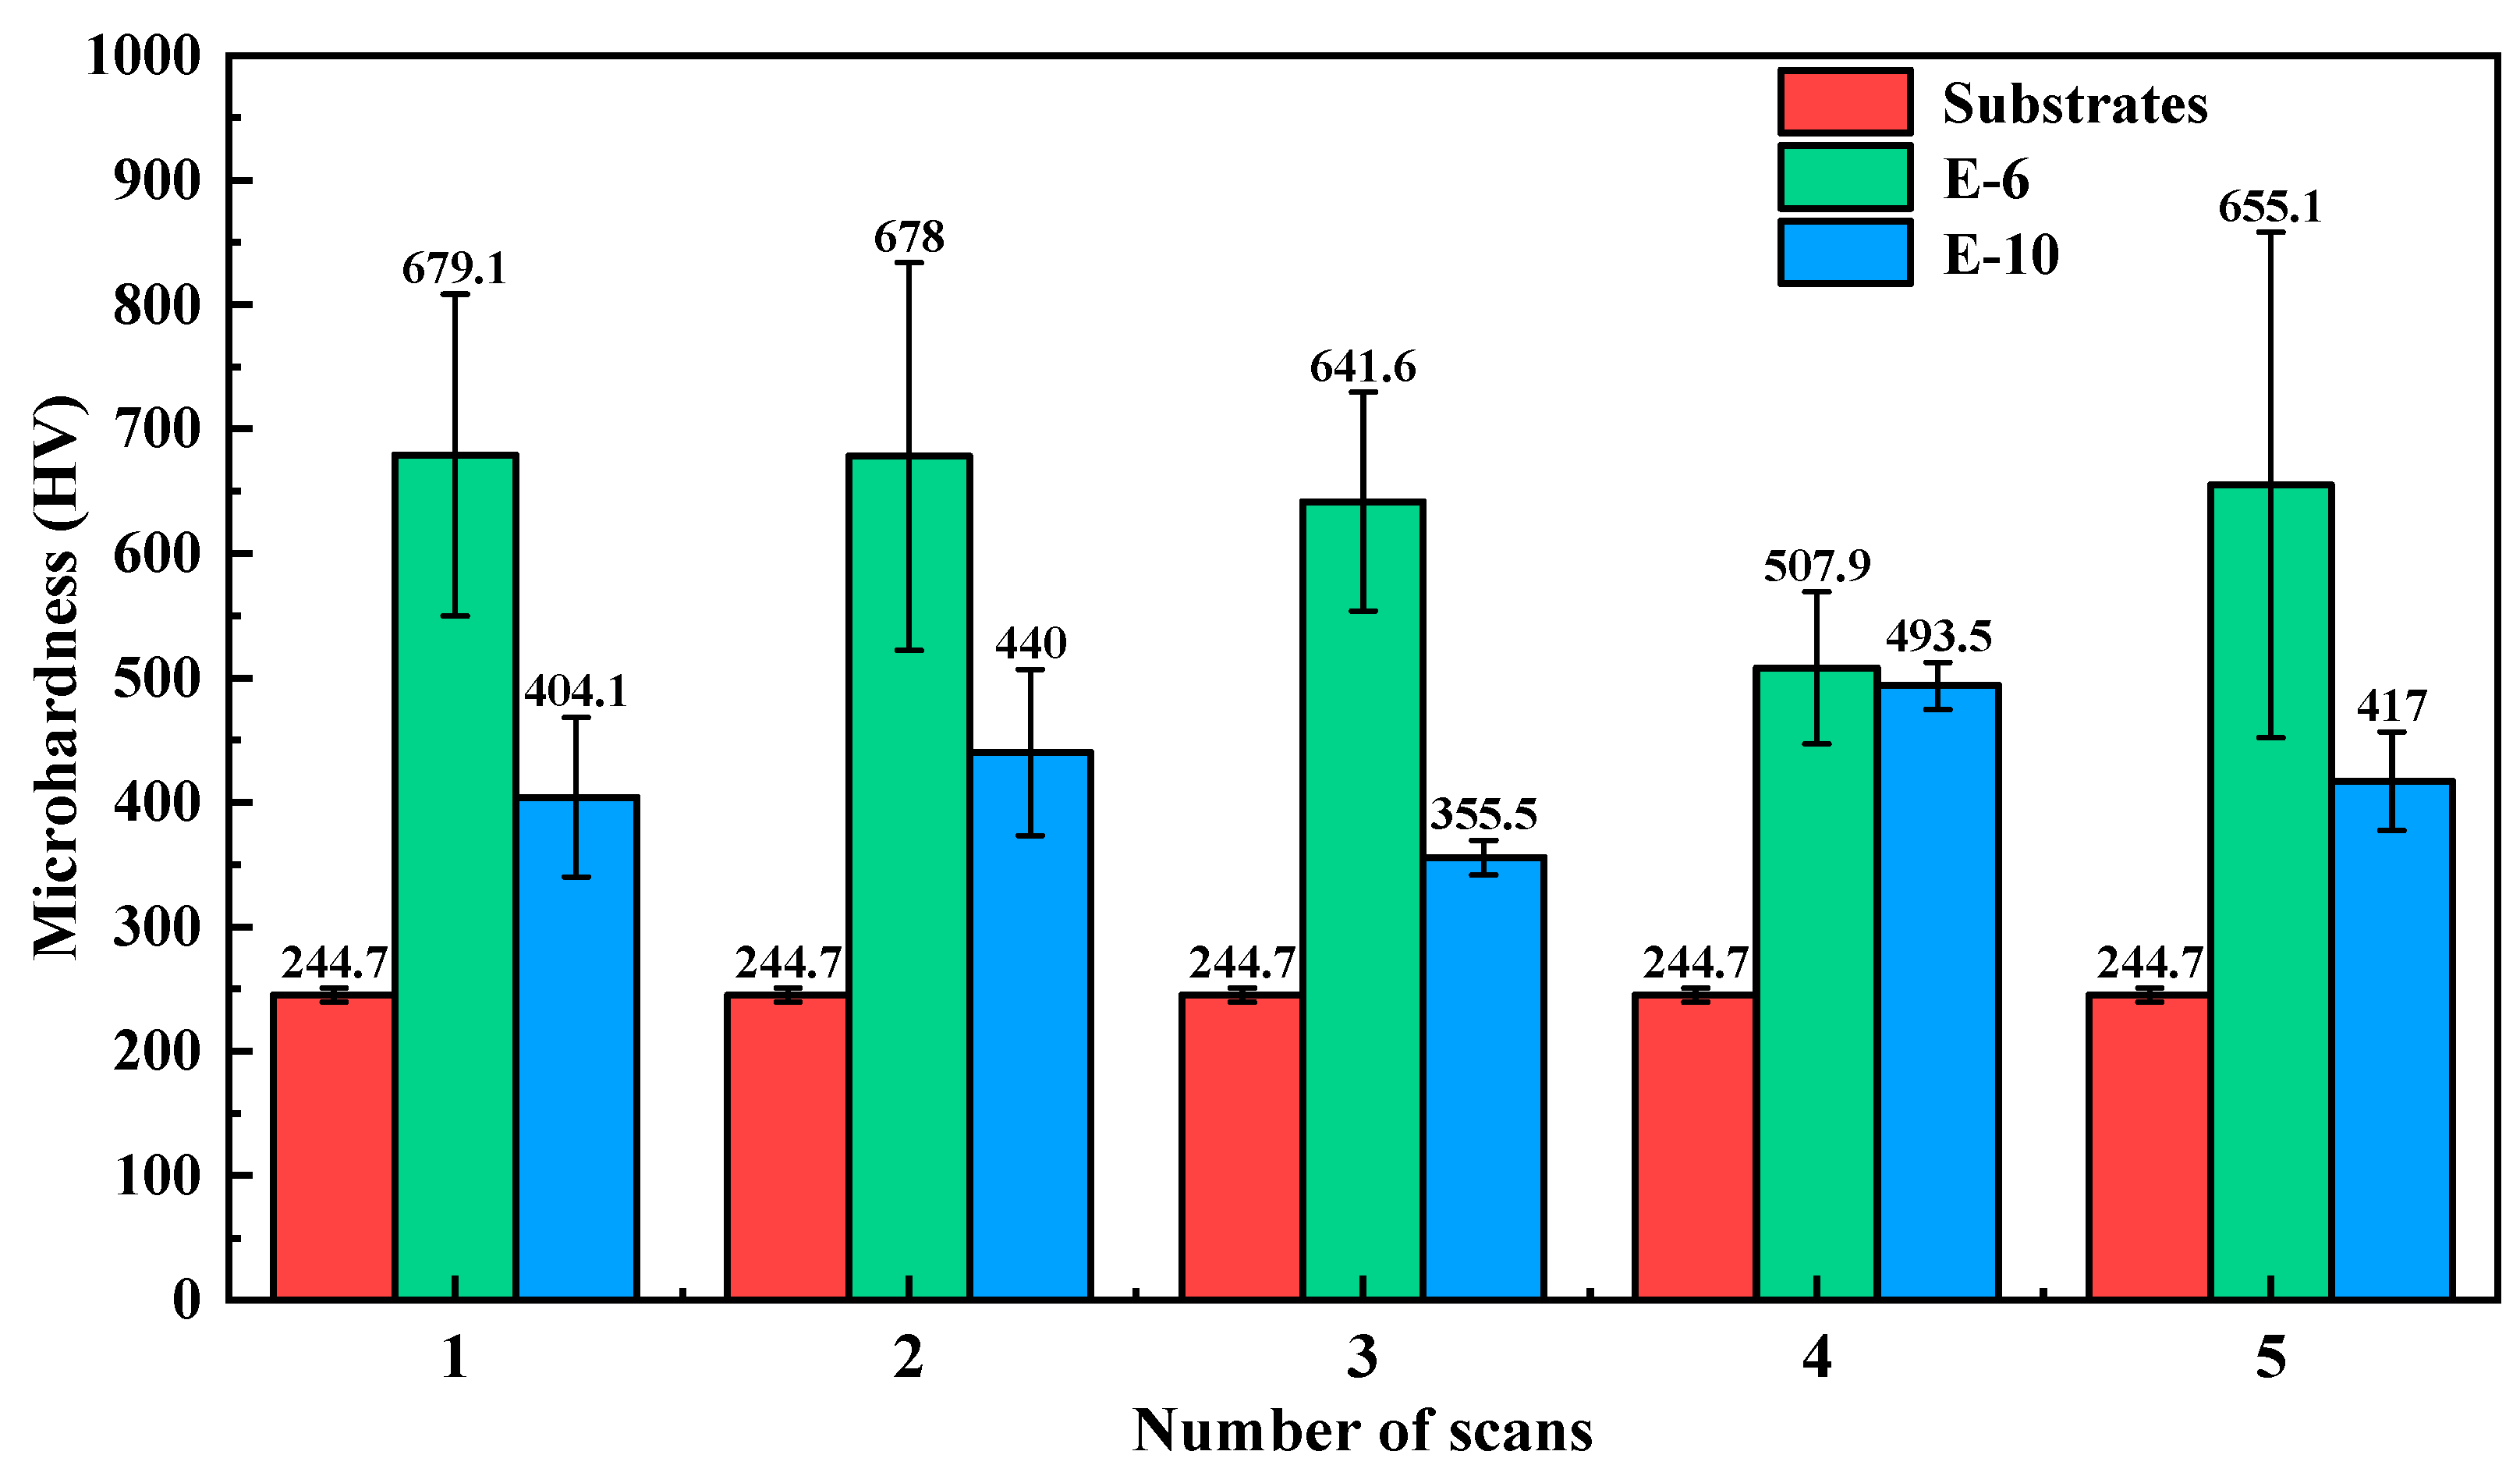
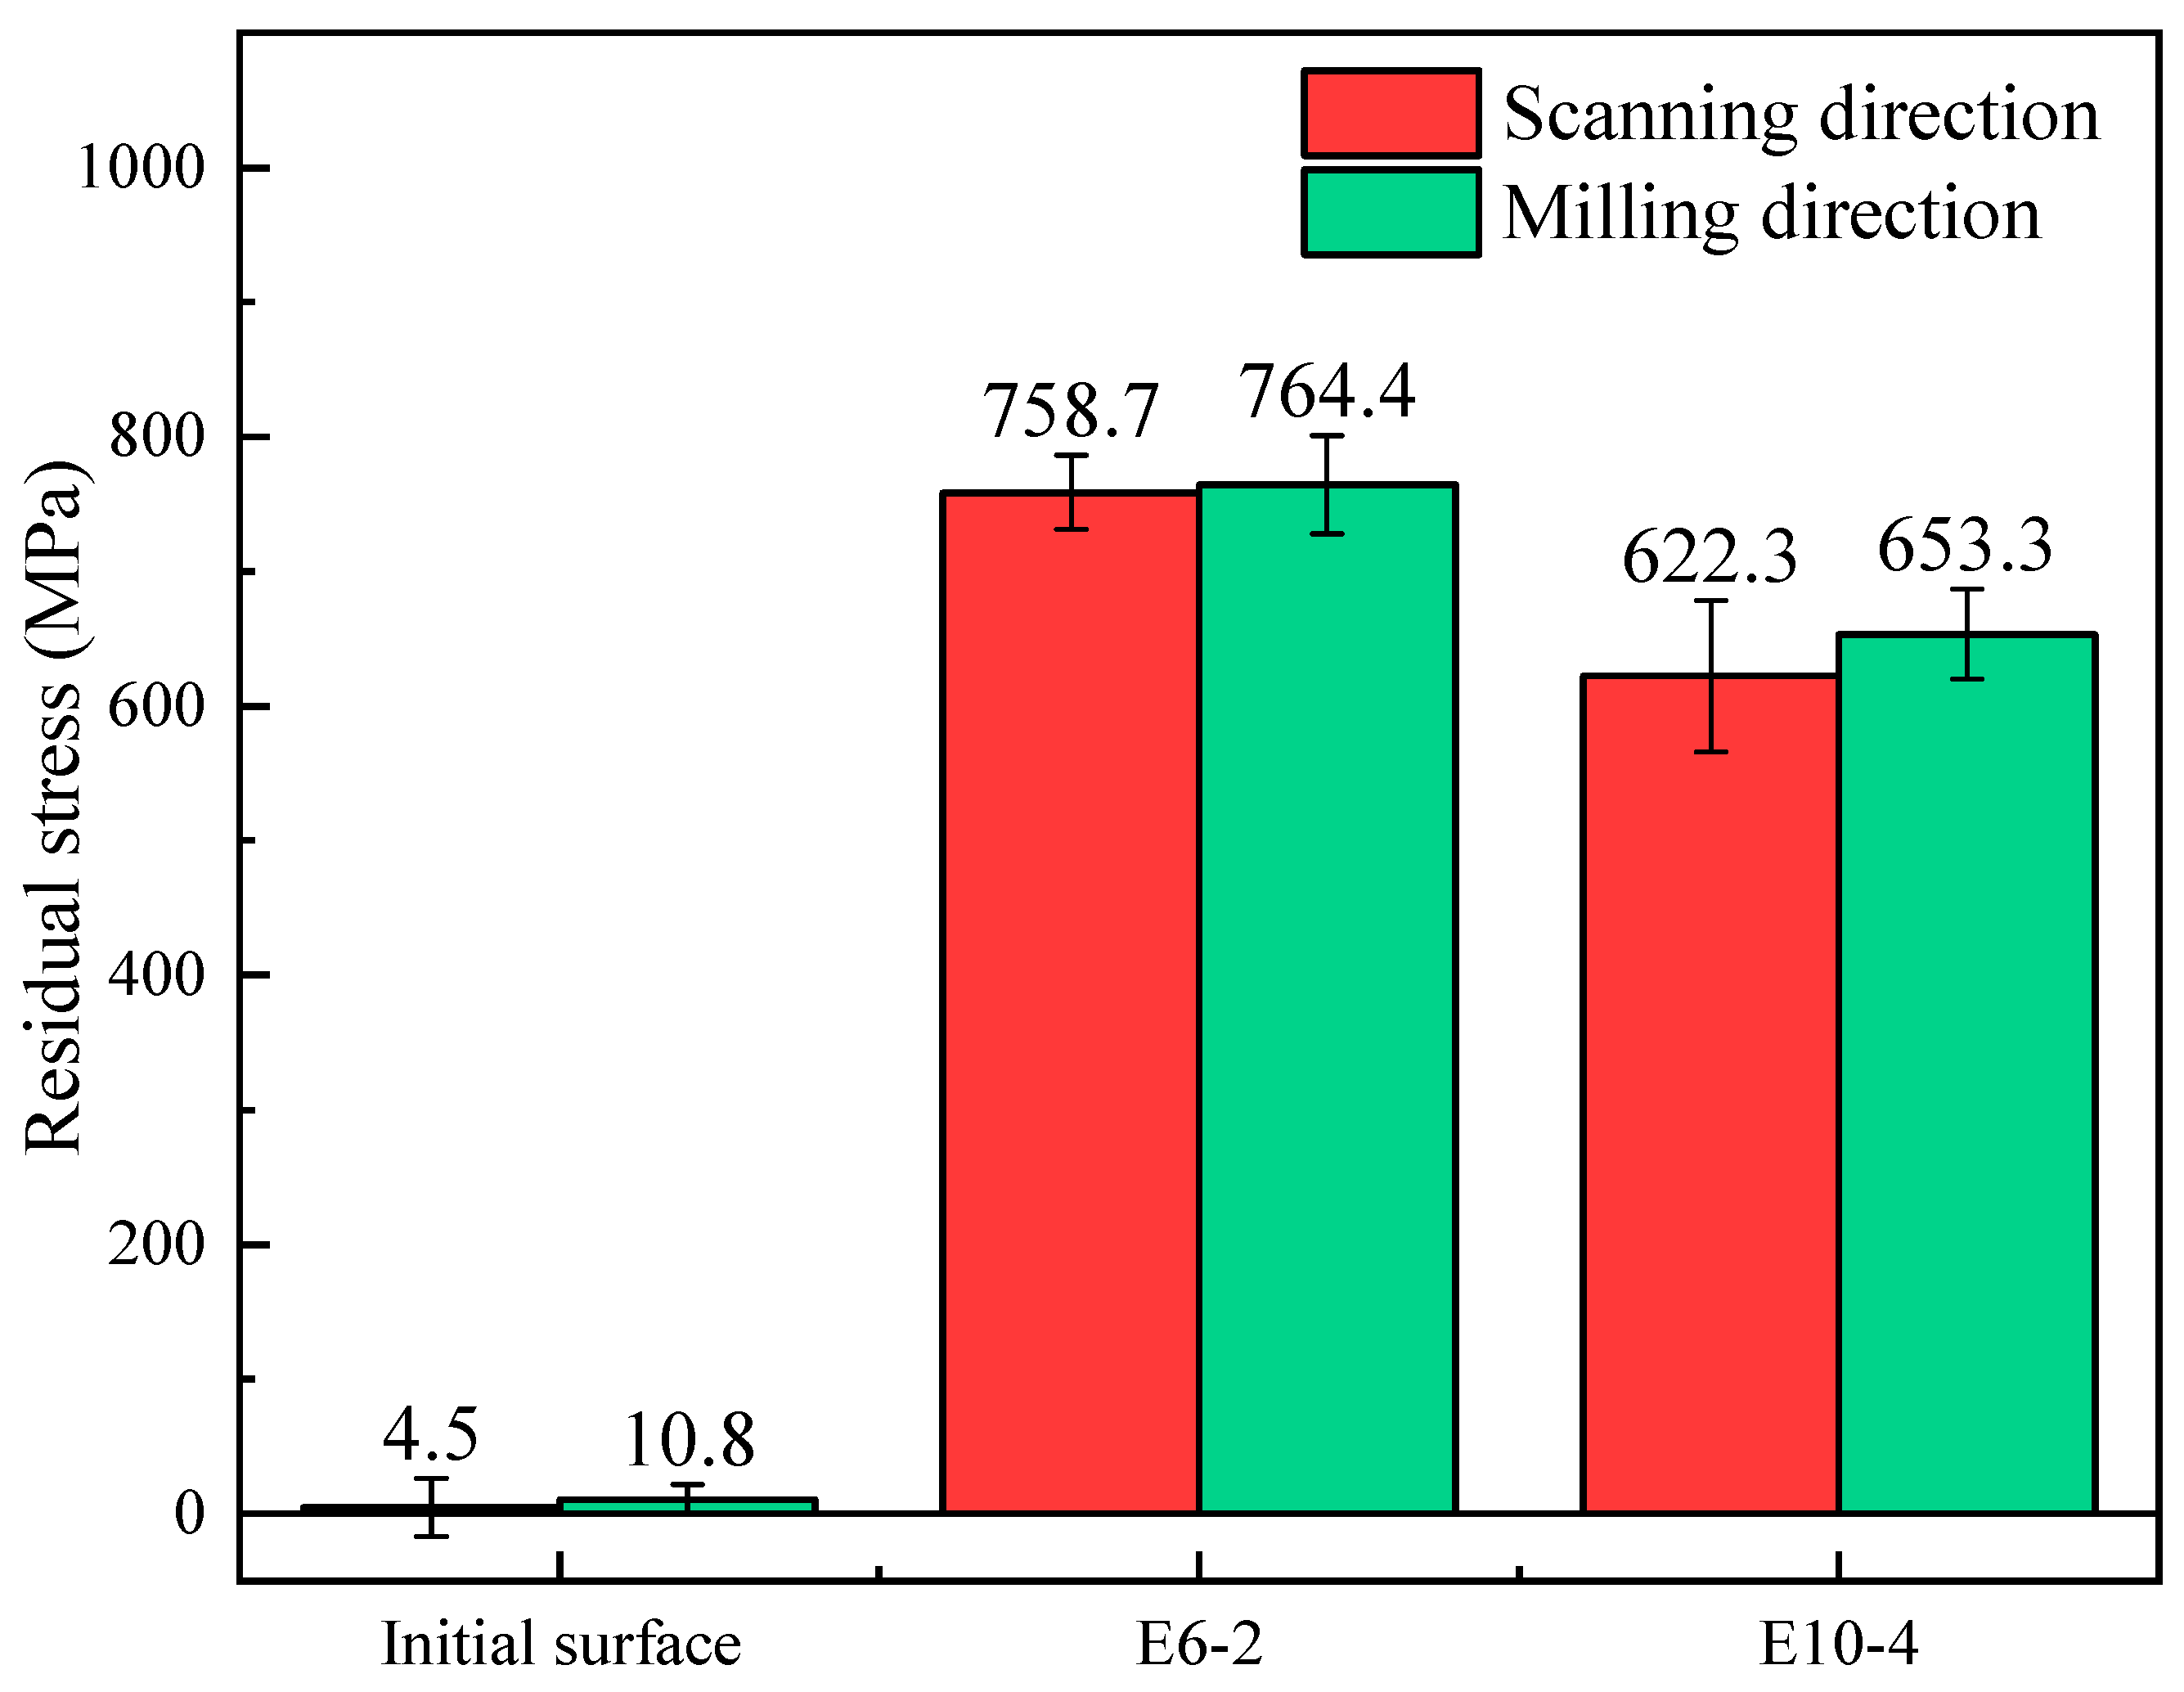
  • The oxygen content (O) in the melt zone (MZ) increased due to laser polishing under atmospheric conditions but did not rise with an increase in scanning iterations. Furthermore, owing to the differing melting points of various components, chromium (Cr) enrichment was observed on the polished surface, leading to an increase in chromium oxides and iron–chromium (Fe–Cr) intermetallic compounds on the surface, thereby significantly enhancing the surface microhardness. Simultaneously, due to rapid cooling and solidification, the residual tensile stress also saw a substantial increase post-laser polishing.

Author Contributions

Conceptualization, Y.C.; methodology, C.Z.; software, C.Z., H.Z. and J.L.; validation, Y.C., Q.S., B.W. and Z.L.; formal analysis, H.Z. and J.L.; investigation, C.Z.; resources, Y.C.; data curation, C.Z., H.Z. and J.L.; writing—original draft preparation, C.Z.; writing—review and editing, Y.C., Q.S., B.W. and Z.L.; visualization, C.Z.; supervision, Y.C.; project administration, Y.C., Q.S., B.W. and Z.L.; funding acquisition, Y.C. All authors have read and agreed to the published version of the manuscript.

Funding

The authors would like to acknowledge the financial support from the National Natural Science Foundation of China (52105461, 20221017-16) and the Natural Science Foundation of Shandong Province (ZR2020QE185). This work was supported by the Project for Demonstration platform for the production and application of key materials for high-performance CNC machine tools (2020-370104-34-03-043952-02). This work was also supported by the Project for Scientific Research Innovation Team of Young Scholars in Colleges and Universities of Shandong Province (2020KJB001) and the Key Laboratory of High-efficiency and Clean Mechanical Manufacture at Shandong University, Ministry of Education.

Data Availability Statement

The data presented in this study are available on request from the corresponding author. The data are not publicly available due to the privacy of further research by the authors' team.

Conflicts of Interest

The authors declare no conflict of interest.

References

  1. Balázs, B.Z.; Geier, N.; Takács, M.; Davim, J.P. A review on micro-milling: Recent advances and future trends. Int. J. Adv. Manuf. Technol. 2021, 112, 655–684. [Google Scholar] [CrossRef]
  2. Cai, Y.; Liu, Z.; Song, Q.; Shi, Z.; Wan, Y. Fluid mechanics of internal flow with friction and cutting strategies for micronozzles. Int. J. Mech. Sci. 2015, 100, 41–49. [Google Scholar] [CrossRef]
  3. Klauer, K.; Eifler, M.; Kirsch, B.; Seewig, J.; Aurich, J.C. Ball end micro milling of areal material measures: Influence of the tilt angle on the resulting surface topography. Prod. Eng. 2020, 14, 239–252. [Google Scholar] [CrossRef]
  4. Fayazfar, H.; Sharifi, J.; Keshavarz, M.K.; Ansari, M. An overview of surface roughness enhancement of additively manufactured metal parts: A path towards removing the post-print bottleneck for complex geometries. Int. J. Adv. Manuf. Technol. 2023, 125, 1061–1113. [Google Scholar] [CrossRef]
  5. Ermergen, T.; Taylan, F. Review on Surface Quality Improvement of Additively Manufactured Metals by Laser Polishing. Arab. J. Sci. Eng. 2021, 46, 7125–7141. [Google Scholar] [CrossRef]
  6. Mu, J.; Sun, T.; Leung, C.L.A.; Oliveira, J.; Wu, Y.; Wang, H.; Wang, H. Application of electrochemical polishing in surface treatment of additively manufactured structures: A review. Prog. Mater. Sci. 2023, 136, 101109. [Google Scholar] [CrossRef]
  7. Mohammadian, N.; Turenne, S.; Brailovski, V. Electropolishing of Laser Powder Bed-Fused IN625 Components in an Ionic Electrolyte. J. Manuf. Mater. Process. 2019, 3, 86. [Google Scholar] [CrossRef]
  8. Urlea, V.; Brailovski, V. Electropolishing and electropolishing-related allowances for powder bed selectively laser-melted Ti-6Al-4V alloy components. J. Mater. Process. Technol. 2017, 242, 1–11. [Google Scholar] [CrossRef]
  9. Atzeni, E.; Barletta, M.; Calignano, F.; Iuliano, L.; Rubino, G.; Tagliaferri, V. Abrasive Fluidized Bed (AFB) finishing of AlSi10Mg substrates manufactured by Direct Metal Laser Sintering (DMLS). Addit. Manuf. 2016, 10, 15–23. [Google Scholar] [CrossRef]
  10. Tan, K.L.; Yeo, S.H. Surface modification of additive manufactured components by ultrasonic cavitation abrasive finishing. Wear 2017, 378–379, 90–95. [Google Scholar] [CrossRef]
  11. Zhang, J.; Chaudhari, A.; Wang, H. Surface quality and material removal in magnetic abrasive finishing of selective laser melted 316L stainless steel. J. Manuf. Process. 2019, 45, 710–719. [Google Scholar] [CrossRef]
  12. Ali, M.; Almotari, A.; Algamal, A.; Qattawi, A. Recent Advancements in Post Processing of Additively Manufactured Metals Using Laser Polishing. J. Manuf. Mater. Process. 2023, 7, 115. [Google Scholar] [CrossRef]
  13. Gisario, A.; Barletta, M.; Veniali, F. Laser polishing: A review of a constantly growing technology in the surface finishing of components made by additive manufacturing. Int. J. Adv. Manuf. Technol. 2022, 120, 1433–1472. [Google Scholar] [CrossRef]
  14. Manco, E.; Cozzolino, E.; Astarita, A. Laser polishing of additively manufactured metal parts: A review. Surf. Eng. 2022, 38, 217–233. [Google Scholar] [CrossRef]
  15. Kumstel, J. Laser polishing of metallic freeform surfaces by using a dynamic laser beam preforming system. J. Laser Appl. 2021, 33, 022020. [Google Scholar] [CrossRef]
  16. Rosa, B.; Mognol, P.; Hascoët, J. Laser polishing of additive laser manufacturing surfaces. J. Laser Appl. 2015, 27, S29102. [Google Scholar] [CrossRef]
  17. Yung, K.C.; Xiao, T.Y.; Choy, H.S.; Wang, W.J.; Cai, Z.X. Laser polishing of additive manufactured CoCr alloy components with complex surface geometry. J. Mater. Process. Technol. 2018, 262, 53–64. [Google Scholar] [CrossRef]
  18. Mohajerani, S.; Miller, J.D.; Tutunea-Fatan, O.R.; Bordatchev, E.V. Thermo-Physical Modelling of Track Width During Laser Polishing of H13 Tool Steel. Procedia Manuf. 2017, 10, 708–719. [Google Scholar] [CrossRef]
  19. Zhao, L.; Klopf, J.M.; Reece, C.E.; Kelley, M.J. Laser polishing for topography management of accelerator cavity surfaces: Laserpolieren als Topographiemanagement zur schnellen Herstellung von Oberflächen mit Mulden. Mater. Werkst. 2015, 46, 675–685. [Google Scholar] [CrossRef]
  20. Zhihao, F.; Libin, L.; Longfei, C.; Yingchun, G. Laser Polishing of Additive Manufactured Superalloy. Procedia CIRP 2018, 71, 150–154. [Google Scholar] [CrossRef]
  21. Krishnan, A.; Fang, F. Review on mechanism and process of surface polishing using lasers. Front. Mech. Eng. 2019, 14, 299–319. [Google Scholar] [CrossRef]
  22. Jang, P.-R.; Kim, C.-G.; Kim, J.-H.; Jang, Y.-S.; Jo, C.-I. Dynamic Simulation analysis for laser micro-polishing process of metallic surface using UV nanosecond pulse laser. J. Braz. Soc. Mech. Sci. Eng. 2021, 43, 526. [Google Scholar] [CrossRef]
  23. Li, N.; Fan, P.; Zhu, Q.; Cui, B.; Silvain, J.-F.; Lu, Y.F. Femtosecond laser polishing of additively manufactured parts at grazing incidence. Appl. Surf. Sci. 2023, 612, 155833. [Google Scholar] [CrossRef]
  24. Xu, X.; Chen, X.; Zhou, Y.; Li, Y.; Liu, M. Laser Polishing and Annealing Injection Mold Using Dual-Beam Laser System. Coatings 2022, 12, 1822. [Google Scholar] [CrossRef]
  25. Shao, Y.; Sun, S.; Wang, P.; Zhang, F.; Wang, X.; Monka, P.P.; Liu, J.; Kim, D. Selective and noncontaminated surface polishing of medical Ti-6Al-4V titanium alloy by laser chemical processing. Opt. Eng. 2022, 61, 116107. [Google Scholar] [CrossRef]
  26. Li, P.; Wang, Y.; Li, L.; Gong, Y.; Zhou, J.; Lu, J. Ablation oxidation and surface quality during laser polishing of TA15 aviation titanium alloy. J. Mater. Res. Technol. 2023, 23, 6101–6114. [Google Scholar] [CrossRef]
  27. Bhaduri, D.; Ghara, T.; Penchev, P.; Paul, S.; Pruncu, C.I.; Dimov, S.; Morgan, D. Pulsed laser polishing of selective laser melted aluminium alloy parts. Appl. Surf. Sci. 2021, 558, 149887. [Google Scholar] [CrossRef]
  28. Yi, C.; Chen, X.; Chen, X.; Chen, T.; Zhang, W. Surface features of multi-beam coupling nanosecond laser processing of nickel-based superalloys. In Proceedings of the Seventeenth National Conference on Laser Technology and Optoelectronics, Shanghai, China, 17–20 October 2020; Chen, W., Qiu, J., Zhang, Z., Zhu, J., Wang, P., Eds.; SPIE: Washington, DC, USA, 2022; p. 15. [Google Scholar] [CrossRef]
  29. Chen, Y.-D.; Tsai, W.-J.; Liu, S.-H.; Horng, J.-B. Picosecond laser pulse polishing of ASP23 steel. Opt. Laser Technol. 2018, 107, 180–185. [Google Scholar] [CrossRef]
  30. Yi, C.; Chen, X.; Zhou, Y.; Chen, T.; Zhang, W. Effects of scanning speed and scanning times on surface quality of line spot laser polishing of nickel-based superalloys. J. Mater. Res. Technol. 2023, 26, 2179–2190. [Google Scholar] [CrossRef]
  31. Yao, J.; Huang, J.; Wang, G.; Min, D.; Wang, L. Pulsed Laser Polishing Mechanism on High Roughness Surface Cut by Wire Electrical Discharge Machining. Chin. J. Lasers-Zhongguo Jiguang 2021, 48, 1402003. [Google Scholar] [CrossRef]
  32. Jaritngam, P.; Saetang, V.; Qi, H.; Dumkum, C. Surface polishing of additively manufactured Ti6Al4V titanium alloy by using a nanosecond pulse laser. Int. J. Adv. Manuf. Technol. 2023, 127, 3463–3480. [Google Scholar] [CrossRef]
  33. Wei, L.; Du, C.; Zhao, H. Effects of Laser Power on Quenched Microstructure and Properties of 440C Steel. Hot Work. Technol. 2023, 52, 146–158. [Google Scholar] [CrossRef]
  34. Bang, G.B.; Hwang, Y.J.; Kim, W.R.; Song, Y.H.; Kim, G.H.; Hyun, S.-K.; Cha, S.C.; Park, H.J.; Lee, T.W.; Kim, H.G. Microstructural and mechanical properties of AISI 440C stainless steel fabricated using selective laser melting. Mater. Sci. Eng. A 2022, 860, 144259. [Google Scholar] [CrossRef]
  35. Lim, D.-W.; Kim, J.-H.; Kim, B.-C.; Park, J.Y.; Ha, S.J. Evaluation of Surface Characteristics with Pre-treatment Polishing Process in Pulsed Laser Polishing AISI 4140 Mold Steel. Int. J. Precis. Eng. Manuf. 2021, 22, 1911–1921. [Google Scholar] [CrossRef]
  36. Zhou, H.; Zhou, H.; Zhao, Z.; Li, K.; Yin, J. Numerical Simulation and Verification of Laser-Polishing Free Surface of S136D Die Steel. Metals 2021, 11, 400. [Google Scholar] [CrossRef]
  37. Zhou, J.; Liao, C.; Shen, H.; Ding, X. Surface and property characterization of laser polished Ti6Al4V. Surf. Coat. Technol. 2019, 380, 125016. [Google Scholar] [CrossRef]
  38. Temmler, A.; Dai, W.; Schmickler, T.; Küpper, M.E.; Häfner, C.L. Experimental investigation on surface structuring by laser remelting (WaveShape) on Inconel 718 using varying laser beam diameters and scan speeds. Appl. Surf. Sci. 2021, 541, 147814. [Google Scholar] [CrossRef]
  39. Chen, L.; Richter, B.; Zhang, X.; Bertsch, K.B.; Thoma, D.J.; Pfefferkorn, F.E. Effect of laser polishing on the microstructure and mechanical properties of stainless steel 316L fabricated by laser powder bed fusion. Mater. Sci. Eng. A 2021, 802, 140579. [Google Scholar] [CrossRef]
  40. Liu, W.; Al-Hammadi, G.; Saleheen, K.M.; Abdelrahman, A.; Liu, H.; Zhang, Z. Impact of Pulsed Laser Parameters and Scanning Pattern on the Properties of Thin-Walled Parts Manufactured Using Laser Metal Deposition. Nanomanuf. Metrol. 2022, 5, 381–393. [Google Scholar] [CrossRef]
Figure 1. The experimental setup and schematic diagrams. (a) Experimental setup of laser polishing. (b) Preparation of the ball-end milling surface. (c) Laser polishing. (d) Application of laser polishing.
Metals 14 00058 g001
Figure 2. Ball-end milling surface of 440C stainless steel: (a) micrograph; and (b) 3D morphology.
Metals 14 00058 g002
Figure 3. Surface morphologies after laser polishing of E-1–E-16.
Metals 14 00058 g003
Figure 4. Trend showing the influence of direct parameters on roughness: (a) laser power; (b) repetition frequency; (c) scanning speed; and (d) focal offset distance.
Metals 14 00058 g004
Figure 5. Distribution of roughness under different average energy densities.
Metals 14 00058 g005
Figure 6. Three-dimensional morphologies of E-6 at different numbers of scans.
Metals 14 00058 g006
Figure 7. Three-dimensional morphologies of E-10 at different numbers of scans.
Metals 14 00058 g007
Figure 8. Variation in surface profile parameters under different scans: (a) Spc; (b) Vmp; (c) Sxp; and (d) Spk.
Metals 14 00058 g008
Figure 9. Surface profile of ball-end milling and different numbers of scans: (a) diagram; (b) E-6; and (c) E-10.
Metals 14 00058 g009
Figure 10. Three-dimensional morphologies of the conical hole before and after nanosecond laser polishing: (a) ball-end milling surface; (b) E-6; (c) E-10; and (d) surface profile of conical hole.
Metals 14 00058 g010
Figure 11. Metallographic structure of the sample subsurface after polishing: (a) metallographic structure of the subsurface; (b) enlarged image of Figure (a); (c) enlarged image of Figure (b).
Metals 14 00058 g011
Figure 12. SEM image of MZ at different scanning times: (a) E-6-1; (b) E-6-2; (c) E-6-3; (d) E-6-4; and (e) E-6-5. (f) The average thickness of different MZs.
Metals 14 00058 g012
Figure 13. SEM image of MZ at different number of scans: (a) E-10-1; (b) E-10-2; (c) E-10-3; (d) E-10-4; and (e) E-10-5. (f) The average thickness of different MZs.
Metals 14 00058 g013
Figure 14. EDS area mapping on the cross-section of the polished specimen: (a) E-6-2; and (b) E-10-5.
Metals 14 00058 g014
Figure 15. Element content in the polished layer under different numbers of scans: (a) E-6; and (b) E-7.
Metals 14 00058 g015
Figure 16. Microhardness of the surface at different numbers of scans.
Metals 14 00058 g016
Figure 17. Comparison of residual stress before and after laser polishing.
Metals 14 00058 g017
Table 1. The mass fraction of elements at 440Cwt%.
ElementCSiMnPSCrFe
Content (%)0.95–1.2≤1.0≤1.0≤0.035≤0.0316.0–18.0Balance
Table 2. Parameters of nanosecond fiber laser.
Laser
Parameters
Max.
Power
WavelengthPulse
Width
Max.
Repetition
Rate
Laser Beam
Diameter
Value 20 W 1064 nm 100 ns 200 kHz 30 µm
Table 3. Parameters of ball-end milling.
ParametersSpindle SpeedFeed Rate per ToothFeed RateAxial Cutting DepthHorizontal Step
Value20,000 r/min1 µm/z40 mm/min0.05 mm0.2 mm
Table 4. Parameters of laser polishing experiments.
Specimen CodeP
(W)
f
(kHz)
V
(mm/s)
FOD
(mm)
ED
(J/cm2)
E-16125805000
E-26150140.3322284
E-36175200.6641000
E-46200261.15384
E-59125140.6642142
E-6915081.151875
E-791752602307.6
E-89200200.3322400
E-912125201.151000
E-1012150260.6641538
E-111217580.3328000
E-12122001405714
E-1315125260.3323076
E-14151502005000
E-1515175140.6643572
E-161520081.153125
Table 5. Parameters of ball-end milling.
PfVFOD
Probability value0.0470.8770.9760.534
Disclaimer/Publisher’s Note: The statements, opinions and data contained in all publications are solely those of the individual author(s) and contributor(s) and not of MDPI and/or the editor(s). MDPI and/or the editor(s) disclaim responsibility for any injury to people or property resulting from any ideas, methods, instructions or products referred to in the content.

