Abstract
This paper explores the impact of various milling strategies, including up-milling, down-milling, and hybrid approaches, on the surface roughness of AISI P20 mold steel. The study is methodically divided into three stages to comprehensively understand the effects of these strategies. The first stage involves milling single slots with varying cutting parameters to establish baseline effects. The second stage examines the effects of consistent milling strategies (up-up and down-down) on surface quality. The third stage probes into hybrid strategies (up-down and down-up) to assess their effectiveness. Central to this investigation is not only the type of milling strategy but also how cutting speed and feed rate influence the resultant surface roughness. Our findings indicate that up-milling generally leads to a 22% increase in surface roughness compared to down-milling. This trend is visually verified by surface texture analyses. When comparing consistent strategies, up-up milling tends to produce rougher surfaces than down-down milling by approximately 25%, characterized by distinctive scratches and feed mark overlays. Remarkably, while the hybrid milling strategies do not exhibit significant differences in surface roughness, variations in cutting speed and feed rate play a crucial role. Specifically, at lower speeds, hybrid milling achieves smoother surfaces than the identical double milling mode, while at a cutting speed of 100 m/min, the double mode demonstrates a notable decrease in roughness. Additionally, this study introduces a color mapping simulation for machined pockets, validated by experimental results, to predict surface roughness based on the strategic history of milling, thereby offering valuable insights for optimizing milling processes.
1. Introduction
The superior mechanical properties, such as high toughness and high hardness, of AISI P20 mold steel make it well-suited for various industrial applications where exceptional mechanical characteristics are required [1]. Lopez et. al. have looked at a new way of preparing CNC programs for high-speed milling. The aim of devising this method is to make machining more reliable, specifically to reduce the probability of tool collisions and damage to spindles [2]. Given its improved mechanical traits, AISI P20 is a prime candidate for machining large dies and molds employed in plastic injection mold cavities, tooling applications, and even for producing dies for zinc die casting operations [3].
The milling process, particularly end milling, is an exceedingly versatile machining method that enables both end and peripheral cutting [4]. It is capable of producing slots, shoulders, die cavities, curves, profiles, and pockets [5]. Surface quality is of paramount importance in end milling, as it significantly influences the functional behavior of the milled components [6]. Due to the inherent qualities of hardened steel materials, cutting edges in milling, especially at high speeds, are subjected to substantial impact forces and elevated cutting temperatures. These factors can lead to wear and damage to the cutting edge, resulting in decreased tool life and a deterioration of the final surface roughness [7]. Consequently, addressing cutting heat and force management [8], extending tool lifespan [9], and enhancing surface quality [10] and integrity by optimizing cutting parameters and milling strategies [11] are crucial scientific challenges in the realm of high-speed milling of hardened steel [12].
The generation of surface roughness in end milling is a complex process with two primary components. The first relates to the cutting tool’s path as it moves across the material, creating a pattern of ridges and valleys, often called “feed marks.” These are influenced by the depth of cut, feed per tooth, and cutting speed. Such cutting parameters directly impact the forces exerted on both the tool and material, inducing vibrations, tool deflection, tool runout, and sometimes a back-cutting effect, all contributing to the surface finish. The second component concerns the material’s plastic deformation under the milling stresses. Characteristics such as the material’s ductility, the cutting tool’s geometry and wear level, and the interaction between the tool and material lead to deformations that further influence roughness. The interplay of these two components determines the final surface roughness of a milled part, and controlling them is critical for achieving the desired surface quality in manufacturing processes [13].
In end-milling operations the engagement between the cutter flutes and the workpiece material undergo continuous variation as dictated by the rotational angle of the cutter and the applied feed rate [14]. This phenomenon gives rise to two opposing cutting mechanisms in the machined slot. Specifically, at the initiation of the cutting process, the cutter flute begins at a rotational angle of 0°, as illustrated in Figure 1a. In this scenario, the chip load (thickness) starts at zero, and with the rotation of the flute, the chip thickness gradually increases, as shown in Figure 1b. This progression continues until the chip thickness reaches its maximum as the cutter flute reaches the center at a rotational angle of 90°, as depicted in Figure 1c. These instances, where the chip thickness rises with the rotational angle, are indicative of an up-milling mechanism. Figure 1d mirrors Figure 1b to highlight the transition from an up-milling to a down-milling process. In particular, Figure 1d illustrates the maximum chip load, and with further rotation of the cutter flute to, for example, 135°, as shown in Figure 1d, the chip thickness diminishes. This reduction in chip thickness persists until it nears zero at a rotational angle of 180°, as depicted in Figure 1e. The sequence depicted in Figure 1c–e, where the chip thickness decreases with the rotational angle, corresponds to a down-milling mechanism. It is evident that within a complete end milling process, each full rotation of the cutter entails up-milling in the first half and down-milling in the second half.
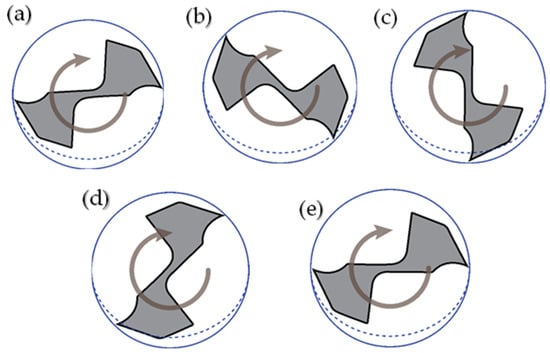
Figure 1.
(a) Cutter at 0° rotation angle; (b) cutter at 45° rotation angle; (c) cutter at 90° rotation angle; (d) cutter at 135° rotation angle; (e) cutter at 180° rotation angle.
Several experimental studies have been conducted to investigate the varied responses of various workpiece materials using distinct machining methods, namely up-milling and down-milling.
Katja Klauer et al. [15] conducted an experimental study to ascertain the effects of surface generation methods (up- or down-milling) and tool path selection on the surface quality of the produced structures. The authors designed a comprehensive factorial experimental design incorporating two distinct areal material measurement geometries, i.e., areal crossed sinusoidal material measure (ACS) and areal flat surface material measure (AFL). Furthermore, two different tools employing two distinct surface generation strategies (up- or down-milling) were employed. Additionally, two alternative instances were tested for each surface generation strategy: case 1 involved reverse movement with an engaged tool, while case 2 involved reverse movement without tool engagement. The results indicated that the milling strategy used did not have an impact on the process outcome in terms of surface roughness parameters. The authors recommended employing a meander-shaped tool path for future production of areal material measures, as this tool path reduced machining time by half.
M. A. Hadi et al. [16] compared up-milling and down-milling operations using physical vapor deposition (PVD)-coated carbide inserts. This experimental study focused on the tool wear mechanism and tool life in ball nose end milling of Inconel 718 under a minimum quantity lubricant (MQL) condition. The results revealed that down-milling outperformed up-milling in terms of tool wear. Notch wear, resulting in chipping on the cutting tool edge, was identified as a major cause of wear during prolonged machining.
Adnen Laamouri et al. [17] examined the impact of two peripheral milling modes (up-milling and down-milling) on the surface integrity and fatigue strength of X160CrMoV12 high-alloy steel. Utilizing a CNC milling machine and V-notched fatigue specimens, the authors investigated the effect of up-milling and down-milling on the surface integrity and fatigue behavior of X160CrMoV12 steel. The study involved measuring cutting forces using a Kistler device equipped with three dynamometers. The results indicated that down-milling resulted in poorer surface integrity and significant damage defects. Furthermore, the fatigue limit of the down-milled surface was approximately 21% lower than that of the up-milled surface. The study emphasized that up-milling led to better control of surface-damaging defects and increased the fatigue strength of X160CrMoV12 compared to down-milling.
Jonas Holmberg et al. [18] explored the influence of up-milling, center-milling, and down-milling strategies on residual stresses and deformations. Ceramic milling in Alloy 718 was used for rough milling, followed by cemented carbide semi- and final milling. The study employed X-ray diffraction, hardness testing, light optical microscopy, and electron backscattering diffraction (EBSD) to assess residual stress, hardness, and deformation, respectively. The results indicated significant deformation following milling, with different degrees based on the milling approach used. Consequently, up-milling was favored for new inserts, while down-milling became more appropriate as the inserts wore out due to reduced deformation and residual stress effects. Notably, ceramic milling induced considerable surface deformation, leading to grain refinement to a nano-crystalline level.
In the literature, various research studies have investigated the distinctions between up-milling and down-milling concerning generated surface roughness [15], cutting forces and stability [16], tool wear [17], and generated temperature [18]. However, these studies primarily focused on investigating up-milling versus down-milling as separate operations using partial end-milling processes. Different path-planning strategies are employed in the context of pocket machining, where the pocket width typically exceeds the nominal tool diameter. These strategies involve overlapping areas between different tool paths, entailing histories of similar or differing up-milling and down-milling strategies (see Figure 2). The overlapping areas may involve sequences of up-milling followed by up-milling or down-milling, and vice versa. To the best of the author’s knowledge, no research study has examined the effects of hybrid up-and-down milling in overlapping areas of cutting paths. This paper aims to bridge this gap by examining and optimizing the impact of hybrid milling strategies involving up-milling and down-milling for improved surface quality in machined pockets.
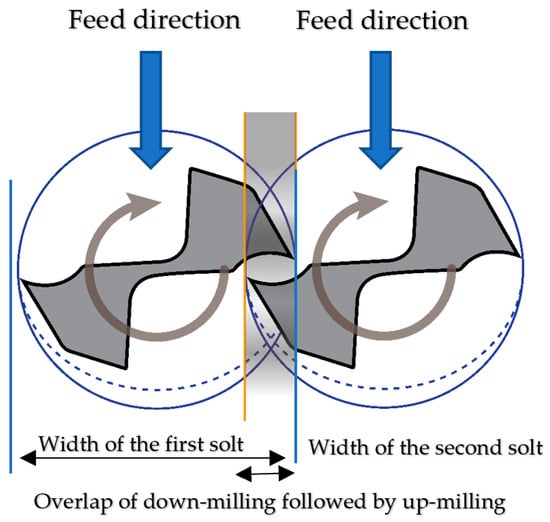
Figure 2.
Overlapping zones in pocket machining entailing hybrid up- and down-milling.
The subsequent sections of this paper are organized as follows, building upon this introduction: The experimental methodology is comprehensively detailed in Section 2, elucidating the approach adopted for the study. In Section 3, the outcomes are presented, accompanied by an in-depth discussion of the findings. Ultimately, Section 4 encapsulates the study’s essence, drawing conclusions from the obtained results and offering insights into potential avenues for future research.
2. Materials and Methods
The material selected for this study is P20 mold steel, characterized by a rectangular surface area measuring 100 mm × 40 mm and a height of 25 mm. Mold steels, renowned for their commendable mechanical attributes, render them invaluable for an array of applications spanning both civilian and military domains. Specifically, the P20 mold steel utilized in this investigation is comprehensively delineated regarding its chemical composition and mechanical properties, as presented in Table 1 and Table 2, respectively.

Table 1.
Chemical compositions of P20 mold steel, data from [19].

Table 2.
Mechanical properties of P20 mold steel, data from [19].
The experimental setup involved the utilization of a CNC vertical milling machine, specifically the “Concept Mill 450,” manufactured by Emco in Salzburg, Austria. This machine boasts a spindle power of 13 kW and offers a spindle speed range spanning from 50 to 10,000 rpm. The experiments were conducted employing tungsten carbide end-mills with a diameter of 12 mm and featuring four flutes. These end mills, designated 1P240-1200-XA 1630, were sourced from Sandvik in Sweden. The design of this tool is geared towards achieving superior surface finishes while efficiently removing material at a rapid pace.
Figure 3 illustrates the test rig configuration employed for machining the workpieces, showcasing the key components and arrangements. To quantify the surface roughness grade, the Tesa-Rougossurf-90G instrument, produced by Tesa-Bugnon in Renens, Switzerland, was employed, as depicted in Figure 4. The arithmetic average of surface roughness (Ra) has been selected for evaluating surface texture because it is the industry standard for gauging the quality of a surface. For the characterization of surface roughness, a cutoff length of 0.8 mm, a cutoff number of 19, a measuring speed of 1 mm/second, and a plain measurement surface type were utilized. At least three measurements were taken for each set of cutting conditions, and the average values were then calculated.
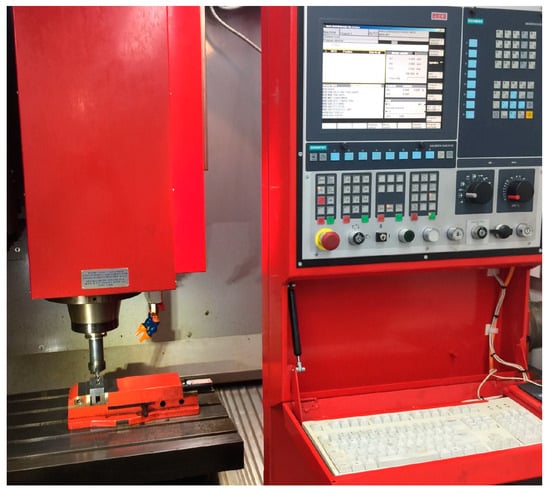
Figure 3.
Test rig for machining workpieces.

Figure 4.
Test rig for measuring surface roughness.
The milling process was divided into three distinct phases of experimental trials, as depicted in Figure 5. The initial phase involved machining single milling slots (Figure 5a), where various combinations of cutting parameters were explored. Subsequently, the second phase employed duplicate milling strategies, which included both up-milling paired with up-milling and down-milling paired with down-milling configurations (refer to Figure 5b). The third and final set of trials was specifically designed to assess the efficacy of hybrid milling strategies. This phase encompassed configurations of up-milling paired with down-milling and down-milling paired with up-milling (see Figure 5c). A comprehensive overview of all the variables pertinent to the milling tests is presented in Table 3.
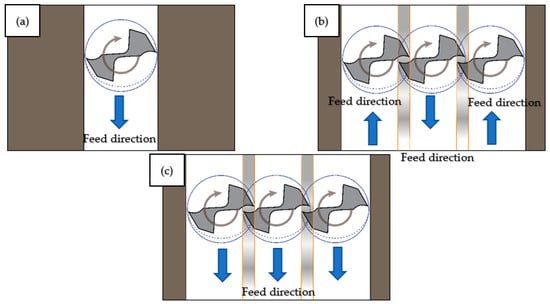
Figure 5.
Machining strategies entailing up- and down-milling for three phases: single strategy (a), duplicate strategy up-/up- and down-/down- (b), and hybrid strategy up-/down- and down-/up- (c).

Table 3.
Milling conditions for the tests.
3. Results and Discussion
3.1. Effect of Single-Mode Milling Strategies on Surface Roughness
Figure 6 illustrates the measured surface roughness outcomes from the single-mode experiments employing both up- and down-milling strategies. This graphical representation offers a comparison between the two milling strategies concerning the resulting surface roughness. Moreover, the impacts of feed rate and cutting speed on the measured surface roughness are displayed for both milling strategies. The results reveal that the up-milling strategy consistently yielded higher surface roughness values across all trial scenarios than those obtained through down-milling. This discrepancy in surface roughness outcomes between the two strategies was particularly pronounced at the lowest cutting speed (v = 50 m/min) and became relatively less pronounced as the cutting speed increased (v = 75 and 100 m/min). Specifically, an increase of approximately 22% in surface roughness was observed in the up-milling strategy compared to the down-milling strategy.
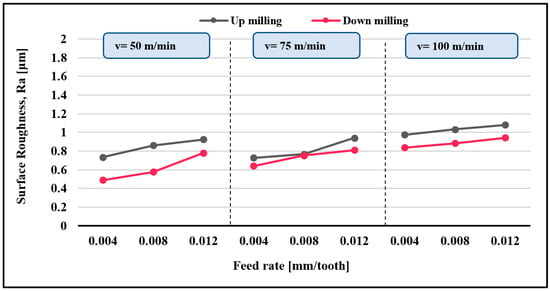
Figure 6.
Measured surface roughness for all trials of single-mode milling.
The distinctive characteristics of up-and-down milling contribute to these observed differences. In up-milling, the chip thickness begins at zero as the tool engages the workpiece, gradually progressing to maximum chip thickness at the end of the cutting [19]. This phenomenon encourages rubbing between the tool and the work material due to friction, leading to heightened plastic deformation and bulging. Consequently, this mechanical interaction results in a rougher surface. Conversely, the down-milling process commences with maximum chip thickness, progressively reducing as the machining pass concludes [20]. This gradual reduction in cutting-edge load fosters a smoother surface finish with a burnishing effect.
These findings are consistent with previous research [18]. The authors noted that the up-milling process generates a higher occurrence of microcracks than the down-milling process. This discrepancy is attributed to the excessive work-hardened layer induced in the workpiece during up-milling, significantly elevating surface roughness compared to down-milling. Additional studies [21,22] have expounded upon the increased surface roughness in up-milling, linking it to escalating cutting temperatures due to heightened friction. These elevated temperatures detrimentally influence surface integrity, compromising the smoothness of the machined surface [23].
Figure 7 visually compares up- and down-milling surface topographies at various cutting speeds. Upon analyzing the figures, distinctive surface defects were discerned in the up-milled surface texture, including adhered material, smearing, irregular feed marks, and evidence of plastic flow. Conversely, the down-milled surface texture exhibited more uniform feed marks with less apparent plastic deformation. This visual analysis aligns with the findings from the measured surface roughness, which corroborated a rougher surface in the case of up-milling.
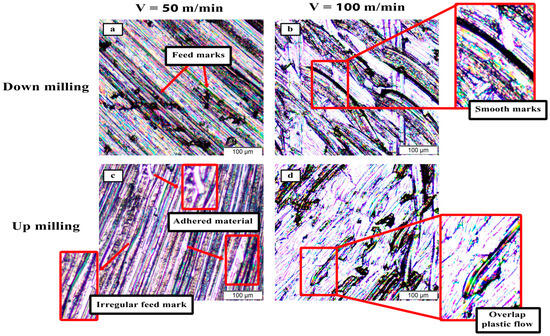
Figure 7.
Machined surface texture images for up- and down-milling under different cutting speeds at a feed rate of 0.004 mm/tooth. (a) Down milling at V = 50 m/min, (b) down milling at V = 100 m/min, (c) up milling at V = 50 m/min, and (d) up milling at V = 100 m/min.
Regarding the influence of process parameters on the measured surface roughness for both milling strategies, as depicted in Figure 7, it was evident that elevating the feed rate and cutting speed led to an increase in surface roughness. Specifically, when the feed rate was elevated from 0.004 mm/tooth to 0.012 mm/tooth, the surface roughness increased by approximately 22% for the up-milling case and 32% for the down-milling case. Similarly, increasing the cutting speed from 50 m/min to 100 m/min resulted in a rise in measured surface roughness of around 23% for up-milling and 48% for down-milling. This escalation in surface roughness with higher feed rates and cutting speeds can be attributed to heightened plastic deformation and increased tool vibration.
Moving to Figure 8, the surface topographies of milled specimens from up- and down-milling are shown at both the lowest and highest feed rates. The surface textures exhibited pronounced plastic furrows and deep feed marks at the higher feed rate for both milling strategies, indicating diminished surface quality. Furthermore, the impact of tool vibration stemming from increasing cutting speed is evident in Figure 9, which displays the surface textures of milled specimens from up- and down-milling at varying cutting speeds. Notably, at the lower cutting speed (50 m/min), relatively straight feed marks were observed. However, as the cutting speed was increased to 75 m/min, the feed marks became wavy, transitioning to interrupted feed marks at the highest cutting speed (100 m/min). These observations collectively underscore the intricate relationship between process parameters, tool behavior, and resulting surface quality.
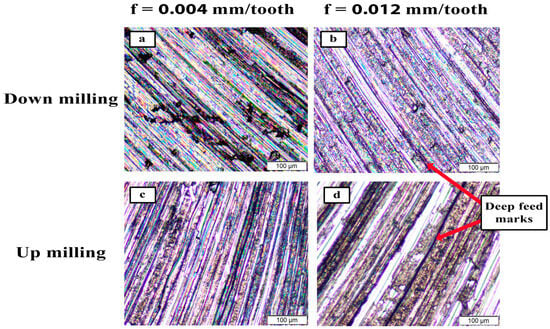
Figure 8.
Machined surface texture images for up- and down-milling under different feed rates at cutting speeds of 50 m/min. (a) Down milling at f = 0.004 mm/tooth, (b) down milling at f = 0.012 mm/tooth, (c) up milling at f = 0.004 mm/tooth, and (d) up milling at f = 0.012 mm/tooth.
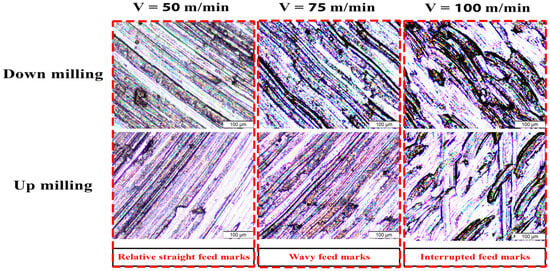
Figure 9.
Machined surface texture images for up- and down-milling under different cutting speeds at a feed rate of 0.008 mm/tooth.
3.2. Effect of Overlap of Tool Paths with Different Strategies on Surface Roughness
3.2.1. Effect of Identical Double-Mode Milling Strategies on Surface Roughness
Figure 10 presents the outcomes of measured surface roughness achieved through identical double-mode milling, specifically up-up milling and down-down milling, for various combinations of cutting speed and feed rate. The results indicate that the up-up milling strategy yielded rougher surfaces than the down-down milling strategy across all experimental trials, resulting in an approximately 25% increase in surface roughness.
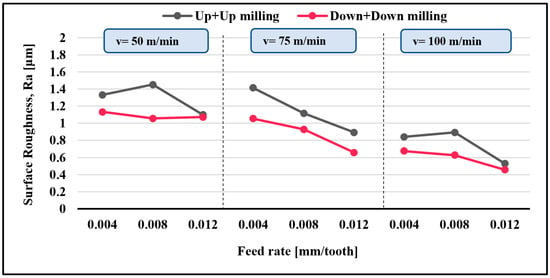
Figure 10.
Measured surface roughness for all trials of identical double mode.
In Figure 11, surface topographies for both the up-up and down-down milling strategies are displayed under varying feed rate conditions. The surface texture stemming from the up-up milling process exhibited more prominent scratches accompanied by overlapping feed marks in comparison to the down-down milled surface texture. In the context of overlapped cutting paths, the initial cutting path imprints feed marks on the machined surface, followed by the overlapping feed marks of the second cutting path. This phenomenon is clearly evident in the up-up-milled surface depicted in Figure 11. This overlapping effect led to deeper feed marks and larger plastic furrows, consequently contributing to a rougher surface texture. Conversely, the down-down milled surface texture demonstrated a reduced impact of overlapped feed marks, resulting in a comparatively smoother appearance.
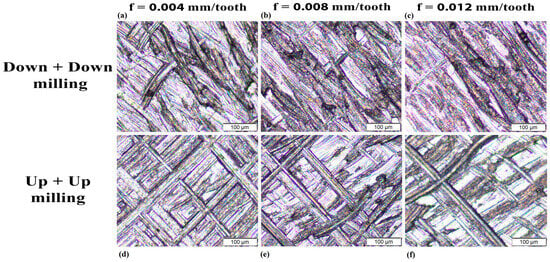
Figure 11.
Machined surface texture images for up + up and down + down milling under different feed rates at cutting speeds of 75 m/min. (a) down + down milling at f = 0.004 mm/tooth, (b) down + down milling at f = 0.008 mm/tooth, (c) down + down milling at f = 0.012 mm/tooth, (d) up + up milling at f = 0.004 mm/tooth, (e) up + up milling at f = 0.008 mm/tooth, (f) up + up milling at f = 0.012 mm/tooth.
These findings underscore the distinct surface quality outcomes associated with the employed double-mode milling strategies, revealing the significance of tool paths and their interplay in shaping the resulting surface topography and roughness.
In light of the influence of process parameters on the measured surface roughness, as depicted in Figure 10, the findings indicate a reduction in surface roughness with the escalation of both feed rate and cutting speed for both up-up and down-down milling strategies. Specifically, as the feed rate increased from 0.004 mm/tooth to 0.012 mm/tooth, there was a notable decrease in surface roughness by approximately 30% for up-up milling and 26% for down-down milling. Similarly, elevating the cutting speed from 50 m/min to 100 m/min reduced surface roughness by around 42% for up-up milling and 46% for down-down milling.
The disparity in achievable surface roughness at lower feed rates during the operation of the second path can be attributed to a higher degree of overlapping feed marks with smaller feed rates. This effect induces narrower tracks that inadvertently scratch the workpiece, as Figure 11a,d illustrates. Conversely, this impact becomes less pronounced when larger chip loads are employed, as shown in Figure 11c,f.
Turning attention to the effect of cutting speed, it becomes evident that increasing the cutting speed in the overlap tool path mode imparts a polishing effect due to minimal material removal. Consequently, this leads to a smoother, machined surface. Figure 12 visually demonstrates the surface textures of up-up and down-down milled surfaces at different cutting speeds. It is apparent that at high cutting speeds, both strategies result in smoother marks with a reduced influence of overlapped feed marks, in contrast to low cutting speeds that yield deeper feed marks.
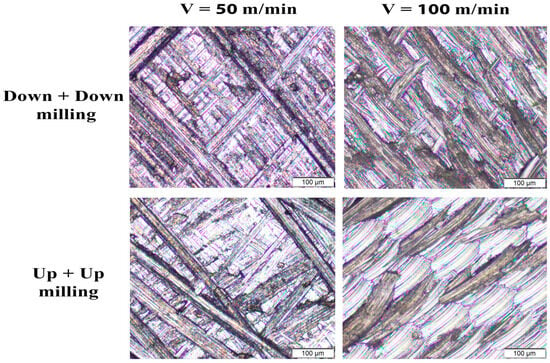
Figure 12.
Machined surface texture images for up + up and down + down milling under different cutting speeds at a feed rate of 0.012 mm/tooth.
3.2.2. Effect of Hybrid-Mode Milling Strategies on Surface Roughness
Figure 13 illustrates the results of measured surface roughness obtained through the hybrid mode, specifically up-down milling and down-up milling, for different cutting speeds and feed rates. In particular, at a cutting speed of 50 m/min, there is minimal discrepancy between the two strategies in terms of surface roughness results. However, as cutting speeds increase to 75 m/min and 100 m/min, the down-up milling strategy tends to yield higher surface roughness values compared to the up-down milling strategy, except for the trial involving a combination of higher cutting speed (100 m/min) and feed rate (0.12 mm/tooth), which resulted in the opposite outcome.
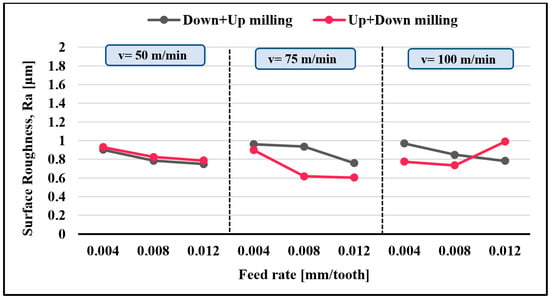
Figure 13.
Measured surface roughness for all trials in hybrid mode.
Figure 14 showcases the surface topographies of milled surfaces obtained through the down-up and up-down strategies. Deeper feed marks are evident in the surface texture of the down-up-milled specimens compared to the up-down milling cases. As seen in Figure 11, Figure 12 and Figure 14, the surface topography results of the overlapped tool path sections indicate that the up-milling process during the overlapped cutting path introduces more scratches with deeper feed marks, consequently influencing surface roughness.
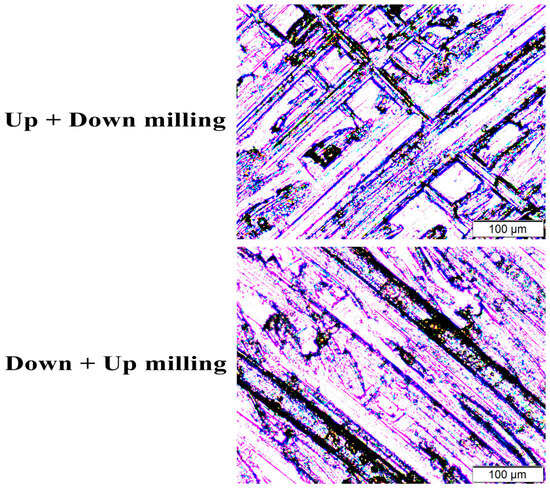
Figure 14.
Machined surface texture images for up + down and down + up milling at cutting speed 75 m/min and feed rate 0.004 mm/tooth.
Considering the effect of process parameters on surface roughness, a general trend of an inverse relationship between feed rate and surface roughness is observed in the case of the hybrid mode. Notably, a reduction in surface roughness of approximately 19% is achieved in the down-up case, while an average reduction of 29% is achieved in the up-down case when the feed rate is increased from 0.004 mm/tooth to 0.012 mm/tooth.
Regarding the impact of cutting speed, a slight effect on surface roughness is evident. Specifically, an increase in surface roughness of about 13% on average is observed in the down-up case when the cutting speed is elevated from 50 m/min to 100 m/min. In contrast, the up-down milling strategy exhibits negligible sensitivity of measured surface roughness to variations in cutting speed.
Figure 15 presents a comparison between all the overlapped milling strategies for all the conducted trials. The outcomes demonstrate a significant impact on surface roughness due to changes in cutting strategies. In the case of the identical double mode, higher surface roughness is evident when compared with the hybrid mode at lower cutting speeds (50 m/min and 75 m/min). However, a substantial reduction in surface roughness with the identical double mode is observed at the highest cutting speed (100 m/min).
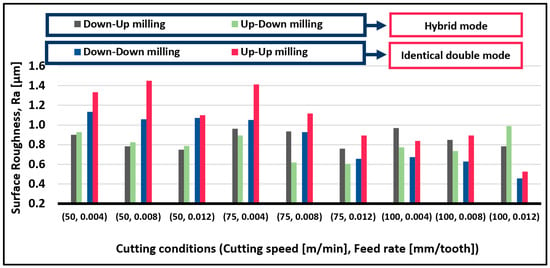
Figure 15.
Measured surface roughness for all trials of the overlap cutting path.
To assess the impact of the milling strategy (up- or down-milling) for the second tool path on surface roughness, a comparison is made between the results of the overlapped cutting mode (Figure 15) and the single mode (Figure 6).
For slots milled with an initial up-milling strategy, employing up-milling for the second path (up-up milling) led to an increase in surface roughness by an average of 25%, whereas using down-milling (up-down milling) resulted in a decrease in roughness by an average of 9%. In the case of slots initially milled with down-milling, utilizing up-milling for the second path (down-up milling) led to an increase in surface roughness by an average of 19%, while using down-milling (down-down milling) resulted in a slight increase in roughness by an average of 2%.
Figure 16 displays surface texture images of specimens that were initially up-milled and down-milled, where both single mode and overlap cutting modes were applied. It is evident that employing up-milling for the second cutting path caused more pronounced scratches on the machined surface with deeper feed marks compared to down-milling, which subsequently influenced the surface quality.
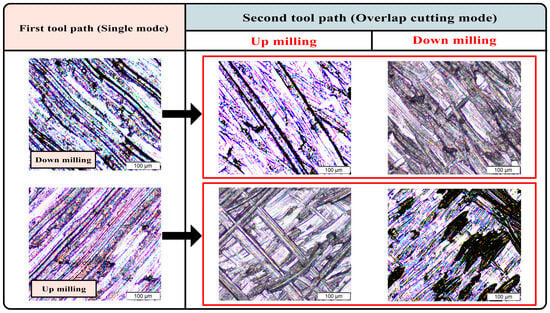
Figure 16.
Surface texture images for up- and down-milled specimens where single mode and overlap cutting mode are applied at cutting speed 75 m/min and feed rate 0.004 mm/tooth.
3.3. Validation Using Pocket Machining with Different Types of Toolpaths
A color-mapping-based simulation of the toolpath considers the effect of up-milling, down-milling, and hybrid milling on the generated surface. In addition, to validate the results of the achievable surface roughness using the developed simulation tool for different milling strategies (up, down, up-up, down-down, up-down, and down-up), two pockets were milled with distinct toolpath strategies. These validations were conducted at a 100 m/min cutting speed and a feed rate of 0.012 mm/tooth.
Figure 17 and Figure 18 illustrate the two pockets with different toolpath strategies corresponding to the measured surface roughness readings of the entire machined surfaces. Specifically, the readings of Ra (average roughness) were obtained from ten evenly distributed locations on each pocket. The first pocket was milled using a zig-zag toolpath strategy (Figure 17), while the second pocket employed a contour parallel toolpath strategy (Figure 18).

Figure 17.
Zig-zag toolpath strategy corresponding to surface roughness measurements.

Figure 18.
Contour parallel toolpath strategy corresponding to surface roughness measurements.
Upon examining Figure 17, it becomes evident that the identical double mode, down-down milling strategy, and up-up milling strategy were dominant, covering 32% and 31% of the central region, respectively. Conversely, the hybrid modes (up-down and down-up) and the single modes (up and down) occupied a smaller percentage and were located in the surrounding areas. The surface roughness plot of the first pocket (Figure 17) illustrates that the measured surface roughness across the entire pocket was within lower ranges.
Regarding the second pocket (Figure 18), it was observed that the down-down milling strategy dominated a small central area, while the up-down milling strategy encompassed around 50% of the central region. Regarding surface roughness distribution, the down-down milling region displayed lower surface roughness measurements in the central area, whereas higher surface roughness measurements were recorded in the up-down milling region.
These findings from the two pockets validate the results obtained in the previous section (Section 3.1), which indicated that the identical double mode yielded better surface roughness compared to other modes when milled at higher cutting speeds (100 m/min) and feed rates (0.012 mm/tooth). The surface roughness distribution plots of the milled pockets (Figure 17 and Figure 18) exhibited good agreement with the surface roughness results obtained from different milling strategies (up, down, up-up, down-down, up-down, and down-up) in Section 3.1.
To further validate the results of the measured surface roughness of the pockets, the achievable surface roughness values were compared with the expected surface roughness values calculated through simulation, considering the percentages of only the milling strategies based on the previous results in Section 3.1. For the first pocket (zig-zag), the average surface roughness increased by 7% compared to the expected value calculated by simulation. For the second pocket (contour parallel), a negligible difference of less than 1% was observed. These results highlight the significant impact of the machining history on surface quality, which could explain the influence of surface quality by changing milling toolpath strategies that have been approved in other studies [24,25] and suggest the potential for improving surface roughness through simulation-guided consideration of hybrid up-and-down milling strategies.
4. Conclusions
This study has explored the impact of various milling strategies, including up-milling, down-milling, and hybrid approaches, on the surface quality of AISI P20 mold steel. We examined how these strategies influence surface roughness and texture across different cutting speeds and feed rates, also employing distinct toolpath strategies for validation.
- Our research reveals that up-milling tends to produce rougher surfaces compared to down-milling. We also found that the surface roughness generally increased with higher feed rates and cutting speeds for both up- and down-milling processes. Particularly, the double mode of the same milling direction (either up-up or down-down) showed a tendency towards rougher surfaces compared to their hybrid counterparts.
- Additionally, the study highlights that the texture of the surfaces varies significantly with the milling strategy employed. For instance, surfaces milled with consecutive up-milling showed more pronounced defects compared to those milled with consecutive down-milling.
- An interesting observation was that the differences in surface roughness between various strategies became more evident at higher cutting speeds. This indicates the influence of cutting dynamics on milling outcomes.
In conclusion, our findings highlight the importance of selecting appropriate milling strategies and adjusting process parameters to optimize surface quality. The choice of milling strategy has a significant impact on the surface characteristics of the milled parts, and careful consideration of these factors is crucial in achieving the desired surface finish in milling operations.
Author Contributions
Conceptualization, A.E. and A.T.A.; methodology, A.T.A. and A.E.; software A.E. and E.A.; validation, E.A. and N.N.; formal analysis, E.A., E.A.A.-B., N.N. and A.E.; investigation, E.A., N.N., K.F.A. and A.E.; resources, A.T.A., E.A.A.-B. and K.F.A.; data curation, E.A., K.F.A. and N.N.; writing—original draft preparation, E.A., N.N., K.F.A. and E.A.A.-B.; writing—review and editing, A.T.A., E.A., N.N. and A.E.; visualization, E.A., N.N. and A.E.; supervision, A.T.A. and A.E.; project administration, A.T.A., K.F.A. and E.A.A.-B.; funding acquisition, A.T.A. All authors have read and agreed to the published version of the manuscript.
Funding
Researchers Supporting Project number (RSPD2023R1064), King Saud University, Riyadh, Saudi Arabia.
Data Availability Statement
The data presented in this study are available on request from the corresponding author.
Acknowledgments
The authors extend their appreciation to King Saud University for funding this work through Researchers Supporting Project number (RSPD2023R1064), King Saud University, Riyadh, Saudi Arabia.
Conflicts of Interest
The authors declare that there are no known conflicts of interest.
References
- Yin, A.T.M.; Rahim, S.Z.A.; Al Bakri Abdullah, M.M.; Nabialek, M.; Abdellah, A.E.H.; Rennie, A.; Tahir, M.F.M.; Titu, A.M. Potential of New Sustainable Green Geopolymer Metal Composite (GGMC) Material as Mould Insert for Rapid Tooling (RT) in Injection Moulding Process. Materials 2023, 16, 1724. [Google Scholar] [CrossRef]
- De Lacalle, L.N.; Lamikiz, A.; Salgado, M.A.; Herranz, S.; Rivero, A. Process planning for reliable high-speed machining of moulds. Int. J. Prod. Res. 2010, 40, 2789–2809. [Google Scholar] [CrossRef]
- Guo, D.; Yu, D.; Zhang, P.; Song, W.; Zhang, B.; Peng, K. Laminar Plasma Jet Surface Hardening of P20 Mold Steel: Analysis on the Wear and Corrosion Behaviors. Surf. Coat. Technol. 2021, 415, 127129. [Google Scholar] [CrossRef]
- Lyu, W.; Liu, Z.; Song, Q.; Ren, X.; Wang, B.; Cai, Y. Modelling and prediction of surface topography on machined slot side wall with single-pass end milling. Int. J. Adv. Manuf. Technol. 2023, 124, 1095–1113. [Google Scholar] [CrossRef]
- Razali, S.Z.; Wong, S.V.; Ismail, N. Fuzzy logic modeling for peripheral end milling process. IOP Conf. Ser. Mater. Sci. Eng. 2011, 17, 012050. [Google Scholar] [CrossRef]
- Reddy, B.S.; Kumar, J.S.; Reddy, K.V.K. Optimization of surface roughness in CNC end milling using response surface methodology and genetic algorithm. Int. J. Eng. Sci. Technol. 2011, 3, 102–109. [Google Scholar] [CrossRef][Green Version]
- Lopes, J.G.; Machado, C.M.; Duarte, V.R.; Rodrigues, T.A.; Santos, T.G.; Oliveira, J.P. Effect of milling parameters on HSLA steel parts produced by Wire and Arc Additive Manufacturing (WAAM). J. Manuf. Process. 2020, 59, 739–749. [Google Scholar] [CrossRef]
- Zhang, L.; Zhang, X. A comparative experimental study of unidirectional CFRP high-speed milling in up and down milling with varied angles. J. Manuf. Process. 2023, 101, 1147–1157. [Google Scholar] [CrossRef]
- Guo, L.; Liao, X.; Yang, W.; Sun, J. An oscillating milling strategy based on the uniform wear theory for improving service life of the ball-end cutter. J. Mater. Process. Technol. 2023, 317, 117993. [Google Scholar] [CrossRef]
- Vakondios, D.; Kyratsis, P.; Yaldiz, S.; Antoniadis, A. Influence of milling strategy on the surface roughness in ball end milling of the aluminum alloy Al7075-T6. Measurement 2012, 45, 1480–1488. [Google Scholar] [CrossRef]
- Holmberg, J.; Wretland, A.; Berglund, J.; Beno, T. Selection of milling strategy based on surface integrity investigations of highly deformed Alloy 718 after ceramic and cemented carbide milling. J. Manuf. Process. 2020, 58, 193–207. [Google Scholar] [CrossRef]
- Korkmaz, M.E.; Gupta, M.K.; Ross, N.S.; Sivalingam, V. Implementation of green cooling/lubrication strategies in metal cutting industries: A state of the art towards sustainable future and challenges. Sustain. Mater. Technol. 2023, 36, e00641. [Google Scholar] [CrossRef]
- Tosello, G.; Bissacco, G.; Cao, J.; Axinte, D. Modeling and simulation of surface generation in manufacturing. CIRP Ann. 2023, 72, 753–779. [Google Scholar] [CrossRef]
- Yip-Hoi, D.; Huang, X. Cutter/workpiece engagement feature extraction from solid models for end milling. J. Manuf. Sci. Eng. 2006, 128, 249–260. [Google Scholar] [CrossRef]
- Klauer, K.; Eifler, M.; Kirsch, B.; Seewig, J.; Aurich, J.C. Micro milling of areal material measures–Study on surface generation for different up and down milling strategies. Procedia CIRP 2020, 87, 13–18. [Google Scholar] [CrossRef]
- Hadi, M.A.; Ghani, J.A.; Haron, C.C.; Kasim, M.S. Comparison between up-milling and down-milling operations on tool wear in milling Inconel 718. Procedia Eng. 2013, 68, 647–653. [Google Scholar] [CrossRef]
- Laamouri, A.; Ghanem, F.; Braham, C.; Sidhom, H. Influences of up-milling and down-milling on surface integrity and fatigue strength of X160CrMoV12 steel. Int. J. Adv. Manuf. Technol. 2019, 105, 1209–1228. [Google Scholar] [CrossRef]
- Holmberg, J.; Wretland, A.; Berglund, J.; Beno, T.; Milesic Karlsson, A. Surface Integrity Investigation to Determine Rough Milling Effects for Assessment of Machining Allowance for Subsequent Finish Milling of Alloy 718. J. Manuf. Mater. Process. 2021, 5, 48. [Google Scholar] [CrossRef]
- Abbas, A.T.; Sharma, N.; Alsuhaibani, Z.A.; Sharma, A.; Farooq, I.; Elkaseer, A. Multi-Objective Optimization of AISI P20 Mold Steel Machining in Dry Conditions Using Machine Learning—TOPSIS Approach. Machines 2023, 11, 748. [Google Scholar] [CrossRef]
- Lizzul, L.; Sorgato, M.; Bertolini, R.; Ghiotti, A.; Bruschi, S. Influence of additive manufacturing-induced anisotropy on tool wear in end milling of Ti6Al4V. Tribol. Int. 2020, 146, 106200. [Google Scholar] [CrossRef]
- Liang, S.; Shih, A.J. Analysis of Machining and Machine Tools; Springer: Boston, MA, USA, 2015. [Google Scholar]
- Tian, X.; Zhao, J.; Zhao, J.; Gong, Z.; Dong, Y. Effect of cutting speed on cutting forces and wear mechanisms in high-speed face milling of Inconel 718 with Sialon ceramic tools. Int. J. Adv. Manuf. Technol. 2013, 69, 2669–2678. [Google Scholar] [CrossRef]
- Kaltenbrunner, T.; Krückl, H.P.; Schnalzger, G.; Klünsner, T.; Teppernegg, T.; Czettl, C.; Ecker, W. Differences in evolution of temperature, plastic deformation and wear in milling tools when up-milling and down-milling Ti6Al4V. J. Manuf. Process. 2022, 77, 75–86. [Google Scholar] [CrossRef]
- Uzun, M.; Usca, Ü.A.; Kuntoğlu, M.; Gupta, M.K. Influence of tool path strategies on machining time, tool wear, and surface roughness during milling of AISI X210Cr12 steel. Int. J. Adv. Manuf. Technol. 2022, 119, 2709–2720. [Google Scholar] [CrossRef]
- Bagci, E.; Yüncüoğlu, E.U. The Effects of Milling Strategies on Forces, Material Removal Rate, Tool Deflection, and Surface Errors for the Rough Machining of Complex Surfaces. J. Mech. Eng./Strojniški Vestnik 2017, 63, 643–656. [Google Scholar]
Disclaimer/Publisher’s Note: The statements, opinions and data contained in all publications are solely those of the individual author(s) and contributor(s) and not of MDPI and/or the editor(s). MDPI and/or the editor(s) disclaim responsibility for any injury to people or property resulting from any ideas, methods, instructions or products referred to in the content. |
© 2023 by the authors. Licensee MDPI, Basel, Switzerland. This article is an open access article distributed under the terms and conditions of the Creative Commons Attribution (CC BY) license (https://creativecommons.org/licenses/by/4.0/).