Abstract
This paper studies the hydrogen-assisted microdamage (HAMD) in fully-pearlitic steel. A detailed analysis is provided of the HAMD region in axisymmetric round-notched samples of high-strength eutectoid pearlitic steel under hydrogen embrittlement environmental conditions. The microscopic appearance and evolution of the hydrogen affected region is analyzed from the initiation (sub-critical) to the fracture (critical) situations. The use of very distinct notched samples and their associated stress distributions in the vicinity of the notch tip allows for a study of the key role of the triaxial stress state on hydrogen diffusion and micro-cracking (or micro-damage). The microscopic appearance of the hydrogen-affected zone (the so-called tearing topography surface) resembles micro-damage, micro-cracking or micro-tearing at a micro- or nano-scale due to hydrogen degradation, thus affecting the notch tensile strength and producing hydrogen embrittlement. A micromechanical model is proposed to explain these hydrogen effects on the material on the basis of the lamellar micro- and nano-structure of the pearlitic steel.
1. Introduction
High-strength eutectoid pearlitic steels are used as (i) constituent materials of rails [1,2] (pearlitic rail steels) in mass after hot rolling; (ii) constituent materials of pre-stressed concrete structures, bridge cables and wire ropes in wire form as key elements in civil engineering [3,4,5] (cold-drawn pearlitic steel wires) after hot rolling and cold drawing; and (iii) reinforcement materials in vehicle tires [6,7] in the form of tiny wires after heavy cold drawing (cold-drawn pearlitic steel wires).
While pearlitic rail steels do not undergo any mechanical treatment (only heat treatment), in cold-drawn pearlitic steels the cold drawing manufacturing procedure activates a strain hardening mechanism, thereby increasing both the yield strength and the ultimate tensile strength (UTS). The evolution of microstructure in pearlitic steel and its associated changes in strength and ductility during cold drawing were studied in the past by Embury and Fisher [8], Langford [9] and Ridley [10], as well as by Lewandowski and Thompson [11]. These important papers constitute, even nowadays, the key background of micromechanical analyses of pearlitic steels (either cold-drawn or not) and they conform the scientific bases of modern fracture mechanics approaches.
It is also worth mentioning the analyses by Nam and Bae [12], Read et al. [13], Toribio and Ovejero [14,15,16,17], Languillaume et al. [18] or Nam et al. [19] on microstructure changes in pearlite after drawing [12,13,14,15,16,17] or drawing-induced cementite dissolution [18,19]. The utmost importance of cold drawing effects on micromechanical features and fracture behavior is out of doubt.
The summary of such an utmost importance of the effects of cold drawing in pearlite is twofold: on one side, it produces orientation of both microstructural levels (pearlite colonies and lamellae) in the undoubtedly hierarchical structure of pearlitic steels [14,15,16,17] and, on the other side, it can trigger local deterioration/degradation phenomena such as drawing-induced cementite dissolution [18,19].
A controversial topic [20,21,22,23] is the validity of the Hall-Petch equation to describe the better mechanical performance (increase in yield strength) with the decrease in the size of a characteristic microstructural unit: grain size, particle size, or, in the case of pearlitic steels, colony size or interlamellar spacing, the latter being usually considered as the key microstructural length representing the free distance for a dislocation to move before being blocked by the cementite barrier.
The phenomenon of blocking of free dislocation movement in the ferrite phase by the hardest cementite phase acting as a barrier provokes an increase in material strength. Although in randomly-oriented pearlite (e.g., in a rail steel or a hot rolled pearlitic steel bar) the Hall-Petch equation can be valid to fit the strength versus material characteristic size, in the case of oriented pearlite (e.g., in a heavily cold-drawn steel) the relation between microstructure (represented by a characteristic length such as the pearlite interlamellar spacing) and strength does not fit a Hall-Petch equation [22] but an Embury-Fisher law [23] in the case of drawn pearlite, to account for the evident microstructural orientation.
Many papers have dealt with the study of different hardening and strengthening mechanisms after cold-drawing of pearlitic microstructures [24,25,26,27,28,29,30,31]. With regard to fracture (post-yield) behavior of pearlitic steels, one can find classical papers by Porter et al. [32], Hyzak and Bernstein [33], Park and Bernstein [34], Alexander and Bernstein [35] and Dollar et al. [36], and more recent works [37,38,39,40,41,42] dealing with plasticity/yielding behavior, as well as fracture performance.
In the matter of environmentally assisted cracking [43], in addition to pure stress corrosion cracking (SCC) by localized anodic dissolution (LAD), the deleterious phenomenon usually known as hydrogen embrittlement (HE) is harmful in cold-drawn pearlitic steel in the form of prestressing steel wires and cables in service [44,45,46,47,48,49,50,51,52]. The analyses of such a phenomenon usually were performed in the past from the engineering point of view in the form of fracture mechanics approaches to avoid catastrophic accidents (an important practical aspect of HE and HAMD in high-strength pearlitic steel), so that there is a lack of purely-scientific material science approaches.
Such a phenomenon has received many names in the scientific literature such as hydrogen degradation (HD), hydrogen-assisted fracture (HAF) or hydrogen-assisted cracking (HAC) when a crack is present in the material. The first term (HD) is especially important because it includes any deleterious effect caused by hydrogen on a specific material, either typical (pure) embrittlement in the form of lack of ductility or decrease in fracture toughness, or more complicated phenomena involving a sort of interplay between locally ductile processes (localized plasticity or hydrogen-dislocation interactions) and global material degradation.
In this paper, the hydrogen-assisted microdamage (HAMD) in the form of the so-called tearing topography surface (TTS), a term coined by Thompson and Chesnutt [53] and Costa and Thompson [54] but just described as a new, non-conventional, fractographic mode but, in principle, not associated with a fracture phenomenon of specific nature (either brittle or ductile) or linked to a particular material (although all provided examples deal with metals and alloys).
At the macro-, micro- and nano-levels, the TTS fractographic mode has been associated [55,56,57,58,59] with HE/HD processes and HAMD in pearlitic steel, such a relationship thoroughly analyzed by Toribio (the author of the present paper) and co-workers. The present work goes further in the brief analysis on HE and HAMD in the presence of notches (hydrogen-assisted notch-induced fracture and notch tensile strength) published in a short paper included in conference proceedings [60].
2. Phenomenological Evidence of HE/HD of Eutectoid Pearlitic Steels at the Macro-, Micro- and Nano-Scales
This section of the paper presents a compendium of evidence of many phenomena of hydrogen embrittlement (HE) or hydrogen degradation (HD) of fully-pearlitic steel in the presence of geometrical defects (or stress concentrators) such as cracks or notches, in the form of a small review (collection) of phenomenological facts providing experimental evidence [55,56,57,58,59] of the association between the non-conventional fractographic mode that has received the name tearing topography surface (TTS), cf. [53,54] and the HE/HD of fully-pearlitic steels at the macro-, micro- and nano-scales.
The TTS is a new fracture topography undoubtedly associated with (or linked to) HE/HD (at the macro-scale) and HAMD (at the micro-scale) in pearlitic steel produced by the combined action of mechanical stress-strain fields and chemical/environmental effects (in particular, hydrogen effects in pearlite). There is clear experimental evidence of the association between the TTS region and the hydrogen damage in pearlite, at the macro-, micro- and nano scales, i.e., considering the three levels of hydrogen-assisted damage in the pearlitic material: macro-damage, micro-damage and nano-damage.
The experimental evidence of such an association is as follows [55,56,57,58,59]:
- The microscopic appearance of the TTS region (fractography) clearly resembles micro-damage (at the micro-scale) or nano-damage (at the nano-scale) consisting of a sort of micro-cracking or micro-tearing due to hydrogen micro- or nano-degradation in pearlite at the finest level of analysis by scanning electron microscopy (SEM).
- The micromechanical behavior of the TTS region (microfracture mode) is manifested by a low crack growth rate (CGR), i.e., it is a slow (or subcritical) crack growth fractography linked to the stage II (plateau) in the crack growth kinetics (CGK) curve da/dt-K in which the CGR is independent of the stress intensity factor (SIF K).
- The appearance of the TTS mode/fractography takes place only when the electrochemical environment surrounding the pearlitic steel is cathodic. In this case of cathodic potential, the predominant phenomenon in the steel is HE/HD in the presence of notches, or hydrogen-assisted cracking (HAC) in the presence of cracks.
- The size of the TTS zone (region/domain), or the depth of such a zone considered as a cracked area, increases as the electro-chemical potential becomes more cathodic, a consequence of the higher amount of hydrogen at the specimen surface available for hydrogen diffusion toward the inner points.
- The size of the TTS zone (region/domain), or the depth of such a zone considered as a cracked area, slightly increases as the acidity of the solution rises, i.e., as the pH lowers because the hydrogen concentration at the sample boundary (crack or notch tip) increases in the cases of smaller (more acid) pH values.
- The size of the TTS zone (region/domain), or the depth of such a zone considered as a cracked area, clearly decreases as the fatigue pre-cracking level (intensity) increases in a pre-cracked sample, as a consequence of the presence of compressive residual stresses near the crack tip induced during fatigue pre-loading.
- The size of the TTS zone (region/domain), or the depth of such a zone considered as a cracked area, significantly increases with the HE test duration (time to failure), i.e., it clearly decreases as the applied strain rate increases, on the basis of a mechanism of transport by stress-assisted hydrogen diffusion with time derivatives.
- The size of the TTS zone (region/domain), or the depth of such a zone considered as a cracked area, depends on the sample geometry through the hydrostatic stress distribution in the specimen. It is consistent with an association between the TTS mode and the HE/HD process on the basis of stress-assisted hydrogen diffusion.
- The asymptotic depth of the TTS region for quasi-static tests (slow enough to allow the stationary condition for the hydrogen diffusion problem to be achieved) reaches the point of maximum hydrostatic stress in the sample, which confirms that hydrogen diffuses towards the points of maximum hydrostatic stress.
3. Experimental Program
A high-strength eutectoid pearlitic steel was used, whose chemical composition is given in Table 1 and whose mechanical properties are as follows: elastic modulus E = 199 GPa, yield strength σY = 600 MPa, ultimate tensile strength (UTS) σY = 1151 MPa. It is a fully-pearlitic steel (100% pearlite) exhibiting a coarse pearlitic microstructure, with a pearlite interlamellar spacing of 0.3 μm, an average size of the cleavage facet of 75 μm, and an average pearlite colony size of about 15 μm.

Table 1.
Chemical composition (wt %) of the steel.
In this paper, four axisymmetric round-notched geometries were used with a circular notch shape and varying depths and radii, as sketched in Table 2 and Figure 1 so as to achieve very distinct stress triaxiality (constraint) levels in the close vicinity of the notch tip. The external diameter was D = 11.25 mm in all specimens after preparation by careful machining to avoid axial curvature and facilitate the alignment of the specimens. Testing under axial displacement was performed using a universal testing machine with fixed grips to guarantee sample alignment and to avoid undesired rotation (i.e., boundary conditions corresponding to imposed axial displacement at the sample ends).
Table 2.
Dimensions of the samples and triaxiality levels in all of them.
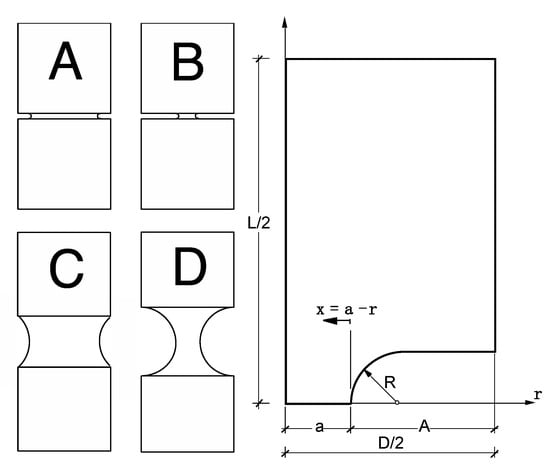
Figure 1.
Drawing of axisymmetric notched geometries used in the experiments.
To have a reference for comparison, a first set of fracture tests in air was performed on the four notched geometries described above. In addition, HE tests were carried out at room temperature using the same specimens. The samples were subjected to slow strain rate testing (SSRT) with externally-applied displacement rates ranging between 10−10 and 2.10−6 m/s. The test environment was an aqueous solution of 1 g/L Ca(OH)2 plus 0.1 g/L NaCl. The pH value was 12.5 and tests were performed at a constant electro-chemical potential of −1200 mV SCE (saturated calomel electrode) to achieve HE environmental conditions. The advantages of notched geometries in fracture tests in air and in hydrogen environments have been emphasized in the past [60,61,62] to analyze HE processes and notch tensile strength. The results of the HE tests are given in Table 3.
Table 3.
Results of the HE tests.
4. Fractographic Analysis at the Macro-, Micro- and Nano-Scales
In the tests performed in air [63], scanning electron microscope (SEM) fractographic analysis showed that the fracture process always initiates in a fibrous or dimpled region by a mechanism of micro-void coalescence (MVC) and later propagates in an unstable manner by a cleavage-like (C) micro-mechanism in geometries A, B and C, or in stable manner by MVC followed by shear lip (L) in the case of geometry D.
To have a complete picture of the fracture process at the micro-mechanical level of pearlitic steel in the presence of notches of very different geometries (with very distinct constraint/triaxiality levels), micro-fracture maps (MFMs) were assembled covering the whole fracture surface of all geometries and containing information on the micromechanisms of fracture at each portion of the cross-sectional area (Figure 2).
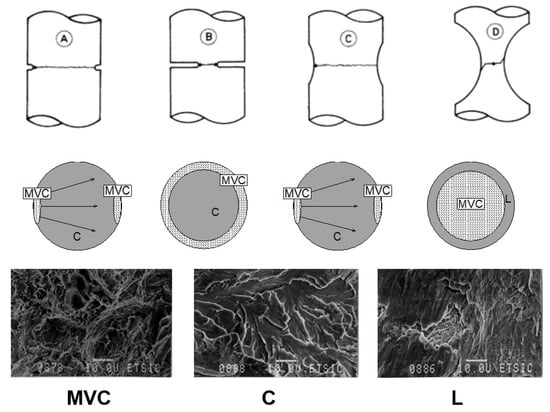
Figure 2.
Micro-fracture maps (MFMs) at the fracture in air for the different notched specimens A, B, C and D with very distinct triaxiality levels; MVC: micro-void coalescence; C: cleavage-like topography; L: shear-lip.
The macroscopic fracture mode is peripheral and plane in the first case (geometries A, B and C) and central with cup and cone shape in the second case (geometry D). The cleavage-like topography associated with unstable final fracture exhibits the typical river patterns indicating the direction and sense of fracture propagation and therefore can explain the different stages of fracture (see Figure 2).
In the case of the first set of geometries exhibiting the most brittle fracture mode (geometries A, B, and C containing the main area of cleavage/brittle fracture in the cross-sectional area, cf. Figure 2), the cleavage micro-fracture mode is oriented cleavage in the case of samples A and C (single fracture initiation point) and randomly-oriented cleavage sample B (multiple or extended fracture initiation locations).
A characteristic value of triaxiality seems to exist below which fracture is by MVC and above which it is cleavage-like. This is consistent with the existence of a critical size of micro-void that is a decreasing function of the triaxiality.
In the HE tests, HAMD started at the notch tip, and fractographic analysis by SEM showed a characteristic microscopic fracture mode (non-conventional) with a kind of ductile tearing appearance: the so-called tearing topography surface or TTS (Figure 3), cf. [53,54,55,56,57,58,59]. Such a TTS region may be analyzed at the macro-, micro- and nano-levels. To this end, Figure 3 also includes the fully-pearlitic microstructure of the steel, showing the importance of the nano-scale, considering the level of the pearlite interlamellar spacing (0.3 μm), i.e., a sub-micron scale for the softer (and more ductile) ferrite constrained between harder (and more brittle) cementite, thus allowing a consideration of the fully-pearlitic steel under study as a real nano-composite material.
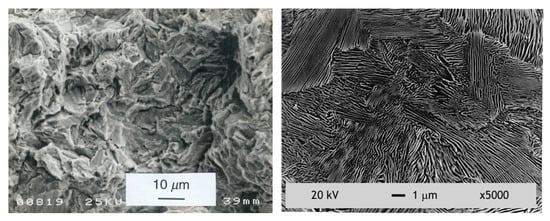
Figure 3.
Tearing topography surface (TTS) and fully-pearlitic microstructure of the steel.
At the macro-scale, the TTS zone or domain is a portion of area (region) in the MFM including all fractographic modes in the fracture surface. The MFMs corresponding to the HE tests are given in Figure 4, showing that the TTS region is always peripherical, but in some cases it has thumbnail shape (shallow geometries A and C, either shallow sharp A or shallow blunt C) and in other cases it has a ring shape (deep geometries B and D, either deep sharp B or deep blunt D).
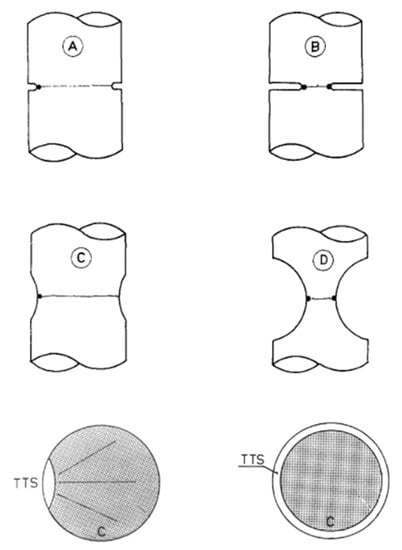
Figure 4.
Micro-fracture maps (MFMs) at the fracture in the HE tests for the different notched specimens A, B, C and D with very distinct triaxiality levels; TTS: tearing topography surface; C: cleavage-like topography.
A question should be raised here regarding the macro- and micro-levels of analysis. The concept of MFM corresponds to the macro-scale, since such a map covers the whole macro-fracture surface (circular cross-sectional area of the notched sample in this case). Therefore, it is a macroscopic map containing microscopic modes of fracture, i.e., a map of micro-fracture or micro-fracture map (MFM).
After this origin by TTS (environmentally-assisted sub-critical cracking), a fracture progresses in an unstable manner by a cleavage-like (C) topography. In shallow geometries A and C with local thumbnail TTS shape, cleavage develops in a divergent progression and lines form the initiation by TTS, whereas in deep geometries B and D with external circumferential shape by TTS, cleavage progresses towards the inner point of the sample in a random manner (following diverse directions).
A plausible explanation of the type of MFM in each case of Figure 4 would be the following: in sharply-notched geometries A and B, the intense stress concentration produced by the sharp notch creates a maximum of hydrostatic stress near the notch tip, thereby “pumping” hydrogen to locations in the near-tip zone and thus creating the worst area (the most damaged region) as a local TTS zone placed just at the specimen surface in the form of either a surface crack (sample A) or a surface external ring (sample B).
The same happens in shallow blunt notch C in which the maximum hydrostatic stress is also near the notch tip and thus a thumbnail TTS sub-critical crack is created at the notch tip. With regard to the deep blunt notch D, it exhibits a surface external ring by TTS. In this case, the maximum hydrostatic stress is achieved at the sample axis (place towards which hydrogen diffuses along radial directions), in such a manner that the axial (radial) symmetry is preserved in this case.
Thus, the two shallow geometries (A and C) promote a loss of axial symmetry in the HAMD area with external (surface) thumbnail TTS region whereas the two deep geometries (B and D) preserve the axial symmetry in the HAMD area with external (surface) ring-shaped TTS region.
At the micro-scale, the TTS zone contains features resembling micro-damage, micro-cracking or micro-tearing (Figure 3), since it does not have a purely brittle appearance (at the micro-level), in spite of the fact that it is associated with embrittlement by hydrogen (hydrogen embrittlement/HE) in pearlitic steels at the macro-level, so that it is more adequate to speak about hydrogen degradation (HD) in pearlitic steels. At the micro-scale, the TTS zone can be qualified as hydrogen-assisted microdamage (HAMD). The TTS fractography appearing in Figure 3 does not show any evidence of orientation or alignment in privileged direction, i.e., it is randomly oriented. This is the most frequent situation regarding the TTS area (non-oriented or randomly oriented TTS).
At the nano-scale, the TTS region also contains some evidence of tear ridges at the sub-micron level, i.e., at the nano-level; it is the level of the pearlite interlamellar spacing of the considered pearlitic steel (about 0.3 μm, i.e., 300 nm). A plausible explanation of this sort of hydrogen-assisted sub-micron nano-damage inside the pearlitic microstructure could be any local plasticity/yielding phenomenon related to movement of dislocations along a glide plane in the ferrite phase, with possible breaking of the cementite lamellae by a nano-shear mode or by nano-tearing mode.
5. Evolution of Hydrogen-Assisted Microdamage (HAMD)
This section of the paper includes a thorough study on the microscopic features of the HAMD area in the different notched specimens (with distinct triaxiality/constraint level) and its time evolution. Figure 5 shows the microscopic fracture mode in specimen A10, i.e., that of minimum notch depth and minimum notch radius that has undergone the fastest HE experiment (HE test of about 10 min up to final fracture under a hydrogen environment). The fractograph in Figure 5 shows subcritical fracture initiation and slow initial cracking/damage/fracture propagation produced by unconventional TTS (assisted by hydrogen) and critical (unstable) cracking/fracture quick propagation taking place in the form of a typical cleavage-like micro-fracture mode that is purely mechanical and not assisted by hydrogen. In the slowest test A1 (test duration of about 13.5 h up to final fracture), the micro-fracture map is similar (TTS plus cleavage), but the depth of the HAMD area is higher.
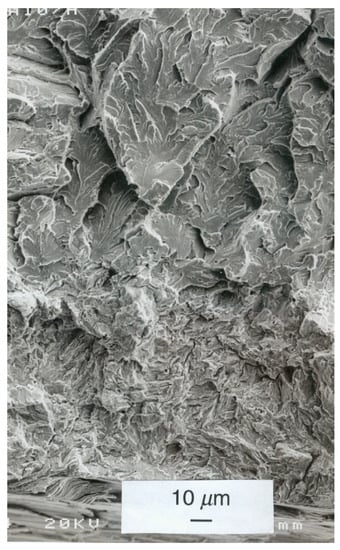
Figure 5.
Evolution of HAMD in sample A10 (from bottom to top): TTS + cleavage.
The cleavage-like (C) fractographic mode exhibits the typical river patterns signaling the direction of fracture propagation. Such river patterns are globally divergent from the area associated with fracture sub-critical initiation by TTS (from bottom to top) and at the same time they are locally convergent (in the same way as tributaries approaching the main river flow) in specific areas of the fracture topography (following the sense of fracture propagation direction from the bottom of the fractograph to the top of it). While the TTS fractographic mode represents a sub-critical (hydrogen-assisted) fracture mode associated with slow crack growth, the cleavage-like propagation is quick and unstable while approaching final catastrophic fracture.
Figure 6 presents three fracture areas inside the sample B6, i.e., that of maximum notch depth and minimum notch radius and the fastest HE experiment with a relatively short test duration (time to final fracture of 12 min). At the notch tip (initiation of HAMD) a sort of orientation of the TTS topography (oriented TTS) may be observed, with an orientation along a radial axis representing the micro-damage (or nano-damage) propagation direction. Such an orientation inside the TTS zone is less defined in areas placed far from the notch tip where the fractographic mode becomes randomly-oriented TTS (non-oriented TTS in Figure 6c).
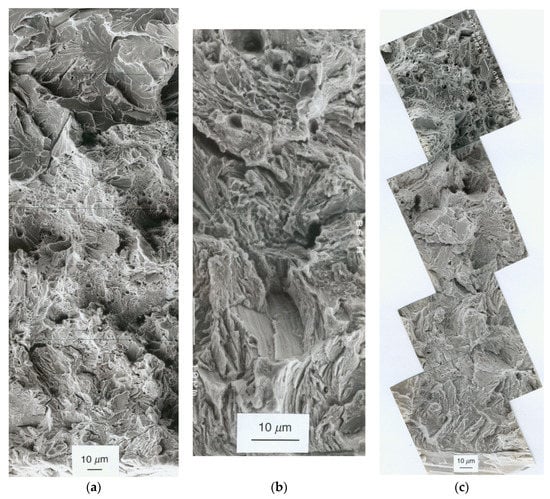
Figure 6.
Evolution of HAMD in different locations of specimen B6: (a) initiation of HAMD by TTS followed by quasi-MVC and C; (b) enlarged view of the TTS microscopic topography in the close vicinity of the notch tip (at the bottom of the fractograph itself); (c) different HAMD sub-modes, namely, initiation of HAMD by oriented TTS which turns to non-oriented TTS and to quasi-MVC. Fracture propagation from bottom to top in all fractographs.
After the two TTS regions (oriented and randomly oriented) that are clearly assisted by hydrogen, the microscopic fracture mode evolves in such a manner that it becomes more similar to the micro-void coalescence (MVC) topography (probably also produced with hydrogen assistance) and thus it will be denoted as quasi-MVC (QMVC) micro-fracture mode throughout this article, cf. Figure 6a,c, and finally catastrophic fast failure takes place by cleavage (C) with no need of hydrogen assistance (it is quick/brittle mechanical final fracture), as shown at the top of Figure 6a. Figure 6b offers an enlarged and detailed view of the TTS fractographic mode. In the slowest test B21 (with 73 h of test duration up to final fracture), the micro-fracture map (MFM) is similar (TTS plus QMVC plus cleavage), but the depth of the HAMD area is higher in this case.
Figure 7 describes the evolution of HAMD in specimen C6, i.e., that of minimum notch depth and maximum notch radius (with a duration of 9 min in the HE test; i.e., the fastest experiment for this geometry). The sequence of fracture events is as follows: (i) slow (sub-critical) initiation of hydrogen-assisted fracture/cracking by oriented TTS; (ii) further slow progress by randomly oriented TTS (non-oriented TTS) that is also assisted by the hydrogen environment and sub-critical; (iii) final slow fracture development by a poorly-defined quasi-MVC (probably with certain hydrogen assistance); (iv) final quick fracture (catastrophic/unstable) by cleavage (C) with no need of environmental (hydrogen) assistance. In this geometry C, it is important to emphasize that, in the slowest HE test C7 (21 h of test duration up to final fracture), the micro-fracture map (MFM) is different (TTS plus cleavage), i.e., the QMVC area disappears in this case, apart from the fact that the depth of the HAMD area is higher.
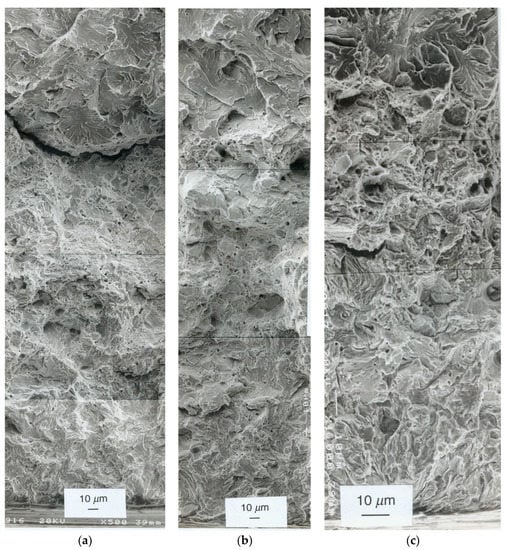
Figure 7.
Evolution of HAMD in different locations of specimen C6: (a) initiation of HAMD by TTS followed by quasi-MVC and C; (b) initiation of HAMD by TTS followed by quasi-MVC and C (the initiation by TTS is well defined in this specific fracture zone); (c) initiation of HAMD by oriented TTS which turns to non-oriented TTS and to poorly-defined quasi-MVC, before final fracture by C. Fracture propagation from bottom to top in all fractographs.
Figure 8 corresponds to specimen D5, i.e., that of maximum notch depth and maximum notch radius with an intermediate HE test duration of 2.5 h up to final fracture. The same trends of evolution of HAMD are observed, i.e., the following sequence (Figure 8a):
oriented TTS → randomly oriented TTS → quasi-MVC
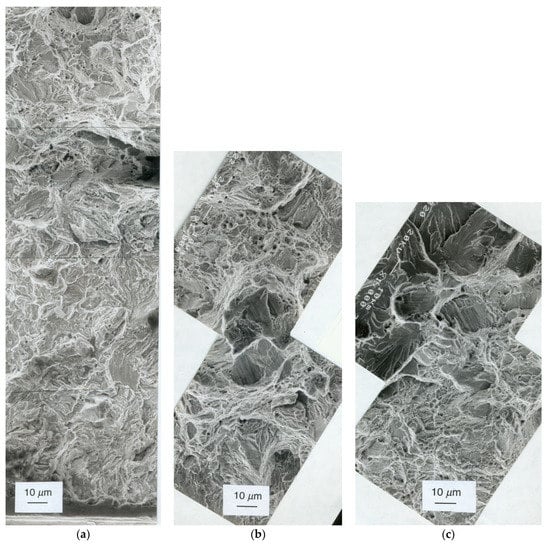
Figure 8.
Evolution of HAMD in different locations of specimen D5: (a) oriented TTS → randomly-oriented TTS → quasi-MVC; (b) transition from TTS to quasi-MVC; (c) transition from quasi-MVC to cleavage. Fracture propagation from bottom to top in all fractographs.
The transition from TTS to quasi-MVC (specimen D5) is given in Figure 8b and the transition from quasi-MVC to cleavage (also in specimen D5) is shown in Figure 8c. With the same bluntly-notched geometry D and the slowest test D24 (with a long test duration of 90 h up to final fracture) the micro-fracture map (MFM) is similar (TTS plus QMVC plus cleavage) but the depth of the HAMD area is higher in this case.
To complete the information about the TTS features, Figure 9 shows the initiation of HAMD by TTS in the annular external ring of sample D10, i.e., that of maximum notch depth and maximum notch radius with the minimum test duration of 11 min. Hydrogen damage at the micro-level can be observed in the external circumferential ring, in spite of the short duration of the test.
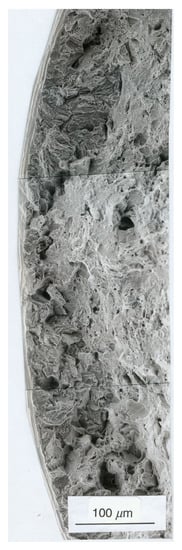
Figure 9.
Initiation of HAMD by TTS in the annular external ring of sample D10 (fracture propagates from left to right).
In the matter of the triaxiality effects on HAMD of the pearlitic steel considered in the present paper and its dependence and evolution with the embrittlement time, the fractographic features at the macro-, micro- and nano-scales in all notched geometries should be analyzed considering two limit experiments: (i) quasi-instantaneous tests (short enough to avoid deep hydrogen penetration distances from the notch tip) and, on the other hand, (ii) quasi-static tests (long enough to allow the stationary condition for the hydrogen diffusion problem to be reached, thus permitting deep hydrogen penetration distances from the notch tip). The embrittlement time for the quasi-instantaneous tests was about 10 min, whereas for quasi-static experiments, such a time (test duration) ranged from 10 to 100 h (see Table 3).
Table 4 shows the progression of HAMD in the considered pearlitic steel for distinct triaxiality levels in the specimen geometry. The transition region between the TTS and the cleavage areas in the form of quasi-MVC fracture zone appears only in certain cases: firstly, in geometries containing deep notches, either a sharp deep notch (geometry B) or a blunt deep notch (geometry D), in both cases of short and long HE tests; secondly, the quasi-MVC topography also appears in geometry C containing a blunt shallow notch (but the quasi-MVC are appears only in the case of short HE tests).
Table 4.
Triaxiality and time evolution of hydrogen-assisted micro-damage (HAMD).
In other words, the quasi-MVC zone disappears (and all the HAMD region is pure TTS) for the geometry A (with a sharp shallow notch) and for long tests on geometry C (blunt shallow notch), and it becomes less defined for long tests of geometry B (sharp deep notch) and for short tests of geometry C (blunt shallow notch). In the next section, this effect is analyzed on the basis of the hydrostatic stress distribution in the different notched specimens used in the experiments.
6. Continuum Mechanics Approach
6.1. Hydrogen Diffusion Assisted by Stress and Strain
Hydrogen embrittlement (HE) or, using a more general term, hydrogen degradation (HD) is a process of material deterioration by the harmful effect of hydrogen, and it requires hydrogen transport by diffusion from the external surface (notch tip) towards the prospective fracture sites, and such a diffusion is assisted by both the stress and the strain fields in the material (stress-and-strain-assisted diffusion of hydrogen). The hydrogen flux depends of several terms, namely: the gradient of hydrogen concentration, the gradient of hydrostatic stress (σ) and the gradient of hydrogen solubility (Ksε) that is itself a function of the equivalent plastic strain εp [64]:
J being the hydrogen flux, D the diffusion constant, C the hydrogen concentration, R the molar gas constant, VH the partial volume of hydrogen, T the absolute temperature and Ksε the hydrogen solubility.
The hydrogen diffusion equation is as a second-order partial differential equation obtained by applying the matter conservation law and the Gauss-Ostrogradsky theorem, resulting in:
Thus, from Equation (2), the effect on hydrogen diffusion of the three driving forces is easily understandable. Hydrogen diffuses towards the inner points due to: (i) the negative gradient of hydrogen concentration (similar to Fick’s law); (ii) the positive gradient of hydrostatic stress; (iii) the positive gradient of hydrogen solubility, which is a function of the gradient of equivalent plastic strain.
The concentration of hydrogen for long times of exposure, Ceq (equilibrium state reached for infinite time) can be obtained by the following steady-state solution of differential Equation (2) in a well-known Maxwell-Boltzman type:
where C0 is the equilibrium hydrogen concentration for the material free of stress and strain.
Figure 10 shows a scheme of the influence on hydrogen diffusion of the driving forces according to the aforementioned model of diffusion assisted by stress and strain fields [64].
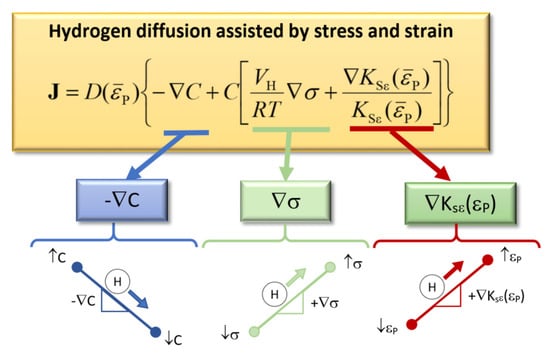
Figure 10.
Scheme of the influence on hydrogen diffusion of the driving forces according to the model of diffusion assisted by stress and strain. It is the keystone in the continuum mechanics approach to show how hydrogen diffuses towards the point of maximum hydrostatic stress.
6.2. Macroscopic Variables Governing the Microscopic Phenomenon of HAMD in Pearlitic Steel
Among the macroscopic variables governing the microscopic phenomenon of HAMD in pearlitic steel, the hydrostatic stress plays a relevant role in hydrogen transport by diffusion [64], cf. Equations (1)–(3) and thus the hydrostatic stress distributions in the samples were obtained by a numerical procedure. The finite element method (FEM) with an elastic-plastic code was applied using a Von Mises yield surface with an incompressible constitutive equation.
The FEM analysis showed that the hydrostatic stress distributions in the specimens evolved during the experiments (HE tests), reaching rising values as the loading level increases: however, in spite of such an evolution during the loading process, the point of maximum hydrostatic stress in the specimens always remains at depth xS (characteristic of the geometry) from the notch tip, and such a point is the location towards which hydrogen is driven by stress-assisted diffusion.
In the case of the shallowly-notched geometries A (sharp notch) and C (blunt notch), the aforementioned characteristic depth xS is relatively small, it being xS (A) < xS (C), i.e., hydrogen is driven to a location close to the notch tip. This suggests that a small penetration distance for the chemical species (hydrogen) is required in this case to produce the damaging embrittlement effect, so that in these shallowly-notched geometries hydrogen’s deleterious effects on the pearlitic steel (HE or HD at the macro-scale, HAMD at the micro-scale) is localized in the vicinity close to the notch tip.
In the case of the deeply-notched geometries B (sharp notch) and D (blunt notch), the location of the point of maximum hydrostatic stress is located just at the specimen axis, and thus hydrogen is “pumped” towards this point by long-term stress-assisted diffusion. This suggests that a relatively large penetration distance for the chemical species (hydrogen) is required in this case to produce the damaging embrittlement effect, so that in these deeply notched geometries hydrogen’s deleterious effects on the pearlitic steel (HE or HD at the macro-scale, HAMD at the micro-scale) are extended in volume.
The MFMs for different applied displacement rates (distinct HE test durations) shows that there are limit (asymptotic) size values of the HAMD region (consisting of different sub-modes such as oriented TTS, non-oriented TTS, quasi-MVC and cleavage, some of them disappearing in certain specific cases). To this end, it is useful to define the depth of the HAMD region as xHAMD (measured from the notch tip in a radial direction of the sample, i.e., in the main direction of hydrogen transport by diffusion).
In the case of very short tests with very low embrittlement time, the asymptotic value of xHAMD for such quasi-instantaneous tests is not negligible. This fact demonstrates that the embrittlement effect of hydrogen is detectable even for very short durations of the HE test. It is possible to write:
where t is the test duration and represents the strain rate in the test (measured as global strain rate, applied displacement rate or extension rate). In this case, the boundary condition for hydrogen transport by diffusion (partial differential equation) is reached almost instantaneously, i.e., both hydrogen adsorption (at the outer boundary Γ+) and hydrogen absorption (at the inner boundary Γ−) are also quasi-instantaneous.
On the other hand, in the case of very long tests with very high embrittlement time, the asymptotic value of xHAMD for such quasi-static (steady-state) tests reaches the depth of the maximum hydrostatic stress point xS. This situation corresponds to the steady-state solution of the hydrogen diffusion problem, and it is associated with a situation of equilibrium of the metal-hydrogen system when the former is free of stress and strain. Thus:
with the same meanings as above.
The hydrogen concentration in these tests is a direct function of the hydrostatic stress at each point, since the stationary solution of the diffusion differential equation is an adequate approach in this case and the equilibrium concentration of hydrogen for the stressed metal is achieved in this case at each material point.
Table 5 summarizes the depth xS of the point of maximum hydrostatic stress for each geometry, i.e., the penetration distance for hydrogen diffusion assisted by stress and strain fields.
Table 5.
Depth xS of the point of maximum hydrostatic stress for each geometry.
Table 6 includes, together with the information of the HE experiments, the values of the maximum hydrostatic stress (σmax) at the critical (fracture) instant in the tests. The information contained in it is fully consistent with the triaxiality levels appearing in the Table 2: the higher the specimen triaxiality, the more elevated the maximum hydrostatic stress levels in the specific geometry, in such a manner that the notched geometries analyzed in the present paper can be ranked according to their triaxiality levels (and related values of maximum hydrostatic stress at the critical fracture instant) in the following order: B, A, C, D.
Table 6.
Maximum hydrostatic stress (σmax) levels at the fracture instant of the HE tests, together with other relevant variables (of mechanical and fractographic nature) associated with the experiments.
7. Micromechanical Modeling of HAMD in Pearlitic Steel
7.1. HAMD by TTS in Pearlitic Steel
In order to formulate a plausible micromechanical model of HAMD by TTS in pearlitic steel, it is worth to mention the classical scientific references comprising the main micromechanical models of HE, HD, HAF (in general) or HAC (when a crack is present in the material). Beachem [65] formulated a classical model for HAC/HE in 1972 and coined the term quasi-cleavage to describe a kind of fractographic mode, with more or less ductile appearance, linked to hydrogen effects in material. Such a name has so frequently been used for a wide variety of damage situations that Thompson and Bernstein [66] stated that the term quasi-cleavage is on the verge of becoming meaningless.
More recently, two complementary terms arose in the scientific literature related to HE, HD, HAF or HAC, namely (i) hydrogen-enhanced localized plasticity (HELP) and (ii) hydrogen-enhanced decohesion (HEDE). The term HELP was firstly coined by Birnbaum and Sofronis [67], and this idea of hydrogen-plasticity interaction has been developed by Sofronis et al. [68] and by Gerberich [69]. The idea of decohesion (with loss of fracture toughness) promoted in the material (associated with the term HEDE) appears in the classical paper by Hirth [70] and has been used by Novak et al. [71].
In recent years, Toribio [72] formulated the two possibilities of HELP and HEDE as the dual micromechanisms of HAMD in fully-pearlitic steels (in the presence of cracks) depending on their degree of cold drawing, in such a manner that in hot-rolled pearlitic steels (before cold drawing) the HAMD develops by pure TTS resembling, in a certain sense, the Michelangelo stone sculpture texture (MSST) whereas, on the other hand, heavily cold-drawn pearlitic steel wires with cracks exhibit anisotropic HE behavior with crack deflection, and a micromechanism of HAMD developing by enlarged and oriented TTS (EOTTS) and resembling the Donatello wooden sculpture texture (DWST). While the first case (hot rolled pearlite) that fractures in hydrogen by TTS may be classified as HELP, the second one (cold drawn pearlite) that fractures in hydrogen by EOTTS could be denoted, more properly, as HEDE.
In ferritic-pearlitic steels used in pipelines, the dual roles of pearlite microstructure to interfere/facilitate gaseous hydrogen-assisted fatigue crack growth has been studied [73] and two micromechanisms of damage as pearlite tearing (PT) and pearlite delamination (PD) are proposed in the pearlite phase under the combined action of cyclic loading (fatigue) and hydrogen atmosphere. PT could be similar to TTS (a sort of HELP) analyzed in this paper whereas PD could be similar to EOTTS (a kind of HEDE) using the terminology of the present paper.
Since the present paper is focused on hot rolled pearlitic steel (isotropic) in the absence of any cold drawing, the macro-, micro- and nano-mechanical features observed in the HAMD allow an analysis of the macro-, micro- and nano-mechanism of fracture, but without considering any anisotropic effects on HE behavior caused by an oriented microstructural arrangement promoted by cold drawing.
In this framework, it can be assured that the TTS topography, associated with HE/HD in pearlite, exhibits certain evidence of hydrogen-plasticity interactions in the form of a sort of micro-tearing or nano-tearing at a scale below the pearlite interlamellar spacing of the material, and this TTS (a type of HAMD) may be classified as a HELP due to local ductile feature and hydrogen-plasticity interactions at the micro- and nano-scale.
With regard to the macro-scale, the TTS fractographic mode represents a subcritical hydrogen-assisted fracture mode associated with the stage II or plateau in the CGK curve da/dt-K in which the CGR is independent of the SIF K. The CGR during TTS crack propagation was measured in constant strain tests (CSTs) by standard optical methods using pre-cracked prismatic three-point bend specimens, cf. [74], obtaining a value of CGR v = 10−7 m/s (Figure 11). In notched specimens, the TTS mode represents a sub-critical post-crack prolonging the original notch and growing at the CGR of 10−7 m/s.
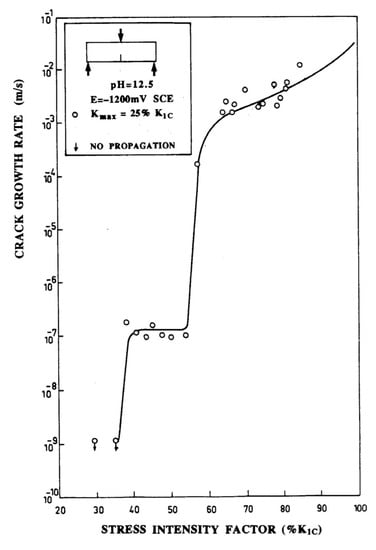
Figure 11.
Crack growth kinetics curve (da/dt-K) for a high-strength eutectoid pearlitic steel. The stage II (plateau) is associated with a crack growth rate (CGR) of 10−7 m/s and TTS fracture mode.
Again, in the matter of the macro-scale, the depth of the TTS region allows a kinematic formulation of a fracture criterion on the basis of the local strain rate at the notch tip or notch tip strain rate (NTSR), as explained in [75]. The NTSR is the representative local kinematic variable governing the HE process in the vicinity of the notch tip, in contrast with the global kinematic variable of the specimen, the global displacement rate or crosshead speed, cf. Table 3. There are two asymptotic situations: the ultra-fast tests (very high local strain rate) and the quasi-static tests (extremely low local strain rate). The first is fast enough to avoid hydrogen diffusion towards the inner points of the sample, whereas the second is slow enough to allow the stationary condition for the hydrogen diffusion problem to be reached (where xTTS = xS).
In the quasi-static tests (horizontal dashed lines in Figure 12) the critical equivalent stress in hydrogen environment (defined in [75]) reaches an asymptotic value different for each geometry, and dependent on the triaxiality level shown in Table 2: the higher the triaxiality level, the lower the dimensionless fracture stress in the tests.
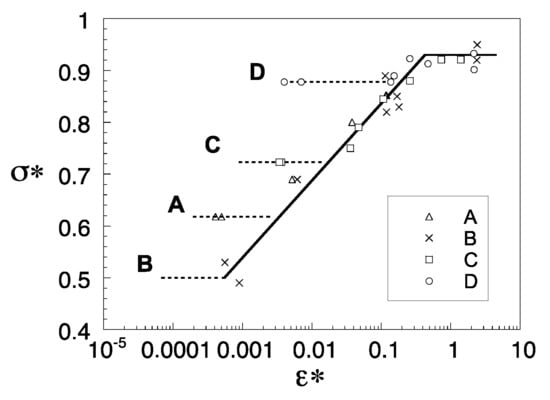
Figure 12.
Results of the SSRT on notched samples under HE environmental conditions, plotted in kinematic terms: dimensionless fracture stress as a function of the notch tip strain rate (NTSR), data from [75]. The asterisk is used to indicate a dimensionless variable.
7.2. Evolution (Sub-Modes) of HAMD in Pearlitic Steel
In order to formulate a plausible micromechanical model of evolution of HAMD in pearlitic steel, Table 4 and Table 5 are the keystones. On one hand, Table 4 contains the different sub-modes of HAMD and, on the other hand, Table 5 contains mechanical characteristics of each specific sample geometry: the depth of the maximum hydrostatic stress point towards which hydrogen diffuses, i.e., the hydrogen penetration path (HPP), a sort of chemical path that later produces a mechanical path, the crack path (CP) itself.
With regard to the micro-mechanism of formation of HAMD, the pearlitic lamellar microstructure could fail at the micro-scale either by trans-lamellar cracking path (TLCP) or by inter-lamellar cracking path (ILCP). The first one requires the fracture of cementite lamellae, that could happen according to the Miller-Smith micro-mechanism [76] of shear cracking of pearlite (SCP), represented in Figure 13.
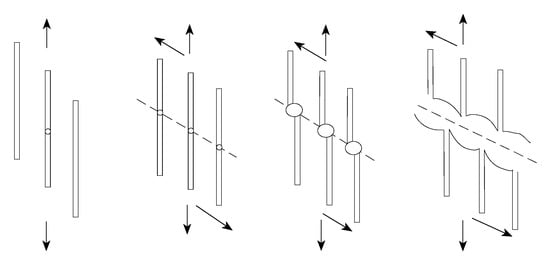
Figure 13.
Miller-Smith mechanism of shear cracking in pearlite (SCP).
Figure 14 shows a micromechanical model of HAMD (mainly TTS) in pearlitic steels with a lamellar microstructure: (a) trans-lamellar cracking path (TLCP) consisting of either pearlite tearing (PT) [73] or shear cracking of pearlite (SCP) [76], i.e., a sort of HELP; (b) inter-lamellar cracking path (ILCP) consisting of pearlite delamination (PD) [73], i.e., a sort of HEDE. Probably both are operative at the micro- and nano-scale and a combination of them could take place. In addition, in these micro- and nano-levels, hydrogen transport by dislocations [77,78,79,80,81] would be operative over distances below the pearlite interlamellar spacing (nano-scale). At the macro-scale, stress-and-strain-assisted diffusion of hydrogen predominates in pearlite over the hydrogen transport by dislocations [82].
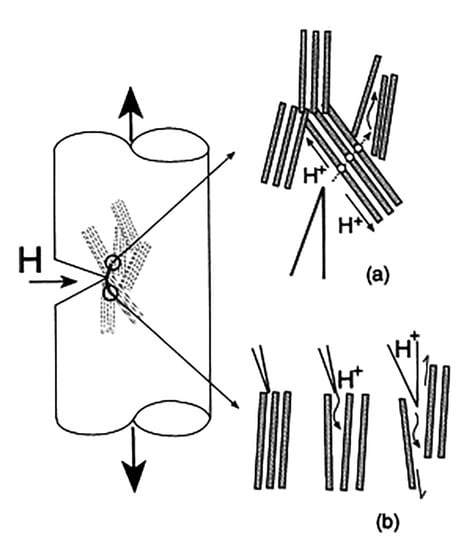
Figure 14.
Micromechanical model of HAMD (TTS) in pearlitic steels with lamellar microstructure: (a) trans-lamellar cracking path (TLCP) consisting of either PT or SCP, data from [73,76], i.e., a sort of HELP; (b) inter-lamellar cracking path (ILCP) consisting of PD, data from [73], i.e., a sort of HEDE.
Figure 15 plots the HAMD depth (xHAMD) as a function of the time to failure (tc) (embrittlement time) in the HE tests with notched samples A, B, C and D; variables are expressed in dimensionless terms, i.e., divided by their respective values in the very slow quasi-static test of each geometry (xHAMD,∞ and tc,∞).
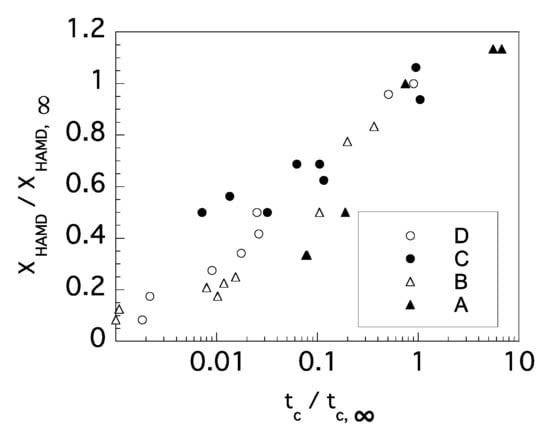
Figure 15.
Relationship between the HAMD depth (xHAMD) and the time to failure (tc) or embrittlement time in HE tests with notched samples A, B, C and D. Variables are divided by their respective values in the quasi-static test of each geometry (xHAMD,∞ & tc,∞).
An increasing trend of the HAMD depth with the embrittlement time is observed, i.e., the longer the HE, the deeper the area damaged by hydrogen at the micro- and nano-levels as a consequence of hydrogen transport over macroscopic distances by a mechanism of diffusion assisted by stress and strain fields.
In the matter of the quasi-MVC micro-fracture mode, it appears only in those notched geometries in which the HPP is long if compared with the HE test duration, i.e., when the hydrogen does not have enough time to reach the prospective fracture location (maximum hydrostatic stress point). This happens in deeply-notched geometries B (sharp) and D (blunt), since in these two the maximum hydrostatic stress appears at the geometry center or sample axis. The quasi-MVC topography also appears in short HE tests using shallowly-notched blunt geometry C in which the maximum hydrostatic stress is at a certain distance from the notch tip.
Then, the quasi-MVC area could be a candidate to the TTS zone that does not reach such a condition because of an insufficient level of hydrogenation. On the other hand, in HE tests using the shallowly notched sharp geometry A (either slow or quick), the HPP is very small, so that hydrogen has enough time to reach the near-tip location of the maximum hydrostatic stress point. The same happens in the slow HE tests with the shallowly-notched blunt geometry C (in this case the HPP is a little bit longer but the test is slow enough to allow the hydrogen to reach the critical location).
With regard to the pure MVC geometry, it takes place in regions of low triaxiality level that fail in ductile manner. When HAMD progresses in the form of a TTS crack extending the original notch, the local increase in triaxiality could produce the quasi-MVC topography after the TTS and before the MVC, the quasi-MVC being a consequence of a higher triaxiality level (near the TTS crack tip) when compared with the lower triaxiality level in the MVC region. Finally, when the macro-crack (TTS plus quasi-MVC in some cases plus MVC) reaches a critical size, final catastrophic failure takes place by cleavage.
8. Conclusions
The evolution of HAMD was analyzed, firstly showing an oriented TTS mode that turns to non-oriented (or randomly-oriented) TTS and finally to a quasi-MVC topography before final fracture by cleavage (purely mechanical) takes place.
The TTS represents a sort of HELP mode in which local micro- and nano-damage takes place in the form of hydrogen-plasticity interactions and dislocation transport of hydrogen developing at a very fine scale of analysis.
Although the main mechanism of hydrogen transport in pearlite is diffusion assisted by stress and strain fields at the macro-scale, hydrogen transport by dislocational movement (dragging) could be operative at the micro- and nano-scale.
At the micro-level, the formation of TTS could involve an interplay also between HELP and HEDE in the form of pearlite tearing (PT) as a mode of HELP or, on the other hand, in the form of pearlite delamination (PD) as a mode of HEDE.
In the case of a local phenomenon of HELP by PT to create TTS, the Miller-Smith mechanism of shear cracking of pearlite (SCP) could be operative in this case, with breaking of brittle cementite lamellae by local shear of ductile ferrite bands.
The locally-ductile micro-mechanism of PT or SCP (a mode of HELP) produces a trans-lamellar cracking path (TLCP), whereas the locally-brittle micro-mechanism of PD (a mode of HEDE) produces an inter-lamellar cracking path (ILCP).
The TTS fractographic mode represents a subcritical hydrogen-assisted fracture mode associated with the stage II or plateau in the CGK curve da/dt-K in which the CGR is independent of the SIF K.
The CGR during TTS crack propagation was measured in pre-cracked samples of pearlitic steel under constant strain tests (CSTs), with a value of CGR v = 10−7 m/s for hydrogen-assisted sub-critical cracking by TTS.
The TTS appears in strongly-hydrogenated areas, whereas the pseudo-MVC areas (transition regions) correspond to weakly-hydrogenated zones, as demonstrated by comparing the HPP to the maximum hydrostatic stress point and the HE test duration.
The quasi-MVC topography could be considered as a candidate to TTS that becomes TTS itself when a sufficient amount of hydrogen penetrates this zone of sub-critical hydrogen-assisted cracking/fracture.
Funding
This research was funded by the following Spanish Institutions: Ministry for Science and Technology (MICYT; Grant MAT2002-01831), Ministry for Education and Science (MEC; Grant BIA2005-08965), Ministry for Science and Innovation (MICINN; Grant BIA2008-06810) and finally Ministry for Economy and Competitiveness (MINECO; Grant BIA2011-27870). In addition, complementary funds were provided by the Regional Government Junta de Castilla y León (JCyL; Grants SA067A05, SA111A07 and SA039A08).
Institutional Review Board Statement
Not applicable.
Informed Consent Statement
Not applicable.
Data Availability Statement
Data is contained within the article.
Acknowledgments
The article was written during a very busy year of 2023. The author wishes to warmly dedicate it to his wife Lourdes Menárguez, his daughter Ana Lym Toribio and his son Juan Sun Toribio for the love, patience and support they have always provided and for very joyful moments between the rigorous and exhausting scientific work.
Conflicts of Interest
The author declares no conflict of interest. With regard to the research funds, the different institutions providing financial support for the scientific research had no role in the design of the study; in the collection, analyses, or interpretation of data; in the writing of the present manuscript; and in the decision to publish the results.
References
- Masoumi, M.; Echeverri, E.A.A.; Tschiptschin, A.P.; Goldenstein, H. Improvement of wear resistance in a pearlitic rail steel via quenching and partitioning processing. Sci. Rep. 2019, 9, 7454. [Google Scholar] [CrossRef] [PubMed]
- Ferreira, V.M.; Mecozzi, M.G.; Petrov, R.H.; Sietsma, J. Microstructure development of pearlitic railway steels subjected to fast heating. Mater. Des. 2022, 221, 110989. [Google Scholar] [CrossRef]
- Toribio, J. On the intrinsic character of the stress-strain curve of a prestressing steel. J. Testing Eval. 1992, 20, 357–362. [Google Scholar]
- Toribio, J. Cold drawn eutectoid pearlitic steel wires as high performance materials in structural engineering. Struct. Integr. Health Monit. 2006, 2, 239–247. [Google Scholar]
- Borchers, C.; Kirchheim, R. Cold-drawn pearlitic steel wires. Prog. Mater. Sci. 2016, 82, 405–444. [Google Scholar] [CrossRef]
- Yan, W.; Chen, W.; Li, J. Quality control of high carbon steel for steel wires. Materials 2019, 12, 846. [Google Scholar] [CrossRef]
- Mihaliková, M.; Lišková, A.; Hagarová, M.; Cervová, J. Damage pearlitic steel in operation. Procedia Eng. 2017, 190, 352–356. [Google Scholar] [CrossRef]
- Embury, J.D.; Fisher, R.M. The structure and properties of drawn pearlite. Acta Metall. 1966, 14, 147–159. [Google Scholar] [CrossRef]
- Langford, G. Deformation of Pearlite. Metall. Trans. A 1977, 8, 861–875. [Google Scholar] [CrossRef]
- Ridley, N. A review of the data on the interlamellar spacing of pearlite. Metall. Trans. A 1984, 15, 1019–1036. [Google Scholar] [CrossRef]
- Lewandowski, J.J.; Thompson, A.W. Effects of the prior austenite grain size on the ductility of fully pearlitic eutectoid steel. Metall. Trans. A 1986, 17, 461–472. [Google Scholar] [CrossRef]
- Nam, W.J.; Bae, C.M. Void initiation and microstructural changes during wire drawing of pearlitic steels. Mater. Sci. Eng. A 1995, 203, 278–285. [Google Scholar] [CrossRef]
- Read, H.G.; Reynolds, W.T., Jr.; Hono, K.; Tarui, T. AFPIM and TEM studies of drawn pearlitic wire. Scr. Mater. 1997, 37, 1221–1230. [Google Scholar] [CrossRef]
- Toribio, J.; Ovejero, E. Microstructure evolution in a pearlitic steel subjected to progressive plastic deformation. Mater. Sci. Eng. A 1997, 234–236, 579–582. [Google Scholar] [CrossRef]
- Toribio, J.; Ovejero, E. Effect of cumulative cold drawing on the pearlite interlamellar spacing in eutectoid steel. Scr. Mater. 1998, 39, 323–328. [Google Scholar] [CrossRef]
- Toribio, J.; Ovejero, E. Microstructure orientation in a pearlitic steel subjected to progressive plastic deformation. J. Mater. Sci. Lett. 1998, 17, 1037–1040. [Google Scholar] [CrossRef]
- Toribio, J.; Ovejero, E. Effect of cold drawing on microstructure and corrosion performance of high-strength steel. Mech. Time-Depend. Mater. 1998, 1, 307–319. [Google Scholar] [CrossRef]
- Languillaume, J.; Kapelski, G.; Baudelet, B. Cementite dissolution in heavily cold drawn pearlitic steel wires. Acta Mater. 1997, 45, 1201–1212. [Google Scholar] [CrossRef]
- Nam, W.J.; Bae, C.M.; Oh, S.J.; Kwon, S.J. Effect of interlamellar spacing on cementite dissolution during wire drawing of pearlitic steel wires. Scr. Mater. 2000, 42, 457–463. [Google Scholar] [CrossRef]
- Choi, H.C.; Park, K.T. The effect of carbon content on the Hall-Petch parameter in the cold drawn hypereutectoid steels. Scr. Mater. 1996, 34, 857–862. [Google Scholar] [CrossRef]
- Nam, W.J.; Bae, C.M.; Lee, C.S. Effect of carbon content on the Hall-Petch parameter in cold drawn pearlitic steel wires. J. Mater. Sci. 2002, 37, 2243–2249. [Google Scholar] [CrossRef]
- Toribio, J. Relationship between microstructure and strength in eutectoid steels. Mater. Sci. Eng. A 2004, 387–389, 227–230. [Google Scholar] [CrossRef]
- Toribio, J.; González, B.; Matos, J.C. Microstructure and mechanical properties in progressively drawn pearlitic steel. Mater. Trans. 2014, 55, 93–98. [Google Scholar] [CrossRef]
- Tarui, T.; Maruyama, N.; Takahashi, J.; Nishida, S.; Tashiro, H. Microstructure control and strengthening of high-carbon steel wires. Nippon Steel Tech. Rep. 2005, 91, 56–61. [Google Scholar]
- Shiota, Y.; Tomota, Y.; Moriai, A.; Kamiyama, T. Structure and mechanical behavior of heavily drawn pearlite and martensite in a high carbon steel. Met. Mater. Int. 2005, 11, 371–376. [Google Scholar] [CrossRef]
- Zhang, X.; Godfrey, A.; Huang, X.; Hansen, N.; Liu, Q. Microstructure and strengthening mechanisms in cold-drawn pearlitic steel wire. Acta Mater. 2011, 59, 3422–3430. [Google Scholar] [CrossRef]
- Zhang, X.; Godfrey, A.; Hansen, N.; Huang, X. Hierarchical structures in cold-drawn pearlitic steel wire. Acta Mater. 2013, 61, 4898–4909. [Google Scholar] [CrossRef]
- Li, Y.J.; Choi, P.; Goto, S.; Borchers, C.; Raabe, D.; Kirchheim, R. Evolution of strength and microstructure during annealing of heavily cold-drawn 6.3 GPa hypereutectoid pearlitic steel wire. Acta Mater. 2012, 60, 4005–4016. [Google Scholar] [CrossRef]
- Takahashi, J.; Kosaka, M.; Kawakami, K.; Tarui, T. Change in carbon state by low-temperature aging in heavily drawn pearlitic steel wires. Acta Mater. 2012, 60, 387–395. [Google Scholar] [CrossRef]
- Zhao, T.Z.; Zhang, S.H.; Zhang, G.L.; Song, H.W.; Cheng, M. Hardening and softening mechanisms of pearlitic steel wire under torsion. Mater. Des. 2014, 59, 397–405. [Google Scholar] [CrossRef]
- Rastegari, H.; Kermanpur, A.; Najafizadeh, A. Effect of initial microstructure on the work hardening behavior of plain eutectoid steel. Mater. Sci. Eng. A 2015, 632, 103–109. [Google Scholar] [CrossRef]
- Porter, D.A.; Easterling, K.E.; Smith, G.D.W. Dynamic studies of the tensile deformation and fracture of pearlite. Acta Metall. 1978, 26, 1405–1422. [Google Scholar] [CrossRef]
- Hyzak, J.M.; Bernstein, I.M. The role of microstructure on the strength and toughness of fully pearlitic steels. Metall. Trans. A 1976, 7, 1217–1224. [Google Scholar] [CrossRef]
- Park, Y.J.; Bernstein, I.M. The process of crack initiation and effective grain size for cleavage fracture in pearlitic eutectoid steel. Metall. Trans. A 1979, 10, 1653–1664. [Google Scholar] [CrossRef]
- Alexander, D.J.; Bernstein, I.M. The cleavage plane of pearlite. Metall. Trans. A 1982, 13, 1865–1868. [Google Scholar] [CrossRef]
- Dollar, M.; Bernstein, I.M.; Thompson, A.W. Influence of deformation substructure on flow and fracture of fully pearlitic steel. Acta Metall. 1988, 36, 311–320. [Google Scholar] [CrossRef]
- Toribio, J.; Ayaso, F.J.; González, B.; Matos, J.C.; Vergara, D.; Lorenzo, M. Tensile fracture behavior of progressively-drawn pearlitic steels. Metals 2016, 6, 114. [Google Scholar] [CrossRef]
- Zhao, T.Z.; Zhang, G.L.; Zhang, S.H.; Zhang, L.Y. Fracture characteristics of fully pearlitic steel wire in tension and torsion. J. Iron Steel Res. Int. 2016, 23, 1206–1212. [Google Scholar] [CrossRef]
- Zhao, T.Z.; Zhang, G.L.; Zhang, S.H.; Zhang, L.Y. Influence of lamellar direction in pearlitic steel wire on mechanical properties and microstructure evolution. J. Iron Steel Res. Int. 2016, 23, 1290–1296. [Google Scholar] [CrossRef]
- Khiratkar, V.N.; Mishra, K.; Srinivasulu, P.; Singh, A. Effect of inter-lamellar spacing and test temperature on the Charpy impact energy of extremely fine pearlite. Mater. Sci. Eng. A 2019, 754, 622–627. [Google Scholar] [CrossRef]
- Lu, X. Correlation between microstructural evolution and mechanical properties of 2000 MPa cold-drawn pearlitic steel wires during galvanizing simulated annealing. Metals 2019, 9, 326. [Google Scholar] [CrossRef]
- Jung, J.Y.; An, K.S.; Park, P.Y.; Nam, W.J. Correlation between microstructures and ductility parameters of cold drawn hyper-eutectoid steel wires with different drawing strains and post-deformation annealing conditions. Metals 2021, 11, 178. [Google Scholar] [CrossRef]
- Lynch, S.P. Failures of structures and components by environmentally assisted cracking. Eng. Fail. Anal. 1994, 1, 77–90. [Google Scholar] [CrossRef]
- Toribio, J.; Elices, M. Influence of residual stresses on hydrogen embrittlement susceptibility of prestressing steels. Int. J. Solids Struct. 1991, 28, 791–803. [Google Scholar] [CrossRef]
- Lillard, R.S.; Enos, D.G.; Scully, J.R. Calcium hydroxide as a promoter of hydrogen absorption in 99.5% Fe and a fully pearlitic 0.8% C steel during electrochemical reduction of water. Corrosion 2000, 56, 1119–1132. [Google Scholar] [CrossRef]
- Enos, D.G.; Scully, J.R. A critical-strain criterion for hydrogen embrittlement of cold-drawn, ultrafine pearlitic steel. Metall. Mater. Trans. A 2002, 33, 1151–1166. [Google Scholar] [CrossRef]
- Proverbio, E.; Longo, P. Sub critical crack growth in hydrogen assisted cracking of cold drawn eutectoid steel. Corros. Sci. 2007, 49, 2421–2435. [Google Scholar] [CrossRef]
- Toribio, J.; Ovejero, E. Hydrogen assisted cracking in progressively drawn pearlitic steel. Corros. Sci. 2007, 49, 3539–3556. [Google Scholar] [CrossRef]
- Mallick, A.; Das, S.; Mathur, J.; Bhattacharyya, T.; Dey, A. Internal reversible hydrogen embrittlement leads to engineering failure of cold drawn wire. Case Stud. Eng. Fail. Anal. 2013, 1, 139–143. [Google Scholar] [CrossRef]
- Nakamura, S.-I.; Suzumura, K. Hydrogen embrittlement and corrosion fatigue of corroded bridge wires. J. Constr. Steel Res. 2009, 65, 269–277. [Google Scholar] [CrossRef]
- Vehovar, L.; Kuhar, V.; Vehovar, A. Hydrogen-assisted stress-corrosion of prestressing wires in a motorway viaduct. Eng. Fail. Anal. 1998, 5, 21–27. [Google Scholar] [CrossRef]
- Perrin, M.; Gaillet, L.; Tessier, C.; Idrissi, H. Hydrogen embrittlement of prestressing cables. Corros. Sci. 2010, 52, 1915–1926. [Google Scholar] [CrossRef]
- Thompson, A.W.; Chesnutt, J.C. Identification of a fracture mode: The tearing topography surface. Metall. Trans. A 1982, 10, 379–405. [Google Scholar] [CrossRef]
- Costa, J.E.; Thompson, A.W. Hydrogen cracking in nominally pearlitic 1045 steel. Metall. Trans. A 1982, 13, 1315–1318. [Google Scholar] [CrossRef]
- Toribio, J.; Lancha, A.M.; Elices, M. Characteristics of the new tearing topography surface. Scr. Metall. Mater. 1991, 25, 2239–2244. [Google Scholar] [CrossRef]
- Toribio, J.; Lancha, A.M.; Elices, M. The tearing topography surface as the zone associated with hydrogen embrittlement processes in pearlitic steel. Metall. Trans. A 1992, 23, 1573–1584. [Google Scholar] [CrossRef]
- Toribio, J.; Vasseur, E. Hydrogen-assisted micro-damage evolution in pearlitic steel. J. Mater. Sci. Lett. 1997, 16, 1345–1348. [Google Scholar] [CrossRef]
- Toribio, J. Fracture mechanics approach to hydrogen-assisted microdamage in eutectoid steel. Metall. Mater. Trans. A 1997, 28, 191–197. [Google Scholar] [CrossRef]
- Toribio, J. Time-dependent triaxiality effects on hydrogen-assisted microdamage evolution in pearlitic steel. ISIJ Int. 2012, 52, 228–233. [Google Scholar] [CrossRef]
- Toribio, J. Triaxiality effects on hydrogen-assisted micro-damage (HAMD), notch tensile strength and hydrogen embrittlement of pearlitic steel. Procedia Struct. Integr. 2021, 33, 1139–1145. [Google Scholar] [CrossRef]
- Wang, M.; Akiyama, E.; Tsuzaki, K. Crosshead speed dependence of the notch tensile strength of a high strength steel in the presence of hydrogen. Scr. Mater. 2005, 53, 713–718. [Google Scholar] [CrossRef]
- Wang, M.; Akiyama, E.; Tsuzaki, K. Effect of hydrogen on the fracture behavior of high strength steel during slow strain rate test. Corros. Sci. 2007, 49, 4081–4097. [Google Scholar] [CrossRef]
- Toribio, J. Macro-and micro-approach to the notch-induced fracture process and notch tensile strength in eutectoid hot-rolled pearlitic steel: Weakest link versus process zone fracture criterion. Procedia Struct. Integr. 2021, 33, 1131–1138. [Google Scholar] [CrossRef]
- Toribio, J.; Kharin, V. A generalised model of hydrogen diffusion in metals with multiple trap types. Phil. Mag. 2015, 95, 3429–3451. [Google Scholar] [CrossRef]
- Beachem, C.D. A new model for hydrogen-assisted cracking (hydrogen “embrittlement”). Metall. Trans B 1972, 3, 441–455. [Google Scholar] [CrossRef]
- Thompson, A.W.; Bernstein, I.M. The role of plastic fracture processes in hydrogen embrittlement. In Fracture 1977: Advances in Resesearch on the Strength and Fracture of Materials; Taplin, D.M.R., Ed.; Pergamon Press: New York, NY, USA, 1977; pp. 249–254. [Google Scholar]
- Birnbaum, H.K.; Sofronis, P. Hydrogen-enhanced localized plasticity—A mechanism for hydrogen-related fracture. Mater. Sci. Eng. A 1994, 176, 191–202. [Google Scholar] [CrossRef]
- Sofronis, P.; Liang, Y.; Aravas, N. Hydrogen induced shear localization of the plastic flow in metals and alloys. Eur. J. Mech.-A/Solids 2001, 20, 857–872. [Google Scholar] [CrossRef]
- Gerberich, W. Modeling hydrogen induced damage mechanisms in metals. In Gaseous Hydrogen Embrittlement of Materials in Energy Technologies; Woodhead Publishing: Sawston, UK, 2012; pp. 209–246. [Google Scholar]
- Hirth, J.P. Effects of hydrogen on the properties of iron and steel. Metall. Trans. A 1980, 11, 861–890. [Google Scholar] [CrossRef]
- Novak, P.; Yuan, R.; Somerday, B.P.; Sofronis, P.; Ritchie, R.O. A statistical, physical-based, micro-mechanical model of hydrogen-induced intergranular fracture in steel. J. Mech. Phys. Solids 2010, 58, 206–226. [Google Scholar] [CrossRef]
- Toribio, J. HELP versus HEDE in progressively cold-drawn pearlitic steels: Between Donatello and Michelangelo. Eng. Fail. Anal. 2018, 94, 157–164. [Google Scholar] [CrossRef]
- Ogawa, Y.; Nishida, H.; Nakamura, M.; Olden, V.; Vinogradov, A.; Matsunaga, H. Dual roles of pearlite microstructure to interfere/facilitate gaseous hydrogen-assisted fatigue crack growth in plain carbon steels. Int. J. Fatigue 2022, 154, 106561. [Google Scholar] [CrossRef]
- Toribio, J. A fracture mechanics approach to hydrogen assisted microdamage and failure analysis of high-strength pearlitic steel wires: Resembling Michelangelo Stone Sculpture Texture. Procedia Struct. Integr. 2022, 41, 724–727. [Google Scholar] [CrossRef]
- Toribio, J. Hydrogen embrittlement of pearlitic steel in the presence of notches: A kinematic fracture criterion based on the notch tip strain rate. Procedia Struct. Integr. 2022, 41, 736–743. [Google Scholar] [CrossRef]
- Miller, L.E.; Smith, G.C. Tensile fracture in carbon steels. J. Iron Steel Inst. 1970, 208, 998–1005. [Google Scholar]
- Tien, J.; Thompson, A.W.; Bernstein, I.M.; Richards, R.J. Hydrogen transport by dislocations. Metall. Trans A 1976, 7, 821–829. [Google Scholar] [CrossRef]
- Dadfarnia, M.; Martin, M.L.; Nagao, A.; Sofronis, P.; Robertson, I.M. Modeling hydrogen transport by dislocations. J. Mech. Phys. Solids 2015, 78, 511–525. [Google Scholar] [CrossRef]
- Vermeij, T.; Hoefnagels, J.P.M. Plasticity, localization, and damage in ferritic-pearlitic steel studied by nanoscale digital image correlation. Scr. Mater. 2022, 208, 114327. [Google Scholar] [CrossRef]
- Yang, C.D.; Liu, Y.; Zhou, G.Y.; Zou, X.L.; Lu, X.G.; Cao, G.H. Microstructural evolution of SK85 pearlitic steel deformed by heavy cold rolling. Materials 2022, 15, 8405. [Google Scholar] [CrossRef] [PubMed]
- Bhadeshia, H.K.D.H.; Chintha, A.R. Critical assessment: The strength of undeformed pearlite. Mater. Sci. Tech. 2022, 38, 1291–1299. [Google Scholar] [CrossRef]
- Toribio, J.; Kharin, V. Fractographic and numerical study of hydrogen–plasticity interactions near a crack tip. J. Mater. Sci. 2006, 41, 6015–6025. [Google Scholar] [CrossRef]
Disclaimer/Publisher’s Note: The statements, opinions and data contained in all publications are solely those of the individual author(s) and contributor(s) and not of MDPI and/or the editor(s). MDPI and/or the editor(s) disclaim responsibility for any injury to people or property resulting from any ideas, methods, instructions or products referred to in the content. |
© 2023 by the author. Licensee MDPI, Basel, Switzerland. This article is an open access article distributed under the terms and conditions of the Creative Commons Attribution (CC BY) license (https://creativecommons.org/licenses/by/4.0/).