Abstract
Cold wire gas metal arc (CWGMA) additive manufacturing (AM) is more productive and beneficial than the common electric arc processes currently used in wire arc additive manufacturing (WAAM). Adding a non-energised wire to the gas metal arc (GMA) system makes it possible to overcome a process limitation and decouple the energy input from the material feed rate. Two novel process control methods were proposed, namely, arc power and travel speed control, which can keep the required geometry accuracy in WAAM through a broad range of thermal conditions. The reinforcement area of the bead is kept constant with accurate control over the height and width while still reducing the energy input to the substrate; decreasing penetration depth, remelting, and the heat-affected zone (HAZ); and reaching a dilution lower than 10%. This work also presents improved productivity compared to all the other single-arc energy-based processes with a demonstrator part built using 9.57 kg h−1 with CWGMA AM.
1. Introduction
Wire arc additive manufacturing (WAAM) is a directed energy deposition (DED) process that uses an electric arc as the energy source to melt the metallic wire feedstock and join the deposited material layer upon layer [1]. This technology takes advantage of high deposition rates to build medium-to-large metal parts with shorter lead times, lower production costs, and less material waste than the currently used manufacturing processes [2,3].
The deposition rate is an important indicator in additive manufacturing (AM) and is often used to compare the productivity of different processes. Among the electric arc processes used in WAAM, gas metal arc (GMA)-based processes can achieve higher wire feed speeds (WFSs), which result in higher deposition rates [2,4]. This is achieved using a consumable wire electrode within the GMA torch, which simultaneously generates the arc and deposits the wire as filler material, leading to a higher thermal or arc efficiency [5,6,7]. On the other hand, gas tungsten arc (GTA) and plasma transferred arc (PTA) have relatively low arc efficiency, as they both use non-consumable electrodes and have the filler wire separately fed into the arc and the melt pool [2,6].
The torch’s travel speed (TS) during deposition is another factor affecting WAAM productivity and is also higher in GMA [5], favouring its choosing.
During the build-up of a part, there is the need to adapt to different energy dissipation conditions and avoid energy accumulation while keeping the required geometry accuracy [8]. Therefore, in WAAM, it is important to decouple energy input from material feeding to allow accurate thermal and geometry control. However, this is impossible with the standard GMA process because a change in the electrode WFS will lead to concurrent changes in the arc power and deposition rate, creating a disadvantage compared to GTA and PTA processes.
A GMA variant was created by adding a non-energised or cold wire to tackle this obstacle, i.e., cold wire gas metal arc (CWGMA) process [4]. While the electrode (or hot wire) is still responsible for the arc, cold wire feeding can regulate changes in the material deposition.
Several other analogue processes have been developed to dissociate energy and material supply. Many were based on bypassing some of the current from one torch and power supply through another non-consumable or consumable element, reducing the energy input to the workpiece while increasing the control over material feeding. The double-electrode GMA process (DE-GMA) added a GTA torch to bypass some current from a GMA system [9]. The bypass-coupled WAAM [10] and ultracold-WAAM (UC-WAAM) [11] completed the electrical circuit directly between a GTA torch (negative pole) and the consumable wire (positive pole) to create much higher cooling rates. Although allowing increased productivity compared to the standard arc processes, none of these can accomplish deposition rates as high as CWGMA.
Other variants added another power supply to the standard arc system, leading to an addition of energy which is avoided using CWGMA. Examples of this are the consumable DE-GMA using two GMA systems [12], another DE-GMA process using one GMA and one GTA system in WAAM [13], and a cross-arc process including one GTA system and two GMA torches connected to an AC power source [14].
So far, most of the CWGMA research has focused on welding and cladding applications. For example, the effects of the cold wire addition on the bead geometry, such as reducing the penetration, dilution, and heat-affected zone (HAZ) by removing part of the energy that would be transferred to the substrate, have been reported in welding [4]. In addition, CWGMA is also described as helpful in reducing residual stresses and distortion [15], and it is advantageous for cladding applications [16].
In recent years, a few studies using CWGMA in WAAM have reported it as a process with increased productivity, reduced energy input, and other benefits in several materials such as mild steels [17,18,19], stainless steels [20], and aluminium alloys [21].
However, in all the research on CWGMA, the geometry and thermal control were limited because the studies focused solely on the effect of the cold wire addition with all other welding parameters fixed, which resulted in a change in the total material feed rate. And as demonstrated in [22], the material feed rate (the total WFS to TS ratio) controls the reinforcement area of the deposited beads. Hence the increase in the reinforcement area plotted at [16,21], which is unfavourable during the build-up of a WAAM part because the bead size should be maintained in all layers.
The present work addresses this limitation and introduces two novel process control methods in CWGMA AM to keep a constant material feed rate while having precise and broad control over the energy input.
2. Materials and Methods
2.1. Materials
All the experiments were conducted using bright mild steel plates with the material code 080A15 and composition shown in Table 1, which follows Standard No. BS EN 10277 [23]. The substrates were supplied as flat bars 200 mm wide, 12 mm thick, and cut to a length of 500 mm. Before deposition, the substrates were cleaned using a wire brush, acetone, and paper.

Table 1.
Chemical compositions (wt.%) of the substrate and filler wires as given by the suppliers.
Both the electrode (hot wire) and non-energised wire (cold wire) were ER70S-6 solid mild steel wires with the composition shown in Table 1. A diameter of 1.2 mm was used for both filler wires.
The shielding gas was the BOC SpecShield gas with 8% CO2 in Ar. A regulator controlled the gas flow and kept it at 18 to 20 L min−1 during operation.
2.2. Setup
Figure 1 shows the CWGMA setup used. The power source was an Oerlikon Citowave MXW 500, capable of supplying a current of up to 500 A. The GMA torch linked to it has an incorporated liquid cooling system to withstand the same current level. The motion system used was a 6-axis Fanuc robotic arm to which the torch and the hot wire feeder were mounted. The cold wire feeder can be controlled remotely, and a torch-end effector holds the cold wire tip. A XIRIS XVC-1000/1100 camera was also used to record the deposition process.
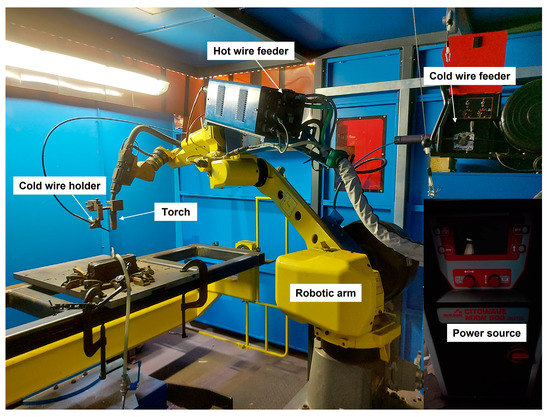
Figure 1.
CWGMA setup.
Figure 2 shows the torch and the cold wire tip configuration relative to each other and the substrate. A preliminary study determined the pre-set conditions for a stable deposition process. Hence, the torch was kept at 90° to the substrate (represented by the red axis) and was used at a contact tip-to-work distance (CTWD) of 16 mm. The cold wire was fed from a leading position relative to the arc in the travel direction of the torch. The cold wire tip was set 30° to the substrate (represented by the blue axis), and the hot and cold wire tips converged at the same point.
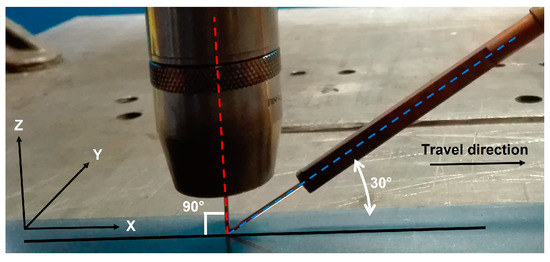
Figure 2.
Torch and cold wire configuration relative to the substrate.
2.3. Experimental Methodology
These experiments used a synergic line for mild steels and a spray metal transfer was kept.
Bead-on-plate deposition was performed to assess the effect of the process parameters on the energy input, geometry of the bead, and remelting and dilution. Transverse cross-sections were taken from the uniform sections of the beads, which are near the middle of their length, avoiding segments affected by the arc start and stop. Then, these cross-section samples were prepared according to ISO/TR 20580 and etched with 2% Nital. Macrographs were taken using a Nikon Optiphot-66 optical microscope, and the AxioVision image processing and analysis software was used to acquire the outputs, as shown in Figure 3.
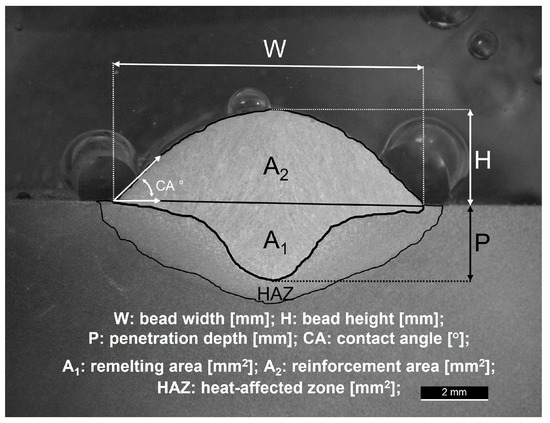
Figure 3.
Outputs measured on the macrographs from the transverse cross-sections of the deposited beads.
2.3.1. Constant Reinforcement Area
The deposition rate (DR) of CWGMA AM, in kg h−1, was calculated using Equation (1) and is proportional to the total wire feed speed, neglecting vaporisation of the material or spatter and considering that the material and dimension of both the hot and cold wires are the same.
where ρ is the material density, which for the ER70S-6 wires is 7833.4 kg m−3; d is the diameter of the wire; and are the WFSs of the hot and cold wires (i.e., H WFS and C WFS), respectively.
Following the same rationale, as demonstrated in [22], during a deposition in a unit of time, the volume of melted wire will be transferred to the melt pool and create the reinforcement portion of the bead, expressed in Equation (2).
, the reinforcement area, is represented in Figure 2 and is the travel speed (TS) used during deposition. And from Equation (2), the material feed rate, the total WFS to TS ratio is expressed as follows in Equation (3):
Therefore, to keep a constant reinforcement area and control the bead geometry in CWGMA AM, two methods were developed to control the material feed rate during the build-up of a part.
2.3.2. Energy Input
The energy input (EI), in J mm−1, which is usually calculated using Equation (4) following [5,6,7], represents the energy generated by the electrode and the arc that is transferred to the melt pool and pre-existent material at each unit length.
where is the arc efficiency of the process, and V and I are the voltage and current, respectively. An arc efficiency of 0.8 was used based on the values reported for GMA [5,7,24] and the measurements made for CWGMA [25].
Only the average values of V and I displayed at the power source at the end of each deposition were considered during this study.
Equation (4) does not consider the energy the cold wire absorbs before being transferred to the melt pool. It is possible to approximate the minimum heat required to melt the filler material (, both hot and cold wires, considering it the energy absorbed by the wires and provided to the reinforcement portion of the melt pool and the bead per unit of time, using Equation (5). This excludes any vaporisation of the material and any wire being heated above the melting temperature.
where represents the amount of energy required to heat one unit of mass of wire from the T0 (room temperature considered 293 K) to the Tm (melting temperature of 1723 K [4]), with CS being the specific heat in solid state and equal to 685 J kg−1 K−1 [26]. is the latent heat of fusion, which is 250,000 J kg−1 [26], and represents the amount of energy required to change 1 kg of the material from solid to liquid at its melting temperature. It is acknowledged that the and CS change with the temperature, but, to simplify the calculations, they were considered as fixed values.
Therefore, from Equations (4) and (5), the theory hereby defended is that the actual energy input to the pre-existent material in CWGMA, reduced by the cold wire addition, should be as follows in Equation (6). And this is the energy input that contributes to remelting and reheating the pre-existent material. will be the energy input considered in all the results and discussions of this work.
2.3.3. Remelting and Dilution Ratios
The remelting (RR) and dilution (D) ratios, in %, are important to consider in additive manufacturing and cladding applications and can be calculated with the remelting () and reinforcement () areas using Equations (7) and (8) as follows:
The ideal in WAAM would be to deposit as much new material as possible, having a high reinforcement area and a small remelting area , which would mean low values of remelting and dilution rations. That way, almost all the energy would be used towards melting the wires with just a minimal percentage necessary to join the newly deposited material to the pre-existent one and avoid any lack of fusion between layers.
2.4. Process Control Methods
The first set of experiments was conducted to introduce the two process control methods. The experiments were conducted using the DC spray mode, a maximum H WFS— of 12 m min−1, and a constant material feed rate represented by a total WFS to TS ratio— of 30. Both methods’ lower limits are found when both wires stop fully melting and the process becomes unstable.
For the arc power control method (APCM), there was a TS of 0.6 m min−1 and a deposition rate of 9.57 kg h−1, as shown in Table 2. In this method, the cold wire addition, represented by an increase in the C WFS, is proportionally matched with a decrease in the H WFS while the TS is kept constant to maintain the material feed rate and deposition rate.

Table 2.
Parameters used to demonstrate the arc power control method.
For the travel speed control method (TSCM), the increase in C WFS is proportionally matched with an increase in the TS, as shown in Table 3, keeping a constant material feed rate but increasing the deposition rate. At the same time, the H WFS, arc power, and arc length are kept constant.

Table 3.
Parameters used to demonstrate the travel speed control method.
The H WFS and TS range used in the experiments were chosen based on a preliminary study of the GMA work envelope without the cold wire addition, shown in Figure 4, hence the maximum H WFS of 12 m min−1 to limit the energy input used throughout the full TS range—0.4 to 0.8 m min−1, and a TS of 0.6 m min−1 is the middle ground. It is also important to mention that the transition from spray to globular transfer modes occurs at H WFS 7 m min−1.
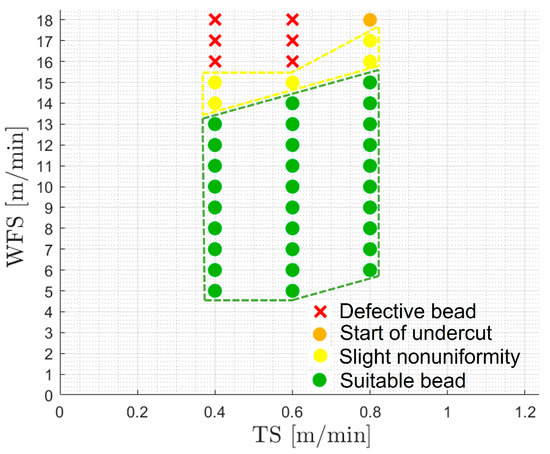
Figure 4.
Work envelope of the GMA power source in DC standard mode using mild steels.
Lastly, a demonstrator part was built using CWGMA AM and the APCM to display their applicability. A skin and core building strategy [19] was employed, using 9.57 kg h−1 for the core and 6.38 kg h−1 for the skin. The DC spray mode and a TS of 0.6 m min−1 were kept throughout the build.
3. Results
3.1. Process Control Methods
3.1.1. Arc Power Control Method
The macrographs in Figure 5 represent the APCM, and its thermal control capabilities are shown in Figure 6. The decrease in the energy input to the substrate is caused, in this case, by the decrease in the arc power, controlled by the reduction in H WFS, and the increase in energy absorbed by the cold wire by increasing the C WFS.

Figure 5.
Macrographs representing the arc power control method.
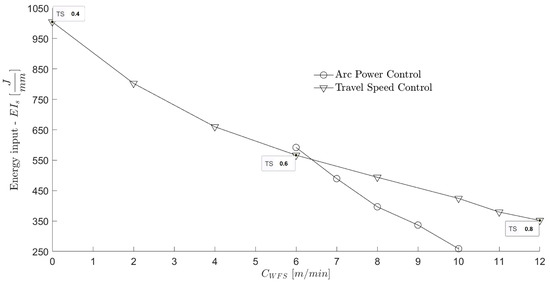
Figure 6.
Thermal control in the arc power and travel speed control methods.
The decoupling between energy input and material feeding is easier to demonstrate using the APCM because, even though the H WFS is reduced, the deposition rate remains constant while the energy input decreases, as seen in Figure 6.
The geometry control of the deposited bead and the melt pool is identified in the graph in Figure 7a. It shows an almost constant bead height and width, on the left axis, and shape (contact angle), on the right axis throughout all points (from 591.9 J/mm to 336.7 J/mm) except the last one (258.9 J/mm). With this method, the maximum change in the bead height was only 0.66 mm.
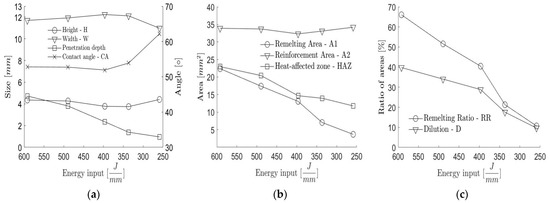
Figure 7.
Effect of the arc power control method on (a) the bead size and shape; (b) , , and HAZ; and (c) dilution and remelting ratios.
The constant reinforcement area , shown in Figure 7b, was the goal behind the constant material feed rate accomplished with this control method and previously expressed by Equation (3).
The reduction in penetration depth, shown in Figure 7a, and remelting area and HAZ, Figure 7b, were also expected with the reduction in the energy input to the substrate .
Figure 7c plots the decrease in dilution and remelting ratios, which could be anticipated by the constant reinforcement area and the decrease in remelting area , with the reduction in energy input.
3.1.2. Travel Speed Control Method
One of the most significant advantages of using the TSCM is the simultaneous increment in deposition rate, by increasing the C WFS, and in TS, as shown in the macrographs of Figure 8, both leading to increased productivity.

Figure 8.
Macrographs representing the travel speed control method.
The thermal control in the TSCM is represented in Figure 6 by the decrease in the energy input caused by the increase in the TS, from 0.4 to 0.8 m min−1 as marked in the plot, and the increase in energy absorbed by the cold wire by increasing the C WFS.
There is a tendency for the appearance of undercut defects when using a high arc energy (H WFS) and high TS in the GMA process [27], as marked in Figure 4, which can hinder its productive capabilities. However, with the cold wire addition, the reduction in the bead width caused by the increase in TS while using this method is not as predominant, as seen in Figure 9a. Therefore, the bead toes will not become unfilled as easily, and the appearance of the undercut is diminished using CWGMA. The limit of TS that is possible to achieve will probably also be higher in CWGMA than in the GMA process.
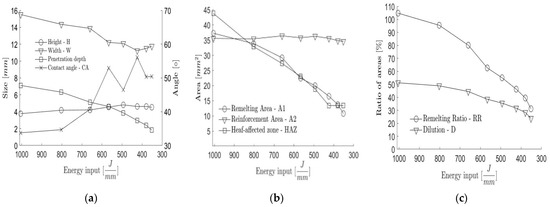
Figure 9.
Effect of the travel speed control method on (a) the bead size and shape; (b) , , and HAZ; and (c) dilution and remelting ratios.
Regarding the geometry control, the bead width tends to decrease, and the bead height slightly increases until the middle point in Figure 9a, accomplished with a H WFS of 12 m min−1 and a C WFS of 6 m min−1, which corresponds to a of 566.4 J/mm. This point represents a R ratio () of 0.5 and uses the same parameters as the initial point in the APCM. After this point, the bead’s height and width stabilise similarly to what happens in the previous method. However, the contact angle tends to vary slightly in this case, which can be attributed to small changes between the contact angle on the left and right of the bead. The maximum change in the bead height is 1.04 mm using the TSCM.
Figure 9b demonstrates the control over the almost constant reinforcement area due to the constant material feed rate using this method as well. The other areas (and HAZ) and the penetration depth, seen in Figure 9a, decrease with the decrease in the energy input . The dilution and remelting ratios, plotted in Figure 9c, have the same tendency and also decrease but are not as low as in the previous method.
The constant arc characteristics in the TSCM, due to the unaltered H WFS, allow easier usage of power source features such as arc length correction (voltage correction or TRIM, depending on the manufacturer) if there is a need for a slight adjustment, because the effect of the arc length correction changes for different H WFSs used. For example, the arc length and power can be slightly increased to fix any issue with melting the cold wire.
4. Discussion
Comparing the two methods, the range of thermal control plotted in Figure 6 is lower in the APCM but still allows for a 56.3% decrease in the energy input to the pre-existent material from the initial condition, while in the TSCM, the reduction is 65%.
However, the first half of the depositions using the TSCM, until the point where an H WFS of 12 m min−1 and a C WFS of 6 m min−1 are used (R ratio of 0.5 and 566.4 J/mm), and as seen in Figure 8, start at really high values due to the low TS without the cold wire addition. These are not beneficial for AM applications because they create high penetration depth, shown in Figure 9a, and remelting area and HAZ, in Figure 9b, and the extreme remelting ratio, shown in Figure 9c, starts at a value above 100% because the remelting area is even higher than the reinforcement area . This fact goes totally against the ideal in WAAM to deposit as much new material as possible without wasting energy in unnecessary remelting or reheating of the pre-existent material.
The main differences in the bead geometry control of the two methods also happen until the R ratio of 0.5 is reached in the TSCM, and the reason can be traced back to the interaction between the cold wire, the arc, the metal transfer from the electrode, and the melt pool flow. The distinct interactions can be seen in Figure 10, which shows frames from the videos recorded during the depositions where the following parameters were used: (a) H WFS of 12 m min−1 and C WFS of 2 m min−1, (b) H WFS of 12 m min−1 and C WFS of 6 m min−1, (c) H WFS of 9 m min−1 and C WFS of 9 m min−1, and (d) H WFS of 8 m min−1 and C WFS of 10 m min−1 (a video of each deposition is provided as Supplementary Material).
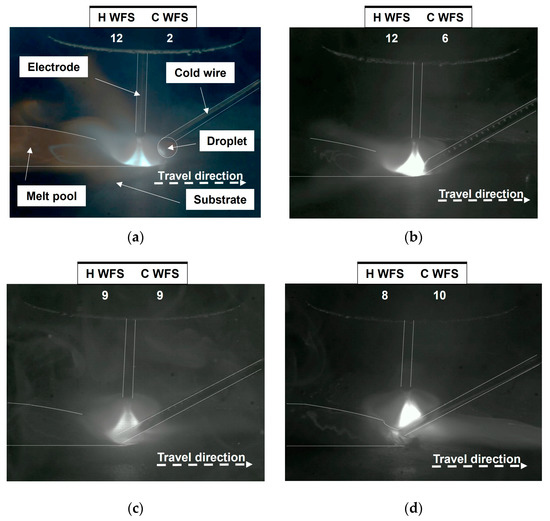
Figure 10.
Interaction between the cold wire, the arc, the metal transfer from the electrode, and the melt pool flow when the following parameters were used: (a) H WFS of 12 m min−1 and C WFS of 2 m min−1; (b) H WFS of 12 m min−1 and C WFS of 6 m min−1; (c) H WFS of 9 m min−1 and C WFS of 9 m min−1; and (d) H WFS of 8 m min−1 and C WFS of 10 m min−1.
When a low amount of cold wire is added, and the R ratio is lower than 0.5 (from 1004.7 J/mm to 566.4 J/mm), the cold wire is rapidly melted at the arc border, and a globular droplet gradually increases in size until it falls to the melt pool, as shown in Figure 10a. At this point, the energy absorbed by the cold wire, part of , is still not much, and the cold wire does not yet shield the substrate from the arc, as was reported in [28]. Therefore, in the TSCM, as the C WFS and the TS increase up to this point, leading to a reduction in the energy input , the bead geometry follows the expected tendency of a melt pool becoming colder overall. It becomes narrower and taller, with a smaller penetration depth and a higher contact angle, as shown in the first three macrographs in Figure 8 and plotted in the correspondent points in Figure 9a.
When the R ratio reaches 0.5, which is the starting point of the APCM (591.9 J/mm) and the middle point in the TSCM (566.4 J/mm), a liquid bridge is formed directly between the cold wire and the melt pool as the cold wire starts intersecting the arc border and the metal transfer is conducted closer to the melt pool centre just below the electrode, as shown in Figure 10b. Therefore, the cold wire not only contributes to a decrease in the temperature at the melt pool centre by feeding directly into it, as detected in [28], but it also further shields the substrate from the arc, reducing the effect of the arc pressure and the droplet impact force from the electrode metal transfer [29]. It is important to mention that when using high H WFSs in a GMA process, the arc pressure should be considerably higher [29,30] than in GTA or PTA processes outside the keyhole range, as seen by the predominant finger-type penetration profile seen in both methods, shown in Figure 5 for the APCM and in Figure 8 for the TSCM. However, the shielding effect largely contributes to reducing this finger-type penetration profile. Still, it is possible to accomplish lower penetration depth values in the APCM because the arc power and pressure also reduce with the decrease in H WFS.
On top of the reduction in the arc pressure, the melt pool temperature gradient should be reduced as well because the temperature at the melt pool centre, below the electrode and the arc, reduces with the cold wire feeding and its shielding effect, and this is precisely the point where the higher melt pool temperatures are usually registered in any arc-based process [28,29,31,32]. The melt pool temperature gradient greatly influences the Marangoni shear force, which is the main driving force for the melt pool flow in the YZ plane, according to [28,32]. While that is the case for low arc pressures in GTA and PTA depositions, in GMA-based processes using high WFSs that can be different, the arc pressure and the electromagnetic force might gain increased importance in the melt pool flow.
From a R ratio of 0.5 until 1, the situation seen in Figure 10c happens both in the APCM (from 591.9 J/mm to 336.7 J/mm excluding the last point of 258.9 J/mm) and in the TSCM (from 566.4 J/mm to 351.8 J/mm). Both the Marangoni shear force and the arc pressure have their effects reduced due to the reduction in the melt pool temperature gradient and the increased shielding effect, respectively, created by the increase in the C WFS and the gradual arc pinning into the cold wire, as previously explained [4]. Simultaneously, the overall melt pool temperature should decrease, too, due to the increased cooling rate created by the reduction in the arc power for the APCM and the increment of the TS for the TSCM [29]. All this should create a balance between the main forces affecting the melt pool flow during this period, which, along with the constant material feed rate obtained in both methods, leads to the stabilisation of the bead geometry seen both in Figure 7a for the APCM, with an almost constant bead width, height, and contact angle (except on the last point where the R ratio is greater than 1), and in Figure 9a for the TSCM, with a relatively stable bead width, height, and contact angle as well, precisely from an R ratio of 0.5 until 1.
At the last point in the APCM (258.9 J/mm), the R ratio is above 1, leading to the situation in Figure 10d. There, the C WFS becomes too high for the diminished arc power (H WFS), and the cold wire cannot be completely melted solely by the arc energy anymore, even though the arc is totally pinned to the cold wire. Therefore, the cold wire starts touching the back of the melt pool and absorbs more energy from it. This even colder and more viscous melt pool explains the bead height and contact angle increase at this last point of Figure 7a, also representing a decrease in wettability and width. It is relevant to mention that the contact angle should not reach really high values, such as 70° or above, because the low wetting behaviour can cause lack of fusion problems in the deposition of beads parallel and/or on top of each other. At this last point of the APCM, the penetration depth is also significantly reduced due to the extreme shielding behaviour of the cold wire. Therefore, the penetration depth is as low as 0.96 mm for the APCM in Figure 7a, while for the TSCM, it is still 1.82 mm at its last point (351.8 J/mm) seen in Figure 9a.
However, one of the disadvantages of the APCM, compared to the TSCM, could be the possibility of reaching lower H WFS and transitioning away from a spray transfer regime to globular or short circuit transfer modes, which ultimately could even lead to process stability problems [4].
Compared to the APCM, one of the disadvantages of the TSCM is its dependency on the TS of the robot to accomplish the control because any lack of accuracy in the hardware or problems in the path planning software could cause errors in the deposition. For example, there is a need to avoid sharp corners during deposition because those are also affected by a robot’s TS approximation [33,34].
As the R ratio approaches 1 in the TSCM (351.8 J/mm), the energy absorbed from the arc plateaus, and the energy absorbed from the melt pool increases because the arc energy starts to be insufficient to melt the extremely high C WFS. The transition takes longer in this method because the arc power and length stay the same and are pretty high from the beginning. The HAZ also plateaus, as seen in the last three marks (from 424.3 J/mm to 351.8 J/mm) in Figure 9b, meaning that the arc energy absorbed by the cold wire and its shielding effect had more influence over the HAZ than the TS, because the TS is still increasing at this point.
A lower HAZ implies reduced thermal loss through conduction and reheating of the pre-existent material using CWGMA. This should also reduce residual stresses, as presented in [15,35], which are accumulated while building large metal parts and can lead to potential problems such as distortion or cracking [36].
The lower values of dilution and remelting, below 10%, when comparing both methods, Figure 7c and Figure 9c, can be explained by the lower obtained using the APCM at the last point of each method in Figure 6. This also shows that the arc power contribution to the energy input to the substrate is higher than the travel speed at the H WFS and TS parameter range used in these experiments. The low dilution and remelting values are highly appreciated for additive manufacturing [17,21] and cladding [16] applications.
In the future, the temperature of the metal transfer from the electrode (hot wire) and the cold wire should be studied, as it was conducted for GMA in [26], to know if those temperatures are similar. Simultaneously, the melt pool temperature should be monitored as well. From these data, it should be possible to evaluate how the temperature of the reinforcement part of the melt pool is affected by the metal transfer from the hot and cold wires. A simulation of the CWGMA process with the combination of the wire feeding model of both the hot wire, as seen in [31], and the cold wire [28] will also help to fully understand the phenomenon.
This work focused solely on the effect of the two methods in the bead geometry control through a broad thermal range. However, it is acknowledged that the methods’ effect on the microstructure and mechanical properties is also relevant, and this is planned as future work. Meanwhile, the effect of the cold wire addition in the GMA process, without using any of the process control methods presented in this work, can be seen in [19].
5. Demonstrator
The demonstrator part shown in Figure 11, Figure 12 and Figure 13 was built using CWGMA AM. The skin and core building strategy [19] was used to enhance the high productivity capabilities of CWGMA without belittling the appearance of the wall.

Figure 11.
Top view showing the boundary between the core and the skin during the build-up of the demonstrator.
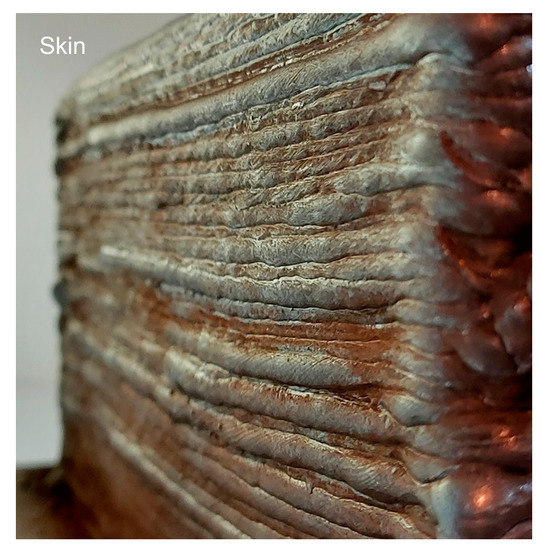
Figure 12.
Side view of the demonstrator showing the lower surface roughness of the skin.
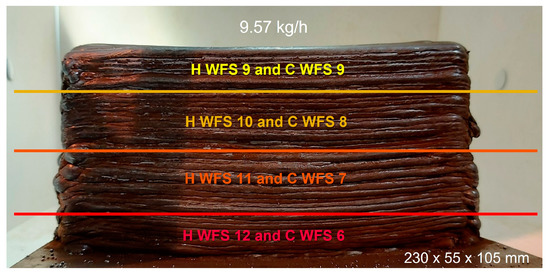
Figure 13.
Demonstrator part built using CWGMA AM and the APCM.
For the skin, the external layers that act as a support structure for the core, as shown in Figure 11, a lower deposition rate of 6.38 kg h−1 (H WFS of 8 and C WFS of 4 m min−1) was used to reduce the surface roughness of the build, as seen in Figure 12.
The core used 9.57 kg h−1 and the APCM, starting with an H WFS of 12 and C WFS of 6 m min−1 and finishing with 9 m min−1 on both, shown in Figure 13, to control the thermal input while building up and reducing the energy accumulation. The size and accuracy of the beads were also controlled during the deposition, demonstrating the process control methods’ feasibility in the thermal and geometry aspects described in this work.
The accomplished deposition rate is the highest of all single energy sources used in WAAM and is even higher than the 9.5 kg h−1 achieved with two electrodes in tandem GMA in WAAM [37].
6. Conclusions
Two innovative process control methods, arc power and travel speed control, were introduced using CWGMA AM, and they allow for the following:
- Decoupling of the material feed rate from the energy input, maintaining a constant reinforcement area during a broad range of thermal control;
- Accurate geometry control, especially in the bead height—with most of the changes being lower than 1 mm;
- Reduction in all the outputs related to the energy input to the pre-existent material , ultimately achieving dilution rates below 10%;
- Increase in productivity by achieving high deposition rates and a possible increase in TS;
- Feasible thermal and geometry control, as demonstrated in building a thick part using a high deposition rate of 9.57 kg h−1 with CWGMA AM while keeping a good surface finish, dimensional accuracy, and reduction in the energy input and accumulation during the deposition.
7. Patents
The work reported in this manuscript contributed to the patent with publication number GB2601784—Processes for additive manufacturing and cladding.
Supplementary Materials
The following supporting information can be downloaded at https://www.mdpi.com/article/10.3390/met13081334/s1, Video S1: H12C2; Video S2: H12C6; Video S3: H9C9; Video S4: H8C10.
Author Contributions
Conceptualization, J.B.B., J.D. and S.W.; methodology, J.B.B., C.W., J.D. and S.W.; validation, J.B.B. and C.W.; formal analysis, J.B.B., C.W. and J.D.; investigation, J.B.B.; resources, J.B.B.; data curation, J.B.B.; writing—original draft preparation, J.B.B.; writing—review and editing, J.B.B., C.W., J.D. and S.W.; visualization, J.B.B.; supervision, J.D. and S.W.; project administration, J.B.B., J.D. and S.W.; funding acquisition, J.B.B. and S.W. All authors have read and agreed to the published version of the manuscript.
Funding
This work was supported by the NEWAM programme under EPRSC Grant No. EP/R027218/1 and the HPWAAM programme under Innovate UK project reference 53610. And the APC was funded by the Open Access Team, Kings Norton Library, Cranfield University.
Data Availability Statement
The data supporting this study’s findings will be available in the Cranfield University repository at https://doi.org/10.17862/cranfield.rd.23587038 (accessed on 24 July 2023) following a 6-month embargo from the publication date.
Acknowledgments
João Bento would like to thank the Welding and Additive Manufacturing Centre at Cranfield University, where this research was conducted. The authors also would like to express their gratitude to Nielsen Flemming, John Thrower, Nishar Shah, and Steve Pope for the experimental technical support.
Conflicts of Interest
The authors reported no potential conflict of interest. The funders had no role in the design of the study; in the collection, analyses, or interpretation of data; in the writing of the manuscript; or in the decision to publish the results.
References
- BS EN ISO/ASTM 52900:2021; ISO/ASTM (International Organization for Standardization/American Society for Testing and Materials). Additive Manufacturing—General Principles—Fundamentals and Vocabulary. British Standards Institution (BSI): London, UK, 2022.
- Williams, S.W.; Martina, F.; Addison, A.C.; Ding, J.; Pardal, G.; Colegrove, P. Wire + Arc Additive Manufacturing. Mater. Sci. Technol. 2016, 32, 641–647. [Google Scholar] [CrossRef]
- Bento, J.B.; Lopez, A.; Pires, I.; Quintino, L.; Santos, T.G. Non-Destructive Testing for Wire + Arc Additive Manufacturing of Aluminium Parts. Addit. Manuf. 2019, 29, 100782. [Google Scholar] [CrossRef]
- Ribeiro, R.A.; dos Santos, E.B.F.; Assunção, P.D.C.; Braga, E.M.; Gerlich, A.P. Cold Wire Gas Metal Arc Welding Droplet Transfer and Geometry. Weld. J. 2019, 98, 135–149. [Google Scholar] [CrossRef]
- Dupont, J.N.; Marder, A.R. Thermal Efficiency of Arc Welding Processes. Weld. Res. Suppl. 1995, 74, 406–416. [Google Scholar]
- Welding Handbook Committee. Welding Handbook, 9th ed.; Jenney, C.L., O’Brien, A., Eds.; American Welding Society: Miami, FL, USA, 1987; Volume 1, ISBN 0871716577. [Google Scholar]
- ISO/TR 17671-1:2002(E); Welding—Recommendations for Welding of Metallic Materials—Part 1: General Guidance for Arc Welding. ISO (International Organization for Standardization): Geneva, Switzerland, 2002.
- Cunningham, C.R.; Flynn, J.M.; Shokrani, A.; Dhokia, V.; Newman, S.T. Invited Review Article: Strategies and Processes for High Quality Wire Arc Additive Manufacturing. Addit. Manuf. 2018, 22, 672–686. [Google Scholar] [CrossRef]
- Li, K.H.; Chen, J.S.; Zhang, Y.M. Double-Electrode GMAW Process and Control. Weld. J. 2007, 86, 231s–237s. [Google Scholar]
- Huang, J.; Yuan, W.; Yu, S.; Zhang, L.; Yu, X.; Fan, D. Droplet Transfer Behavior in Bypass-Coupled Wire Arc Additive Manufacturing. J. Manuf. Process. 2020, 49, 397–412. [Google Scholar] [CrossRef]
- Rodrigues, T.A.; Duarte, V.R.; Miranda, R.M.; Santos, T.G.; Oliveira, J.P. Ultracold-Wire and Arc Additive Manufacturing (UC-WAAM). J. Mater. Process. Technol. 2021, 296, 117196. [Google Scholar] [CrossRef]
- Li, K.H.; Zhang, Y.M. Consumable Double-Electrode GMAW—Part 1: The Process. Weld. J. 2008, 87, 11–17. [Google Scholar]
- Yang, D.; He, C.; Zhang, G. Forming Characteristics of Thin-Wall Steel Parts by Double Electrode GMAW Based Additive Manufacturing. J. Mater. Process. Technol. 2016, 227, 153–160. [Google Scholar] [CrossRef]
- Chen, S.J.; Zhang, L.; Wang, X.P.; Wang, J. Stability of the Cross-Arc Process—A Preliminary Study. Weld. J. 2015, 94, 158–168. [Google Scholar]
- Costa, E.S.; Assunção, P.D.C.; Dos Santos, E.B.F.; Feio, L.G.; Bittencourt, M.S.Q.; Braga, E.M. Residual Stresses in Cold-Wire Gas Metal Arc Welding. Sci. Technol. Weld. Join. 2017, 22, 706–713. [Google Scholar] [CrossRef]
- da Mota, C.A.M.; do Nascimento, A.S.; Garcia, D.N.; da Silva, D.A.S.; Teixeira, F.R.; Ferraresi, V.A. Nickel Overlay Deposited by MIG Welding and Cold Wire MIG Welding. Weld. Int. 2018, 32, 588–598. [Google Scholar] [CrossRef]
- Dirisu, P. Development of Wire + Arc Additive Manufacture for Marine Application. Ph.D. Thesis, Cranfield University, Cranfield, UK, 2019. [Google Scholar]
- Han, Q.; Gao, J.; Han, C.; Zhang, G.; Li, Y. Experimental Investigation on Improving the Deposition Rate of Gas Metal Arc-Based Additive Manufacturing by Auxiliary Wire Feeding Method. Weld. World 2021, 65, 35–45. [Google Scholar] [CrossRef]
- Wang, C.; Wang, J.; Bento, J.; Ding, J.; Pardal, G.; Chen, G.; Qin, J.; Suder, W.; Williams, S. A Novel Cold Wire Gas Metal Arc (CW-GMA) Process for High Productivity Additive Manufacturing. Addit. Manuf. 2023, 73, 103681. [Google Scholar] [CrossRef]
- Khaudair, H.J.; Ugla, A.A.; Almusawi, A.R.J. Effect of Double Wire Cold Feed on Characteristics of Additive Manufactured Components. J. Mater. Eng. Perform. 2021, 30, 6801–6807. [Google Scholar] [CrossRef]
- Liu, G.; Xiong, J. External Filler Wire Based GMA-AM Process of 2219 Aluminum Alloy. Mater. Manuf. Process. 2020, 35, 1268–1277. [Google Scholar] [CrossRef]
- Wang, C.; Suder, W.; Ding, J.; Williams, S. Wire Based Plasma Arc and Laser Hybrid Additive Manufacture of Ti-6Al-4V. J. Mater. Process. Technol. 2021, 293, 117080. [Google Scholar] [CrossRef]
- 23. BS EN 10277:2018; CEN (European Commettee for Standardization). Bright Steel Products—Technical Delivery Conditions. British Standards Institution (BSI): Hong Kong, 2018.
- Pepe, N.; Egerland, S.; Colegrove, P.A.; Yapp, D.; Leonhartsberger, A.; Scotti, A. Measuring the Process Efficiency of Controlled Gas Metal Arc Welding Processes. Sci. Technol. Weld. Join. 2011, 16, 412–417. [Google Scholar] [CrossRef]
- Ribeiro, R.A.; Assunção, P.D.C.; Braga, E.M.; Gerlich, A.P. Welding Thermal Efficiency in Cold Wire Gas Metal Arc Welding. Weld. World 2021, 65, 1079–1095. [Google Scholar] [CrossRef]
- Soderstrom, E.J.; Scott, K.M.; Mendez, P.F. Calorimetric Measurement of Droplet Temperature in GMAW. Weld. J. 2011, 90, 77–84. [Google Scholar]
- Chen, Q.; Chen, J.; Lu, S.; Zhang, Y.; Wu, C. Study of High-Speed GMAW Assisted by Compound External Magnetic Field. Weld. World 2020, 64, 885–901. [Google Scholar] [CrossRef]
- Chen, X.; Wang, C.; Ding, J.; Bridgeman, P.; Williams, S. A Three-Dimensional Wire-Feeding Model for Heat and Metal Transfer, Fluid Flow, and Bead Shape in Wire Plasma Arc Additive Manufacturing. J. Manuf. Process. 2022, 83, 300–312. [Google Scholar] [CrossRef]
- Ou, W.; Mukherjee, T.; Knapp, G.L.; Wei, Y.; DebRoy, T. Fusion Zone Geometries, Cooling Rates and Solidification Parameters during Wire Arc Additive Manufacturing. Int. J. Heat Mass Transf. 2018, 127, 1084–1094. [Google Scholar] [CrossRef]
- Bunaziv, I.; Aune, R.; Olden, V.; Akselsen, O.M. Dry Hyperbaric Welding of HSLA Steel up to 35 Bar Ambient Pressure with CMT Arc Mode. Int. J. Adv. Manuf. Technol. 2019, 105, 2659–2676. [Google Scholar] [CrossRef]
- Cadiou, S.; Courtois, M.; Carin, M.; Berckmans, W.; Le Masson, P. 3D Heat Transfer, Fluid Flow and Electromagnetic Model for Cold Metal Transfer Wire Arc Additive Manufacturing (Cmt-Waam). Addit. Manuf. 2020, 36, 101541. [Google Scholar] [CrossRef]
- Bai, X.; Colegrove, P.; Ding, J.; Zhou, X.; Diao, C.; Bridgeman, P.; roman Hönnige, J.; Zhang, H.; Williams, S. Numerical Analysis of Heat Transfer and Fluid Flow in Multilayer Deposition of PAW-Based Wire and Arc Additive Manufacturing. Int. J. Heat Mass Transf. 2018, 124, 504–516. [Google Scholar] [CrossRef]
- Michel, F.; Lockett, H.; Ding, J.; Martina, F.; Marinelli, G.; Williams, S. A Modular Path Planning Solution for Wire + Arc Additive Manufacturing. Robot. Comput. Integr. Manuf. 2019, 60, 1–11. [Google Scholar] [CrossRef]
- Jiang, J.; Ma, Y. Path Planning Strategies to Optimize Accuracy, Quality, Build Time and Material Use in Additive Manufacturing: A Review. Micromachines 2020, 11, 633. [Google Scholar] [CrossRef]
- Wu, Q.; Mukherjee, T.; De, A.; DebRoy, T. Residual Stresses in Wire-Arc Additive Manufacturing—Hierarchy of Influential Variables. Addit. Manuf. 2020, 35, 101355. [Google Scholar] [CrossRef]
- Ahmad, B.; Zhang, X.; Guo, H.; Fitzpatrick, M.E.; Neto, L.M.S.C.; Williams, S. Influence of Deposition Strategies on Residual Stress in Wire + Arc Additive Manufactured Titanium Ti-6Al-4V. Metals 2022, 12, 253. [Google Scholar] [CrossRef]
- Martina, F.; Ding, J.; Williams, S.; Caballero, A.; Pardal, G.; Quintino, L. Tandem Metal Inert Gas Process for High Productivity Wire Arc Additive Manufacturing in Stainless Steel. Addit. Manuf. 2019, 25, 545–550. [Google Scholar] [CrossRef]
Disclaimer/Publisher’s Note: The statements, opinions and data contained in all publications are solely those of the individual author(s) and contributor(s) and not of MDPI and/or the editor(s). MDPI and/or the editor(s) disclaim responsibility for any injury to people or property resulting from any ideas, methods, instructions or products referred to in the content. |
© 2023 by the authors. Licensee MDPI, Basel, Switzerland. This article is an open access article distributed under the terms and conditions of the Creative Commons Attribution (CC BY) license (https://creativecommons.org/licenses/by/4.0/).