Article

Numerical Simulations and Experimental Verification of T-Structure Welding Deformation Using the Step-by-Step Loading Inherent Strain Method

1
National Key Laboratory of Science and Technology on Underwater Vehicle, Harbin Engineering University, Harbin 150001, China
2
College of Light Industry, Harbin University of Commerce, Harbin 150001, China
*
Author to whom correspondence should be addressed.
Metals 2023, 13(7), 1312; https://doi.org/10.3390/met13071312
Submission received: 15 June 2023 / Revised: 10 July 2023 / Accepted: 13 July 2023 / Published: 21 July 2023
(This article belongs to the Section Welding and Joining)

Abstract

:
The existing inherent strain method is improved in this paper to address the shortcomings of the existing inherent strain method in the process of loading inherent strain. Unlike the traditional inherent strain method, which uses one-step loading inherent strain for each weld seam for one-time elastic calculation, the improved inherent strain method uses step-by-step loading inherent strain for each weld seam for multiple elastic calculations to predict welding deformation. The step-by-step loading inherent strain method (SBS-ISM) is more in line with the actual welding deformation generation process. Firstly, the local finite element model of the T-joint was used to analyze the welding deformation and extract the inherent strain by using the thermal elastic–plastic finite element method (TEP-FEM). Subsequently, the one-step loading inherent strain method (OS-ISM) and the step-by-step loading inherent strain method (SBS-ISM) were used to predict the welding deformation for the same local finite element model, respectively. The comparative results showed that the trend and magnitude of welding deformation calculated using SBS-ISM was much closer to those calculated using TEP-FEM. The OS-ISM and SBS-ISM were used to predict the welding deformation of the backward centrifugal fan impeller under different welding sequences, respectively. By comparing the welding deformation results calculated using the two inherent strain methods with the experimental results, it was demonstrated that the step-by-step loading inherent strain method (SBS-ISM) provides more accurate and reliable predictions of welding deformation for large and complex thin-walled T-shaped structural components compared to the one-step loading inherent strain method (OS-ISM).

1. Introduce

Welding as a commonly used assembly method for connecting steel plates is widely used in shipbuilding, aerospace, steel bridges, and fan impellers that relies on welded connections for assembly [1]. The welding process leads to inevitable welding deformation and residual stress in structural parts due to local uneven heat input. The presence of welding deformation and residual stresses can seriously affect the accuracy of the installation of the structure, and excessive distortion can significantly reduce the load-carrying capacity of the structure [2].
Currently, with the rapid development of computer hardware and related professional welding software, the traditional welding production model from “theory–experiment–production” to the modern “theory–computer simulation–production”, this production model greatly improves the scientific level of the welding process, saving a lot of human and material resources required for experiments [3]. The current numerical simulation of welding deformation is based on two main methods: the thermal elastic–plastic finite element method (TEP-FEM) and inherent strain method (ISM) [4,5]. The TEP-FEM was first explored by Professor Ueda at Osaka University in Japan to solve a practical problem. The method was applied to two-dimensional and three-dimensional models to predict the welding stress–strain fields at each moment of the welding process [4]. Since then, more welding researchers have conducted several studies based on the TEP-FEM theory, all with good results. Based on ABAQUS software, Deng and Murakawa [6] applied thermal–mechanical uncoupled three-dimensional (3D) and two-dimensional (2D) finite element models for simulating temperature fields and welding residual stress. Experiments were also carried out to verify the validity of the proposed numerical model. The calculated results of the 3D and 2D models were in good agreement with the experimental measurements. YE et al. [7] developed a sequentially coupled TEP-FEM based on the ABAQUS subroutine for simulating the welding temperature field, residual stress distribution and post-welding deformation in multi-pass butt joints of SUS304 austenitic stainless steel. Rong et al. [8] used the TEP-FEM to analyze the welding deformation and residual stress in the basic T-joint and verified them experimentally. A relevant composite heat source model form was proposed to simulate the heat flux of laser and arc power in the welding zone, and the experimental results were in good agreement with the simulation results. Bajpei et al. [9] used the TEP-FEM to study the buckling of thin plates, considering heat dissipation due to heat conduction, heat convection and heat radiation. Residual stress and deformation tests on welded specimens were carried out by using X-ray diffractometry and CMM. The results showed that the experimental results agreed well with the numerical simulations. Meanwhile, numerous scholars have conducted extensive research on the influence of joint geometry on heat transfer behavior and process stability. Hu and Tsai [10] conducted a study that analyzed the dynamic process of groove filling and the resulting weld pool fluid flow in the gas metal arc welding of thick metals with a V groove. The research findings revealed that the presence of the groove promotes smoother flow within the weld pool, leading to inadequate mixing between the filler metal and the base metal. Ebrahimi et al. [11]. proposed a computational model that aims to describe the behavior of the melt pool in root-pass gas metal arc welding (GMAW). This model allows for the visualization of the complex heat and fluid flow fields in different groove-shaped weld pools. Experimental validation confirmed the robustness of the computational model.
The TEP-FEM theoretically allows numerical simulations to be carried out on large and complex structural components, but the results and time spent are often unsatisfactory due to the limitations of computer resources. In response, the concept of inherent strain was introduced by Ueda et al. [12,13], who stated that residual welding stress and deformation arising during the welding process were caused by inherent strain. For large and complex welded structures, only the inherent strain needed to be calculated and then residual stress and welding distortion can be obtained using a one-time linear elastic calculation. Since then, many researchers have used inherent strains to predict welding deformations and residual stresses. Deng et al. [14] derived the inherent deformations of different typical welded joints through the TEP-FEM. Based on the obtained inherent deformations, the proposed elastic finite element method is used to predict the welding deformation of large welded structures. The effect of the initial gap on the welding deformation was studied and the experimental results verify the effectiveness of the proposed elastic finite element method. Thereafter, Deng and Murakawa [15,16] obtained the inherent strains for T-joints and butt joints, respectively, based on TEP-FEM, and loaded the obtained inherent strains onto the large structure to be predicted for a one-time elastic calculation. Comparison of the elastic finite element simulation results with the TEP-FEM prediction results verifies that the ISM can effectively predict welding deformation. Sulaiman and Manurung et al. [17,18] predicted the deformations caused by welding of mild steel with butts and T-joints based on ISM for plate thicknesses of 4 mm, 6 mm and 9 mm, respectively, and were able to estimate the deformations caused by welding within an acceptable accuracy by comparing the simulation results with the experimental results. Shen et al. [19] employed the inherent strain method in conjunction with an artificial immune algorithm to optimize the double-sided welding sequence for small assemblies in ships. Experimental validation demonstrated the feasibility and high efficiency of the immune clonal algorithm in double-sided welding sequence optimization. Chino et al. [20] employed the inherent strain method for the fast and efficient prediction of welding deformation in an automotive component with 23 resistance spot welds, demonstrating good reliability and accuracy compared to the actual measurement.
The ISM requires less computer resources and requires less computational time than the TEP-FEM because it neglects heat conduction as well as radiative and convective heat dissipation. Therefore, the ISM is a more practical and efficient option for predicting large and complex welded structural components. When using ISM to predict welding deformation in large structural component, the inherent strain of each joint should be predetermined based on the type of joint, plate thickness and welding process parameters of the large structural component [21]. Currently, inherent strains are often obtained using experimental measurements and based on the established inherent deformation database as well as by calculating the inherent strain of a typical welded joint using the TEP-FEM [22,23]. In this study, the TEP-FEM was chosen to obtain the inherent strain.
The existing ISM is a one-step elastic calculation of the inherent strain loaded into the entire weld seam to obtain the welding deformation, which is referred to in this paper as the one-step loaded inherent strain method or simply OS-ISM [15,16]. According to inherent strain theory, inherent strain can be equated to residual plastic strain. However, in the actual welding process, the welding heat source moves forward at a certain speed and the molten pool at the end of the heat source is subjected to thermal convection and thermal radiation and gradually solidifies and shrinks along the entire weld, i.e., the residual plastic strain is generated gradually. As a result, the existing inherent strain methods do not take into account the motion of the heat source during the prediction of the welding deformation, which is the gradual generation of the inherent strain, resulting in large errors between the predicted welding deformation and the actual welding deformation generated. The existing inherent strain method is improved in this paper to address the shortcomings of the existing inherent strain method in the process of loading inherent strain. Unlike the OS-ISM of loading inherent strain, the improved inherent strain method uses step-by-step loading inherent strain on each weld seam to perform the calculation, which is referred to in this study as the step-by-step loading inherent strain method or SBS-ISM for short.
To verify the accuracy and reliability of the SBS-ISM, the method was used to predict the post-welding deformation of the backward centrifugal fan impeller. The backward centrifugal fan impeller is assembled and welded from Q345D steel plates and its components include a wheel disc, eight blades and a wheel cap, with the dimensions shown in Figure 1. The plate thickness is 6 mm for the wheel disc and cap, and 3 mm for the blades. The joints are all welded in a single pass on both sides in the form of a T-joint without grooves, with a total of 32 weld seams and a foot size of 3 mm × 3 mm, and the welding method is MAG. Backward centrifugal fan impellers are formed from several thin-walled parts by welding, with thin sheets and a large number of weld seams, which leads to welding deformation that is not clearly located before manufacture. Therefore, when performing welding, it would help to improve the structural design and welding process if its post-welding residual deformation could be accurately predicted. According to relevant research results, for multi-pass welded structural parts, optimizing the welding sequence in the welding manufacturing process can effectively reduce welding distortion [24]. Thus, in the welding process, not only we should choose suitable welding parameters to ensure the welding quality of each weld seam, but also the welding sequence and welding direction of each weld seam should be strictly controlled, so as to minimize the welding deformation and improve product quality.
In this study, the TEP-FEM was first used to numerically simulate the welding deformation of the local finite element model of the fan impeller and to obtain the residual plastic strain, i.e., the inherent strain. Subsequently, OS-ISM and SBS-ISM were used to calculate the welding deformation of the same local finite element model, respectively. The two different methods of loading the inherent strain were compared with the trend and size of the welding deformation calculated by TEP-FEM to establish the corresponding numerical simulation method. Finally, numerical simulations and experimental verification of the welding deformation generated by different welding sequences of the backward centrifugal fan impeller were carried out using OS-ISM and SBS-ISM, respectively.

2. Welding Deformation Prediction Methods and Theory

2.1. Thermal Elastic–Plastic Finite Element Method (TEP-FEM)

The TEP-FEM tracks the entire welding process, shows the welding speed in advance and calculates the melt pool at each moment. The stress–strain increments due to temperature changes at each moment can be calculated and accumulated to obtain the residual stress and deformation after welding. It follows that the TEP-FEM can be used to analyze the transient stress–strain state at any time during the welding process. Its calculation results are similar to the actual welding process, which can simulate the welding process more realistically, but the hardware requirements for the computer are relatively high and the calculation time is long, which is usually suitable for the prediction of welding deformation of small but not complex welded structural parts [25].

2.1.1. Thermal Analysis

The thermal elastic–plastic finite element theory calculates the transient temperature field in the welding process based on Fourier’s law and energy conservation. A welding transient heat transfer analysis is performed in the finite element model, followed by solving the transient heat transfer control equations to obtain the temperature history of each node during the welding process. The numerical model of the welding temperature field is a typical nonlinear transient heat transfer problem. The principal Equation (1) is as follows [26,27]:
ρ T c p T T t = x k ( T ) T x + y k ( T ) T y + z k ( T ) T z + Q
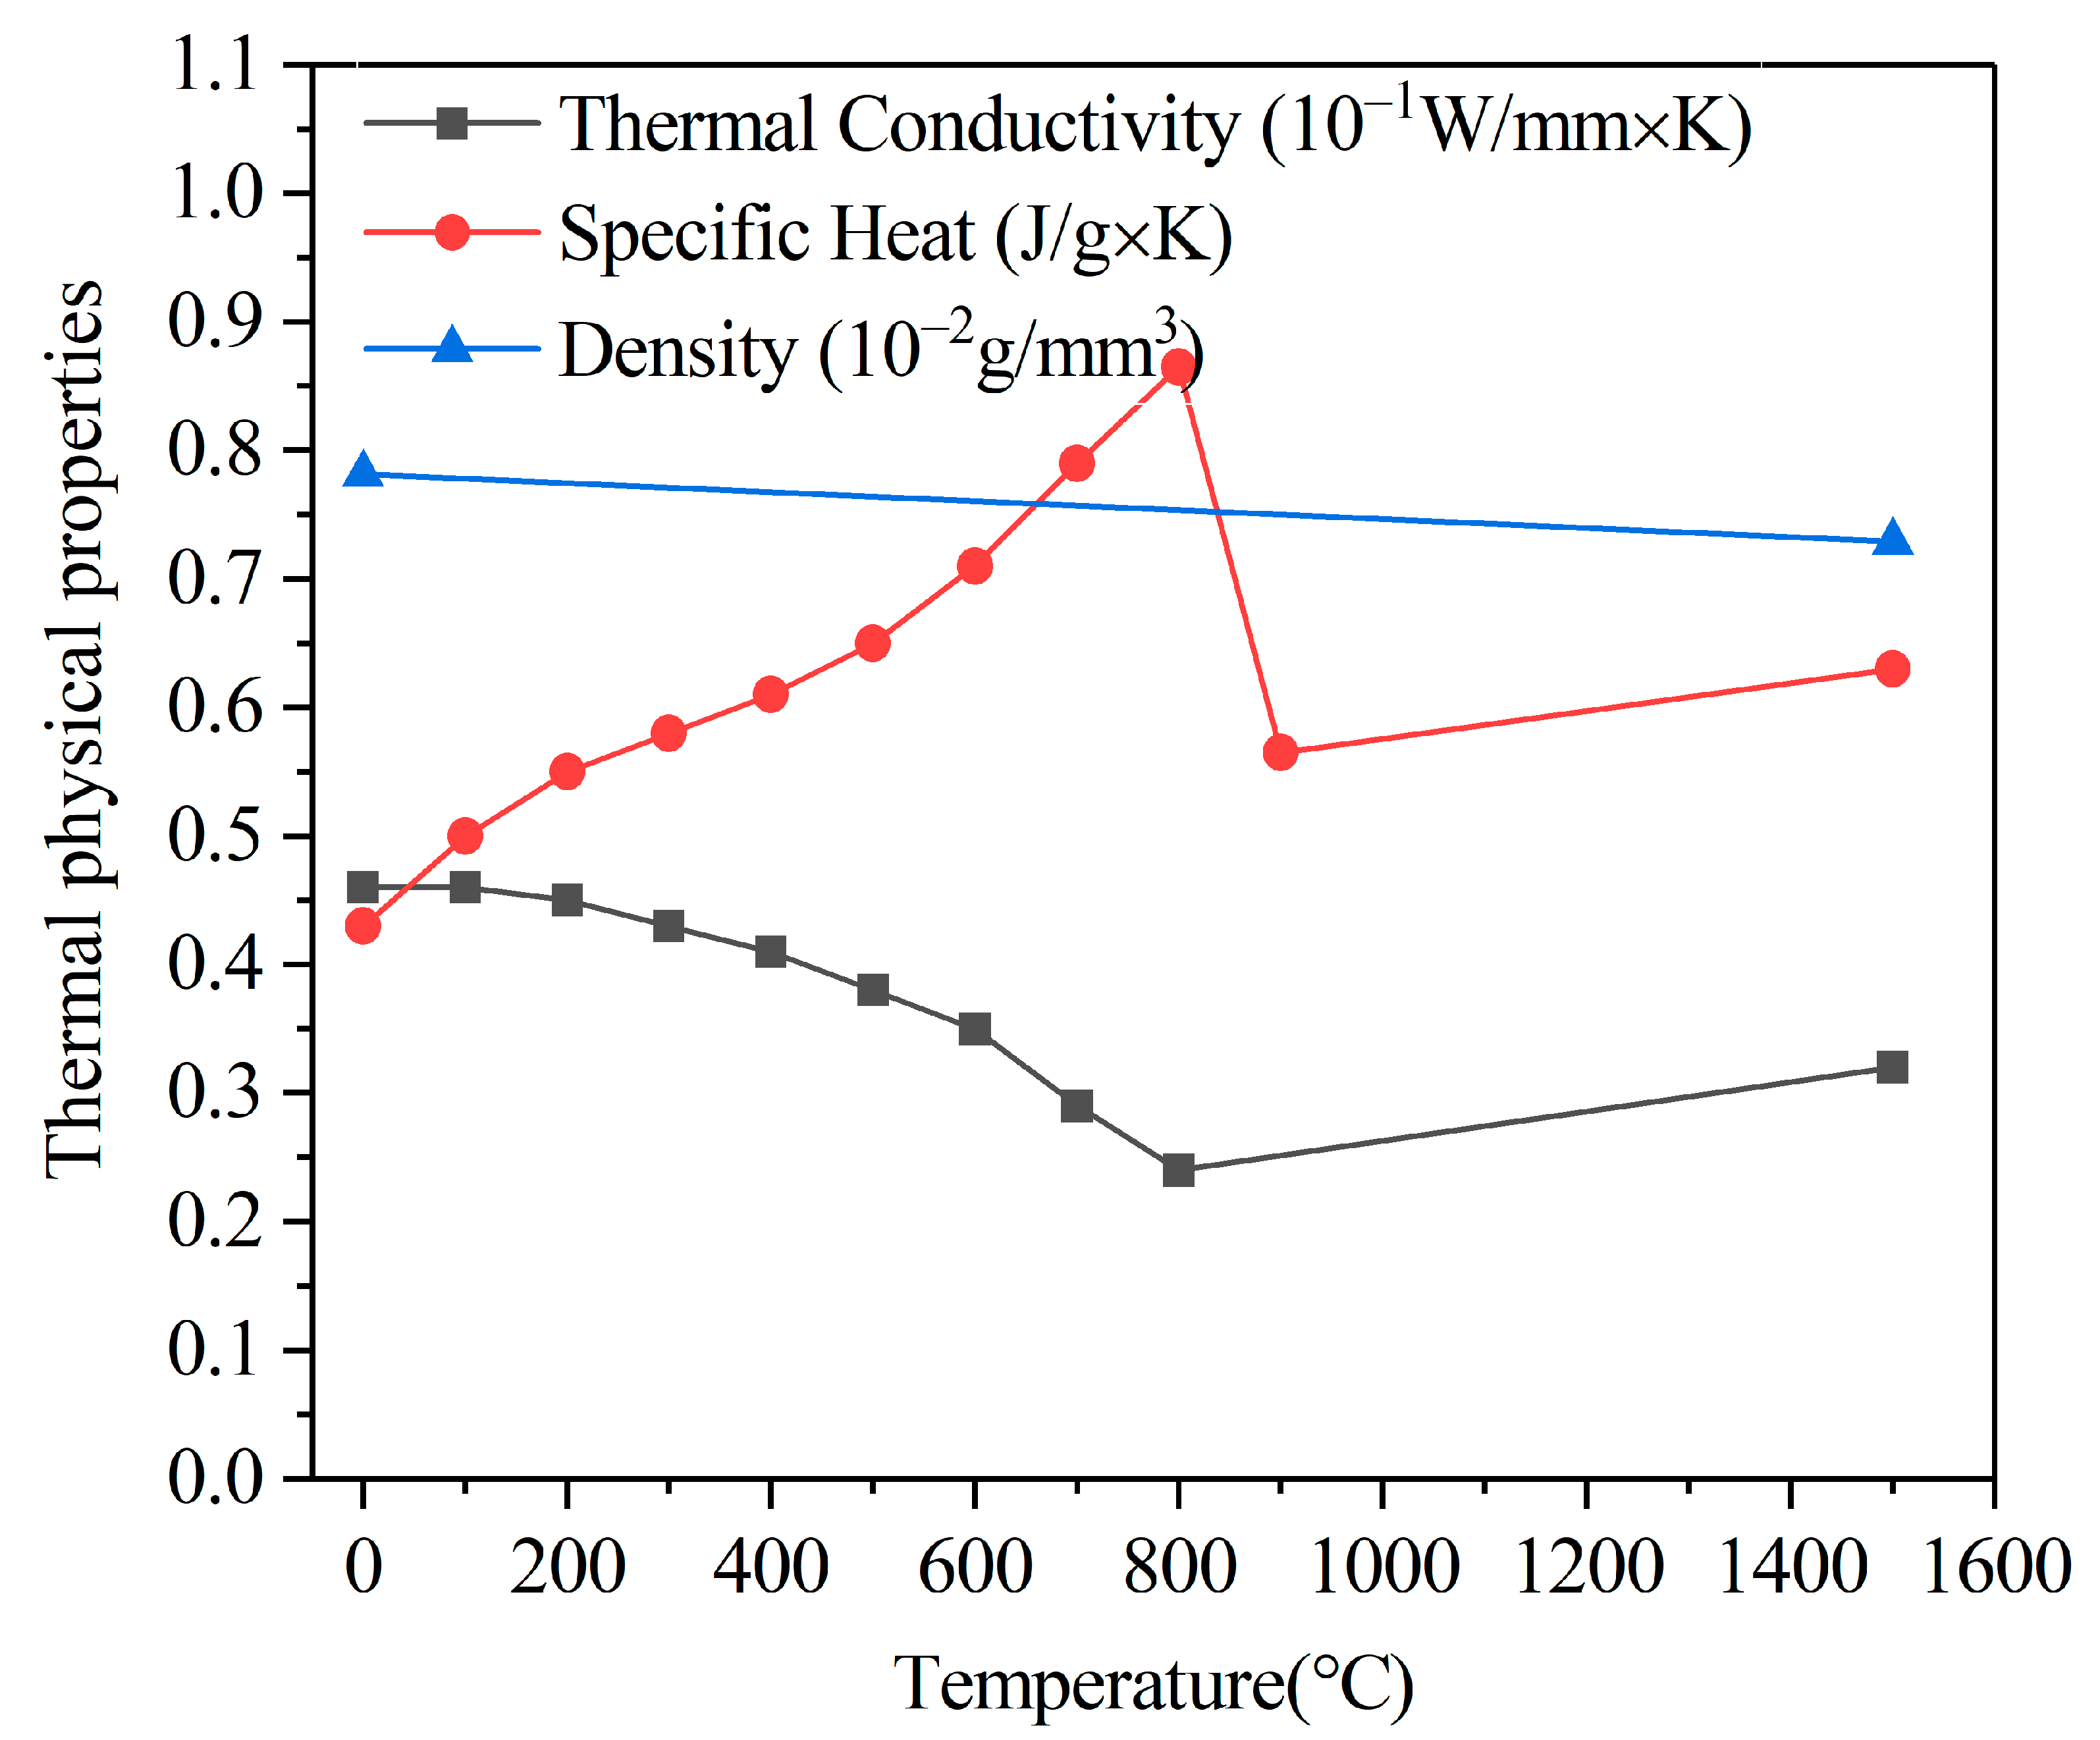
Here ρ ( T ) , c p ( T ) and k ( T ) are the temperature-dependent density, specific heat capacity and thermal conductivity, respectively.   Q is the internal heat source heating volume heat flow density (W/m−3). The temperature-dependent thermal physical properties of the Q345D material are shown in Figure 2 [28]. In this study, it was assumed that the base material and the filler material were considered to be the same material with identical thermal physical properties during the numerical simulation. Therefore, they were defined to have the same material properties in the finite element model.
The accuracy of the simulation result depends on the correct choice of the heat source model, material properties and heat dissipation surface, where the choice of the heat source model directly affects the distribution of the weld pool. Current models for weld pool distribution include 2D Gaussian heat source, 3D Gaussian heat source and double ellipsoidal heat source models [29,30]. Since the robotic welding system in this study used a MAG welding process, the double ellipsoidal heat source model proposed by Goldak et al. [31,32] is more in line with its actual melt pool situation, whose physical model is shown in Figure 3.
The energy distribution of the double ellipsoidal heat source model consists of the superposition of two semi-ellipsoidal heat inputs of different sizes at the front and rear, with the following expressions for the heat flow distribution function [32]:
Heat flow distribution in the first half of the ellipsoid ( y 0 ):
Q f x , y , z , t = 6 3 f f η U I a f b c π π exp 3 x 2 a f 2 3 y + v t 2 b 2 3 z 2 c 2
Heat flow distribution in the latter half of the ellipsoid ( y < 0 ):
Q r x , y , z , t = 6 3 f r η U I a r b c π π exp 3 x 2 a r 2 3 y + v t 2 b 2 3 z 2 c 2
where η   is the heat source efficiency, taken as 0.8; U   is the voltage during welding (V); A is the current during welding (A); f f and f r are the heat distribution functions of two different half ellipsoids at the front and rear, and f f + f r = 2 ; a f and a r are the lengths of the front and rear half ellipsoids, respectively; b is half of the width of the ellipsoid; c is the depth of the ellipsoid; v is the traveling speed. The parameters of the corrected double ellipsoidal heat source model for this study are shown in Table 1.
The thermal boundary conditions often imposed in TEP-FEM simulations of welding deformation are heat losses due to heat exchange between the welded component and the heat source through thermal convection and thermal radiation to the surrounding environment. Newton’s law of cooling is usually used to consider heat convection losses during welding, as shown in Equation (4); Stefan–Boltzmann’s law is used to model heat radiation losses, as shown in Equation (5) [33,34]. The ambient temperature is set to 20 °C in all simulated cases. In this study, it is assumed that all heat losses occur in the natural environment.
q c = h c ( T s T 0 )
q r = σ ε [ ( T s + 273.15 ) 4 ( T 0 + 273.15 ) 4 ]
where h c ( = 2.5 × 10 5   W m m 2 K 1 ) is the heat transfer coefficient; σ ( = 5.67 × 10 8   W m 2 K 4 ) is the Stefan–Boltzmann constant; ε ( = 0.8 ) is the emissivity factor; T s is the temperature of the model surface during the welding process; and T 0 ( = 20   ) is the ambient temperature, so the total heat loss is the sum of the heat radiation loss and the heat convection loss.

2.1.2. Mechanical Analysis

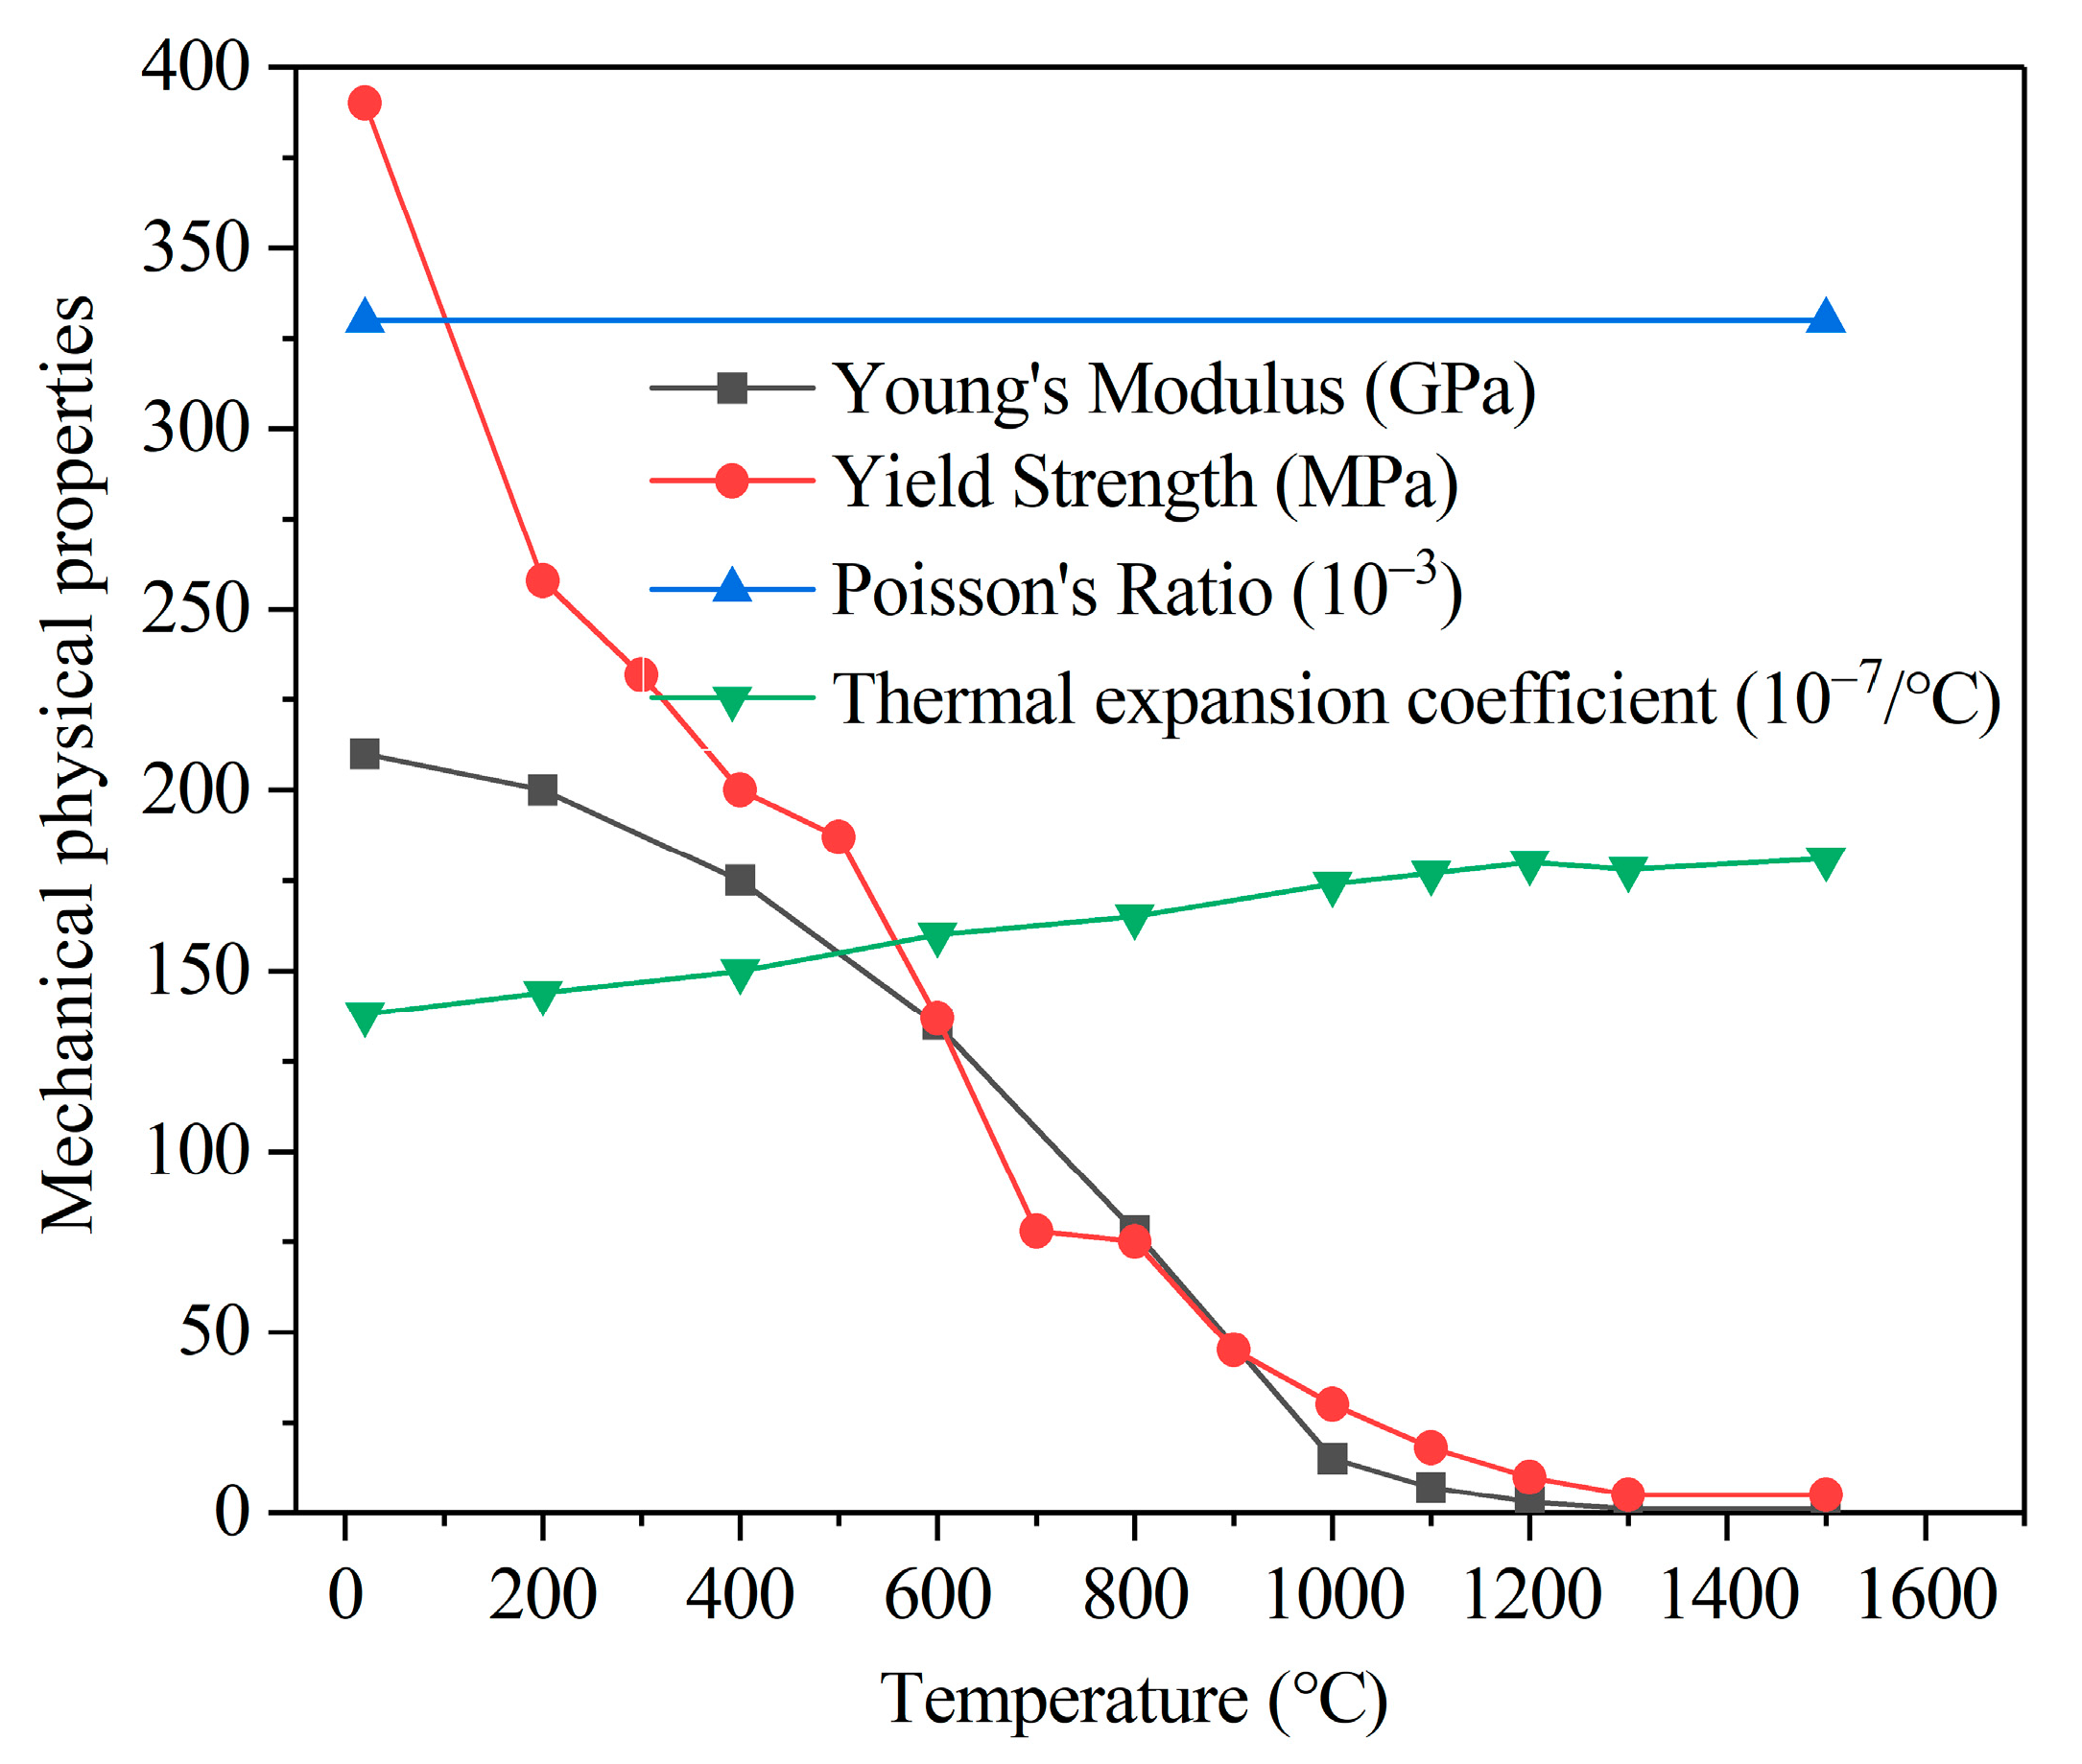
The exact same finite element model is used in the mechanical calculations as in the thermal calculations. The process of calculating the welding problem using TEP-FEM is temperature–stress coupled, and the results of the thermal calculations are loaded into the same finite element model as the mechanical initial load to solve for strains, displacements and stresses throughout the welding process. This calculation method requires that both the thermal and mechanical properties of the material are assigned to the corresponding cells of the finite element model prior to the simulation [35]. Mechanical calculations require temperature-dependent mechanical properties such as young’s modulus, yield strength, thermal expansion coefficient and Poisson’s ratio. The temperature-dependent mechanical physical properties of the Q345D material are shown in Figure 4 [28]. It should be noted that in the mechanical calculations, the mechanical properties of the filler material were also assumed to be identical to those of the base material. In mechanical calculations, the influence of phase change on plasticity was taken into account, and the material’s elastic stress–strain relationship was assumed to follow the isotropic Hooke’s law, while the plastic behavior adhered to the von Mises criterion. Due to the short duration of high-temperature cycles at each node during the welding process, creep strain is not taken into account. The work-hardening behavior of the material is assumed to be described by the isotropic criterion. Therefore, the entire strain increment during the mechanical analysis can be composed of four strains as follows [36,37]:
ε t o t a l = ε e + ε p + ε T + ε t r
where ε t o t a l is the total strain increment, ε e is the elastic strain increment, ε p is the plastic strain increment, ε T is the thermal strain increment and ε t r is the phase change strain increment. In addition, the solid phase line temperature (TS) of Q345D is defined as 1440 °C, the liquid phase line temperature (TL) as 1505 °C and the mechanical properties failure point (TF) of the material as 1300 °C. During heating, when the temperature of a point of the material is greater than 1300 °C, the equivalent plastic strain at that point is set to zero; during cooling, after the temperature has dropped below 1300 °C, the material can undergo process hardening from new.

2.2. Inherent Strain Method (ISM)

2.2.1. Inherent Strain Theory

Inherent strain method (Abbreviation ISM) [12,13] was first proposed by Professor Ueda at the Institute of Fusion Welding, Osaka University, Japan, and enables the prediction of welding distortion in large structures. This method considered the residual plastic strain generated during the welding process as the fundamental cause of welding deformation and residual stress, and it was named “inherent strain”. The total strain ε t o t a l during the welding process is the sum of elastic ε e , plastic ε p , thermal ε T and creep strains ε c   as well as phase change strains ε t r , as shown in Equation (7) [38,39].
ε t o t a l = ε e + ε p + ε T + ε c + ε t r
The so-called inherent strain ε * can be seen as a source of internal force generation. If the object is considered to be in a state with neither external nor internal forces as the base state, the inherent strain ε * is the strain that occurs when the object is cut away from the stress state and is in a free state compared to the base state, and it is equal to the total strain ε t o t a l minus the elastic strain ε e , i.e., Equation (8) [38,39]:
ε = ε t o t a l ε e = ε p + ε T + ε c + ε t r
If it is assumed that when welding such a weld seam without a welding groove, the weld seam itself is subjected to a heating process in which the thermal strains of heating and cooling cancel each other out, the effect of thermal strain need not be taken into account. Assuming that creep strain and phase strain are not taken into account when welding materials such as carbon steel, the inherent strain is equal to the residual plastic strain after welding, i.e., Equation (9) [38,39].
ε = ε p
Therefore, if the magnitude and distribution of the residual plastic strain is known and is placed as the initial strain at the weld seam for elastic finite element calculations, the welding deformation of the entire structural member can be derived. ISM can be applied to large and complex welded structures and is more economical and practical in predicting weld distortion.

2.2.2. Inherent Strain Acquisition and Loading Methods

In this study, the residual plastic strain, i.e., the inherent strain, of a typical T-shaped joint was obtained by using the TEP-FEM. In the software, the inherent strain cannot be directly applied as a load to the weld seam and its adjacent elements, but the anisotropic thermal expansion coefficient in the finite element software can realize both longitudinal and transverse shrinkage of the weld seam. Therefore, it is possible to apply the inherent strain indirectly using the anisotropic thermal expansion coefficient and the unit temperature load provided by the software. That is, according to Equation (10), the thermal expansion coefficient can be derived from the given difference between the melting temperature of the material and the environment, given that the value of the inherent strain in the weld seam is known, so that the inherent strain can be applied indirectly by changing the thermal expansion coefficient of the corresponding material file in the software [38,39]. In addition, in this study, it is assumed that the inherent strain is the same at all locations throughout the weld seam, ignoring end effects and the possibility that sudden changes of inherent strain in the local weld seam due to external constraints [14,40].
ε = ε P = α T
where ε *   is the inherent strain value; α is the thermal expansion coefficient, its value is equal to the value of inherent strain; T is the difference between the melting temperature of the material and the environmental temperature, taken as 1280 °C.

3. Numerical Simulation of Local Finite Element Welding Deformation Based on TEP-FEM

3.1. Local Finite Element Creation and Constraints

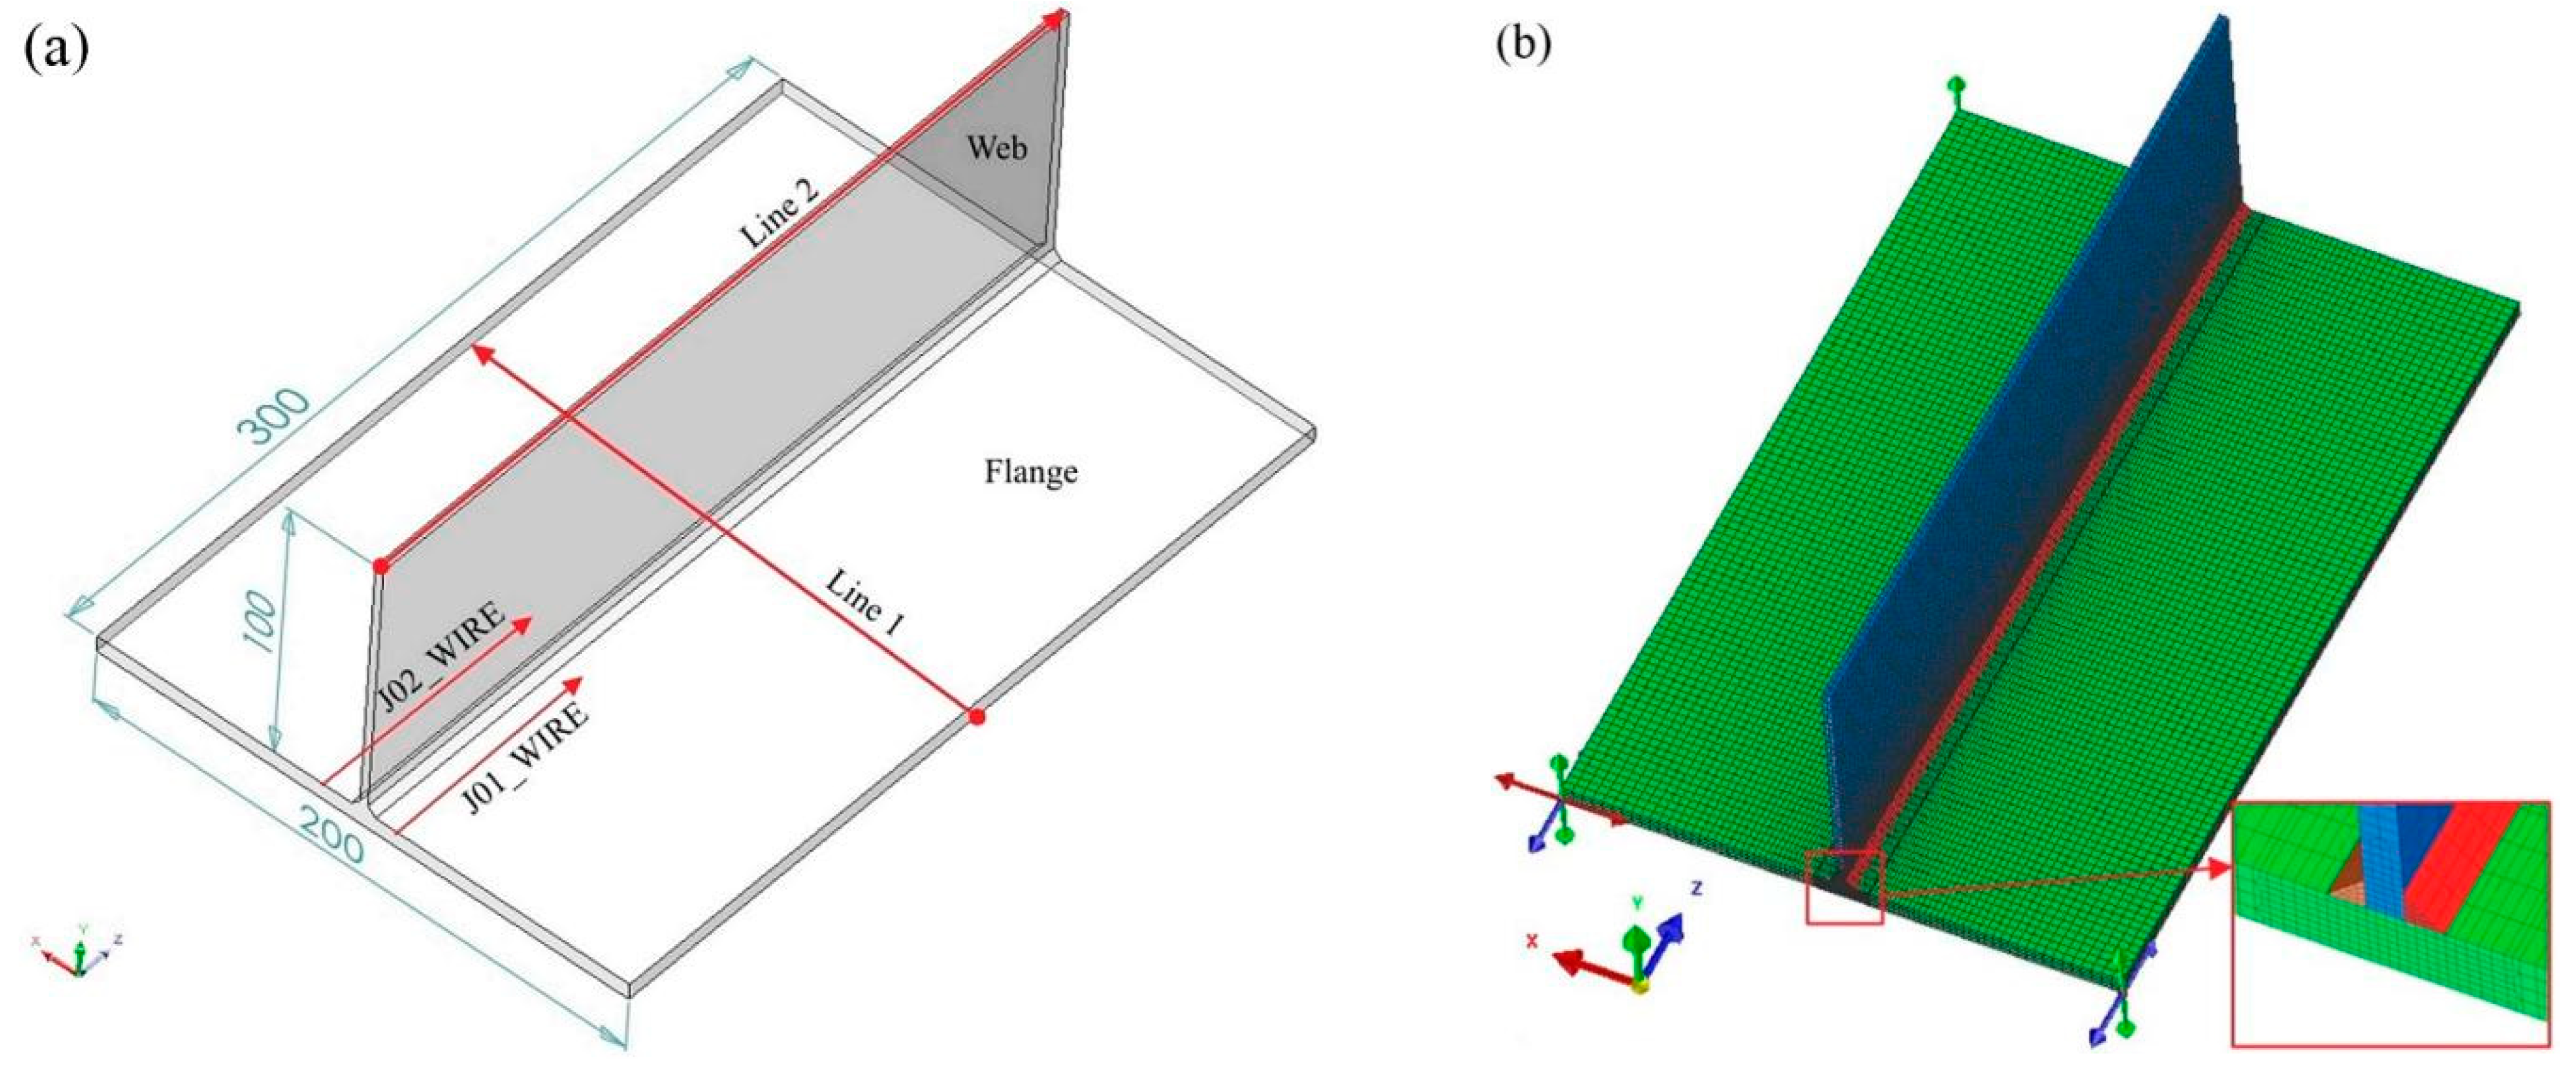
Based on the impeller plate thickness and joint form, a local simulation model of the T-shaped double-sided welded structure was established with reference to the plate thickness and the corresponding weld foot size. The dimension of the flange is 300 mm × 200 mm × 6 mm [32], the dimension of the web is 300 mm × 100 mm × 3 mm and the dimension of the welding foot is 3 mm × 3 mm, as shown in Figure 5a, where J01_WIRE is the first weld seam, J02_WIRE is the second weld seam and the direction of the arrow in the diagram is the welding direction. Since the welding process is an inhomogeneous heating process, the temperature gradients of the welding heat source and its heat-affected zones vary considerably. To ensure the accuracy of the analytical results and to speed up the computation, the mesh of the weld seam and its surrounding locations are encrypted and the locations away from the weld seam are sparsely divided into meshes. The local finite element model after dividing the mesh is shown in Figure 5b. The T-shaped local finite element has a total of 63,700 3D cells and 74,448 nodes. In mechanical calculations, the external boundary conditions of the finite element model establish only free constraints that prevent rigid movement and rotation of the model.

3.2. Finding the Optimum Welding Parameters Based on TEP-FEM

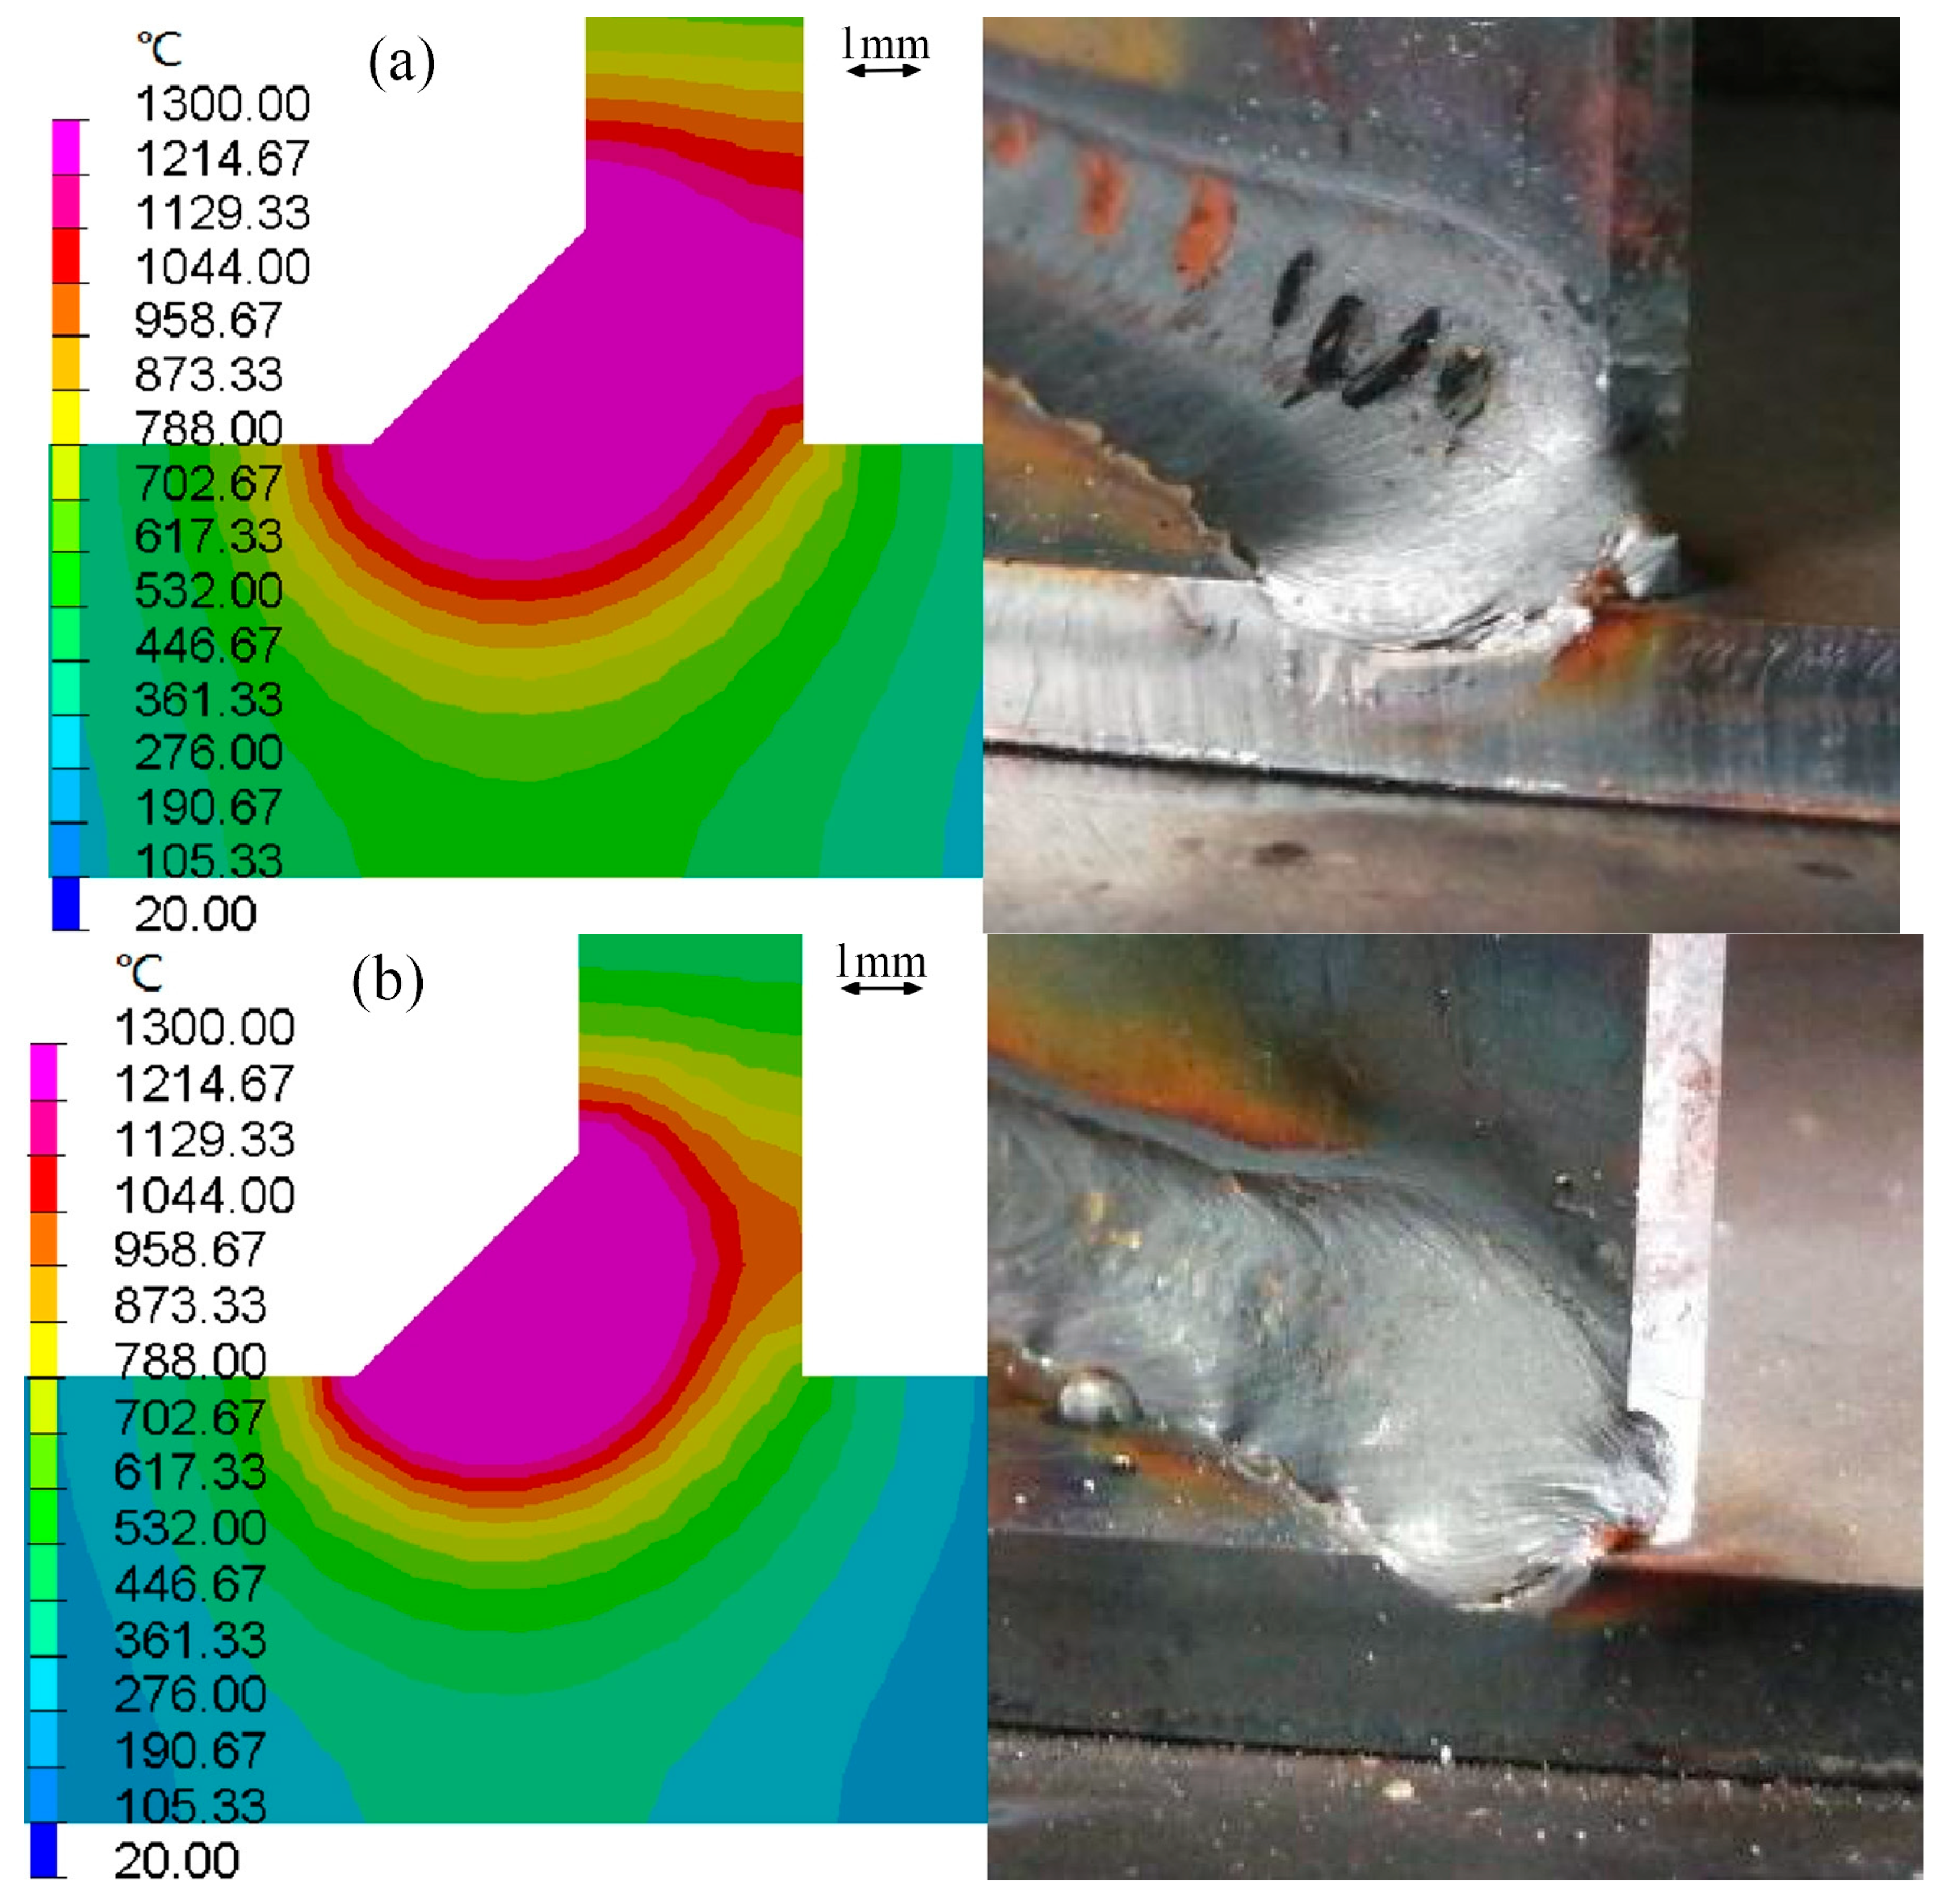
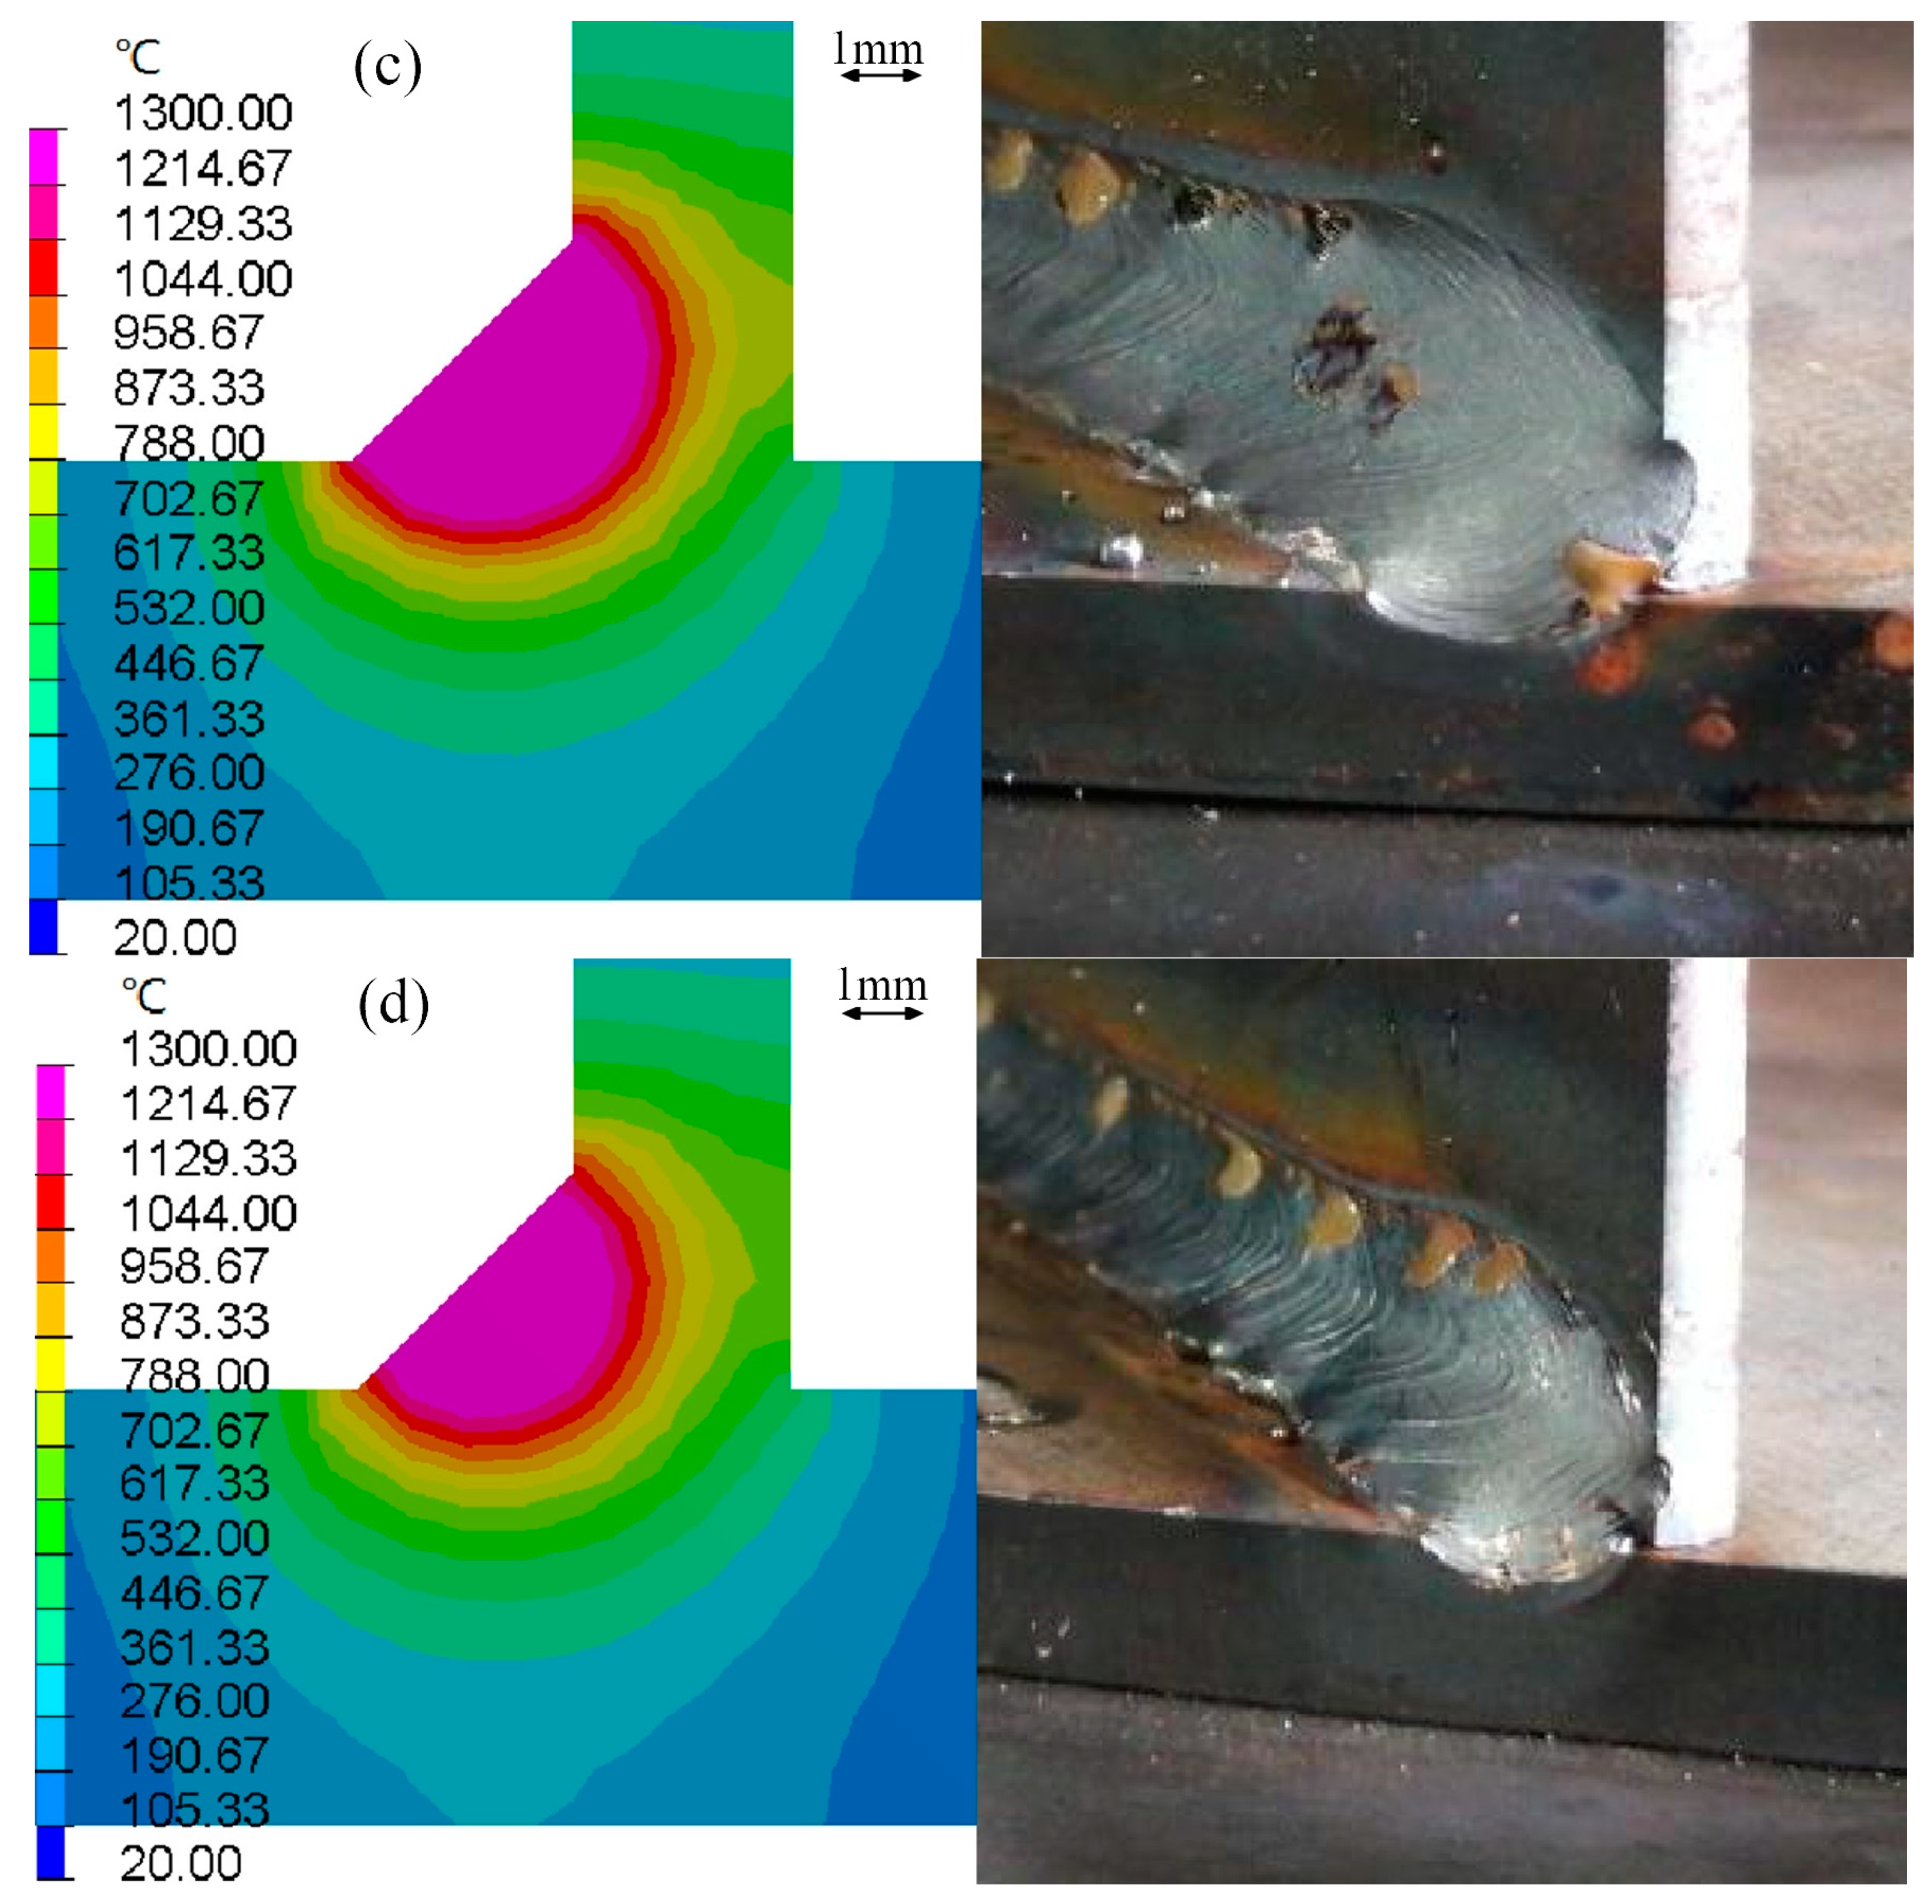
During production, welding parameters are mostly chosen empirically, followed by test welds on the plate metals to find the welding parameters that satisfy the quality of the weld seam. This study was the first to numerically simulate and experimentally verify the temperature field of a local T-joint using the TEP-FEM to understand the quality of the resulting weld seams for different welding parameters. The relevant welding process parameters given in advance are shown in Table 2. The welding power source selected for this experimental robotic welding system was the FANUC:SFP-P400iB multifunctional welding machine. The TEP-FEM simulations of the melt pool cross section and the experimental results are shown in Figure 6, and the optimal welding process parameters for production are chosen based on the comparison of the numerical simulations and the experimental results.
As can be seen in Figure 6, the use of the TEP-FEM numerical simulation of different welding process parameters to obtain the welding pool cross-sectional cloud maps and test weld seams consistent with the situation, so the choice of heat source model and the actual welding heat source distribution matches. The TEP-FEM simulation of the welding pool cross-sectional cloud maps combined with the actual weld seam shapes show that when the welding speed is 0.35 m/min and 0.45 m/min, due to the excessive linear energy per unit length, respectively, it results in a large melt pool cross section lead to test plate weld through or over-melting of the base material; when the welding line energy is too small for the welding speed of 0.65 m/min, either numerical simulations of the melt pool cross-section or experimental results indicate that the melt pool cross-section is too small to melt the base material well; when the welding speed is 0.55 m/min, both numerical simulation of the melt pool cross-section or experimental weld seam shape meet the quality requirements.
Based on numerical simulations and experimental results, it can be concluded that a welding current of 160 A, a welding voltage of 22 V, and a welding speed of 0.55 m/min were chosen for good weld seam quality; it is also shown that TEP-FEM can be used to obtain realistic welding pool cross sections based on welding parameters. Therefore, the final welding parameters used in this study are shown in Table 3.

3.3. Numerical Analysis of Local Finite Element Welding Deformation

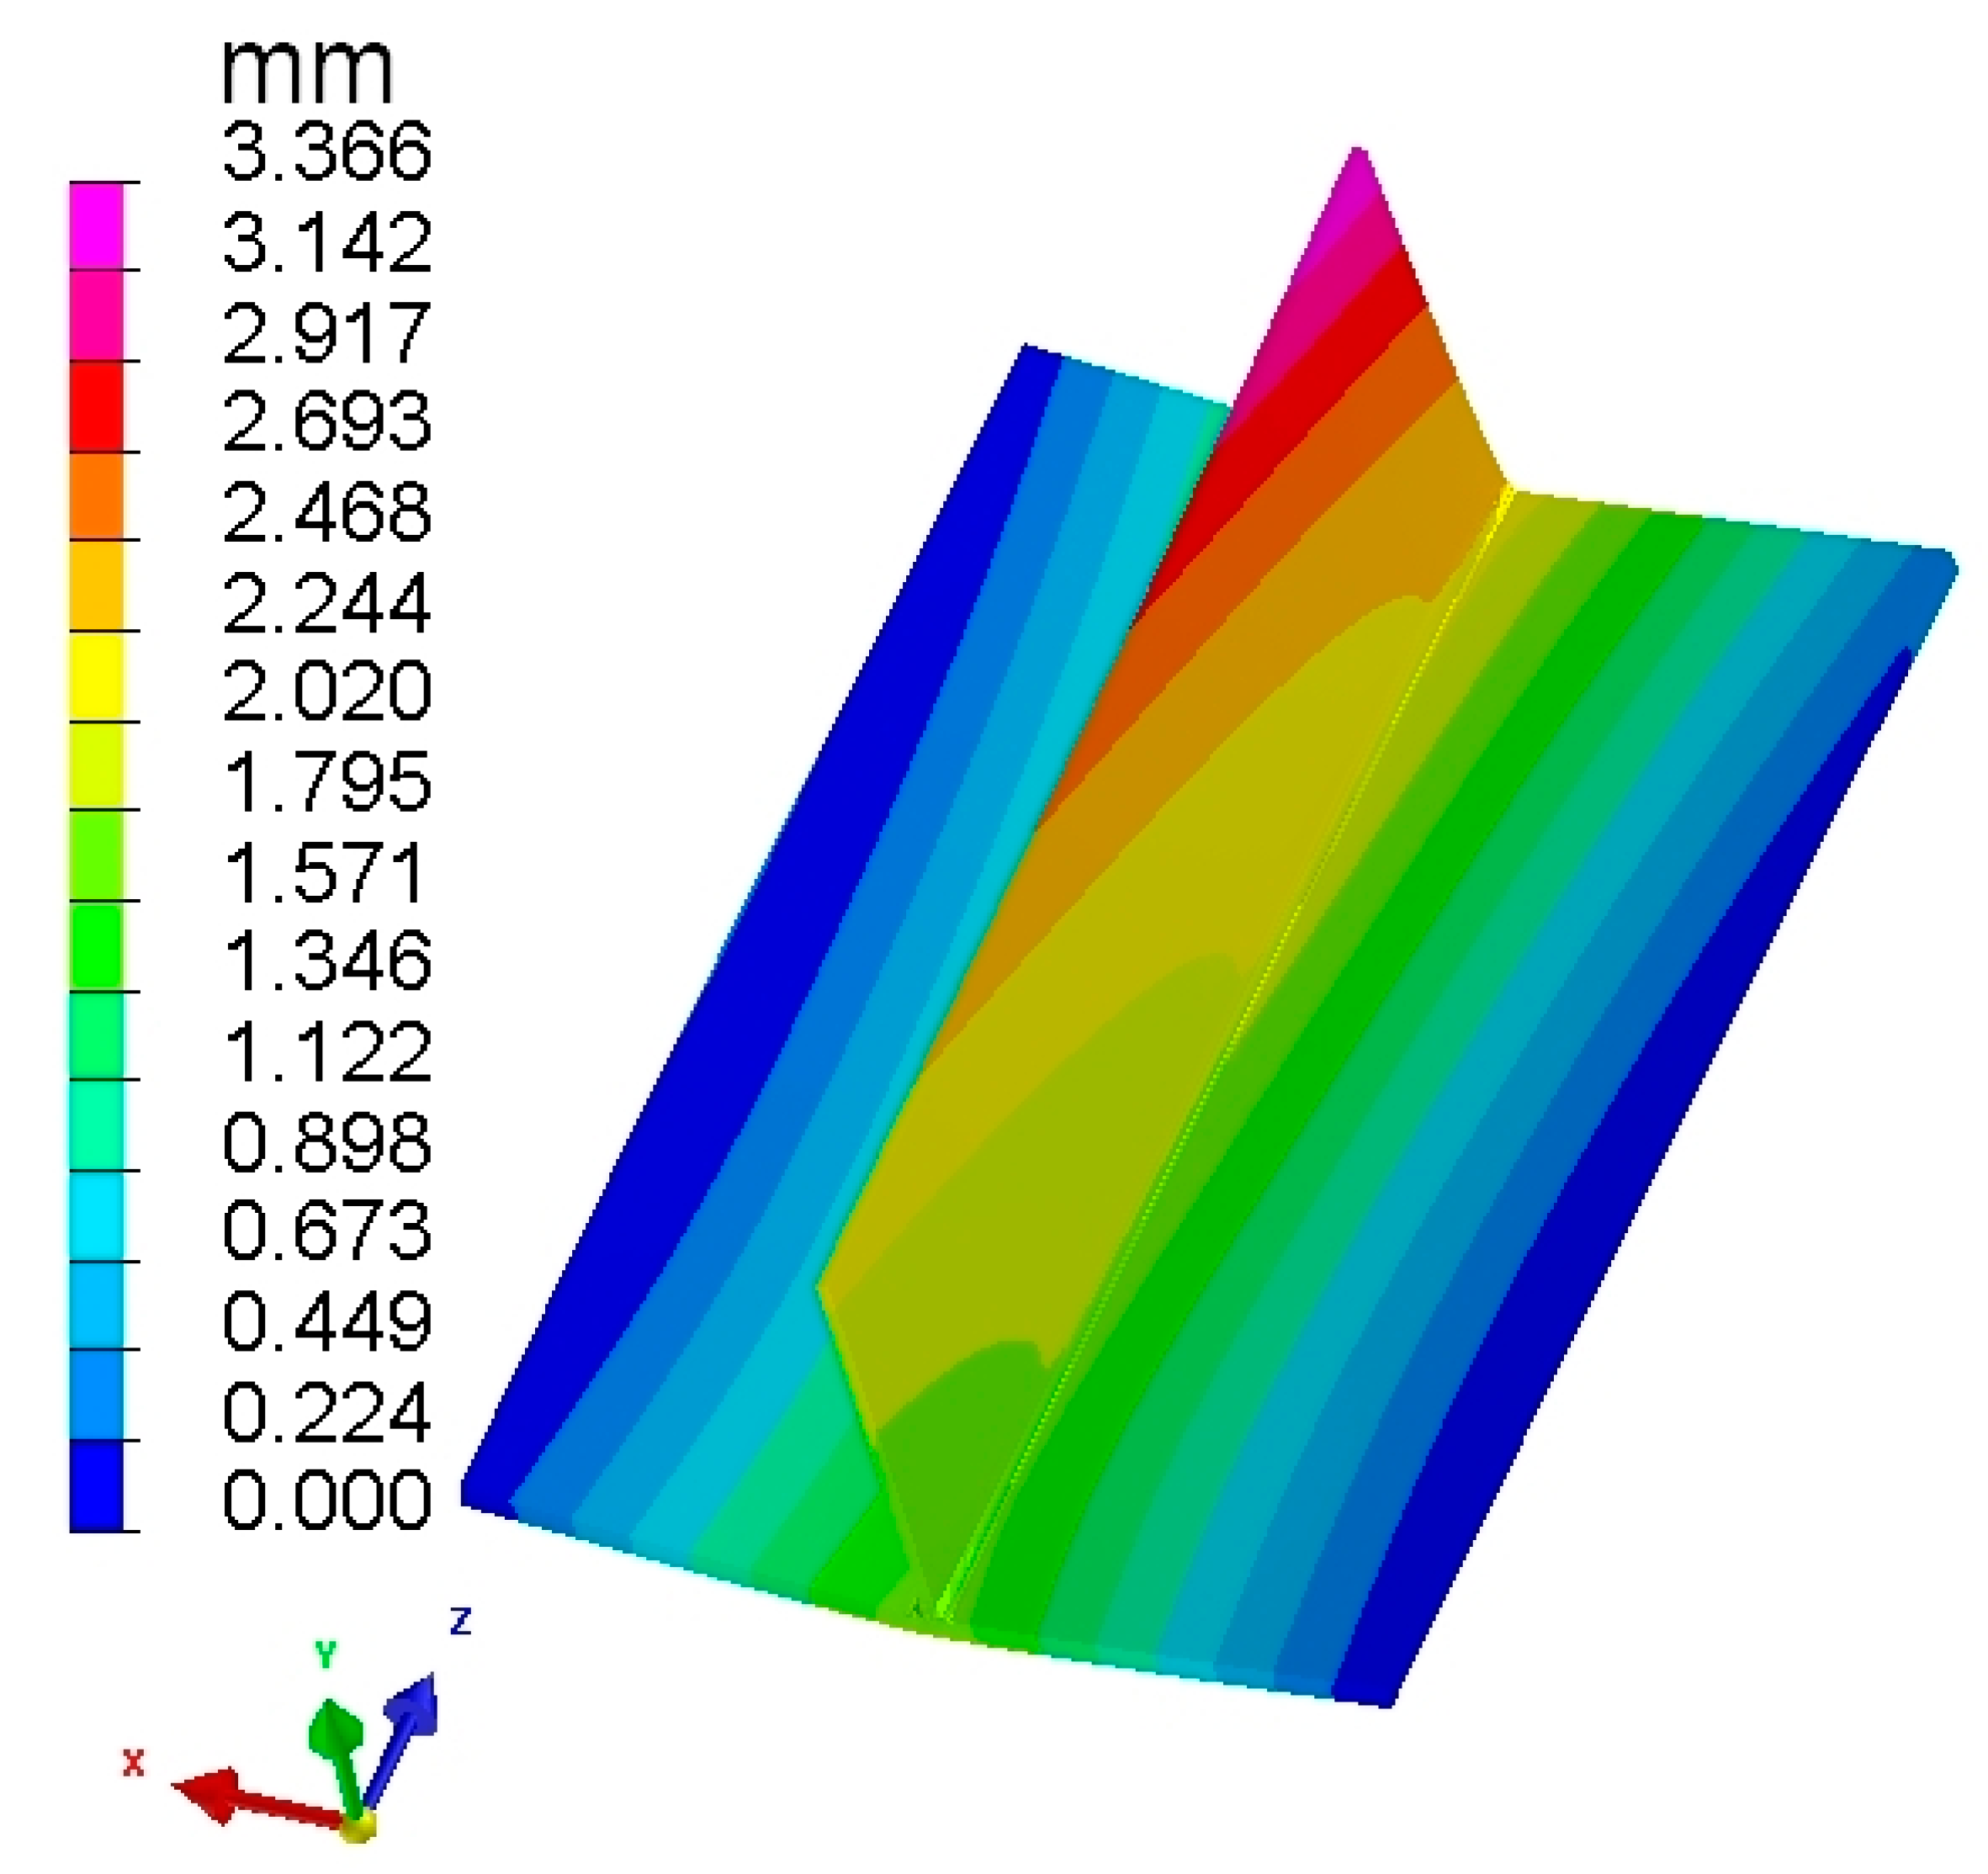
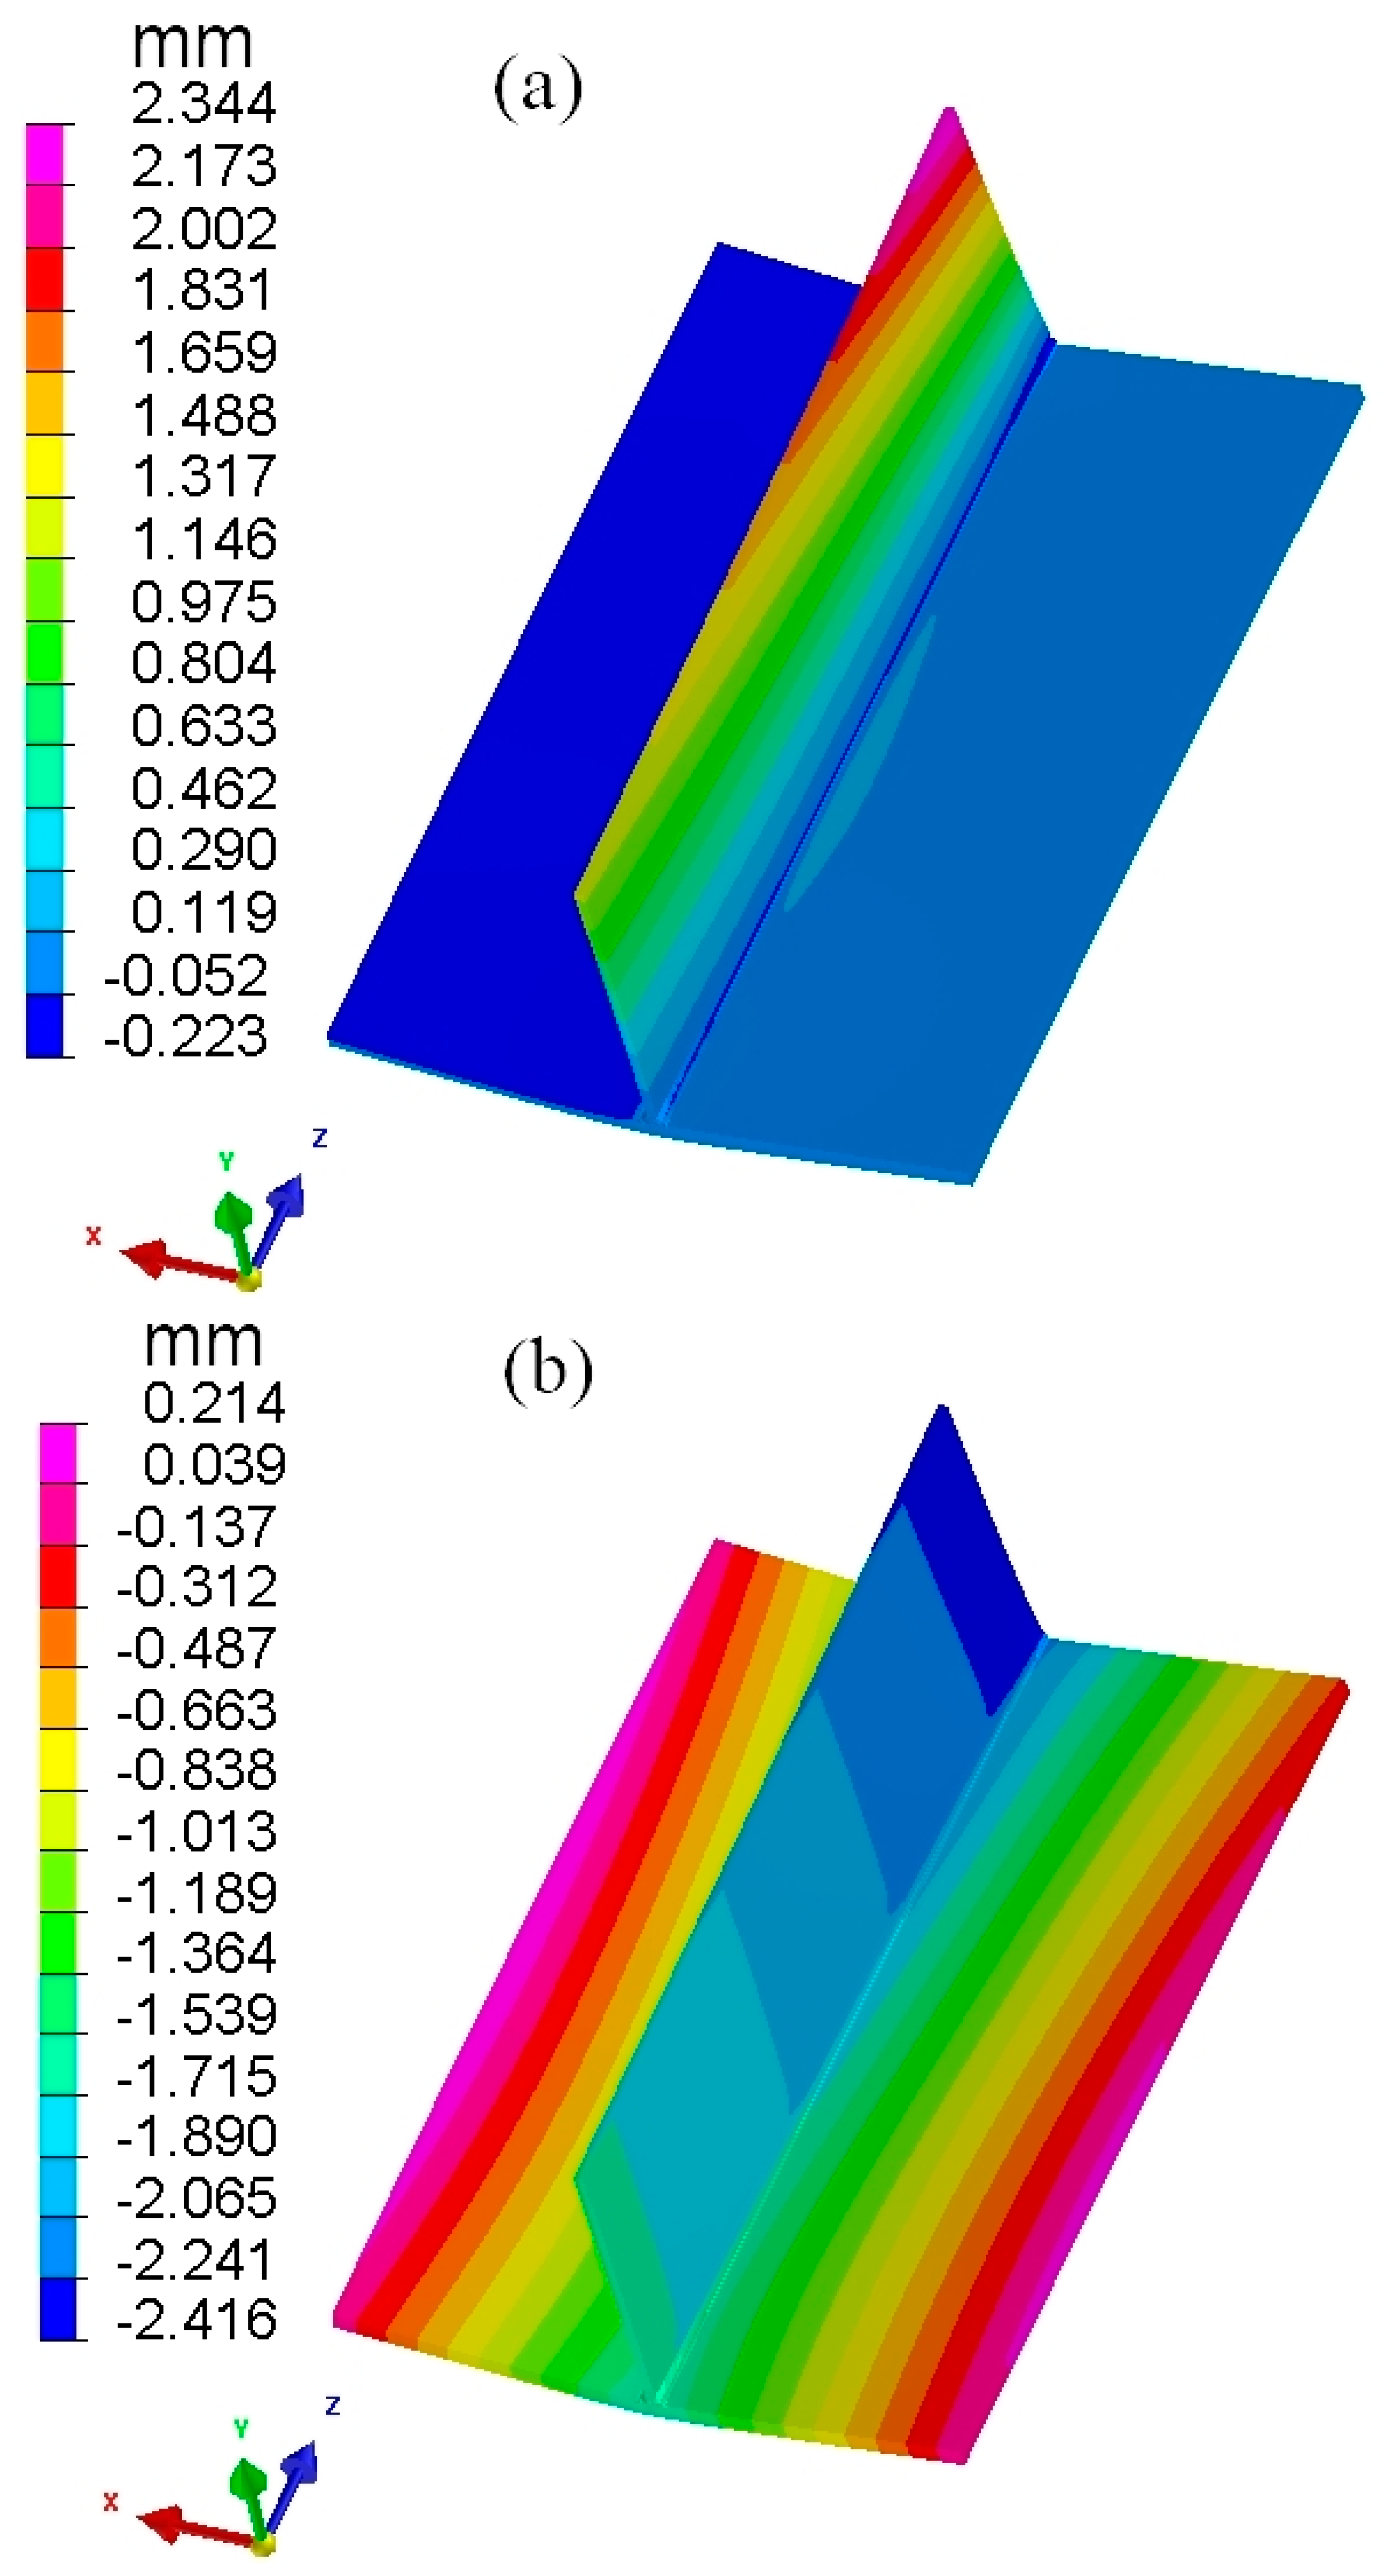
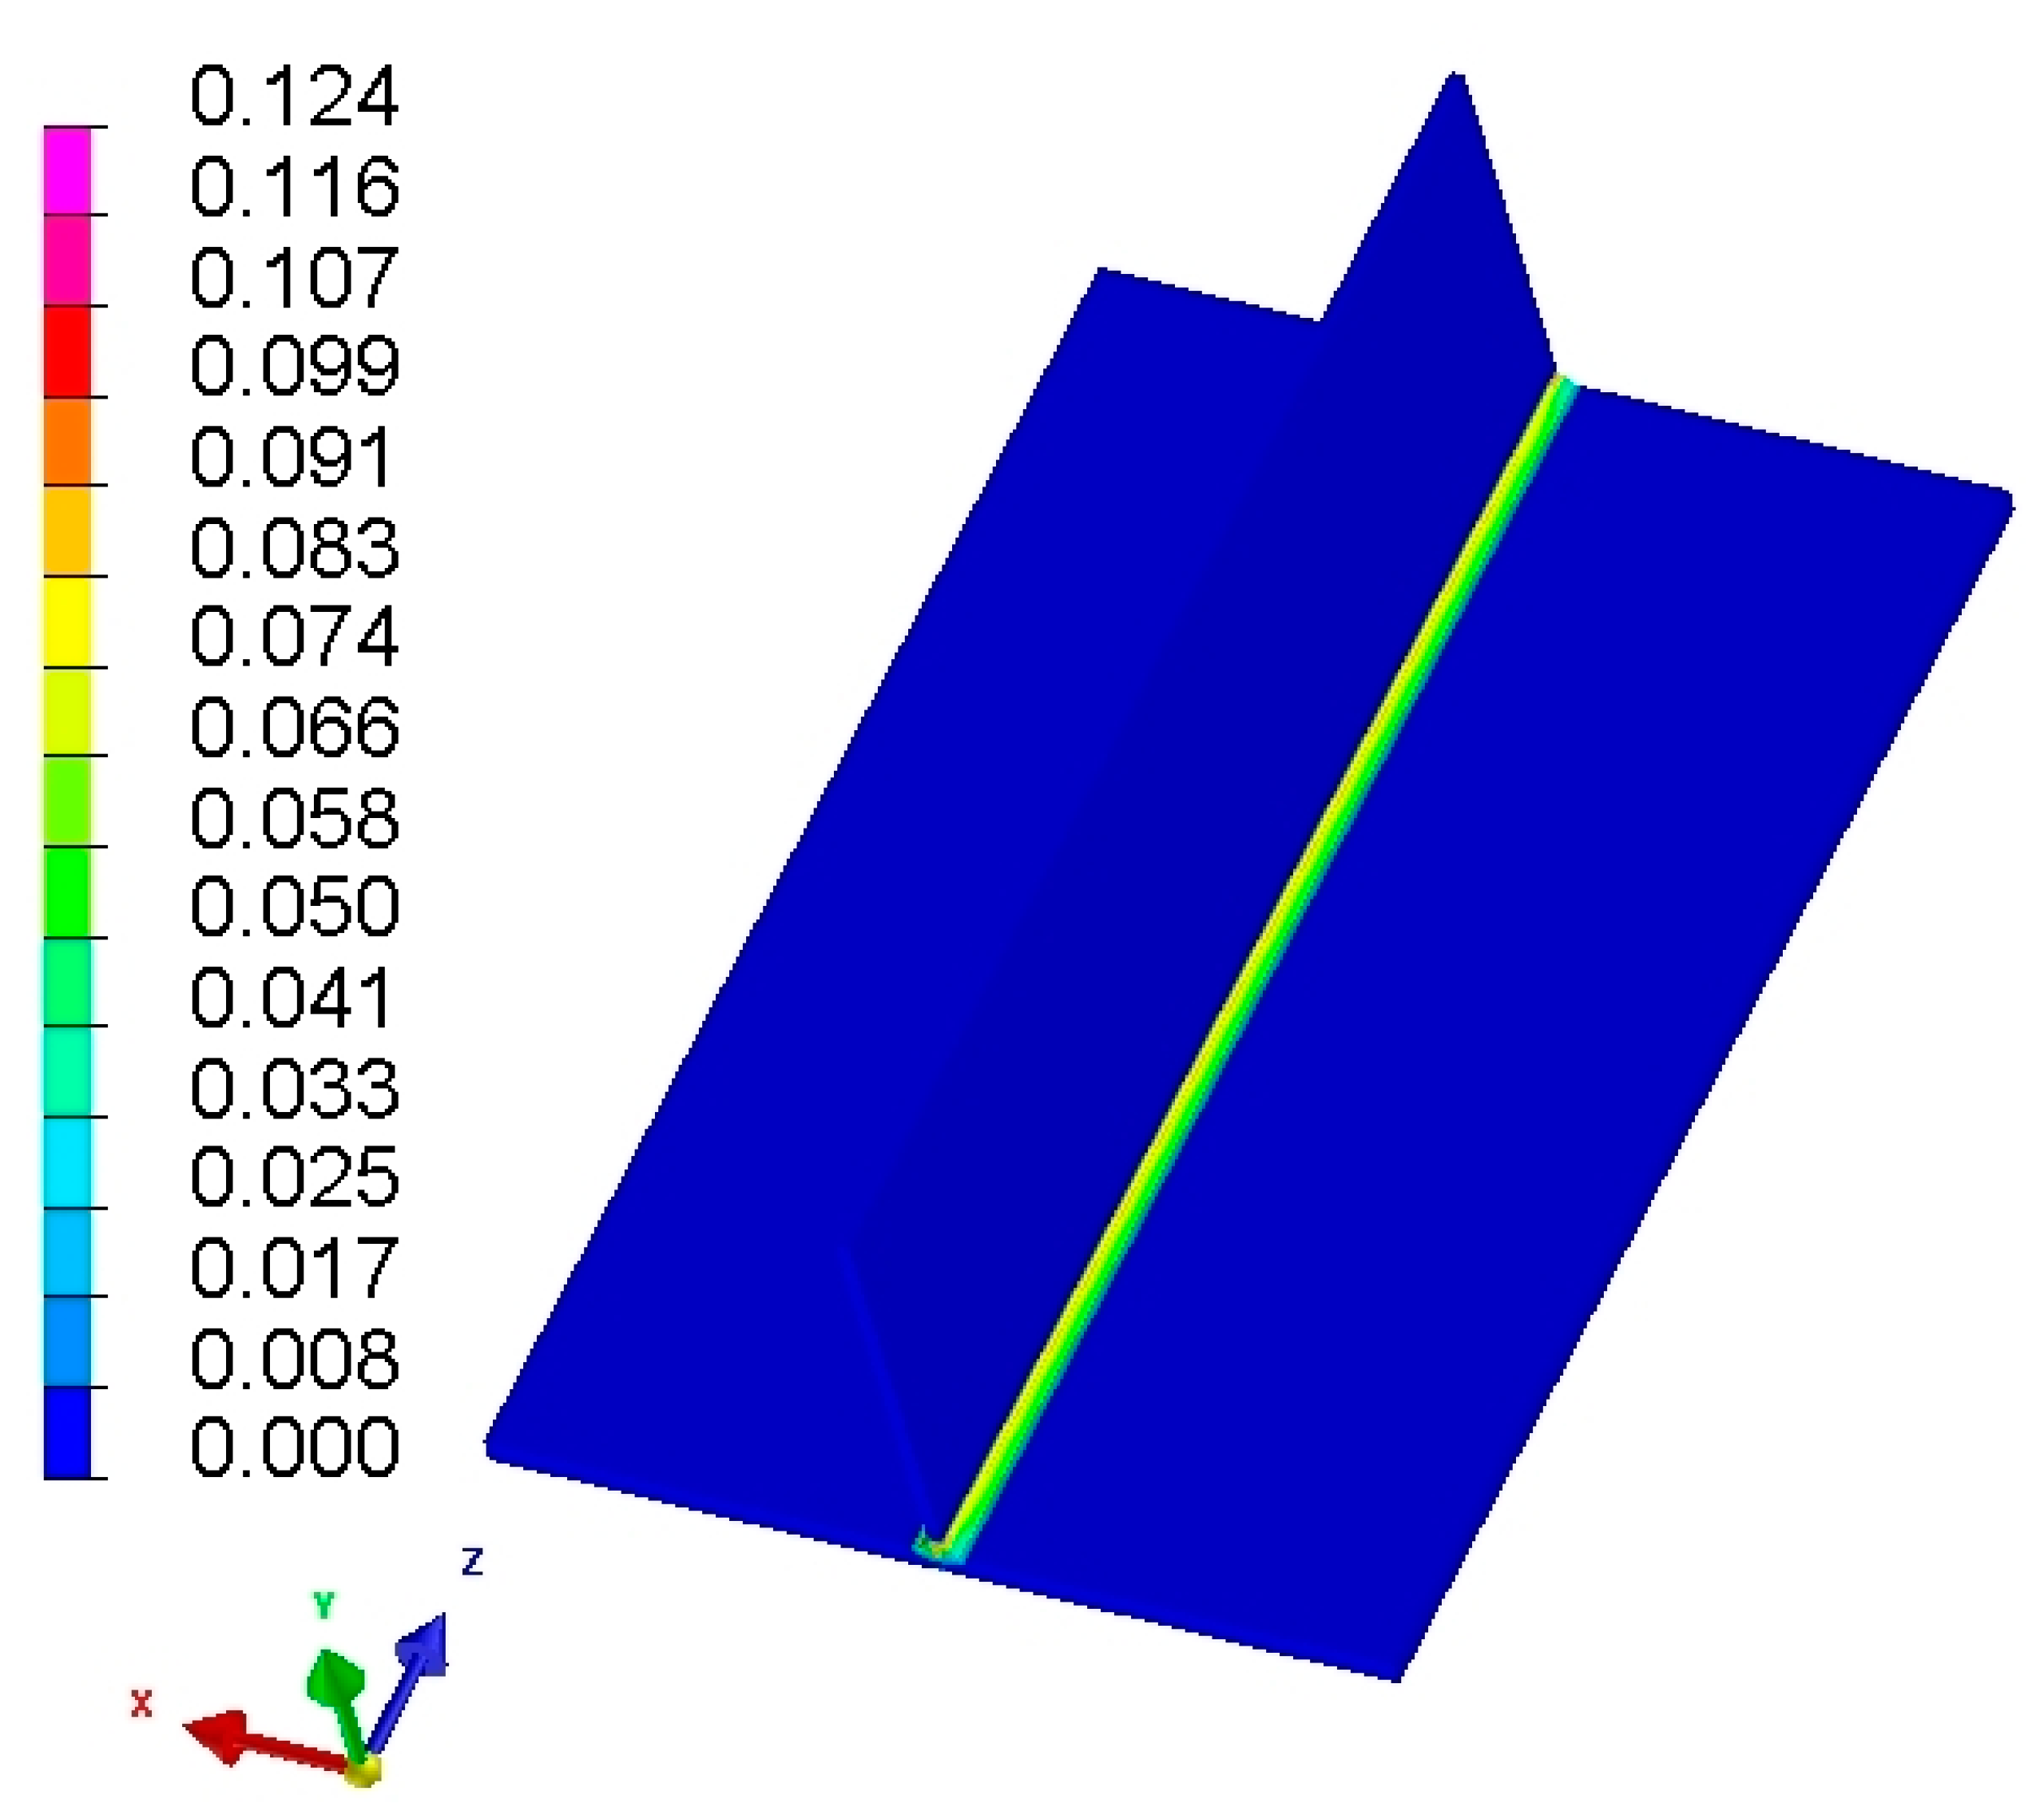
The overall deformation result calculated using the TEP-FEM for the local T-shaped double-sided single-pass weld finite elements is shown in Figure 7. The deformation in the X-direction, i.e., the vertical web direction, is shown in Figure 8a, and the deformation in the Y-direction, i.e., the vertical flange direction, is shown in Figure 8b. According to the deformation results, the web plate along the longitudinal direction of the weld seam is gradually deflected towards the positive direction of X, and the offset gradually increases; the flange plate is deformed into a V-shaped angular deformation along the longitudinal direction of the weld seam, and the combined result is consistent with the T-shaped welding deformation law. The TEP-FEM can be used to obtain the plastic strain distribution at different moments, with the movement of the welding heat source plastic strain is also moving forward; the relevant results are shown in Figure 9 for 5S, 15S, 25S and 30S plastic strain distributions, respectively.

4. Numerical Simulation of Local Finite Element Welding Deformation Based on ISM

The theory of predicting welding deformation according to the inherent strain method requires knowledge about the magnitude and distribution of inherent strain [14]. According to Equation (9), the inherent strain is approximately equal to the residual plastic strain during the prediction of welding deformation using the inherent strain method. From Figure 9, it can be seen that the residual plastic strain is mainly distributed in and around the weld seam. the average residual plastic strain size for the first weld seam is 0.0589 and the average residual plastic strain size for the second weld seam is 0.0750.

4.1. Numerical Simulation of Local Finite Element Welding Deformation Based on Traditional Inherent Strain Method

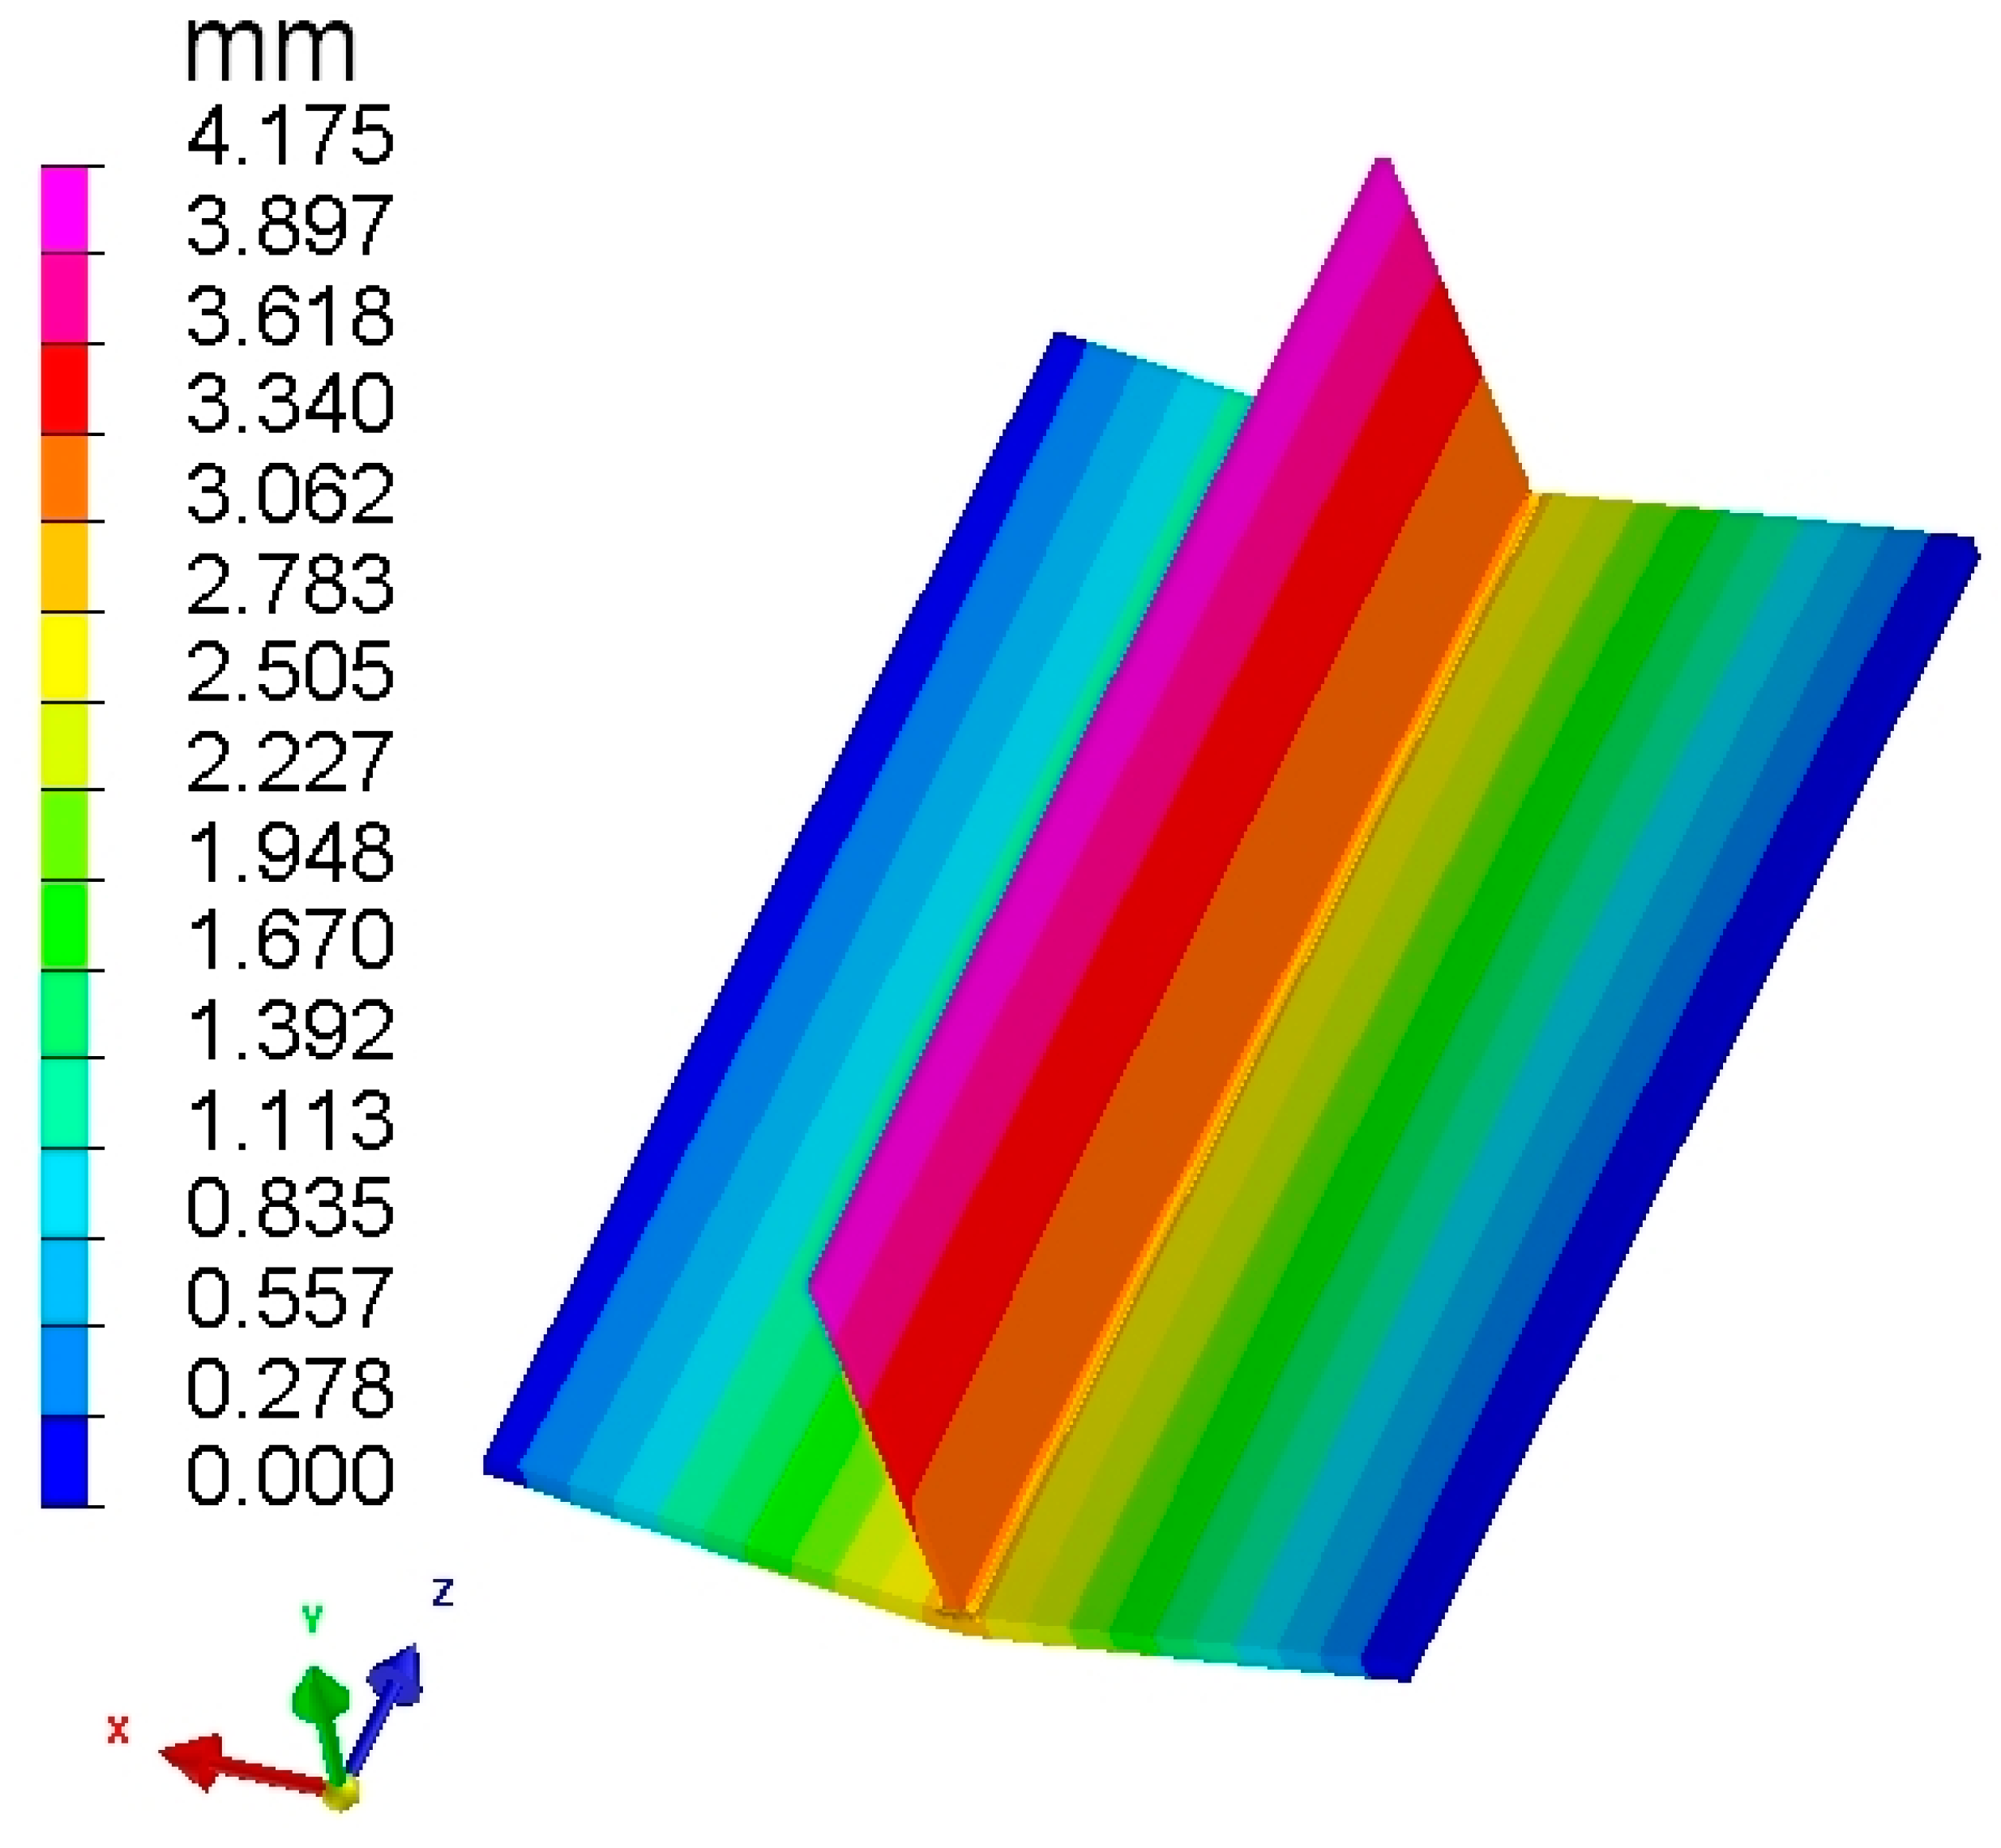
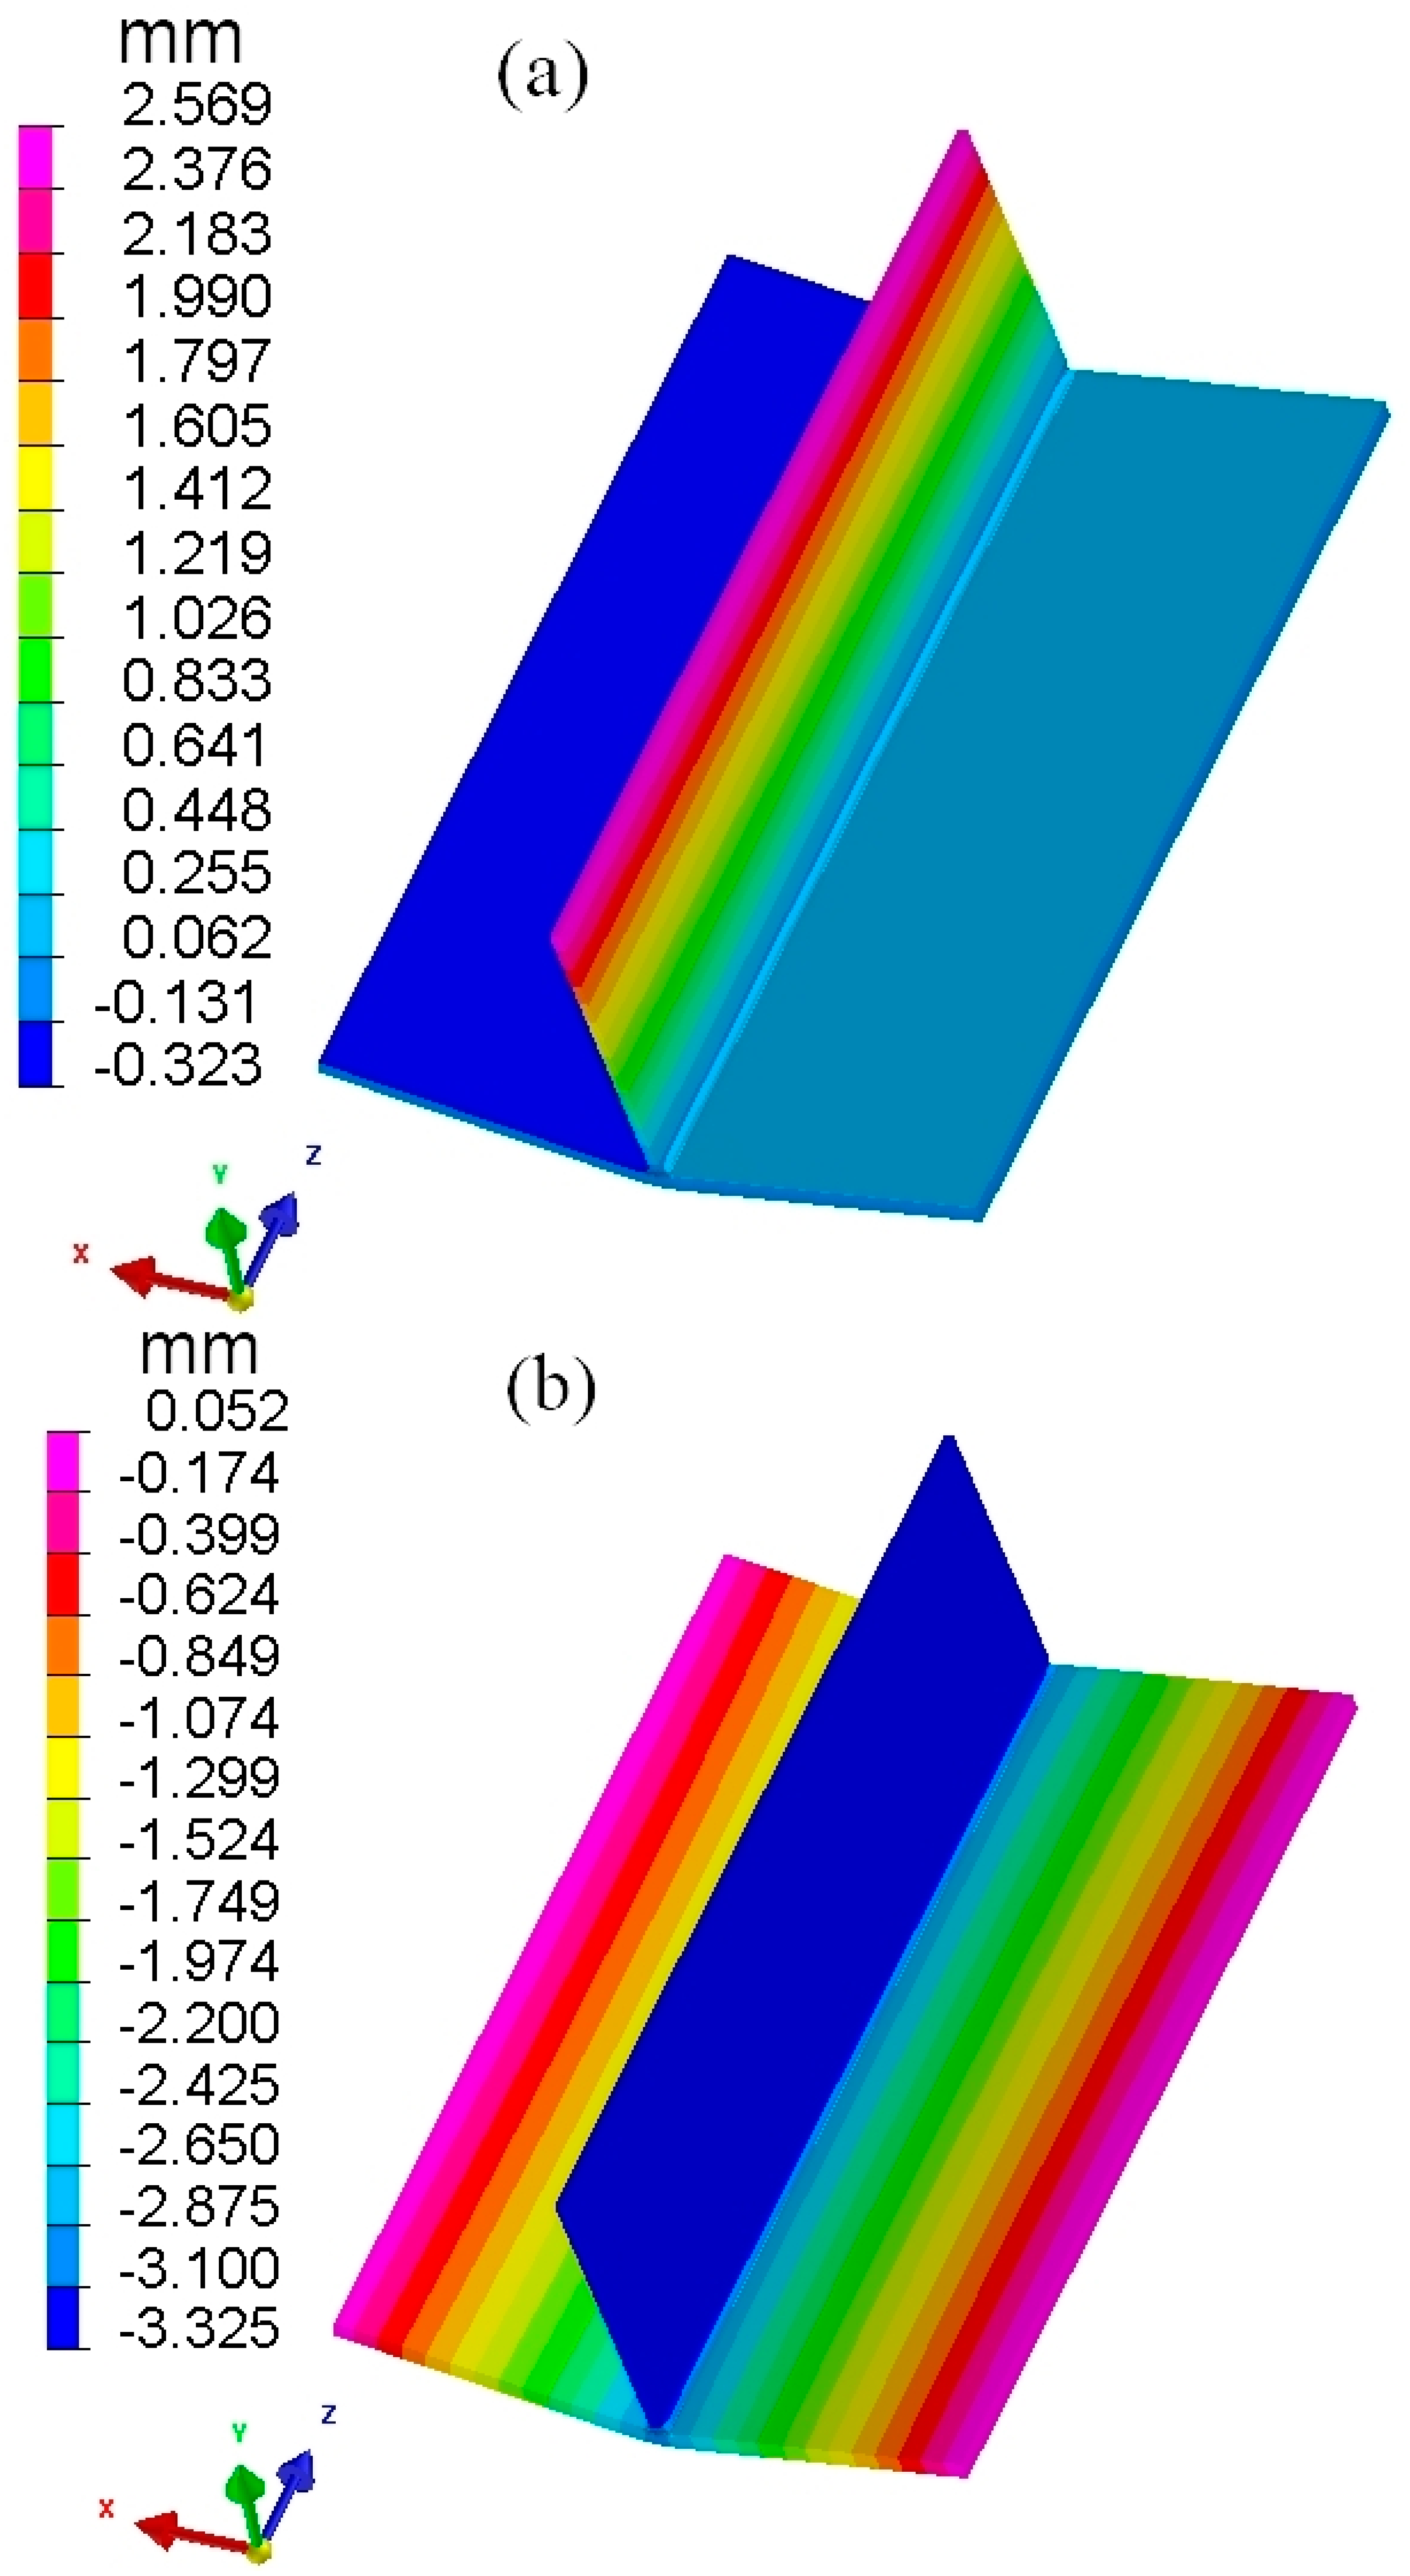
The existing inherent strain method involves loading different inherent strains into the entire section of the weld seam at once, and then performing one-step elastic calculation for each weld seam to obtain the final welding deformation. The principle is illustrated in Figure 10 and is referred to in this paper as the one-step loading inherent strain method or OS-ISM for short. The same local finite element 3D model as above (Figure 5) was used to verify the accuracy of the one-step loading inherent strain method (OS-ISM) in predicting welding deformation. The obtained inherent strain was loaded into J01_WIRE and J02_WIRE, respectively, by modifying the thermal expansion coefficients around the weld seam, and the overall welding deformation resulting from one-step elastic calculation of the weld seam in turn is shown in Figure 11; the corresponding welding deformation in the X-direction (perpendicular to the web direction) and Y-direction (perpendicular to the flange direction) is shown in Figure 12.
As can be seen in Figure 11, the overall welding deformation calculated based on OS-ISM is consistent with the characteristics of the T-structured welding deformation, but its distribution trends differ from the one calculated based on the TEP-FEM described above. A comparison of the deformation cloud maps in the X-direction from Figure 8a and Figure 12a show that although the web deformation calculated by both methods is offset in the positive X-direction, there is a significant difference between the two methods in the process of offsetting. The deformation of the web in the X-direction calculated using the TEP-FEM gradually increases with the longitudinal direction of the weld seam, whereas the deformation of the web in the X-direction calculated using the OS-ISM is of the same magnitude along the longitudinal direction of the weld seam. Similarly, as can be seen from the deformed cloud maps in the Y-direction in Figure 8b and Figure 12b, there is a difference in the angular deformation of the flange, although both the TEP-FEM and OS-ISM calculations show angular deformation. The angular deformation of the flange calculated on the basis of the TEP-FEM varies in magnitude along the longitudinal direction of the weld seam, which is consistent with the tendency of the real welding process to result in angular deformation of the flange. In contrast, the angular deformation of the flange calculated using the OS-ISM is consistent along the longitudinal direction of the weld seam, which is different from the angular deformation generated by the real welding. In addition, the welding deformation calculated using the OS-ISM are bigger in main directions than that calculated using the TEP-FEM.
The main reason for the difference in welding deformation is that the OS-ISM uses a one-step loading inherent strain, which does not take into account the fact that residual plastic strain is generated gradually during the actual welding process. As a result, there are differences between the welding deformations of the web in the X-direction and the flange in the Y-direction calculated using the OS-ISM and the actual welding deformations.

4.2. Numerical Simulation of Local Finite Element Welding Deformation Based on the Step-by-Step Loading Inherent Strain Method

As can be seen from Figure 9 above, whether using the TEP-FEM or judging from experience, residual plastic strain is generated gradually during the welding process. The OS-ISM does not take into account the gradual generation of residual plastic strain during the calculation process, ignoring the fact that the welding deformation generated at the previous moment will have an impact on the subsequent deformation, resulting in predicted results with the TEP-FEM calculation of welding deformation has large differences. By analyzing the shortcomings of the OS-ISM in the process of loading inherent strain, this study proposes to load inherent strain in steps along the weld seam to predict welding deformation, which is referred to in this paper as the step-by-step loading inherent strain method or SBS-ISM for short.
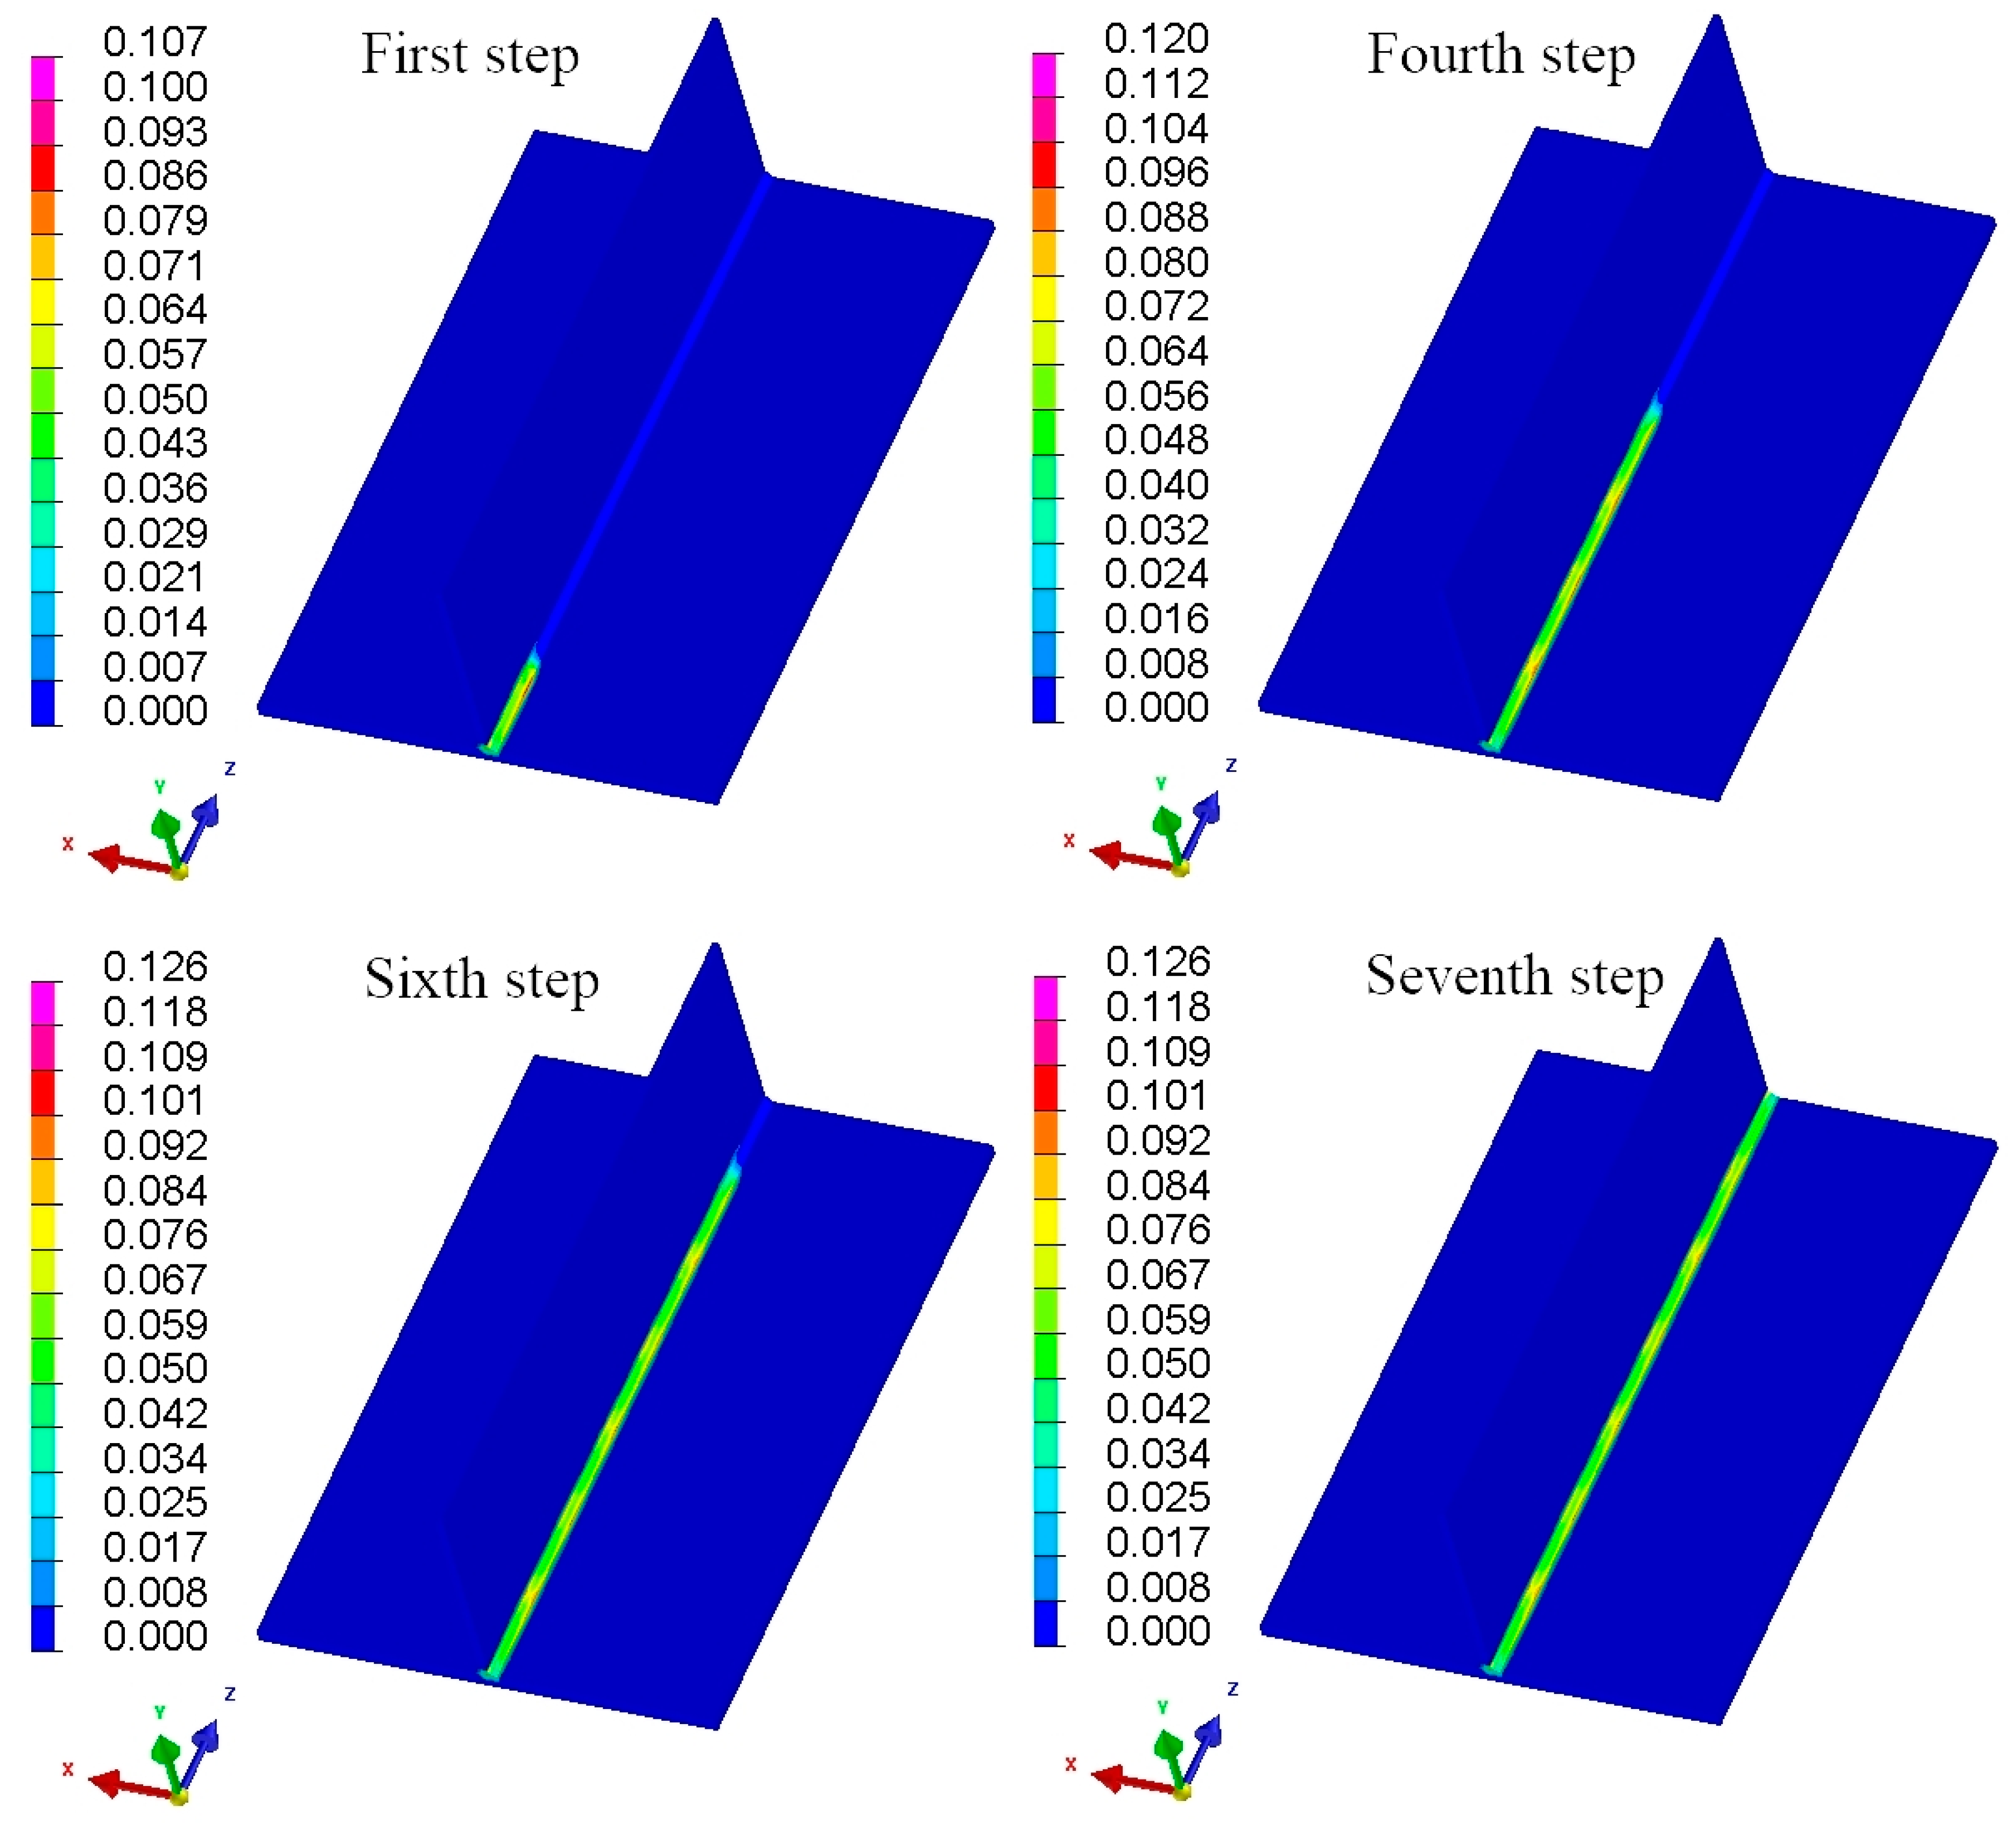
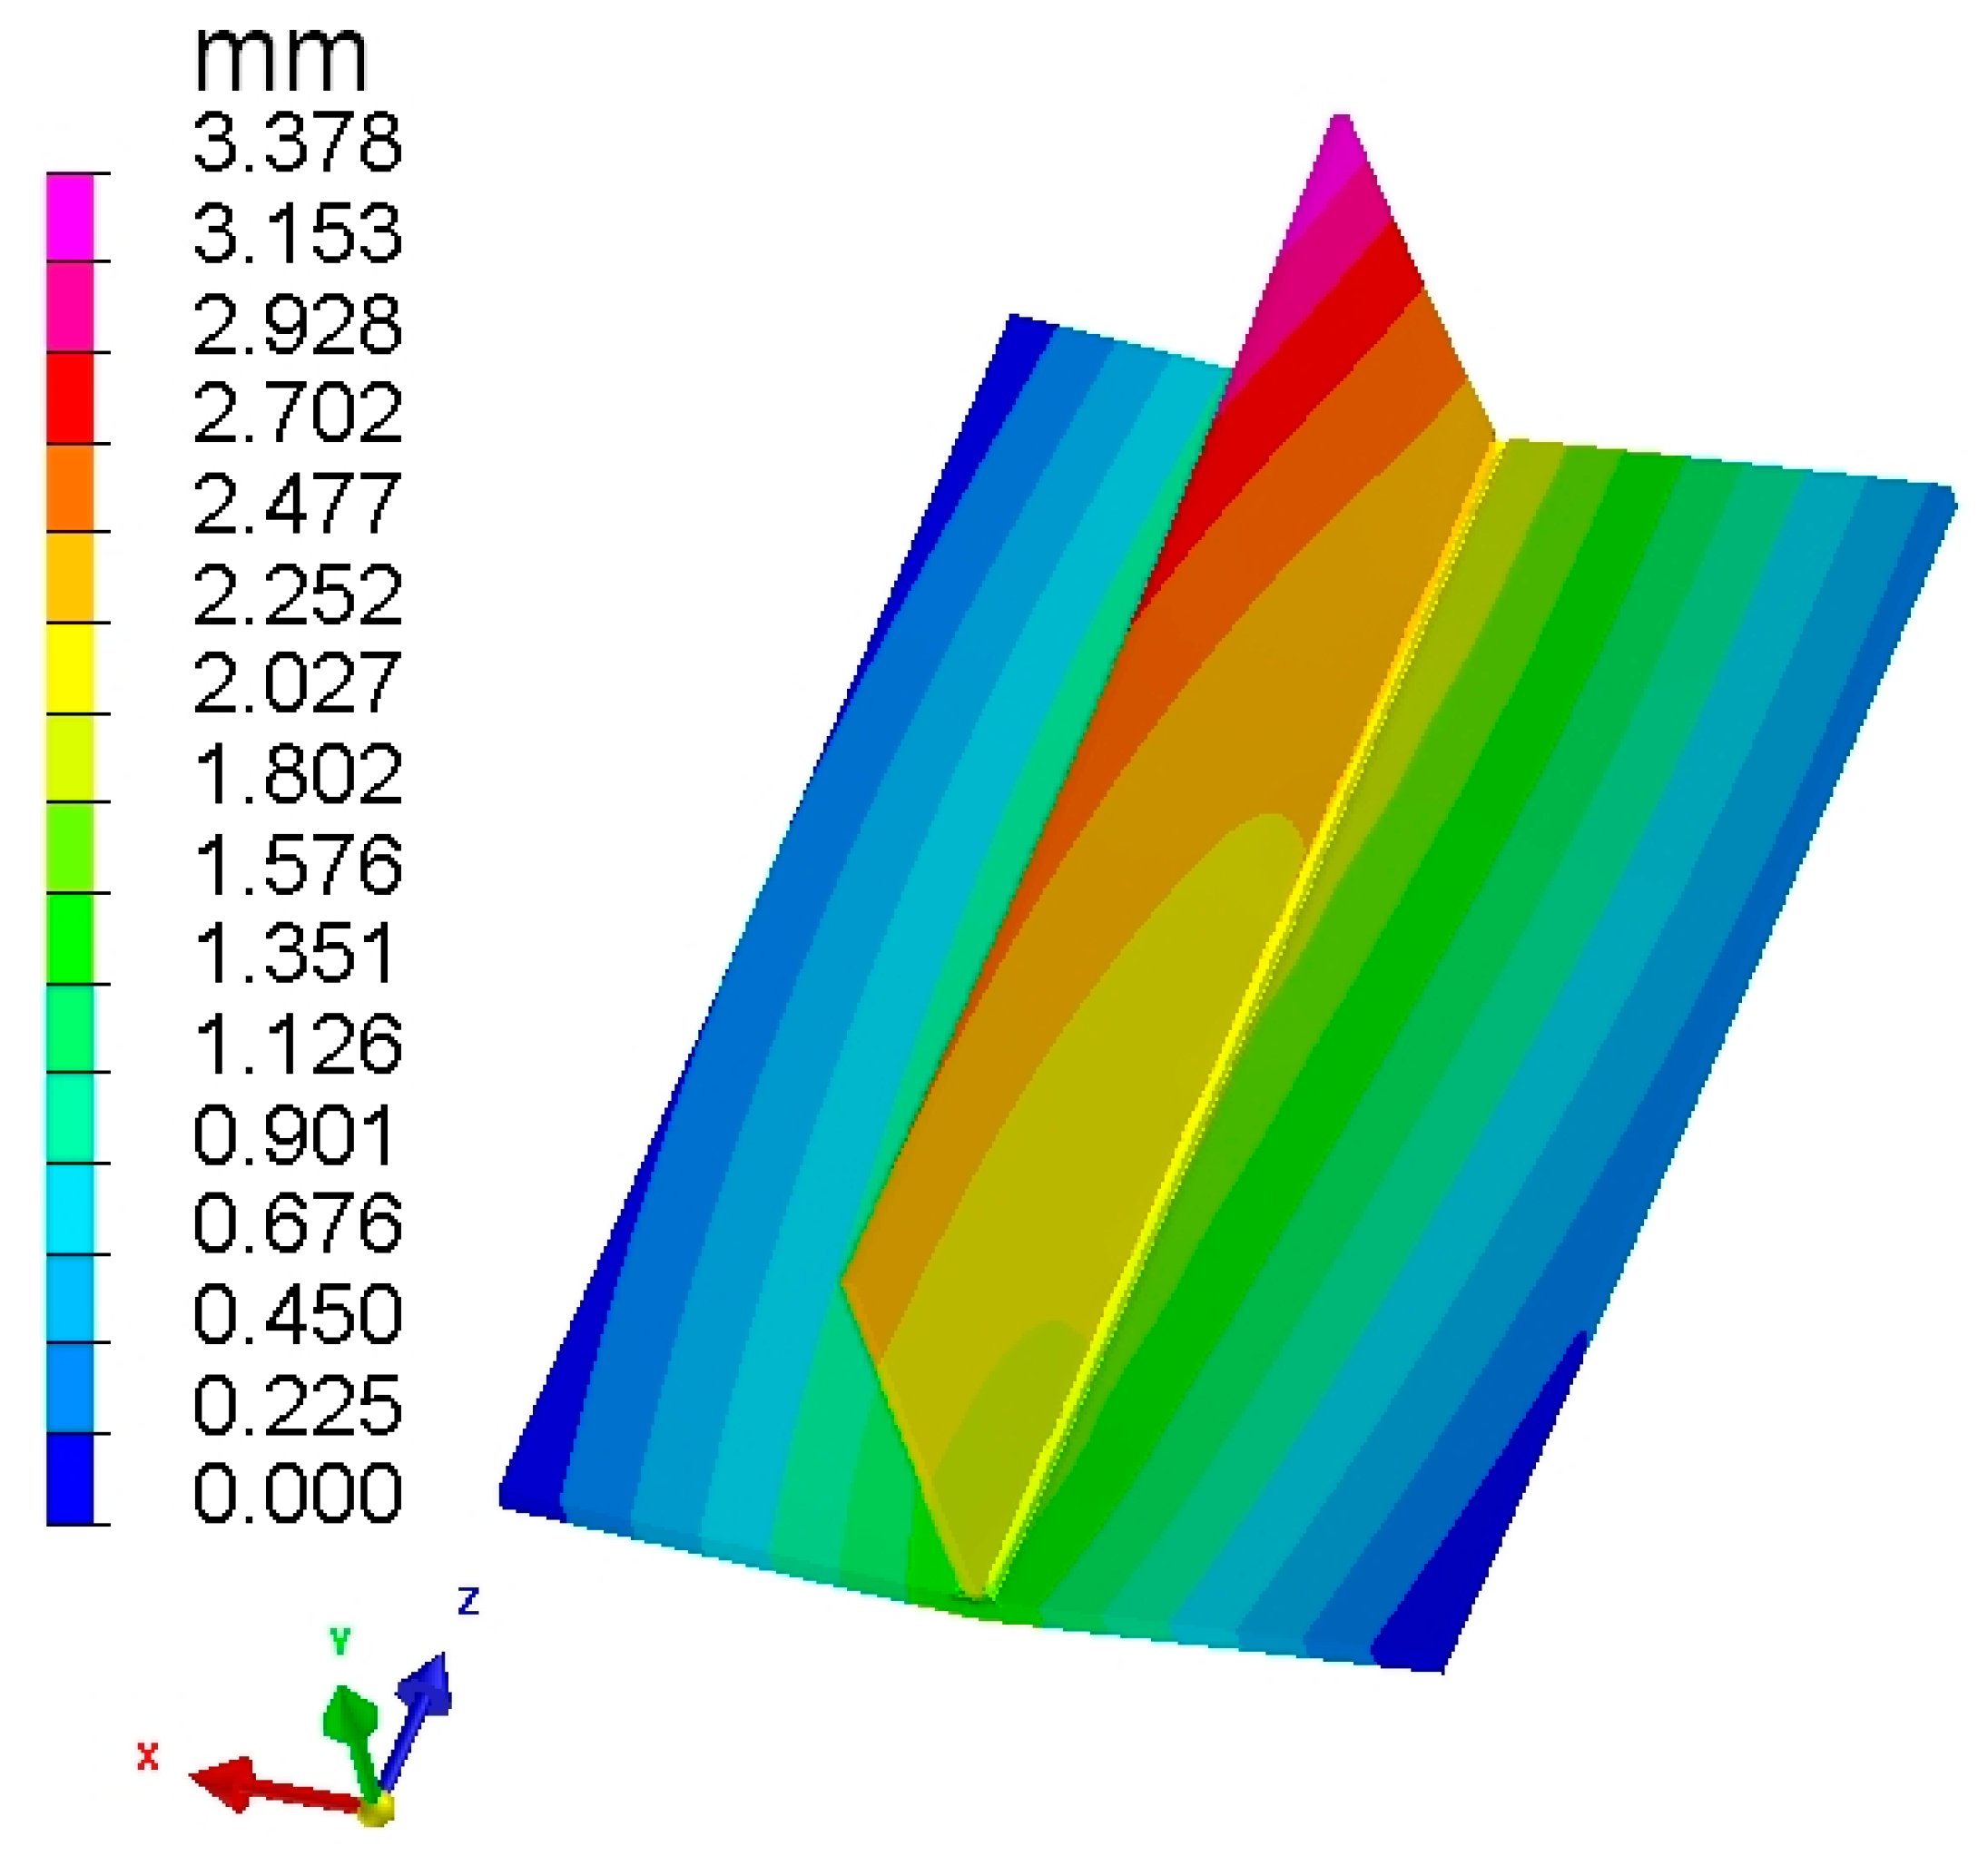
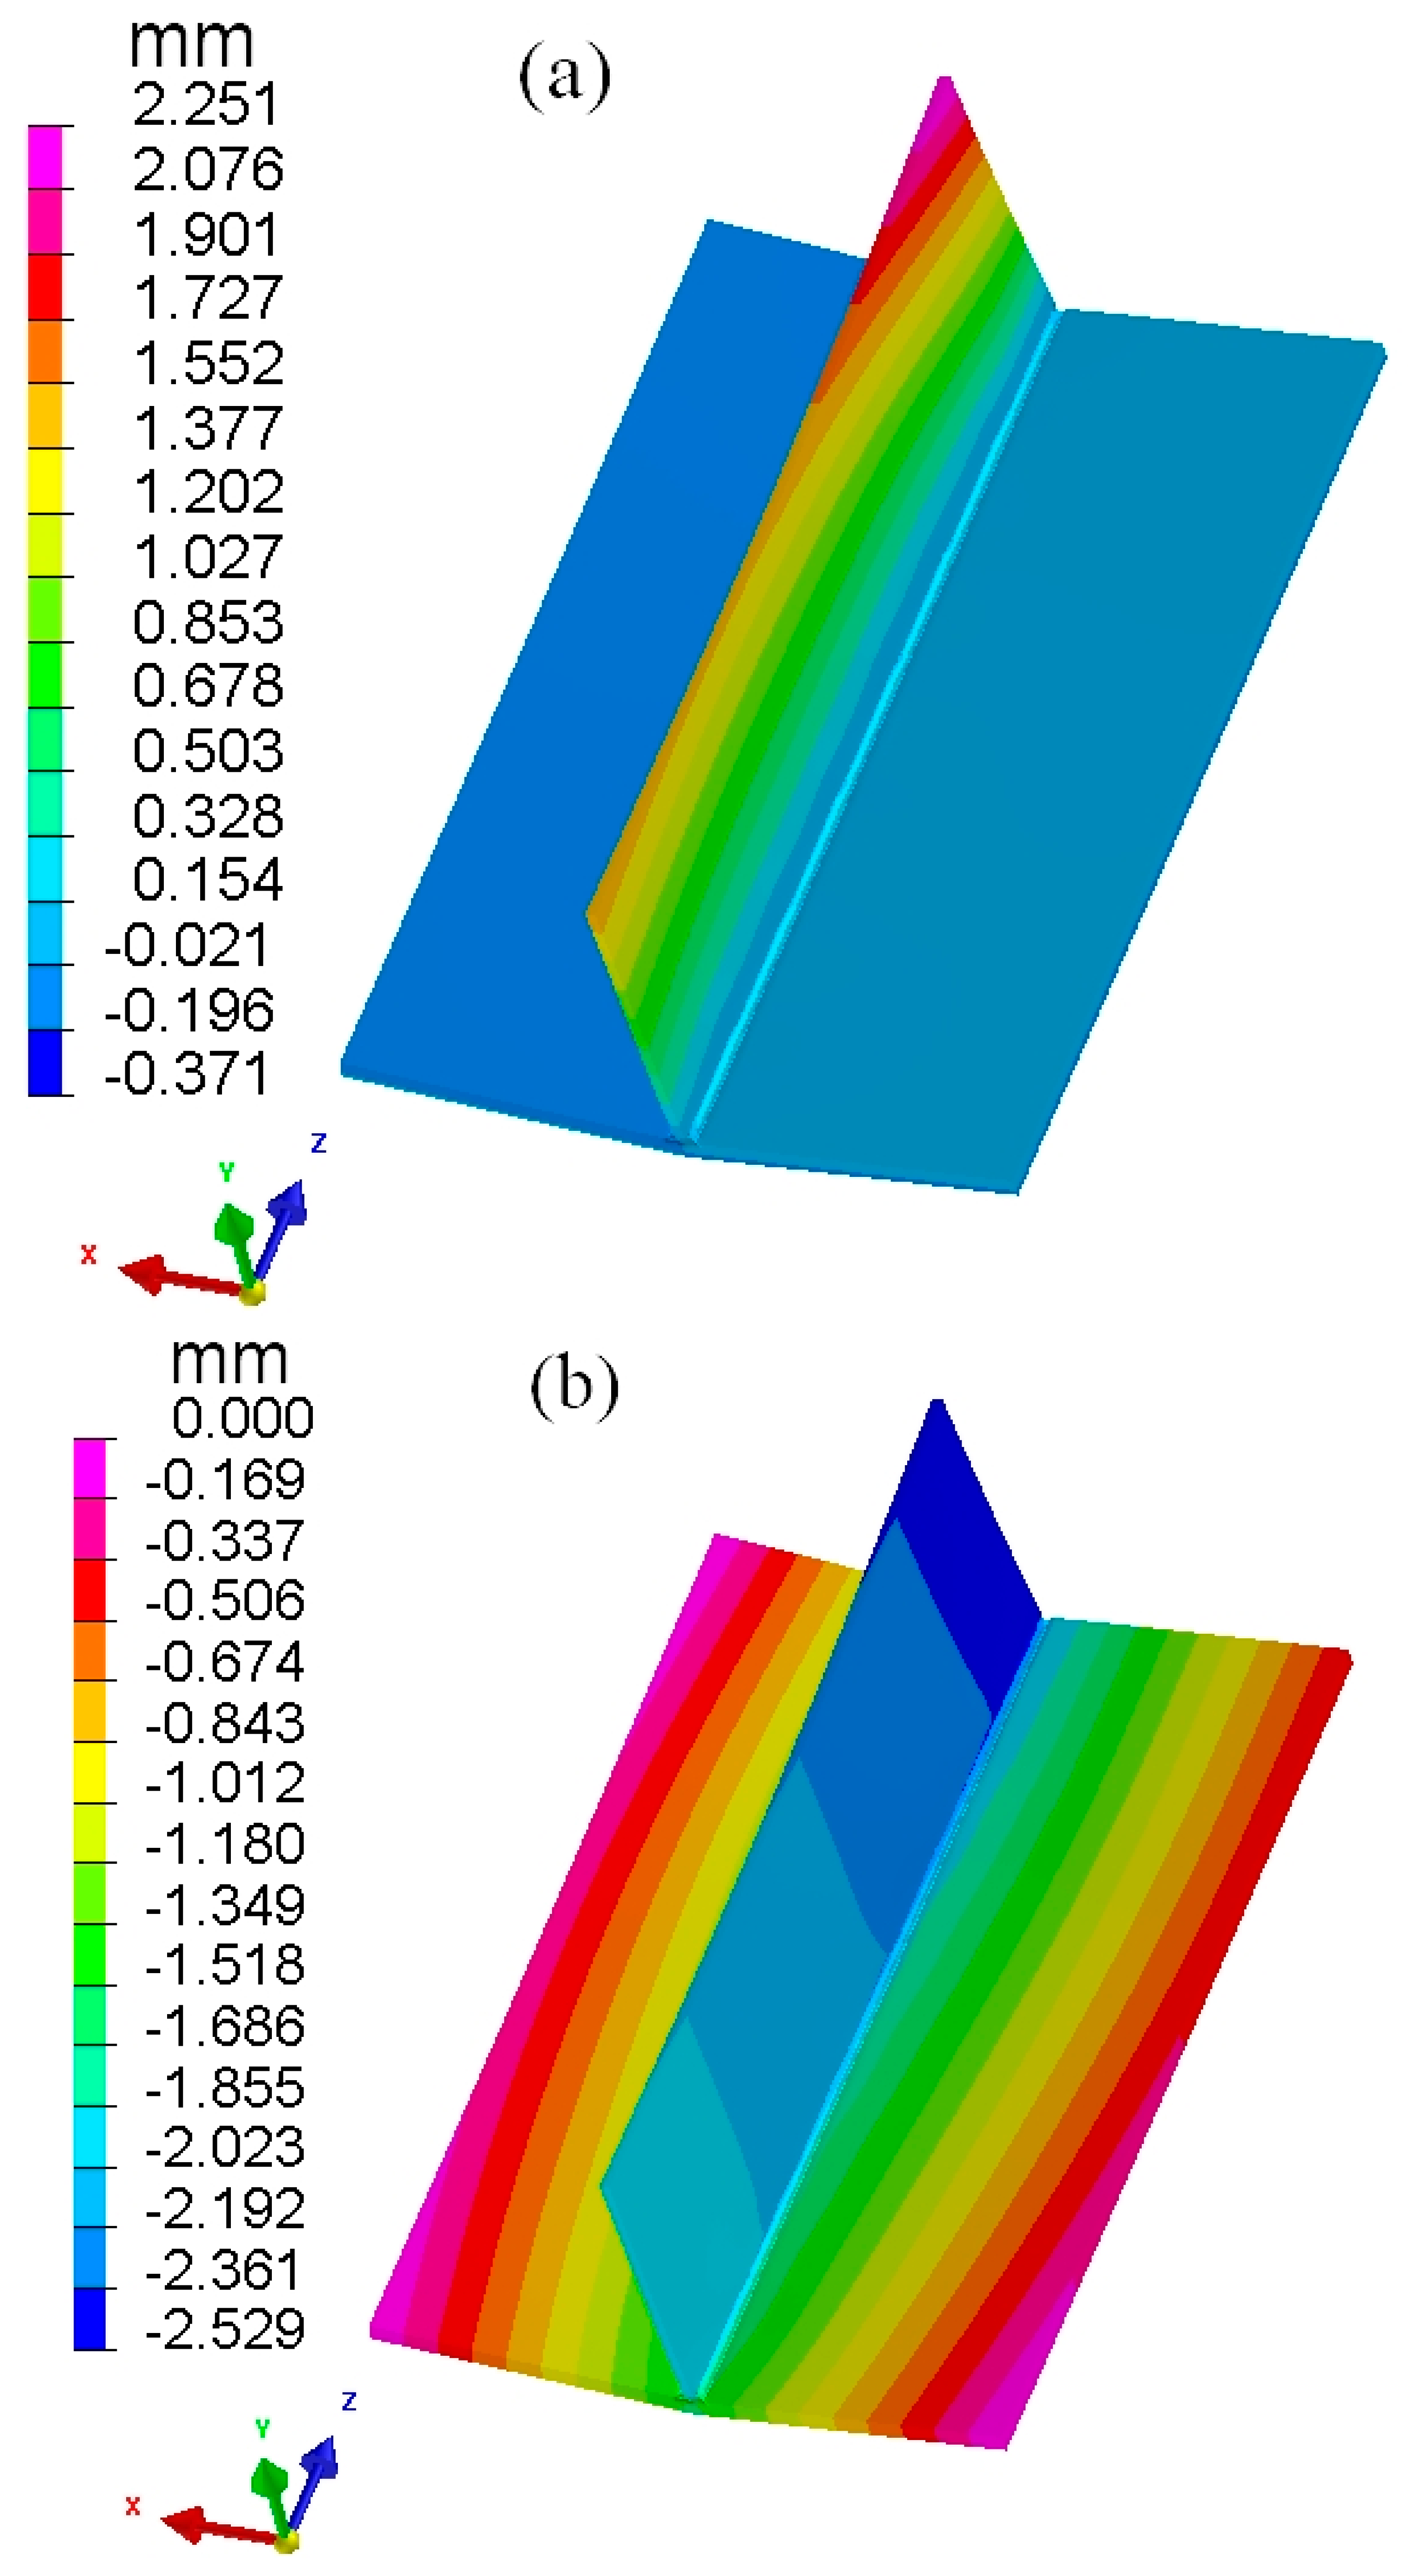
The process for using the step-by-step loading of the inherent strain is illustrated in Figure 13, which illustrates the loading of the first, fourth, sixth and seventh steps of the inherent strain near a weld seam. The calculated overall welding deformation is shown in Figure 14 and the calculated welding deformation in the X- and Y-directions is shown in Figure 15. From Figure 14 and Figure 15, it can be seen that the welding deformation calculated based on the SBS-ISM is consistent with the features of the welding deformation for the T-shaped structure. A comparison of the deformation cloud maps calculated using the TEP-FEM and SBS-ISM shows that there are good agreement between the overall welding deformation trend and the welding deformation trends in the main directions.
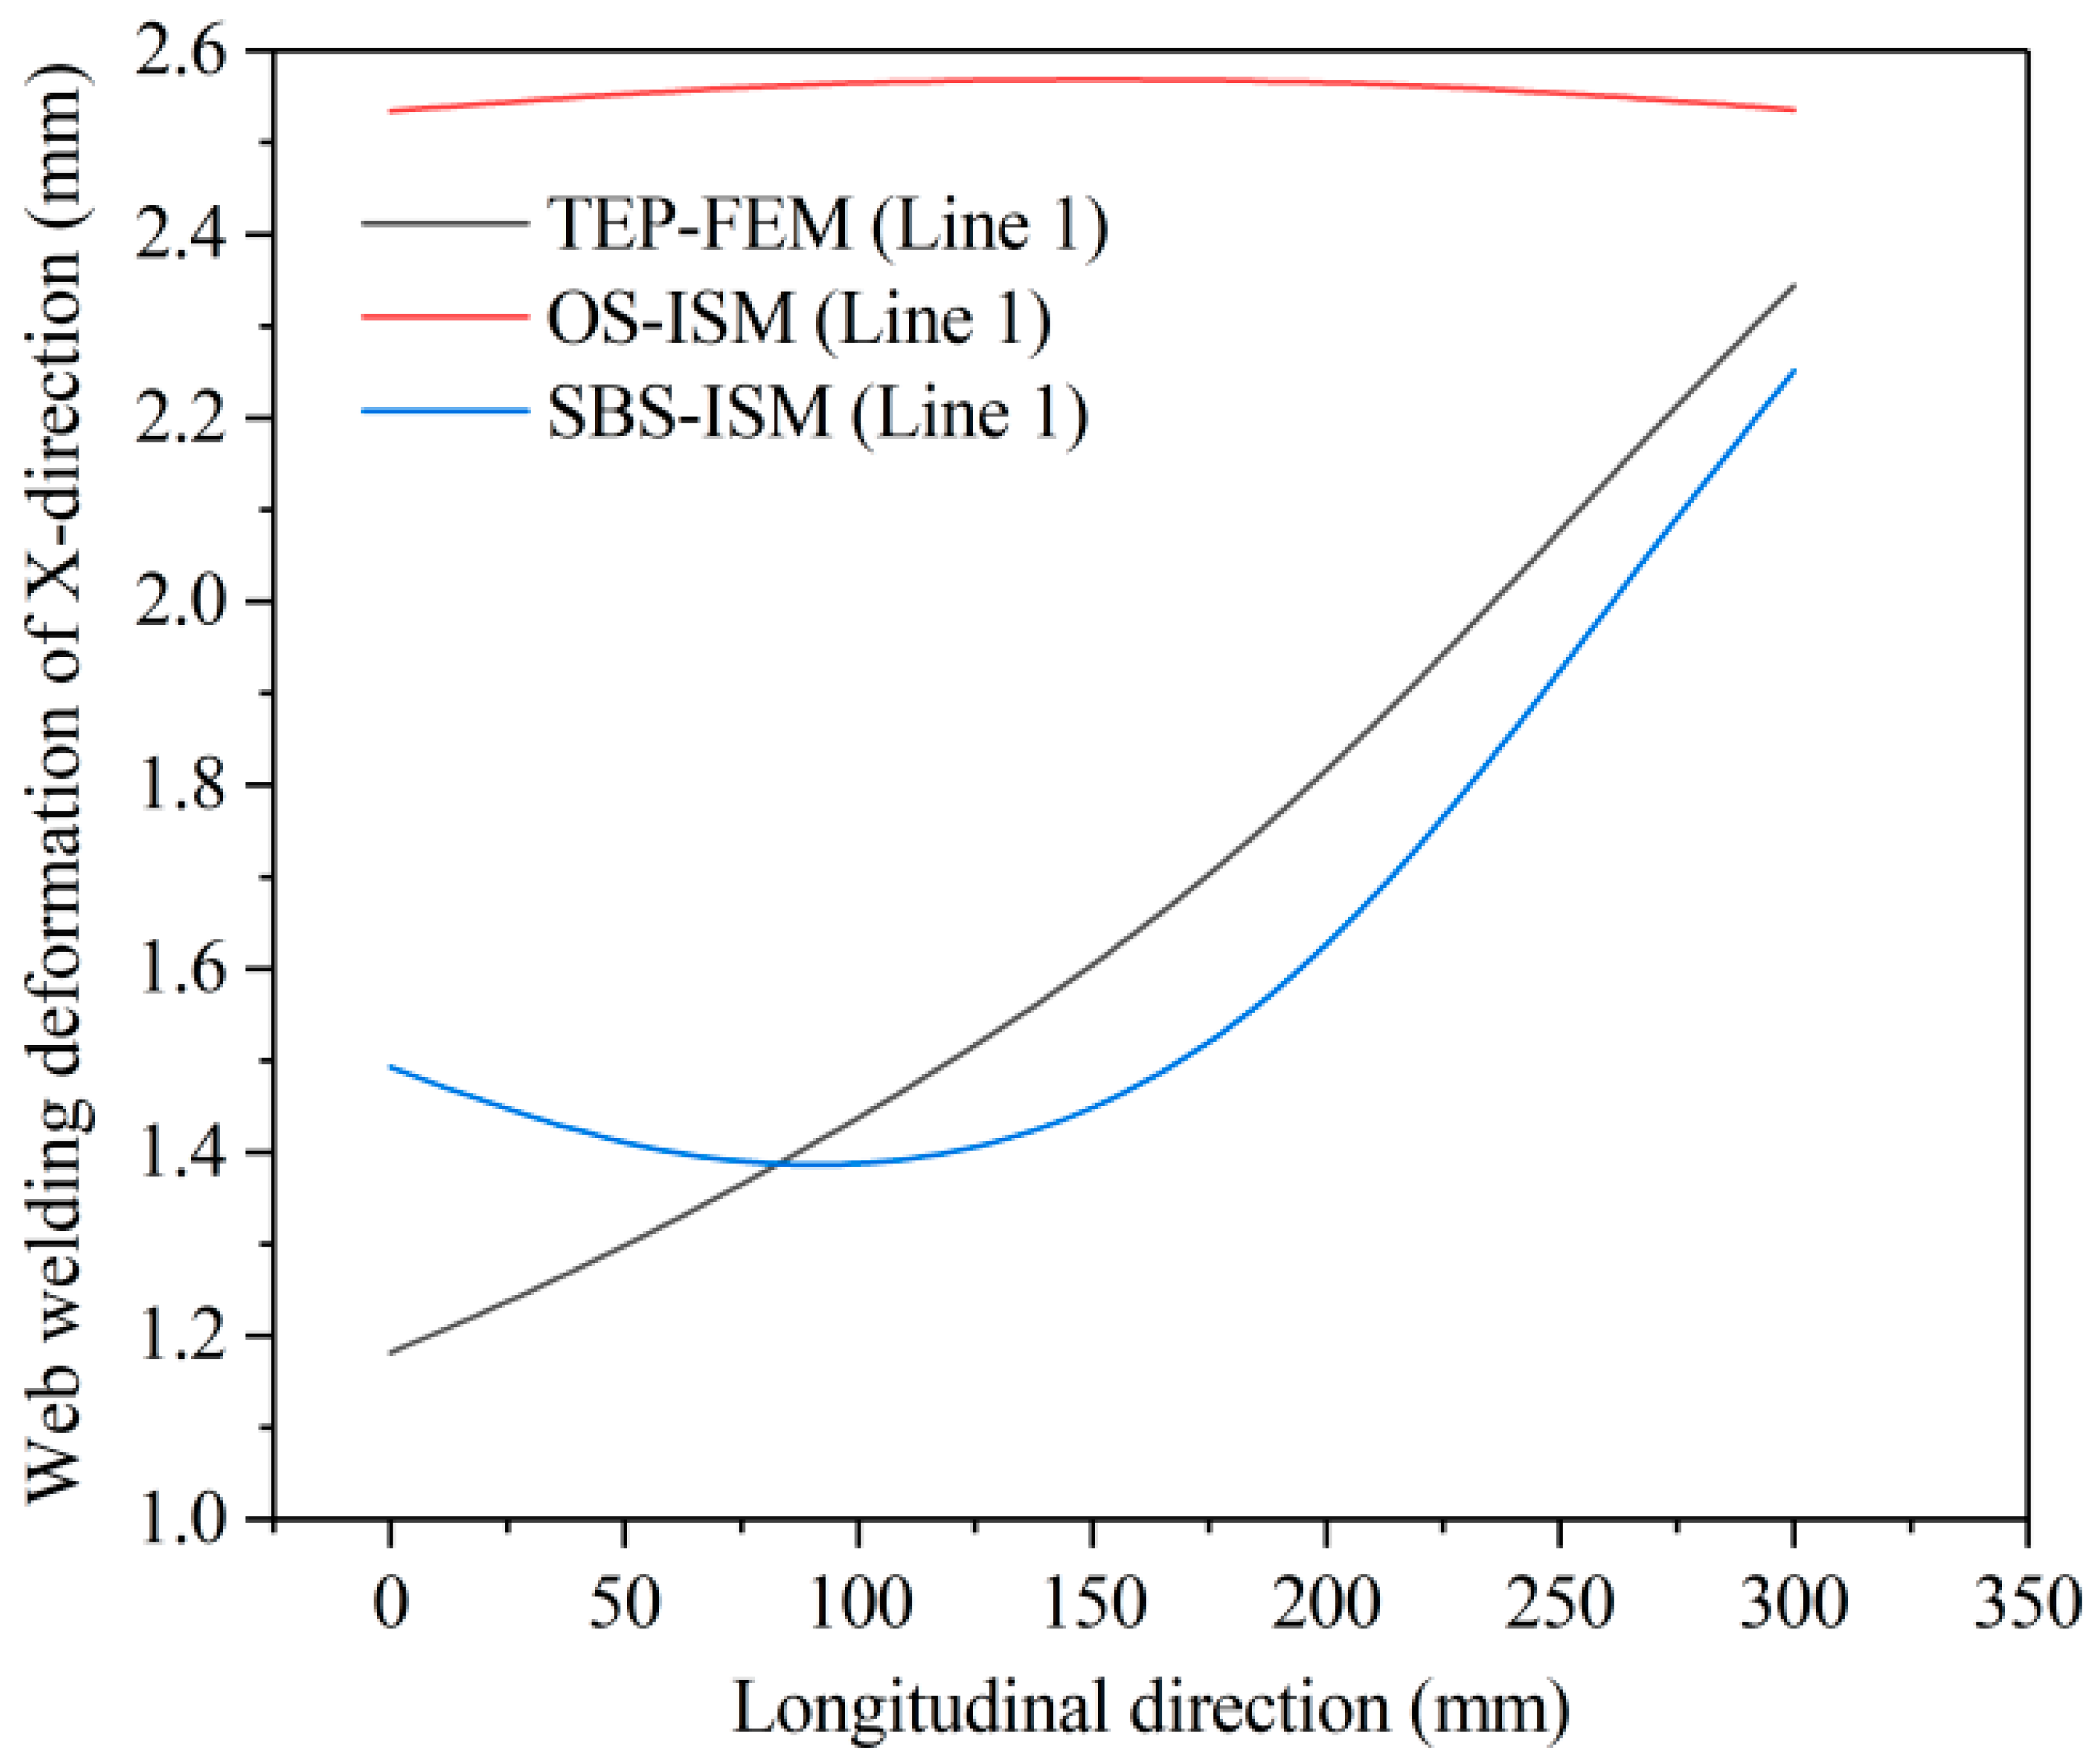
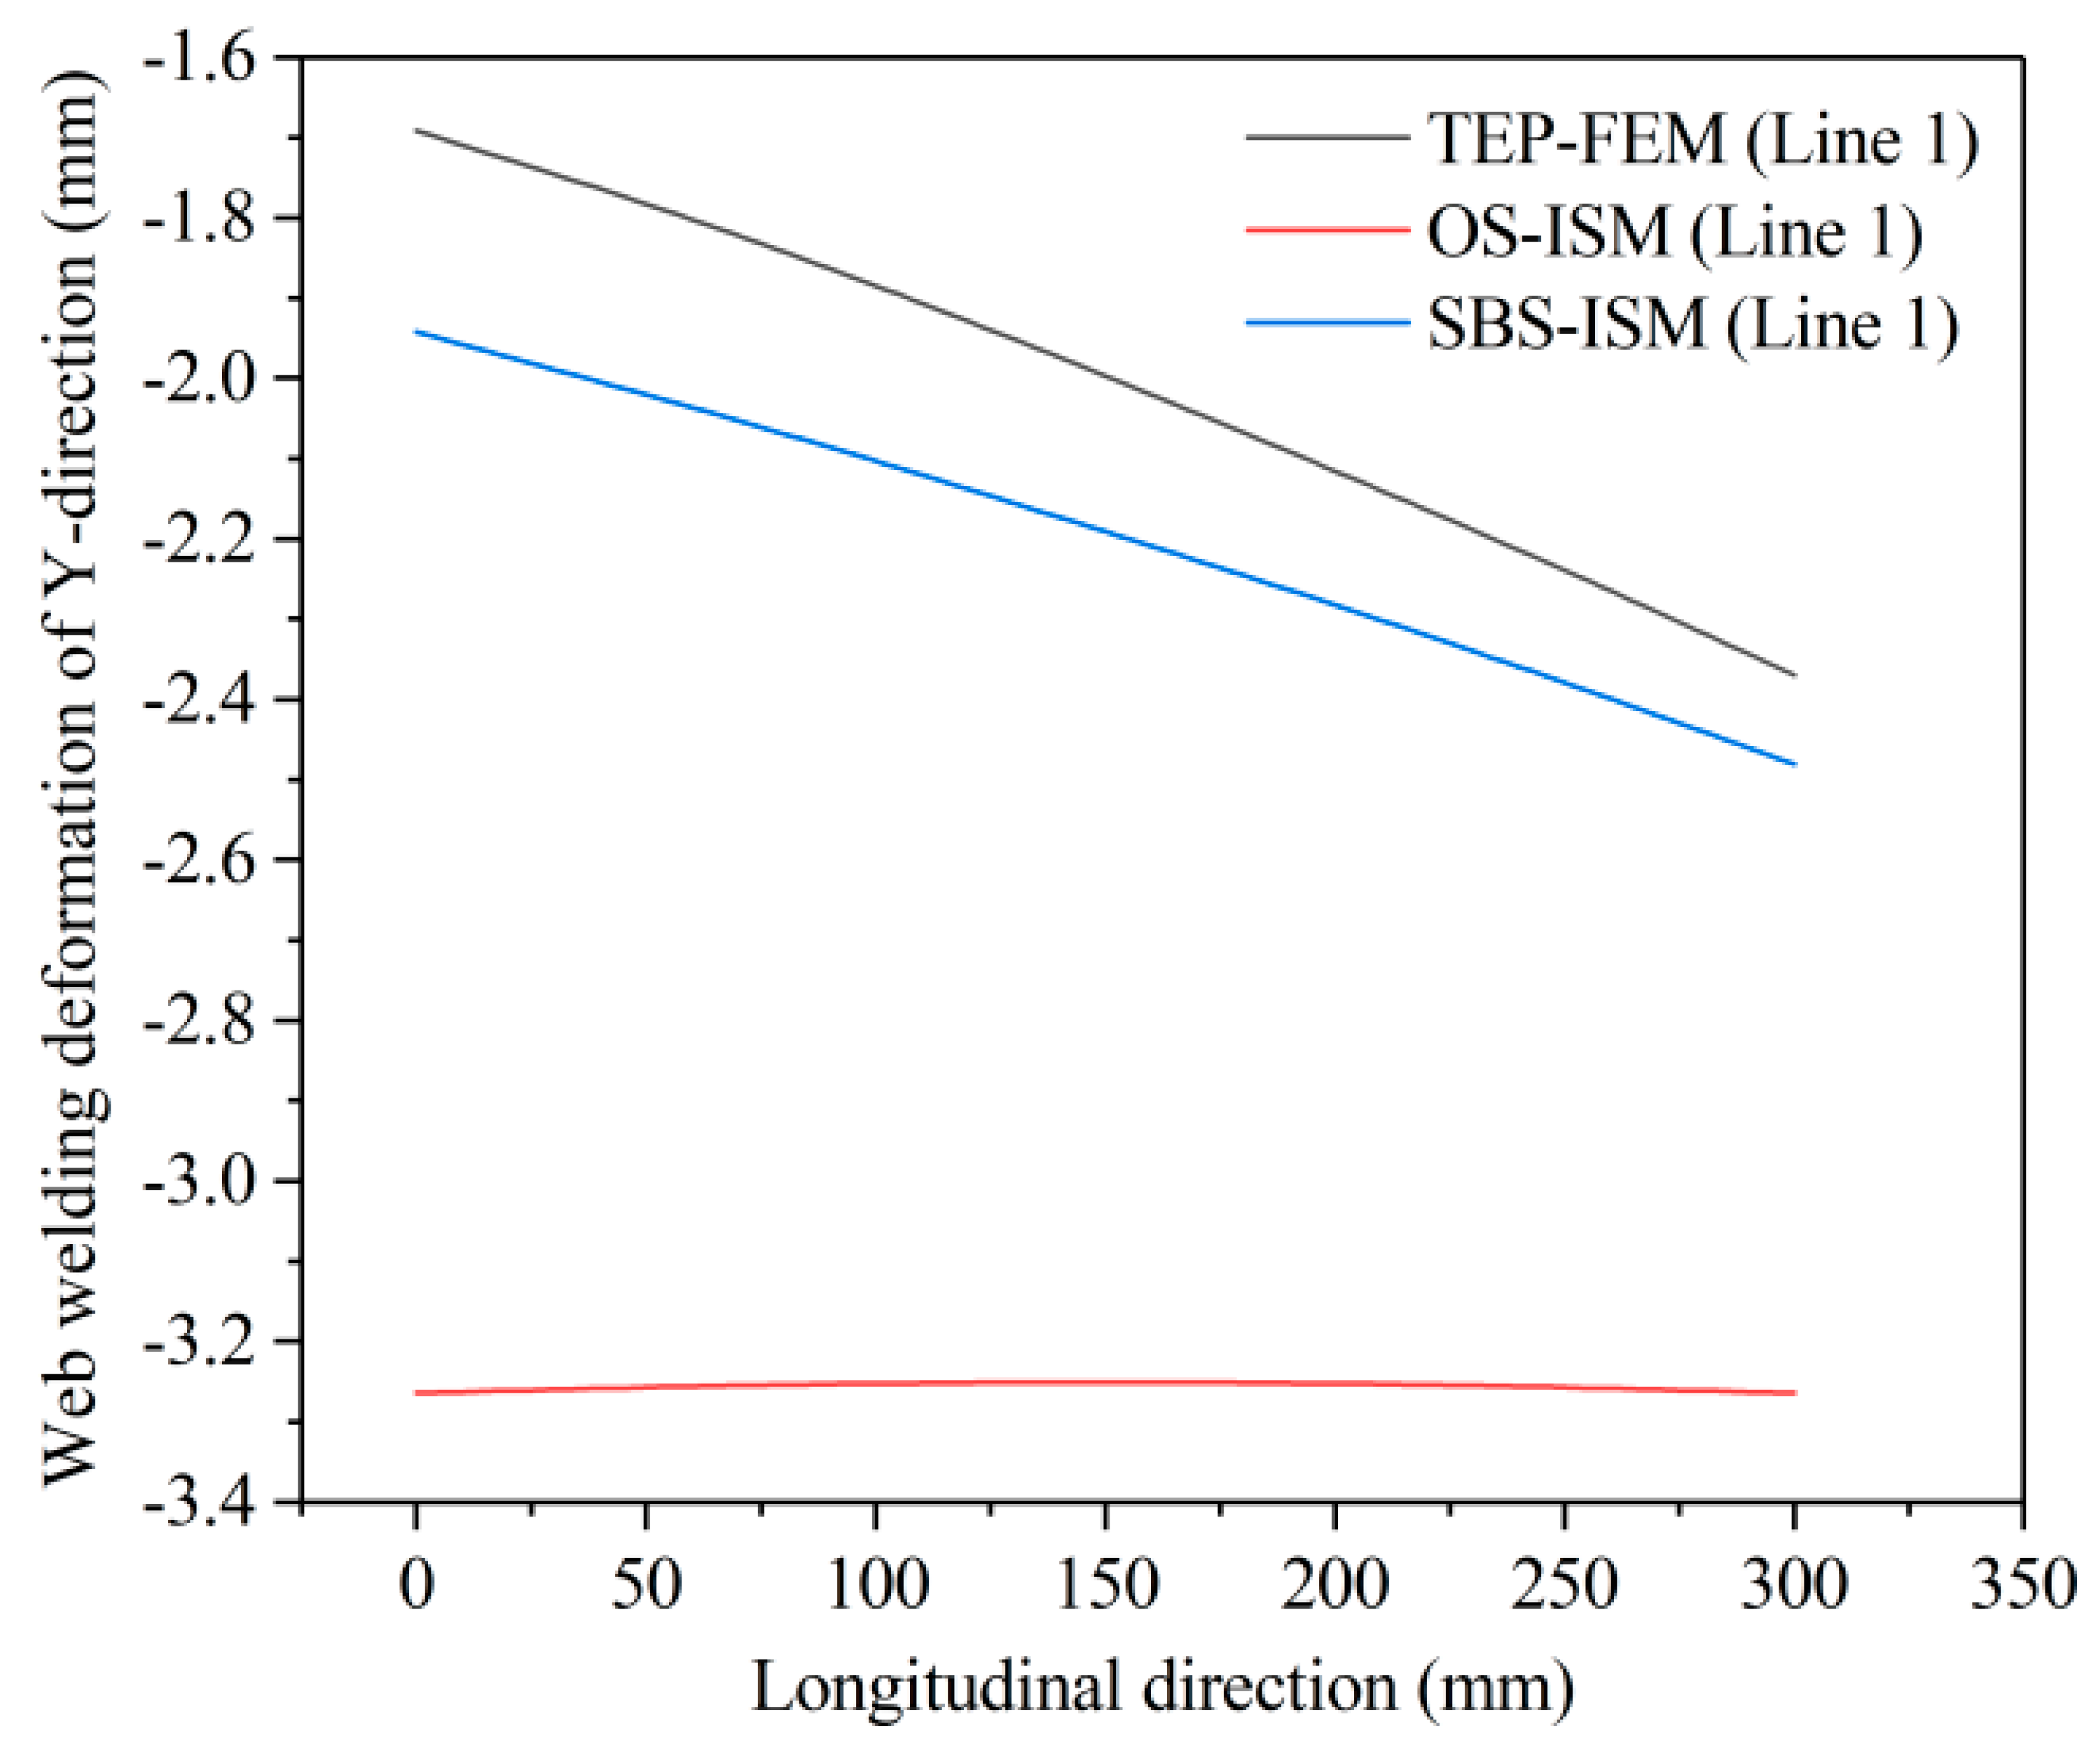
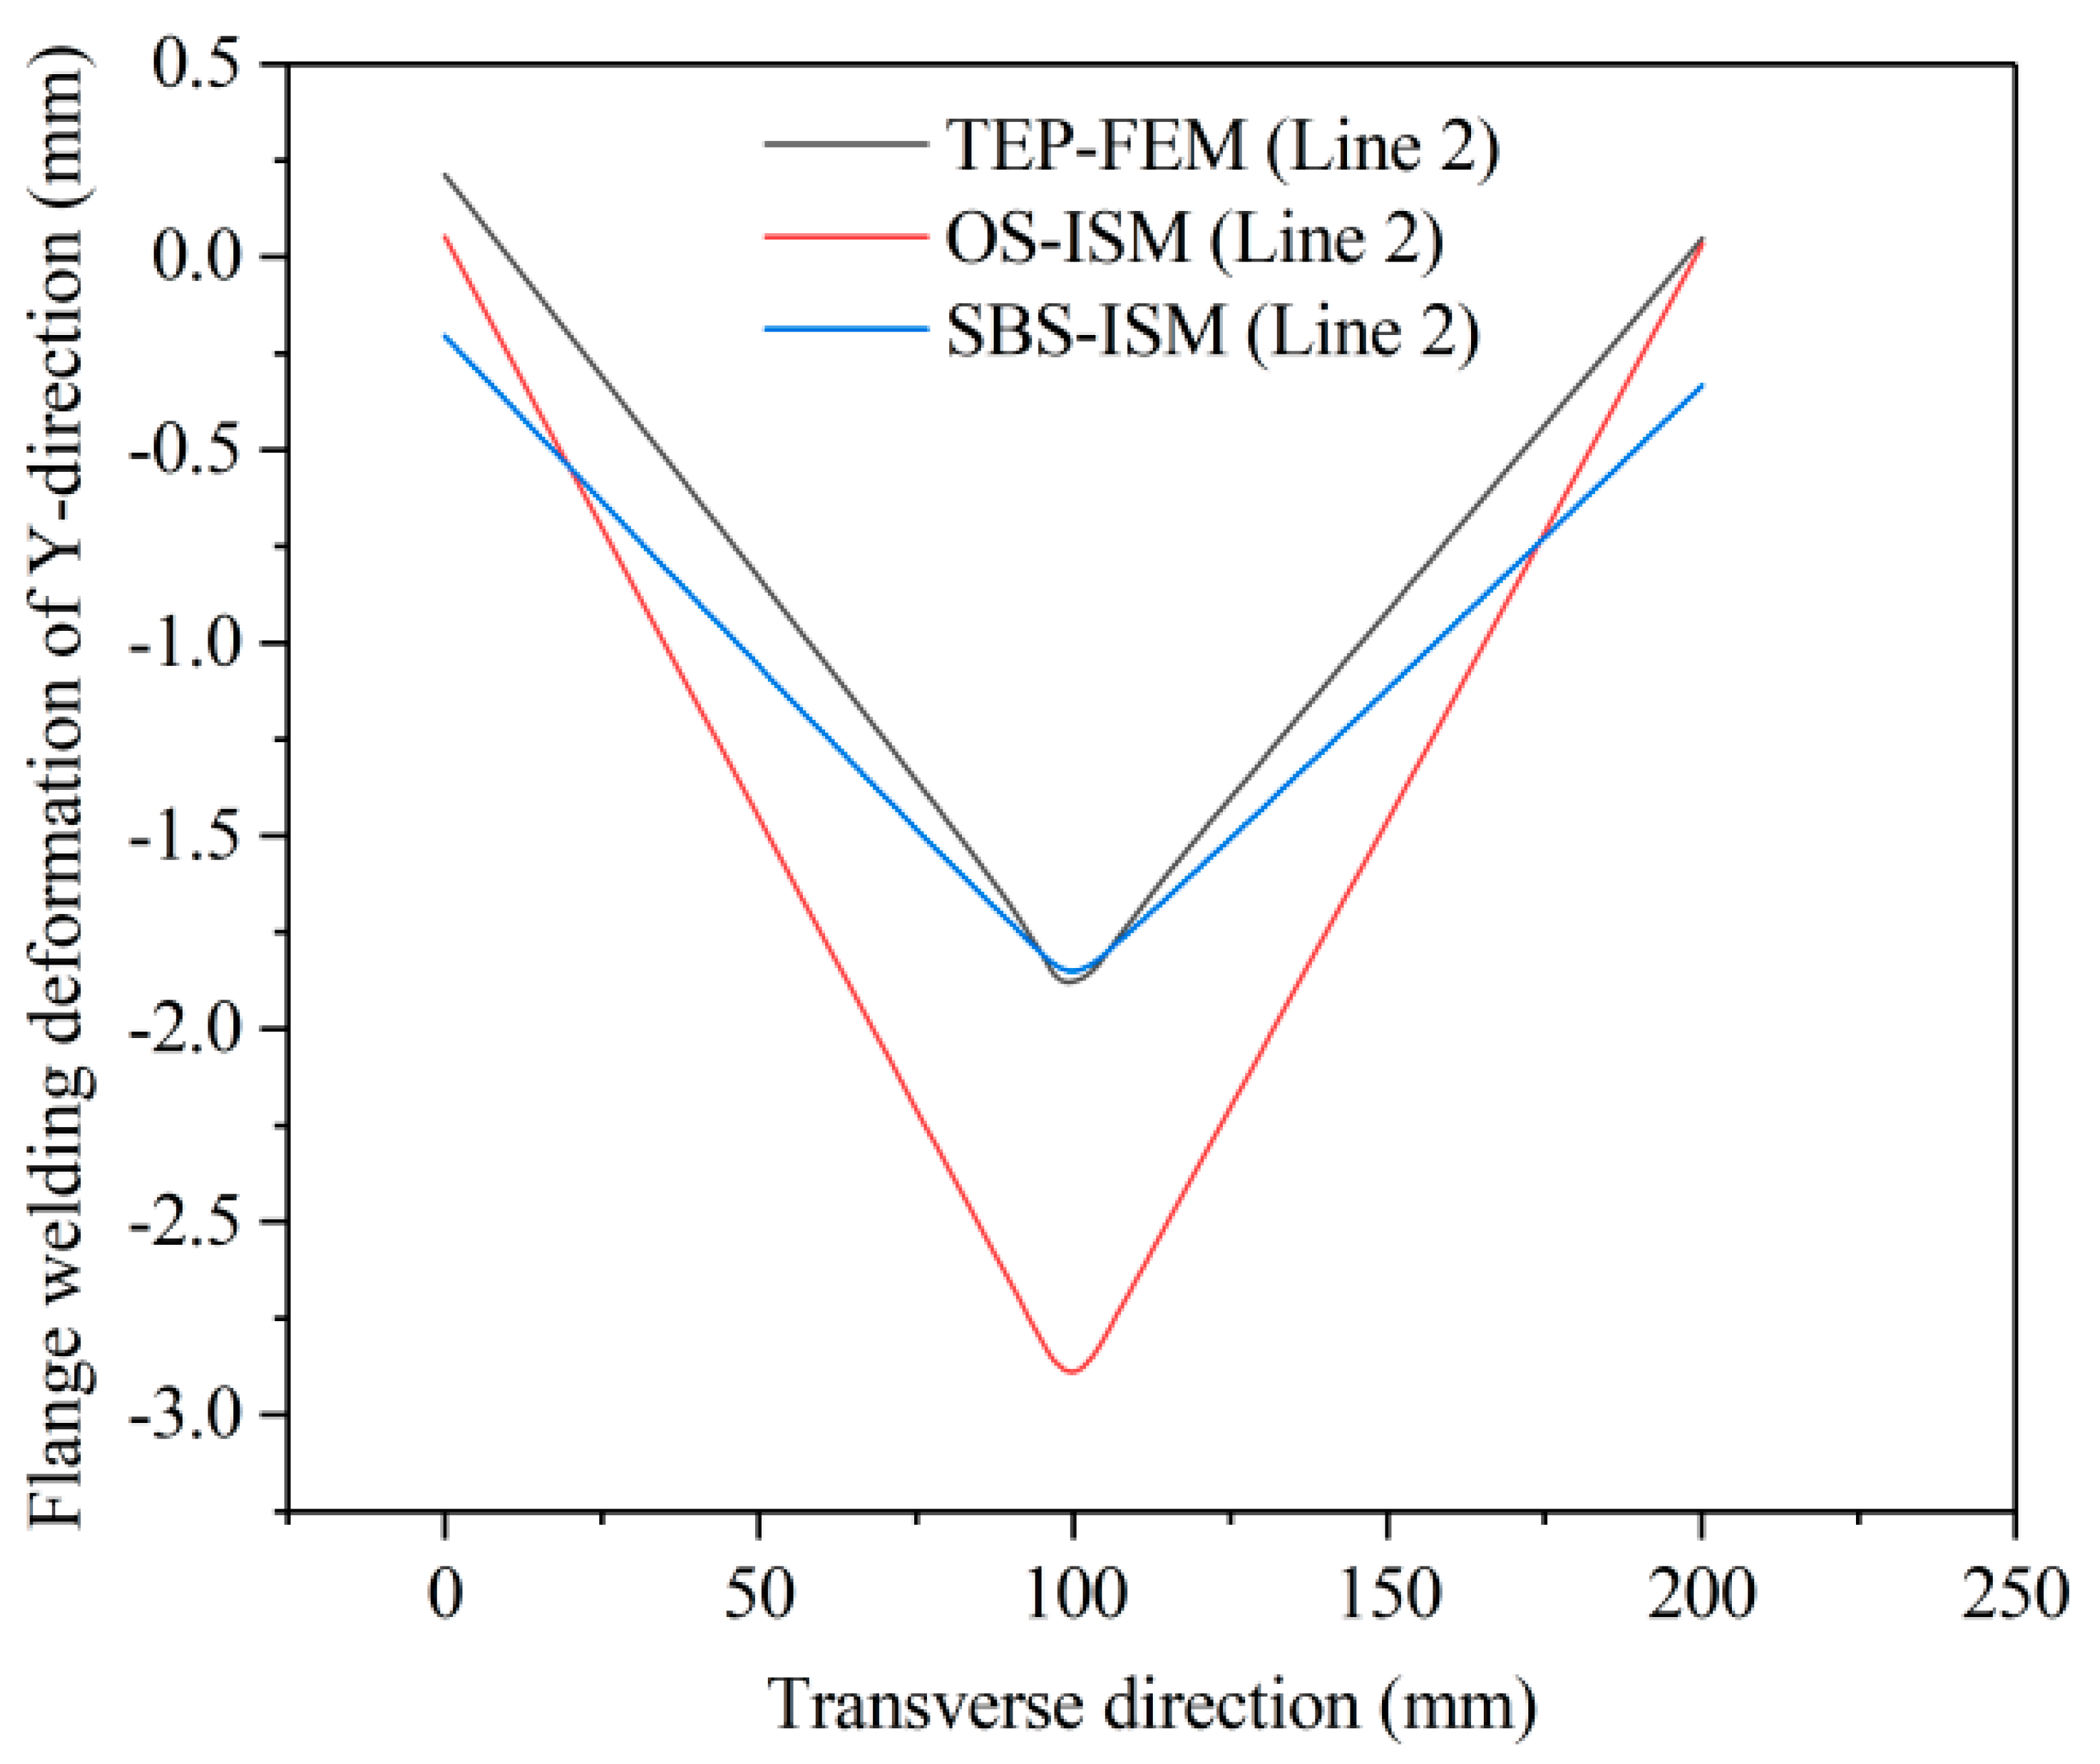
The results calculated with the TEP-FEM were used as a benchmark to evaluate the errors computed using the OS-ISM and SBS-ISM, and the maximum welding deformation in the relevant direction is shown in Table 4. In order to compare the differences between the three calculation methods in more detail and intuitively, the out-of-plane or in-plane deformation of Line 1 and Line 2 shown in Figure 5a were used to characterize the trend and magnitude of the welding deformation, and the relevant results are compared in Figure 16, Figure 17 and Figure 18.
As can be seen from Table 4, the maximum deformations calculated using the OS-ISM are greater than the TEP-FEM and SBS-ISM in the main directions. The calculation results of the TEP-FEM were used as the benchmark, and the OS-ISM was used to calculate the main directions of the welding deformation error to be a minimum of 9.6%, while the principal direction of the welding deformation error was calculated to be an angle error of more than 35%; however, the errors in the main directions of the welding deformation calculated using the SBS-ISM were within 5%; the minimum error was less than 1%. As can be seen in Figure 16, Figure 17 and Figure 18, the trends and magnitudes of welding deformation in the main directions calculated using the SBS-ISM are in good agreement with the TEP-FEM, while using the OS-ISM, there is a significant difference between the deformation trend and magnitude of deformation with the TEP-FEM and SBS-ISM.
One of the most important reasons why the results of the OS-ISM calculations differ significantly from those of the TEP-FEM and SBS-ISM calculations is that the OS-ISM predicts welding deformation by loading the inherent strain into the entire weld in one step. In fact, referring to Figure 9, during the welding process the heat source moves forward at a certain speed and the molten pool at the tail of the heat source solidifies and shrinks under the influence of thermal convection and thermal radiation, i.e., the heat source moves forward, and the heat affected zone at the tail of the heat source gradually cools to produce residual plastic strain. The solidification of the weld seam at the previous moment has an effect on the welding deformation caused by the shrinkage of the subsequent weld seam. The final welding deformation is the result of the interaction and accumulation of residual plastic strains, i.e., inherent strains, generated at different moments. However, the OS-ISM does not take into account the gradual generation of inherent strain in the calculation process, ignoring the fact that the welding deformation generated by the inherent strain in the previous moment has an effect on the subsequent deformation, resulting in a large error in the predicted results of the OS-ISM compared to both the TEP-FEM and SBS-ISM.
By employing the SBS-ISM, not only does it ensure the same level of accuracy in predicting welding deformation as the TEP-FEM, but it also utilizes a linear calculation method that significantly reduces computation time. Using the local finite element of the T-shaped structure as an example, although the SBS-ISM takes longer than the OS-ISM, the computation time of the SBS-ISM is only 1% of the TEP-FEM while ensuring the same level of prediction accuracy. Therefore, the SBS-ISM is more suitable for predicting welding deformation in large and complex thin-walled T-shaped structural components.

5. Prediction of Welding Deformation for the Backward Centrifugal Fan Impeller

The inherent strain (i.e., 0.0589 and 0.0750) obtained from the TEP-FEM-based calculations above was loaded by modifying the thermal expansion coefficient of the material in the vicinity of the impeller weld seam. To speed up the time spent on numerical simulations and to ensure the accuracy of the results, first, the OS-ISM was used to compute welding deformations generated under different welding sequences, compare the predicted welding deformations, and find the best welding sequence. Subsequently, based on the optimal welding sequence, the final welding deformation trends and magnitudes were calculated using the SBS-ISM, which was combined with experiments for validation.

5.1. The Mesh and Constraints of the Backward Centrifugal Fan Impeller

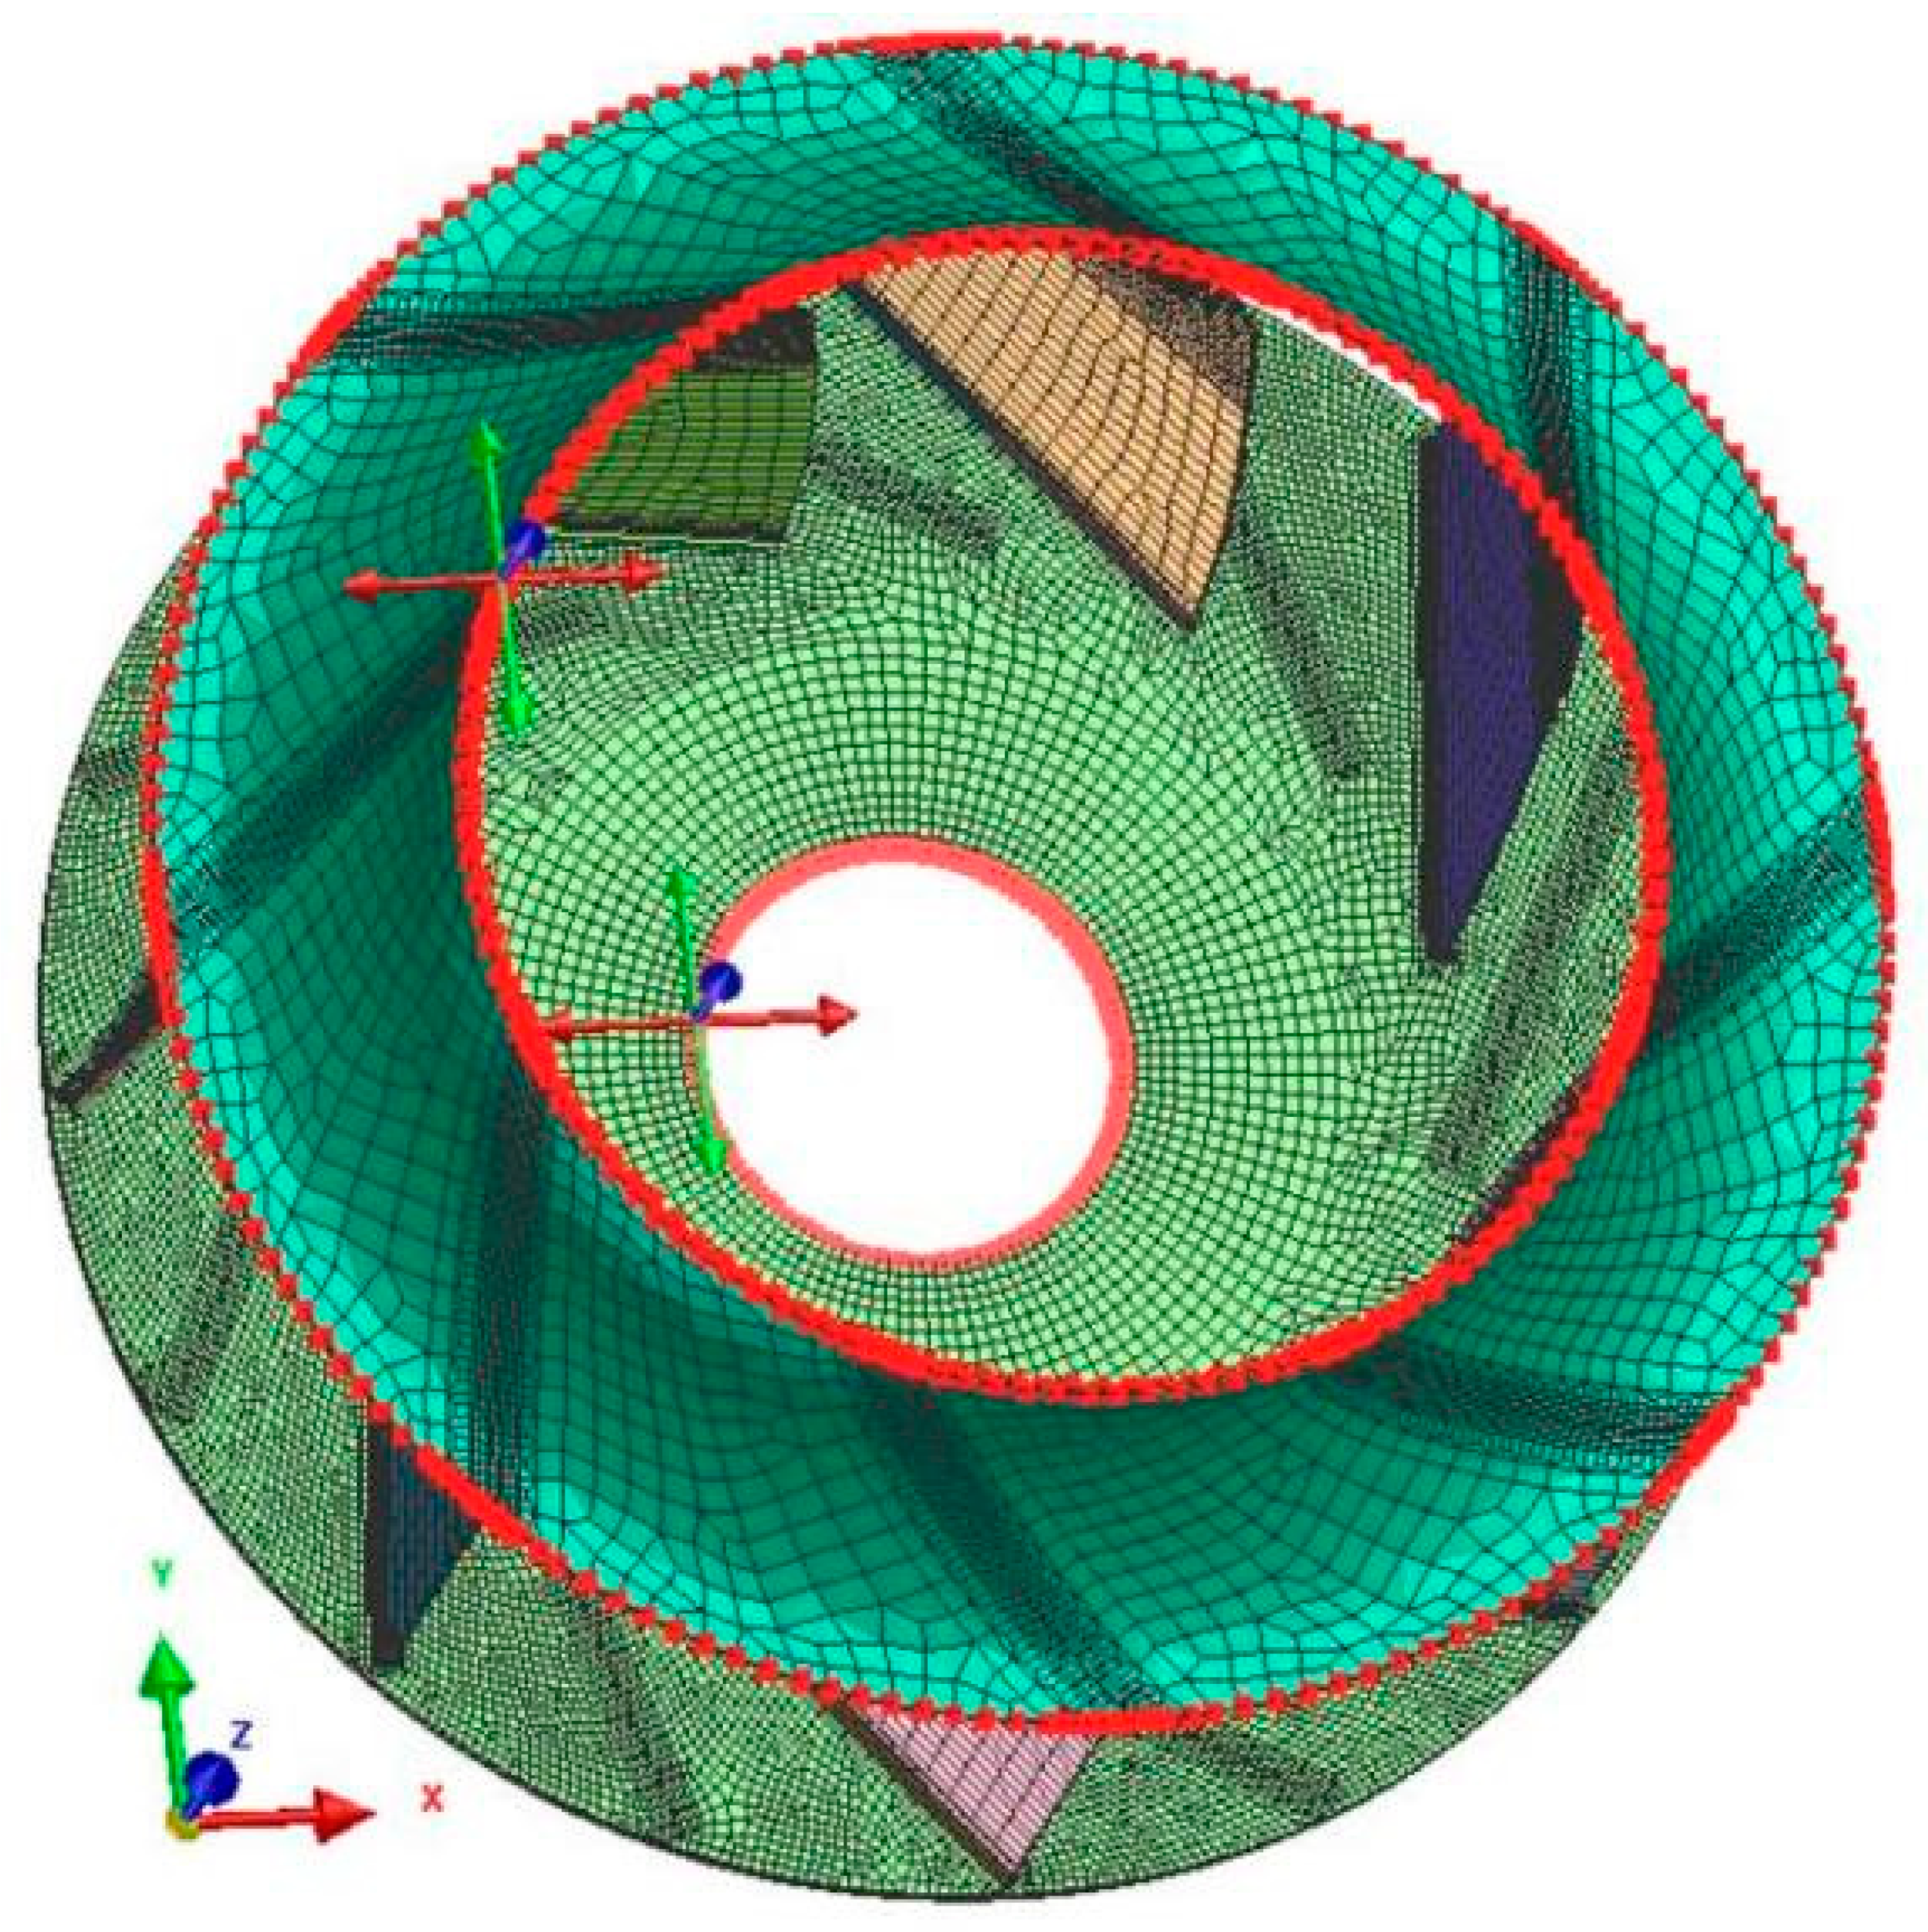
In order to investigate the effect of all weld seams in different welding sequences on the welding deformation of the backward centrifugal fan impeller, the impeller was meshed in 3D using HyperMesh 2019 software. The mesh type was dominated by hexahedral meshes. To reduce the computational time and ensure the accuracy of the analysis, the mesh was encrypted in the region close to the weld seam and sparsely meshed in the region away from the weld seam. The impeller and constraints after the mesh was divided are shown in Figure 19.

5.2. Welding Sequence Schemes of the Backward Centrifugal Fan Impeller

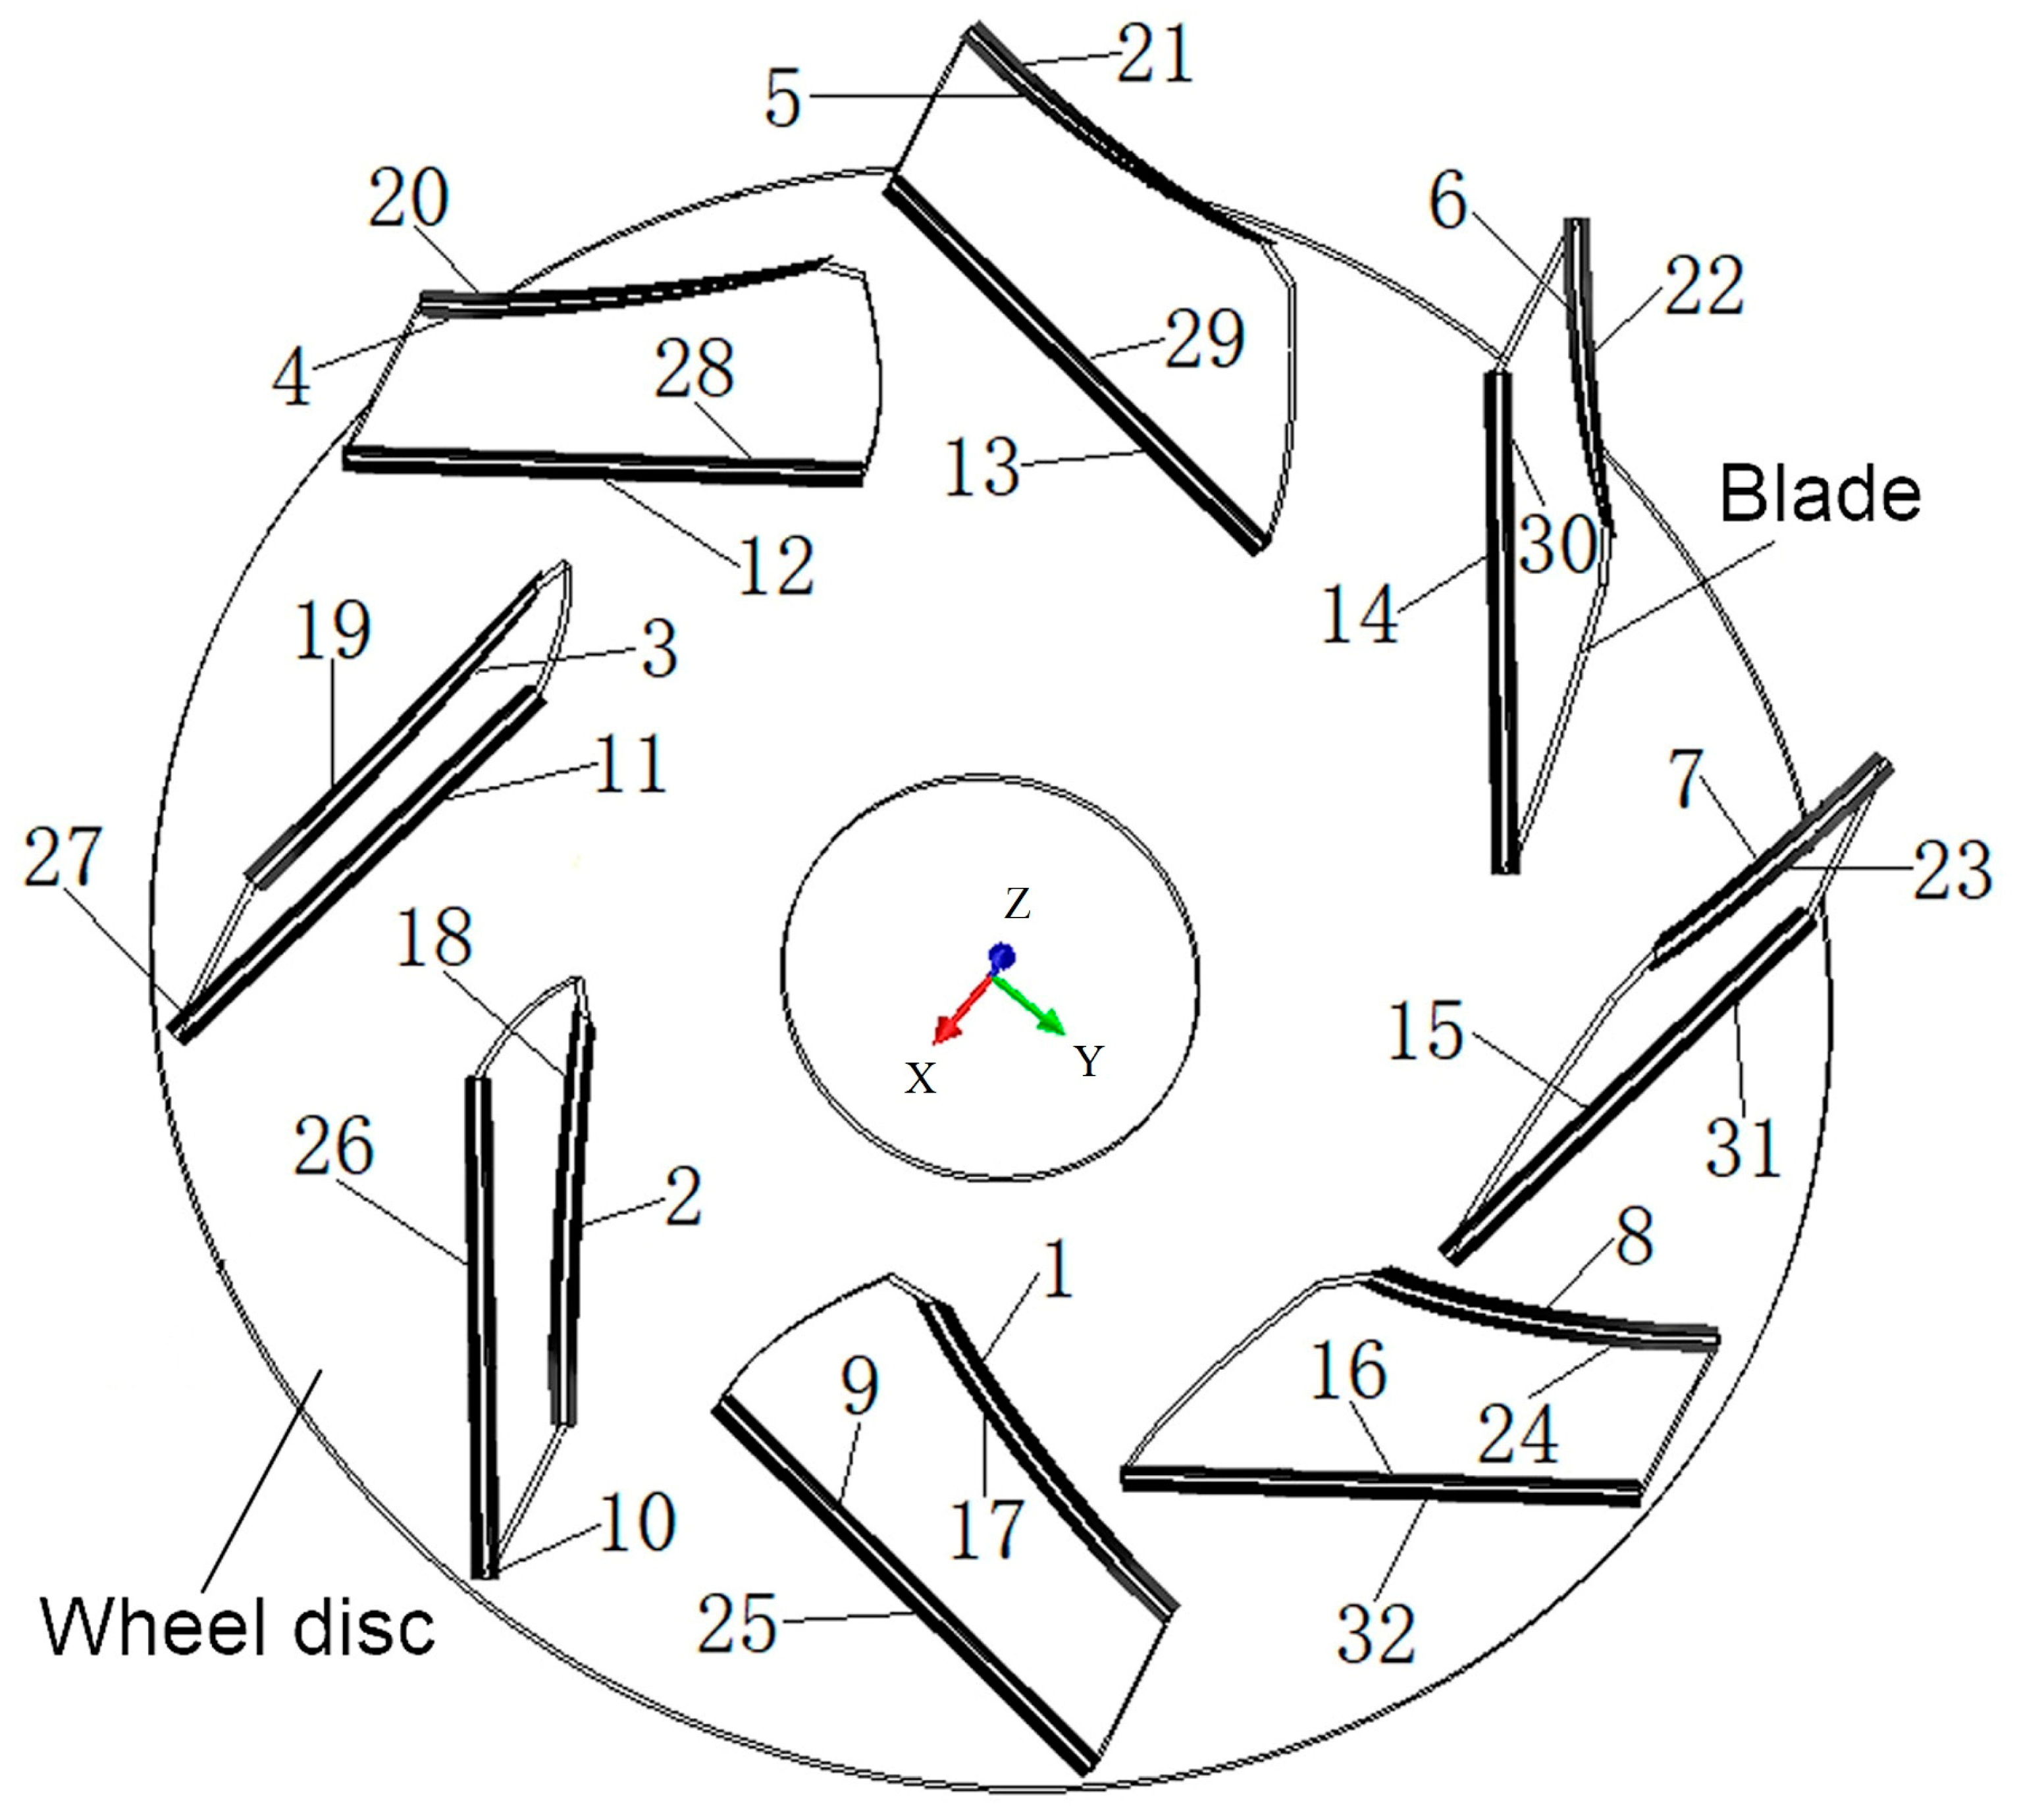
To facilitate the illustration of the welding sequence, the weld seams on the impeller were marked in advance. As shown in Figure 20, The markings 1 → 8 are the weld seams on the right side of the blades connected to the wheel cover, 9 → 16 are the weld seams on the right side of the blades connected to the wheel disc, 17 → 24 are the weld seams on the left side of the blades connected to the wheel cap and 25 → 32 are the weld seams on the left side of the blades connected to the wheel disc. Since there are 32 weld seams and countless permutations of welding sequences, it is not possible to numerically simulate the resulting deformations under all welding sequences. Therefore, this study developed three typical welding sequence schemes based on the way the welding positioner operated and adjusted the stance in the robotic welding system, as shown in Table 5.

6. Results and Discussion

6.1. OS-ISM-Calculated Welding Deformation

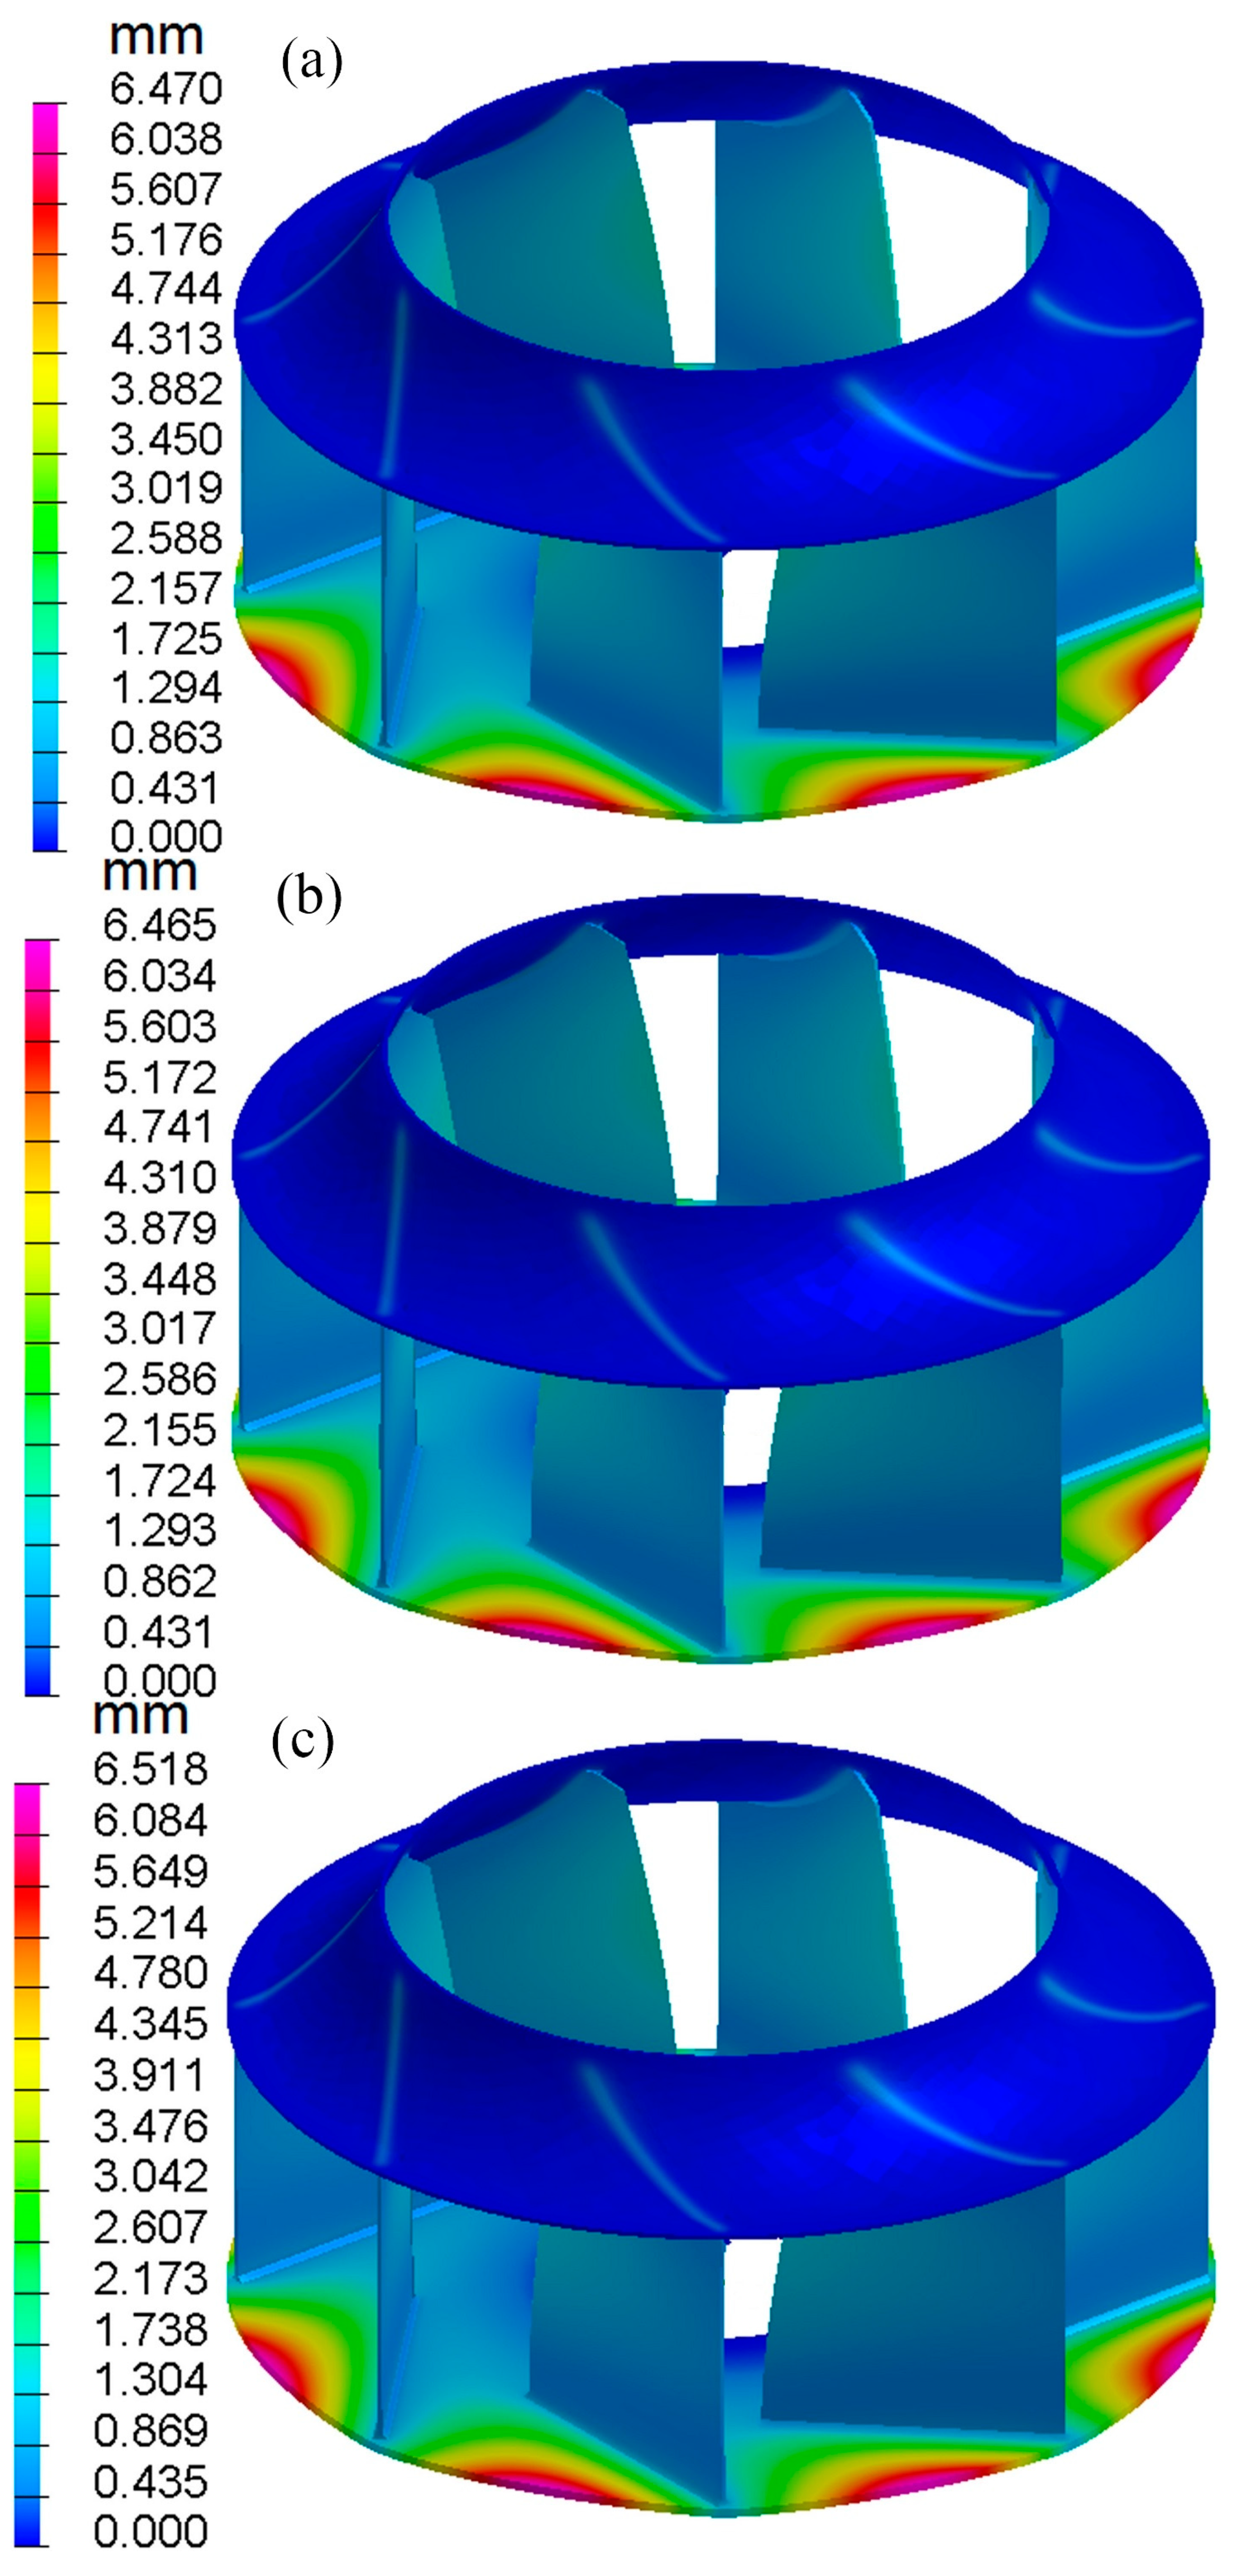
The conditions for the welding simulation were set as required in the program, and numerical simulations were performed using the OS-ISM to produce results for the welding deformation for different welding sequences, as shown in Figure 21.
As can be seen from Figure 21, the overall deformation after welding is consistent when the welding sequence is changed to ensure that the other welding conditions are the same. Significant post-welding deformation locations all appear at the outer edge of the wheel disc between the two blades, with upward warping deformation and wave deformation along the outer edge of the wheel disc. However, the three welding sequences produced some differences in the maximum post-welding deformation in each direction, as shown in Table 6.
As can be seen from Table 6, different welding sequences produce the maximum deformation in the Z-direction, the maximum deformation in the X- and Y-directions in their respective welding sequences are similar; Scheme 3 is relative to Scheme 1 and Scheme 2 in the X- and Y-directions in reducing the maximum deformation by more than 7%, but the overall and maximum deformations in the Z-direction are only 0.8% higher. Therefore, the welding sequence of Scheme 3 is optimal.

6.2. SBS-ISM-Calculated Welding Deformation

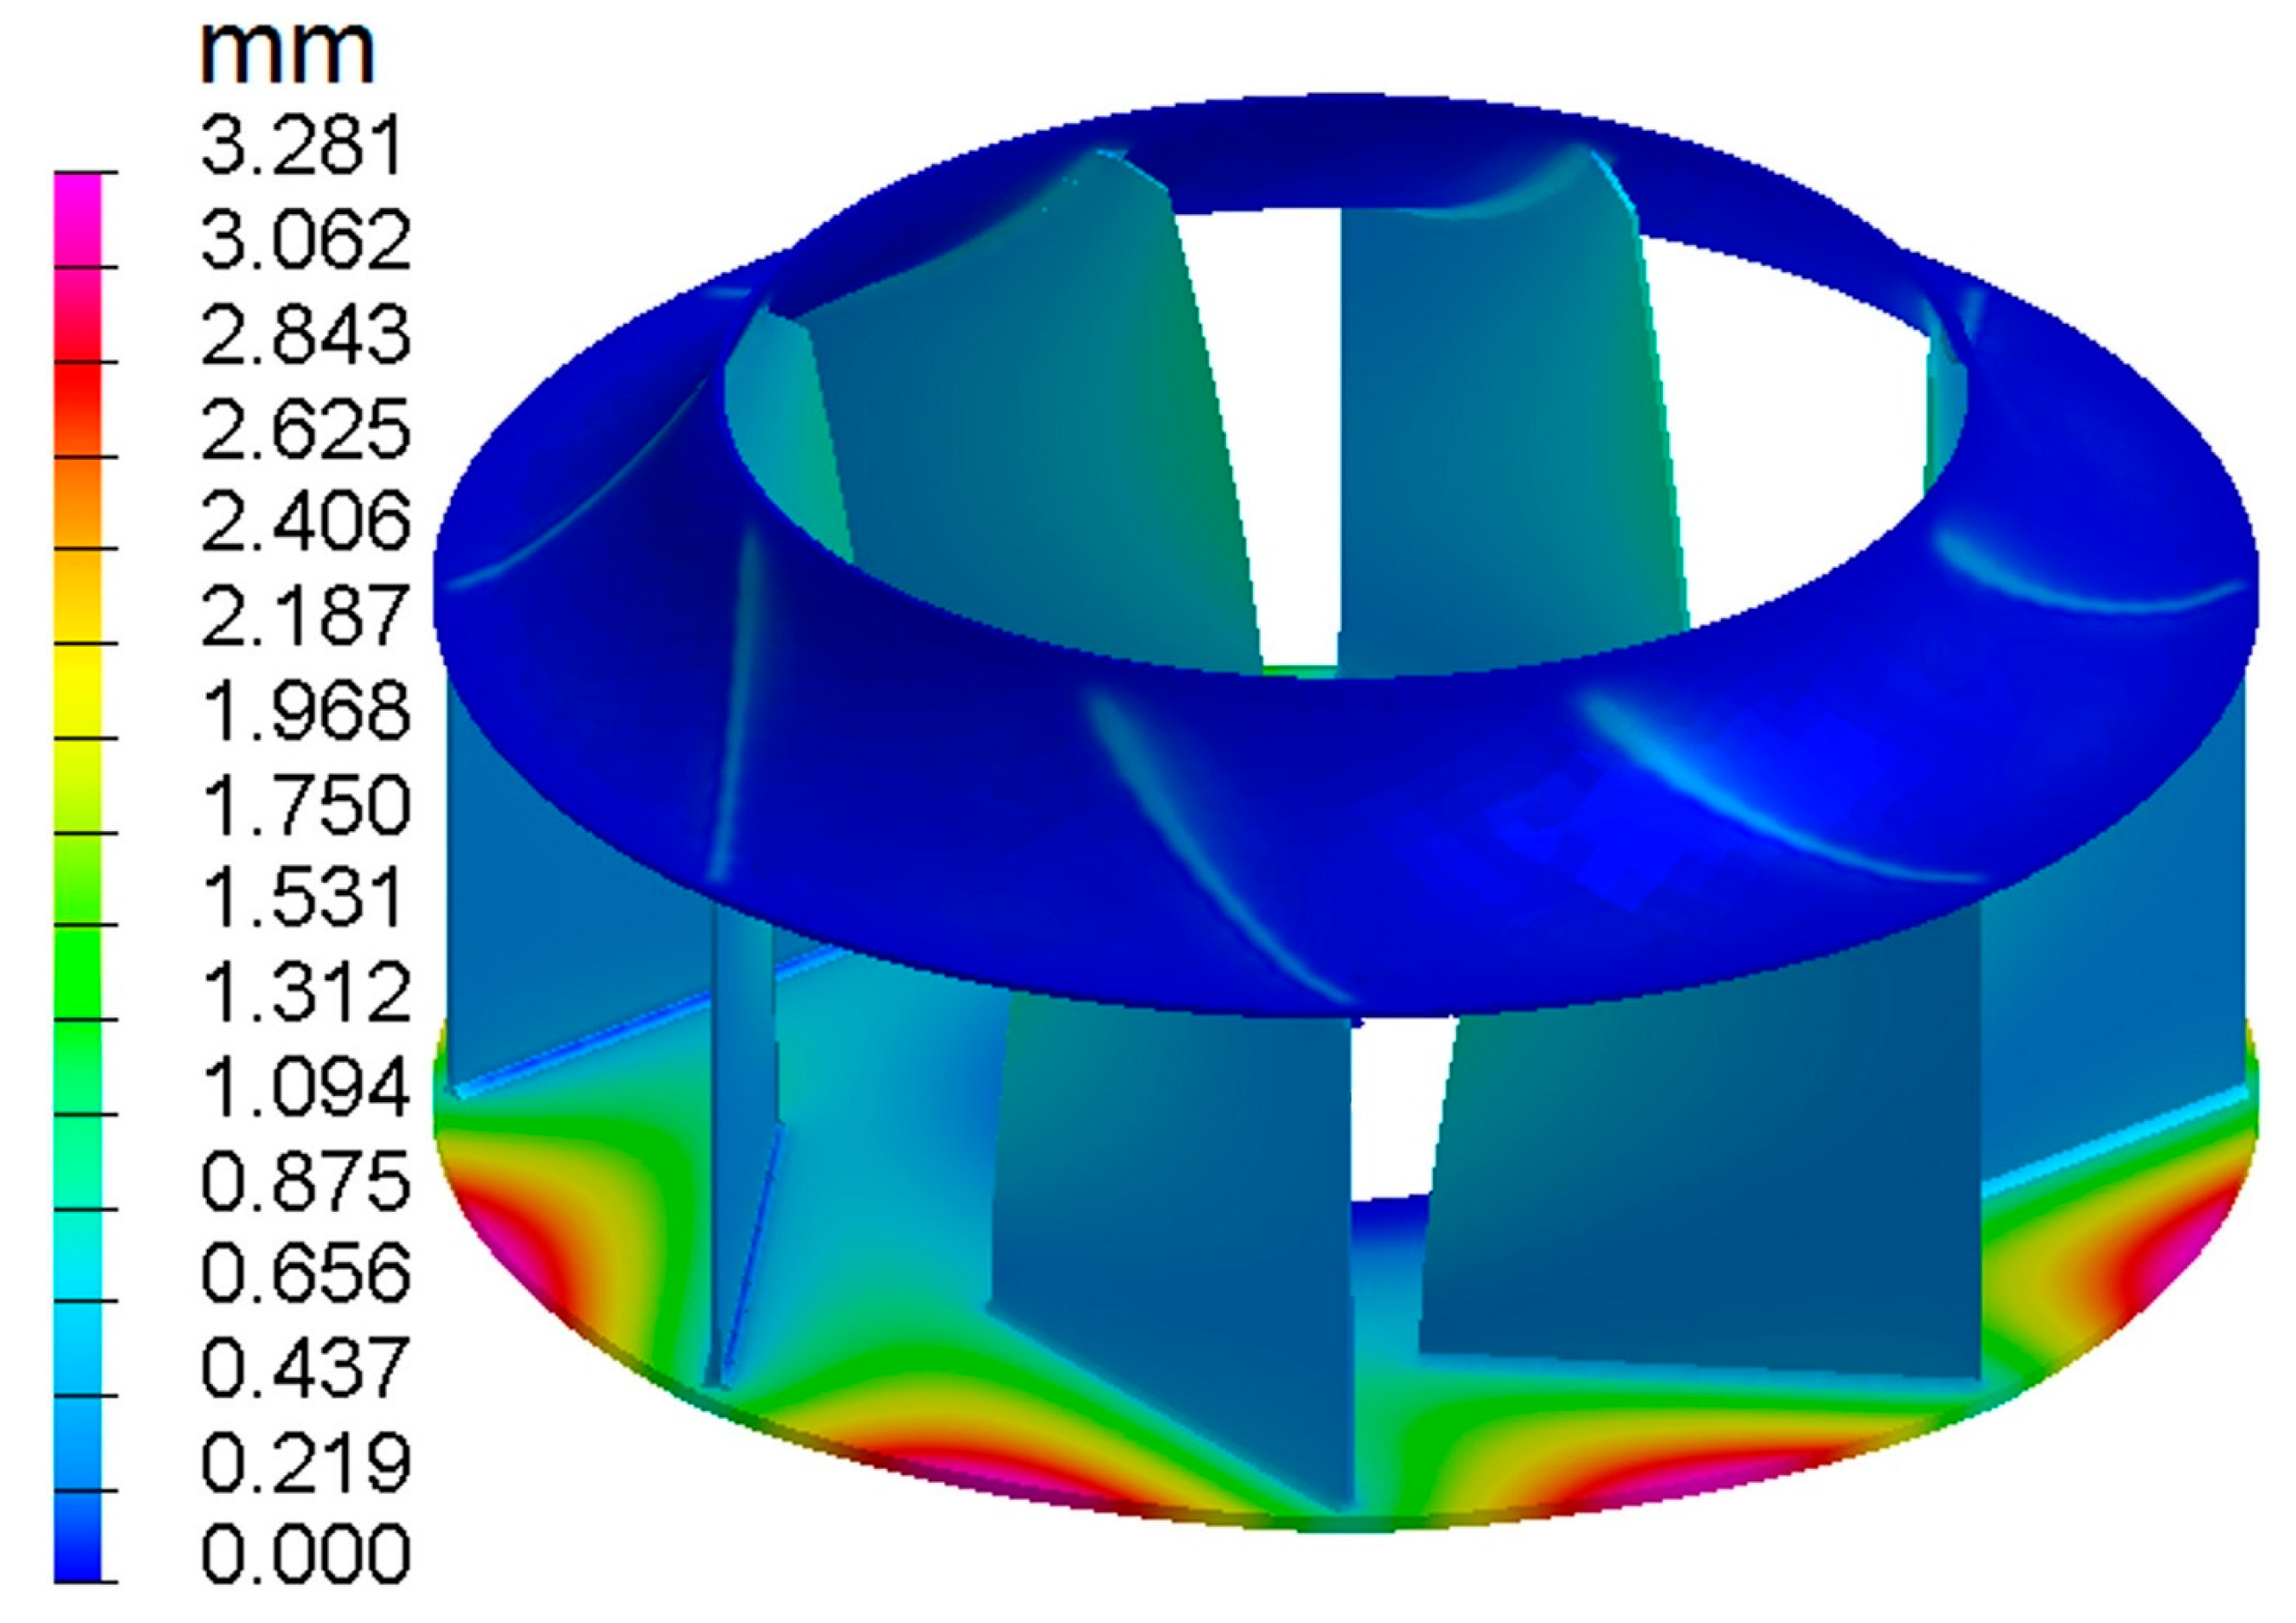
Numerical simulations used the SBS-ISM on the welding sequence of Scheme 3 resulted in the welding deformation shown in Figure 22. The deformation trends are consistent with those calculated using the OS-ISM, with the maximum deformation occurring at the outer edge of the wheel disc between the two blades, which appears to upwarp warping deformation, with the same wave deformation along the outer edge of the wheel disc. Although the OS-ISM and SBS-ISM calculate similar trends in welding deformation, there is a significant difference in the calculated maximum deformation. This is similar to what was seen in the calculation of the local finite element welding deformation above, i.e., the results using the OS-ISM are larger than those using the SBS-ISM.

6.3. Comparison of Numerical Simulations with Actual Welding Deformation Produced by Welding

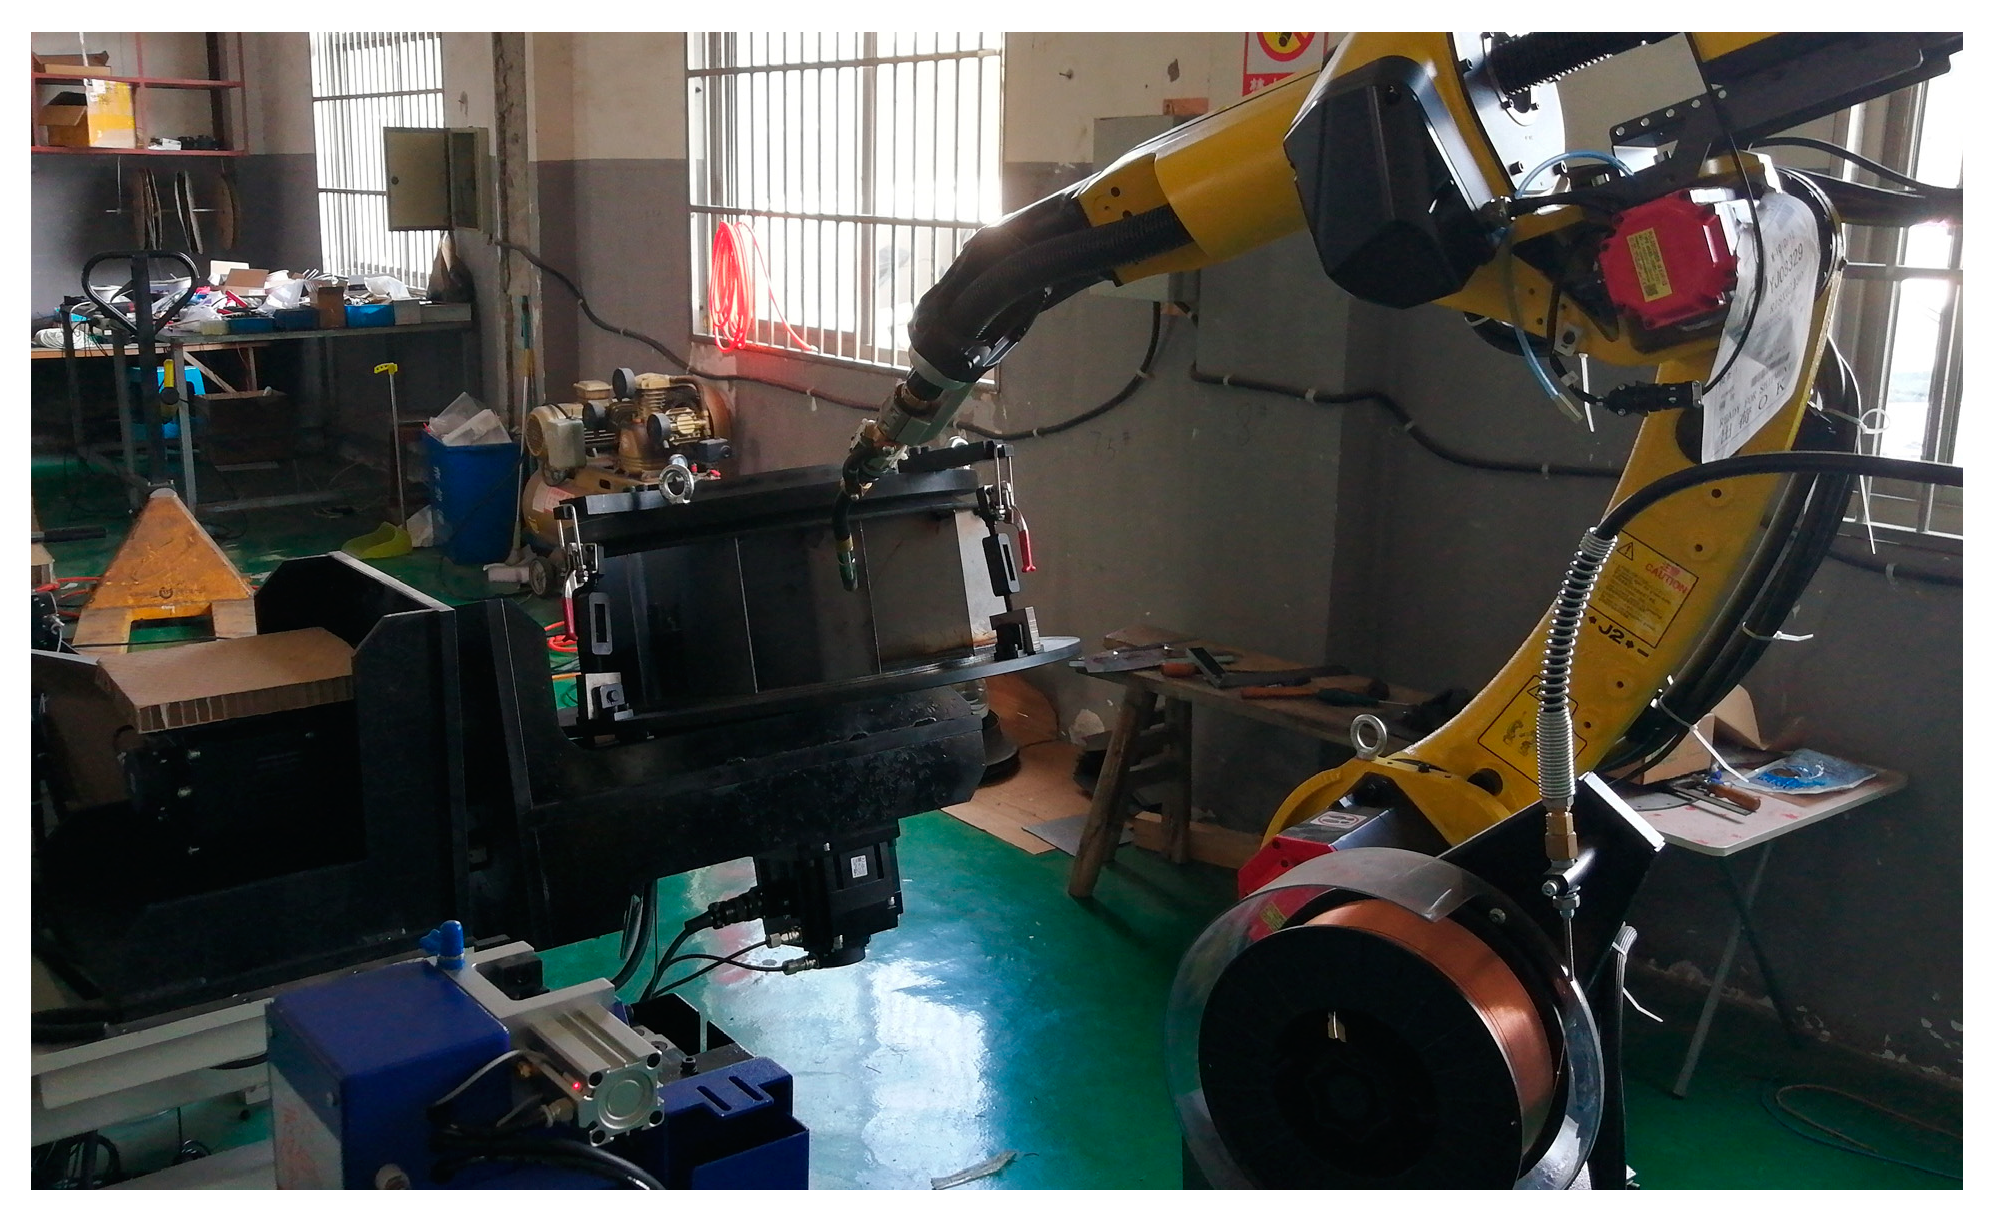
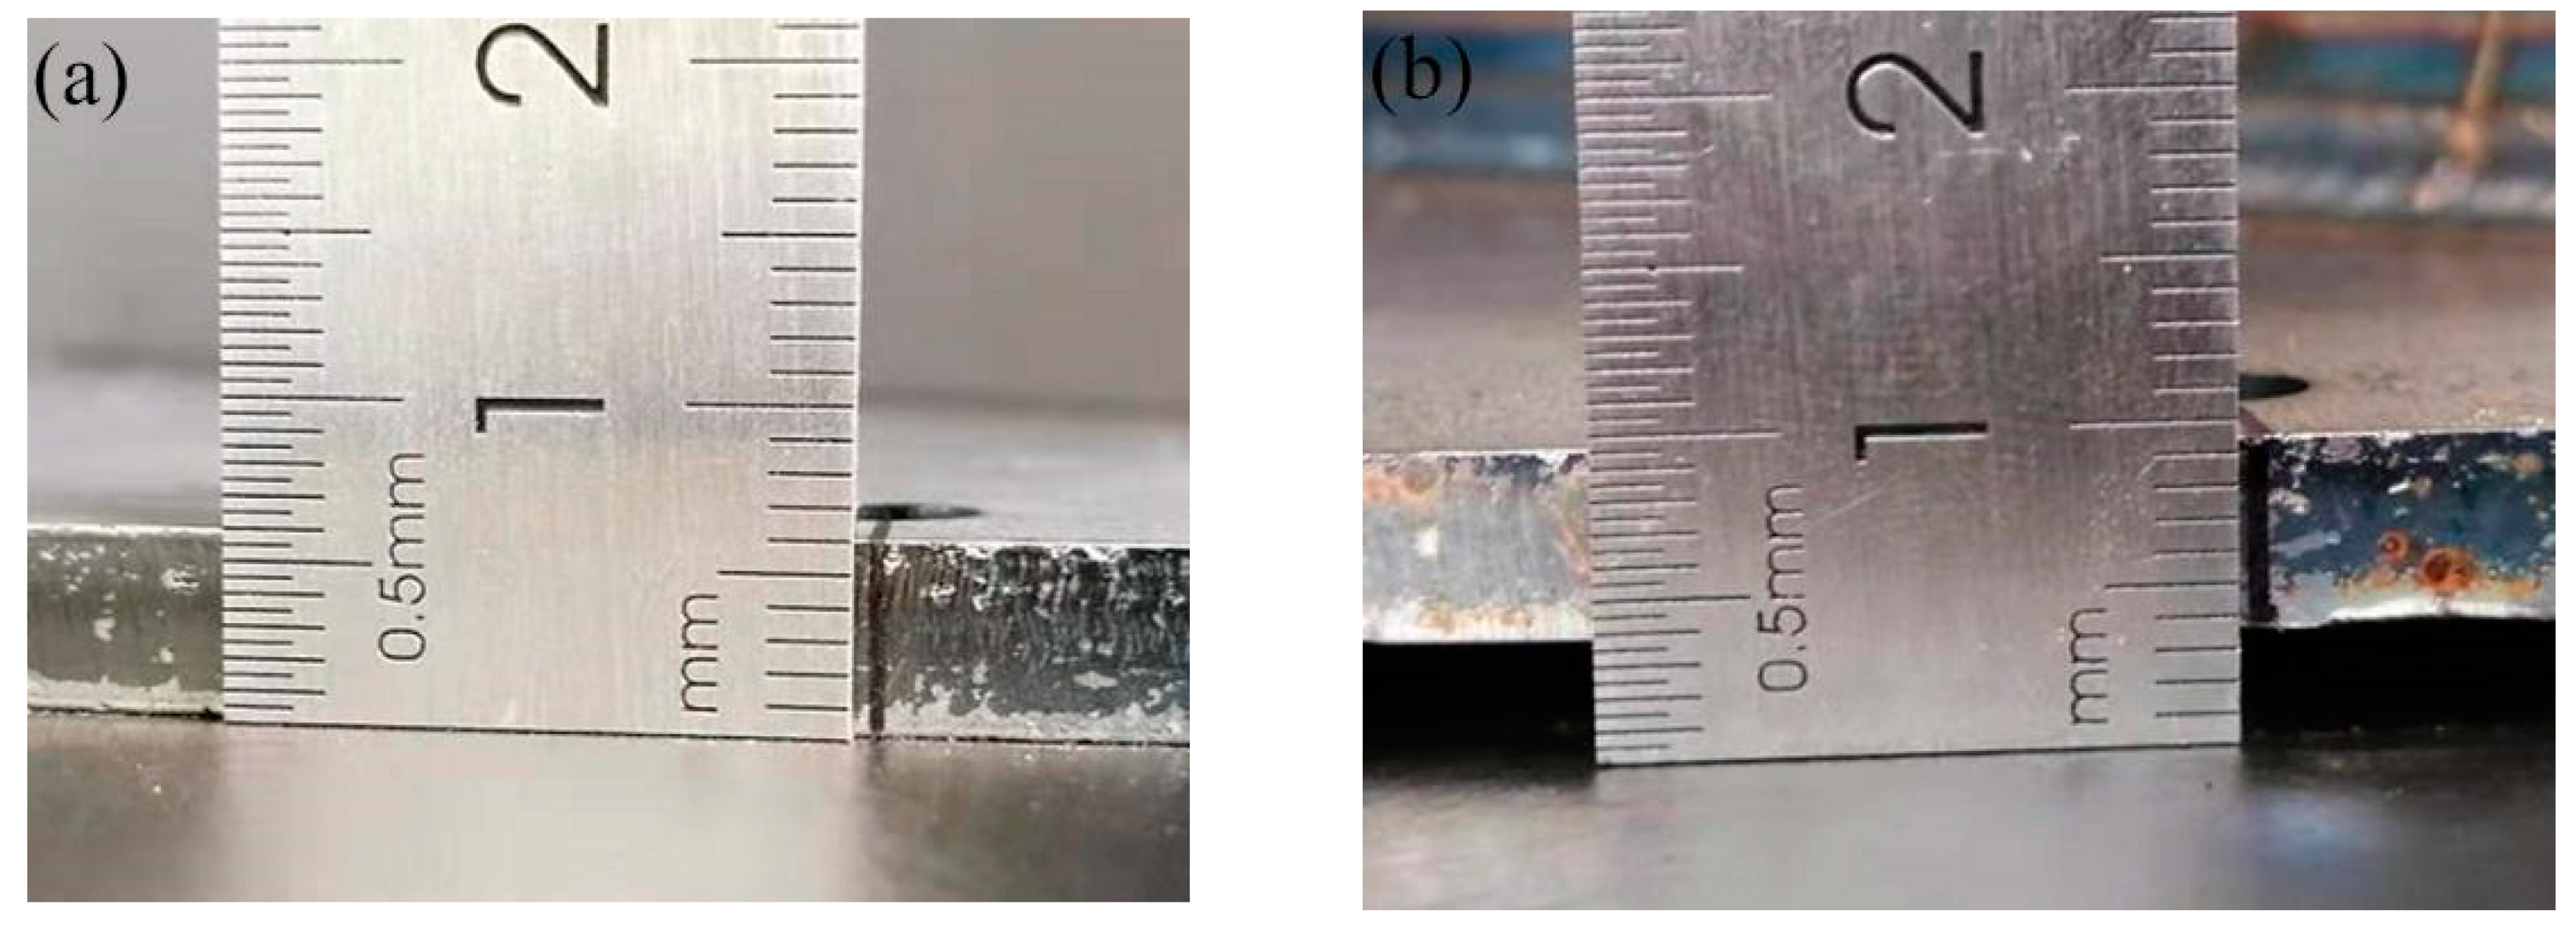
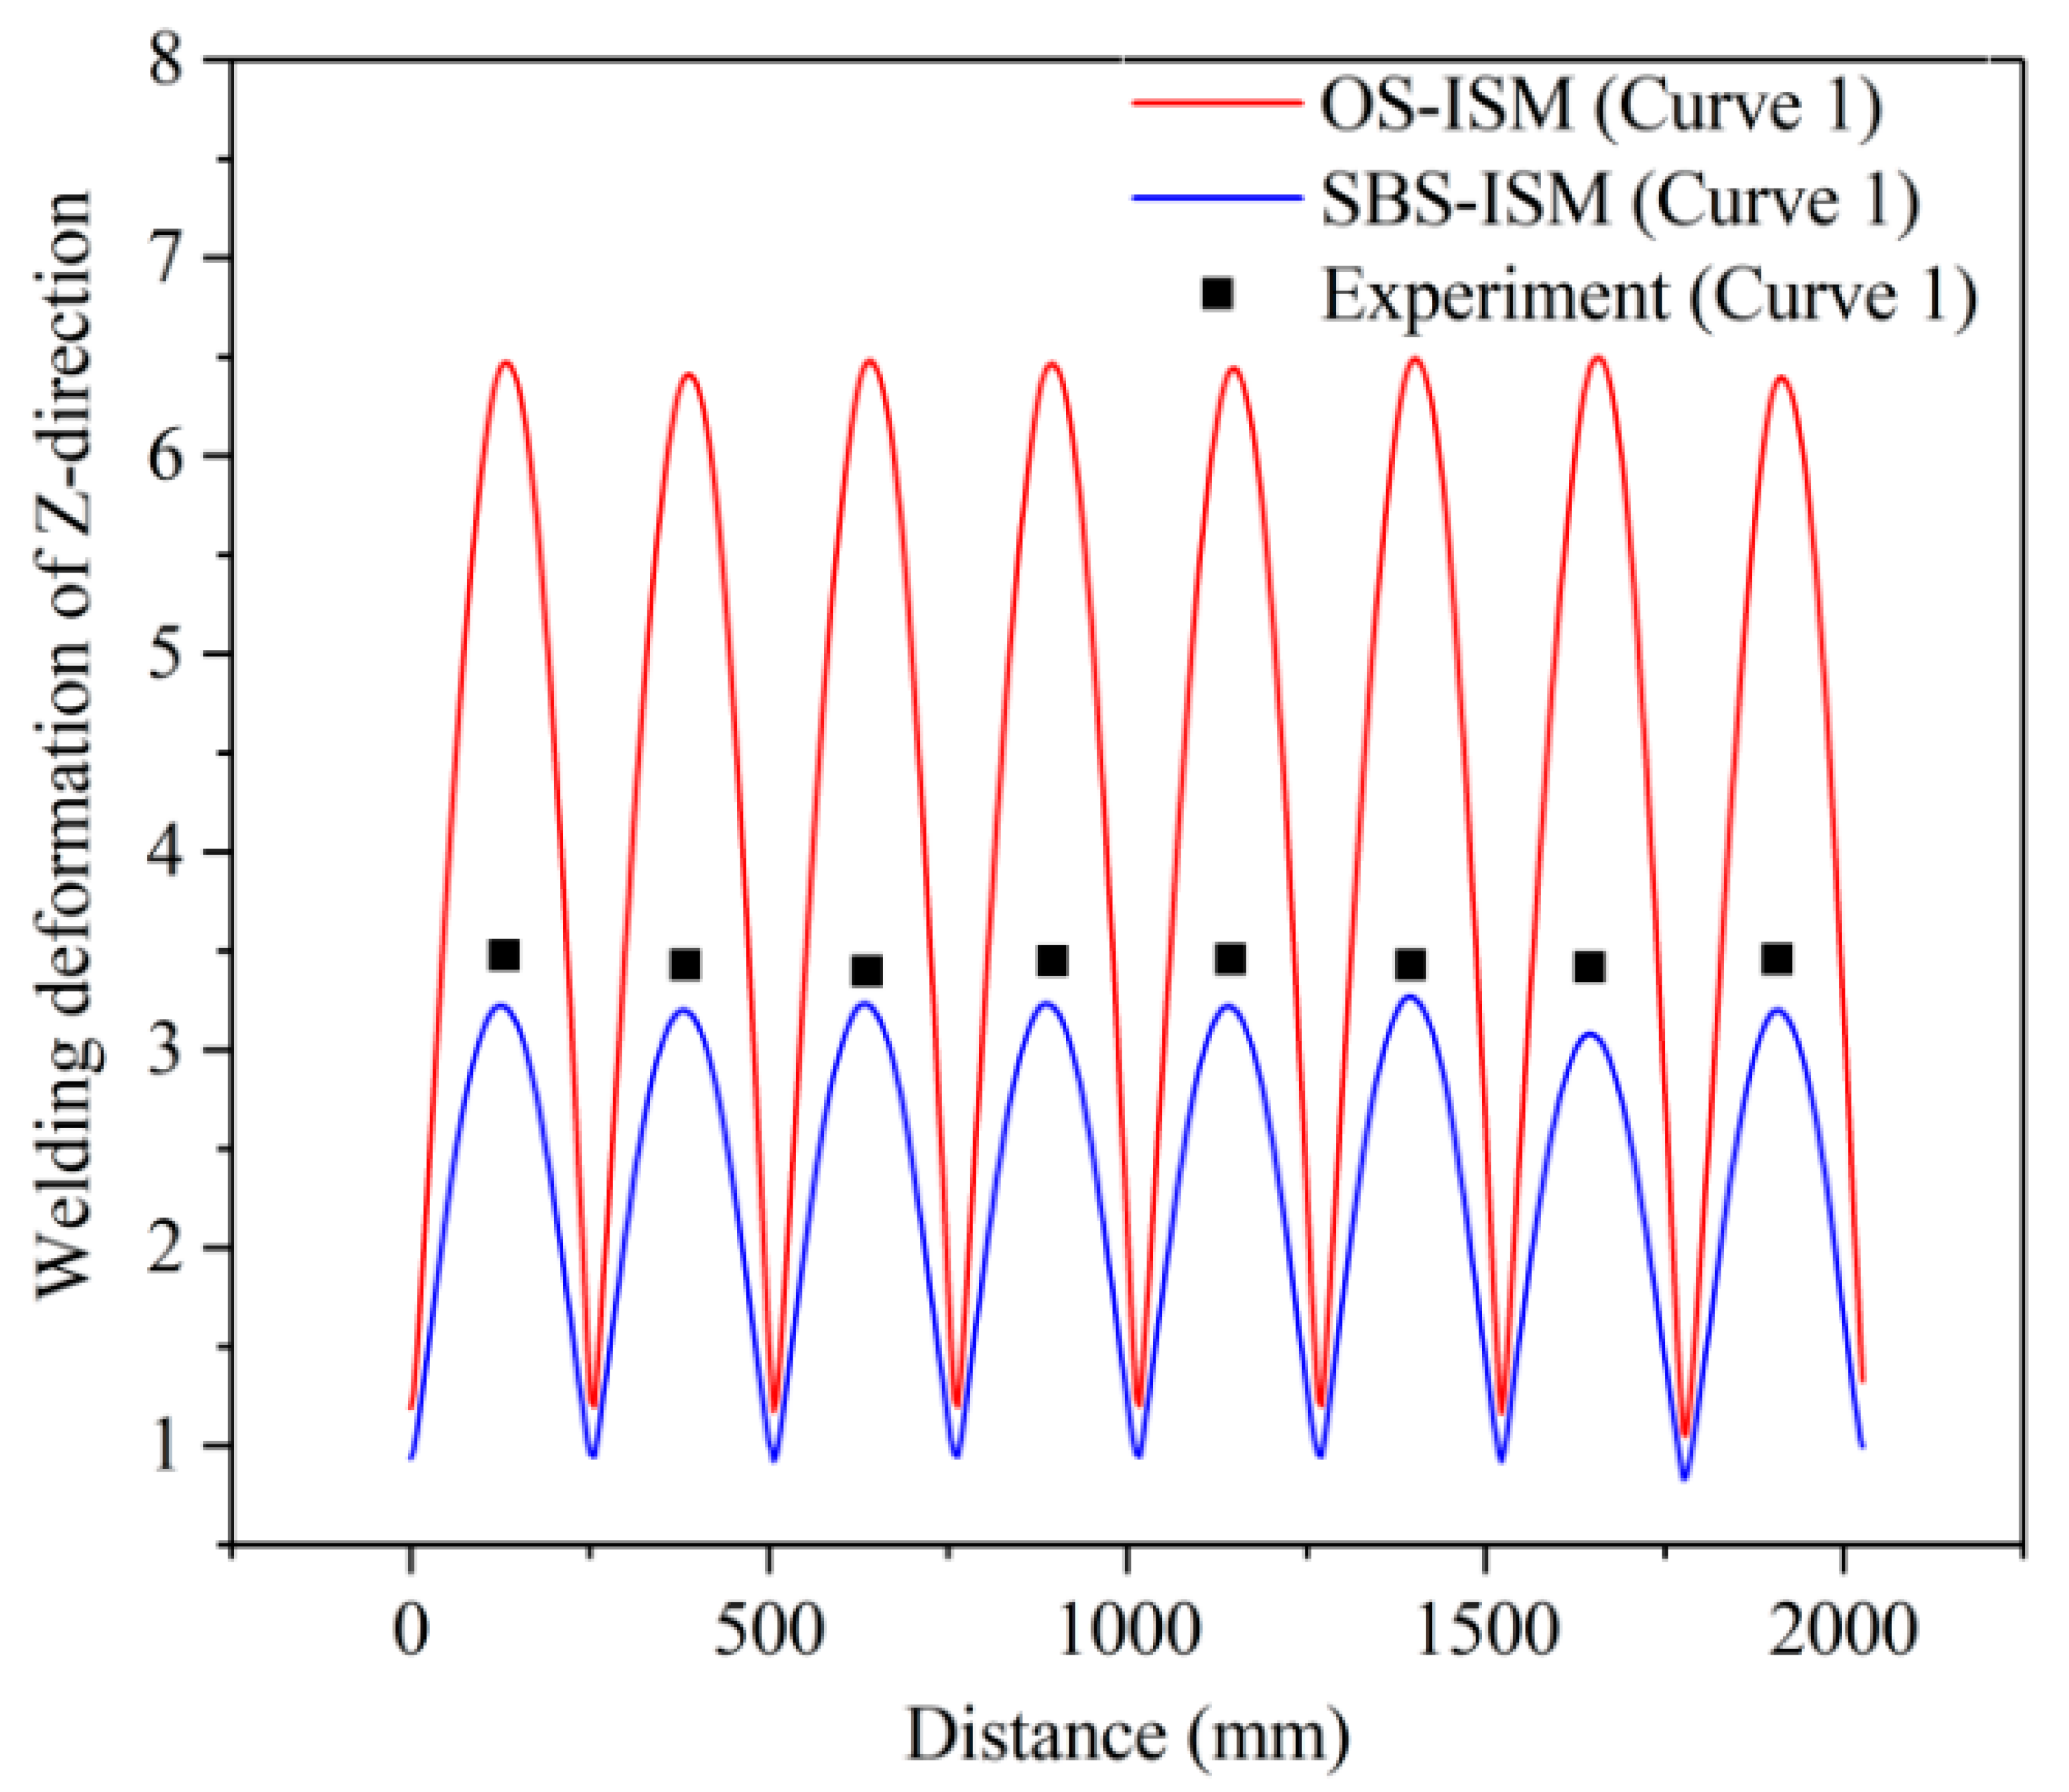
Welding experiments were carried out on the backward centrifugal fan impeller in accordance with welding sequence 3, and the experimental scenario is shown in Figure 23. The post-welding deformation of the impeller obtained after welding was completed and the deformation in Figure 22 basically matches. The significant deformation was found at the outer edge of the wheel disc between the two blades, which appeared to be an upward warping deformation, with the entire outer edge of the wheel disc showing wavy deformation. After actual measurements, the position of the maximum deformation after welding also occurred at the middle of the outer edge of the wheel disc between the two blades. Figure 24 shows the deformation at the outer edge of the wheel disc in the middle position between the blades before and after welding, respectively. In order to visually compare the experimental results with the SBS-ISM and OS-ISM numerical simulation results, Curve 1 (as shown in Figure 1) of the wheel disc was selected to compare the welding deformation in the direction of the vertical wheel disc with the measured welding deformation, as shown in Figure 25.
Based on the comparison between the experimental measurement results and the two numerical simulation results based on the inherent strain method, it can be concluded that, firstly, although the deformation trend of the outer edge of the wheel disc is the same as that calculated using the OS-ISM and SBS-ISM, both showing wave deformation, but the welding deformation value calculated using the OS-ISM is larger than that calculated using the SBS-ISM. Secondly, the maximum deformation values measured experimentally are 10% larger than the maximum deformation values calculated using the SBS-ISM; finally, the experimental results are consistent with the deformation trend calculated using the OS-ISM, but the welding deformation has a large error: the error value exceeds 70%.
A very important factor contributing to the larger welding deformation results calculated using the OS-ISM compared to the experimental results and to the welding deformation results calculated using the SBS-ISM is described in Section 4.2 above. In welding, the residual plastic strain, i.e., the inherent strain, is not generated at the same moment by the effects of thermal convection and thermal radiation. In contrast to the SBS-ISM proposed in this paper, the OS-ISM does not take into account the gradual generation of inherent strains during the calculation process, ignoring the fact that the welding deformation generated by the inherent strains at the previous moment have an impact on the subsequent deformation, and that the final welding deformation is the result of the interaction and accumulation of inherent strains at different moments.
In conclusion, the proposed SBS-ISM demonstrates high accuracy and reliability in predicting welding deformation for both small and large thin-walled T-shaped structures. Although the SBS-ISM takes longer than the OS-ISM, it still saves a lot of time compared to the TEP-FEM, which is based on a nonlinear calculation.

7. Conclusions

For the defects of the existing inherent strain method in predicting welding deformation, this paper proposed a step-by-step loading inherent strain method (SBS-ISM) to predict the welding deformation of a T-shaped structure, also using the thermal elastic–plastic finite element method (TEP-FEM) and one-step loading inherent strain method (OS-ISM) for comparison. Finally, the OS-ISM and SBS-ISM were used to numerically simulate and experimentally validate the predicted welding deformation of the backward centrifugal fan impeller, respectively. The main conclusions are summarized as follows:
(1)
Use of the TEP-FEM in combination with a double ellipsoidal heat source model enables accurate simulation of welding pools in accordance with welding parameters, leading to the discovery of optimal welding process parameters and greatly reducing the problem of finding optimal welding parameters experimentally.
(2)
The TEP-FEM, used to obtain the residual plastic strain of the local model welded joint, and then combined with the inherent strain-based method, can quickly simulate the welding deformation of different welding sequences, so as to find the optimal welding sequence according to the deformation situation.
(3)
For thin-walled T-shaped structures, the step-by-step loading inherent strain method (SBS-ISM) is more in line with the actual process of residual plastic strain generation during welding. Consequently, the welding deformation trends and magnitudes simulated using the SBS-ISM are more consistent with those obtained from TEP-FEM simulations.
(4)
Combining the TEP-FEM with the SBS-ISM enables accurate simulation of welding deformation in large and complex thin-walled T-shaped structures such as the backward centrifugal fan impeller. This provides an effective solution for simulating welding deformation in more complex welded structural components.
(5)
The SBS-ISM is computed linearly, and although it takes longer than the OS-ISM, its prediction accuracy is comparable to that of the TEP-FEM, and the computational time spent is significantly reduced compared to the TEP-FEM.

Author Contributions

Conceptualization, Y.M.; Methodology, L.W. and Y.M.; Software, L.W.; Validation, L.W. and Y.M.; Investigation, L.W. and G.H.; Resources, Y.M.; Writing—original draft, L.W.; Writing—review and editing, G.H., Y.Z. and Q.D.; Supervision, Y.M. All authors have read and agreed to the published version of the manuscript.

Funding

This research was funded by the National Natural Science Foundation of China (No. 51975138), High-Tech Ship. Scientific Research Project from the Ministry of Industry and Information Technology ([2019]360), High-Tech Ship. Scientific Research Project from the Ministry of Industry and Information Technology (No. CJ05N20).

Data Availability Statement

Not applicable.

Conflicts of Interest

The authors declare no conflict of interest.

References

  1. Wang, J.; Yi, B. Benchmark Investigation of Welding-Induced Buckling and Its Critical Condition during Thin Plate Butt Welding. J. Manuf. Sci. Eng. Trans. ASME 2019, 141, 071010. [Google Scholar] [CrossRef]
  2. Iranmanesh, M.; Azad, N.; Zabihpoor, M. A New Algorithm on Welding Process of T-Shaped Plates in Ship Hull Structure to Minimize Distortion Based on Thermal Simulation. Ships Offshore Struct. 2014, 9, 489–497. [Google Scholar] [CrossRef]
  3. Zhou, H.; Wang, J.; Zhang, H.; Liu, J.; Mo, Z. Prediction and Mitigation of Out-of-Plane Welding Distortion of a Typical Block in Fabrication of a Semi-Submersible Lifting and Disassembly Platform. Mar. Struct. 2021, 77, 102964. [Google Scholar] [CrossRef]
  4. Ueda, Y.; Yamakawa, T. Analysis of Thermal Elastic–Plastic Stress and Strain during Welding by Finite Element Method. Trans. Jpn. Weld Soc. 1971, 2, 186–196. [Google Scholar]
  5. Ueda, Y.; Murakava, H. Establishment of Computational Welding Mechanics. Weld. Surf. Rev. 1997, 24, 73–86. [Google Scholar]
  6. Deng, D.; Murakawa, H. Numerical Simulation of Temperature Field and Residual Stress in Multi-Pass Welds in Stainless Steel Pipe and Comparison with Experimental Measurements. Comput. Mater. Sci. 2006, 37, 269–277. [Google Scholar] [CrossRef]
  7. Ye, Y.; Cai, J.; Jiang, X.; Dai, D.; Deng, D. Influence of Groove Type on Welding-Induced Residual Stress, Deformation and Width of Sensitization Region in a SUS304 Steel Butt Welded Joint. Adv. Eng. Softw. 2015, 86, 39–48. [Google Scholar] [CrossRef]
  8. Rong, Y.; Chang, Y.; Xu, J.; Huang, Y.; Lei, T.; Wang, C. Numerical Analysis of Welding Deformation and Residual Stress in Marine Propeller Nozzle with Hybrid Laser-Arc Girth Welds. Int. J. Press. Vessel. Pip. 2017, 158, 51–58. [Google Scholar] [CrossRef]
  9. Bajpei, T.; Chelladurai, H.; Ansari, M.Z. Experimental Investigation and Numerical Analyses of Residual Stresses and Distortions in GMA Welding of Thin Dissimilar AA5052-AA6061 Plates. J. Manuf. Process. 2017, 25, 340–350. [Google Scholar] [CrossRef]
  10. Hu, J.; Tsai, H.L. Modelling of Transport Phenomena in 3D GMAW of Thick Metals with v Groove. J. Phys. D Appl. Phys. 2008, 41, 065202. [Google Scholar] [CrossRef]
  11. Ebrahimi, A.; Babu, A.; Kleijn, C.R.; Hermans, M.J.M.; Richardson, I.M. The Effect of Groove Shape on Molten Metal Flow Behaviour in Gas Metal Arc Welding. Materials 2021, 14, 7444. [Google Scholar] [CrossRef] [PubMed]
  12. Ueda, Y.; Yuan, M.G. Prediction of Welding Residual Stresses in T and I Joints Using Inherent Strains. 3rd Report: Method for Prediction of Welding Residual Stress Using Residual Stress Generation Source. Weld. Int. 1992, 6, 263–269. [Google Scholar] [CrossRef]
  13. Ueda, Y.; Yuan, M.G.; Mochizuki, M.; Umezawa, S.; Enomoto, K. Experimental Verification of a Method for Prediction of Welding Residual Stresses in T Joints Using Inherent Strains 4th Report: Method for Prediction Using Source of Residual Stress. Weld. Int. 1993, 7, 863–869. [Google Scholar] [CrossRef]
  14. Deng, D.; Murakawa, H.; Liang, W. Numerical Simulation of Welding Distortion in Large Structures. Comput. Methods Appl. Mech. Eng. 2007, 196, 4613–4627. [Google Scholar] [CrossRef]
  15. Deng, D.; Murakawa, H. Prediction of Welding Distortion and Residual Stress in a Thin Plate Butt-Welded Joint. Comput. Mater. Sci. 2008, 43, 353–365. [Google Scholar] [CrossRef]
  16. Deng, D.; Murakawa, H. FEM Prediction of Buckling Distortion Induced by Welding in Thin Plate Panel Structures. Comput. Mater. Sci. 2008, 43, 591–607. [Google Scholar] [CrossRef]
  17. Sulaiman, M.S.; Manurung, Y.H.P.; Haruman, E.; Rahim, M.R.A.; Redza, M.R.; Lidam, R.N.A.; Abas, S.K.; Tham, G.; Chau, C.Y. Simulation and Experimental Study on Distortion of Butt and T-Joints Using WELD PLANNER. J. Mech. Sci. Technol. 2011, 25, 2641–2646. [Google Scholar] [CrossRef]
  18. Manurung, Y.H.P.; Sulaiman, M.S.; Abas, S.K.; Tham, G.; Haruman, E. Investigation on Welding Distortion of Combined Butt and T-Joints with 9-Mm Thickness Using FEM and Experiment. Int. J. Adv. Manuf. Technol. 2015, 77, 775–782. [Google Scholar] [CrossRef]
  19. Shen, Y.; Liu, S.; Yuan, M.; Dai, X.; Lan, J. Immune Optimization of Double-Sided Welding Sequence for Medium-Small Assemblies in Ships Based on Inherent Strain Method. Metals 2022, 12, 1091. [Google Scholar] [CrossRef]
  20. Chino, T.; Kunugi, A.; Kawashima, T.; Watanabe, G.; Can, C.; Ma, N. Fast Prediction for Resistance Spot Welding Deformation Using Inherent Strain Method and Nugget Model. Materials 2021, 14, 7180. [Google Scholar] [CrossRef]
  21. Liang, W.; Deng, D.; Sone, S. Prediction of Welding Distortion by Elastic Finite Element Analysis using Inherent Deformation Estimated Through Inverse Analysis. Weld. World. 2005, 49, 30–39. [Google Scholar] [CrossRef]
  22. Wang, J.; Shi, X.; Zhou, H.; Yang, Z.; Liu, J. Dimensional Precision Controlling on Out-of-Plane Welding Distortion of Major Structures in Fabrication of Ultra Large Container Ship with 20000TEU. Ocean. Eng. 2020, 199, 106993. [Google Scholar] [CrossRef]
  23. Ma, N.; Tateishi, J.; Hiroi, S.; Kunugi, A.; Huang, H. Fast Prediction of Welding Distortion of Large Structures Using Inherent Deformation Database and Comparison with Measurement. Q. J. Jpn. Weld. Soc. 2017, 35, 137s–140s. [Google Scholar] [CrossRef] [Green Version]
  24. Hammad, A.; Churiaque, C.; Sánchez-Amaya, J.M.; Abdel-Nasser, Y. Experimental and Numerical Investigation of Hybrid Laser Arc Welding Process and the Influence of Welding Sequence on the Manufacture of Stiffened Flat Panels. J. Manuf. Process. 2021, 61, 527–538. [Google Scholar] [CrossRef]
  25. Lu, Y.; Zhu, S.; Zhao, Z.; Chen, T.; Zeng, J. Numerical Simulation of Residual Stresses in Aluminum Alloy Welded Joints. J. Manuf. Process. 2020, 50, 380–393. [Google Scholar] [CrossRef]
  26. Suman, S.; Biswas, P. Finite Element Analysis of In- Process Thermal Mitigation of Welding Induced Residual Stresses in 9Cr-1Mo-V Steel Butt Joint Considering Phase Transformation. J. Manuf. Process. 2021, 70, 361–375. [Google Scholar] [CrossRef]
  27. Ghafouri, M.; Ahola, A.; Ahn, J.; Björk, T. Numerical and Experimental Investigations on the Welding Residual Stresses and Distortions of the Short Fillet Welds in High Strength Steel Plates. Eng. Struct. 2022, 260, 114269. [Google Scholar] [CrossRef]
  28. ESI Group. Visual-Environment (Version 18.0)-Material Database. Windows. Paris. ESI Group. Available online: https://myesi.esi-group.com/downloads/software-downloads/visual-environment-18.0 (accessed on 12 June 2023).
  29. ESI Group. Visual-Environment (Version 18.0)-Visual-Weld. Windows. Paris. ESI Group. Available online: https://myesi.esi-group.com/downloads/software-documentation/visual-environment-18.0-user-guide-visual-weld-online (accessed on 12 June 2023).
  30. Chen, J.; Wu, C.S.; Chen, M.A. Improvement of Welding Heat Source Models for TIG-MIG Hybrid Welding Process. J. Manuf. Process. 2014, 16, 485–493. [Google Scholar] [CrossRef]
  31. Goldak, J.; Chakravarti, A.; Bibby, M. A New Finite Element Model for Welding Heat Sources. Metall. Trans. B 1984, 15, 299–305. [Google Scholar] [CrossRef]
  32. Yang, Y.P. Recent Advances in the Prediction of Weld Residual Stress and Distortion’ Part 1: A Comprehensive Review of the Numerical Modeling Theory and Methods for Predicting Weld Residual Stress and Distortion. Weld. J. 2021, 100, 151S–170S. [Google Scholar] [CrossRef]
  33. Hu, X.; Feng, G.; Wang, Y.; Zhang, C.; Deng, D. Influence of Lumping Passes on Calculation Accuracy and Efficiency of Welding Residual Stress of Thick-Plate Butt Joint in Boiling Water Reactor. Eng. Struct. 2020, 222, 111136. [Google Scholar] [CrossRef]
  34. Zhang, K.; Dong, W.; Lu, S. Finite Element and Experiment Analysis of Welding Residual Stress in S355J2 Steel Considering the Bainite Transformation. J. Manuf. Process. 2021, 62, 80–89. [Google Scholar] [CrossRef]
  35. Zubairuddin, M.; Albert, S.K.; Vasudevan, M.; Mahadevan, S.; Chaudhari, V.; Suri, V.K. Numerical Simulation of Multi-Pass GTA Welding of Grade 91 Steel. J. Manuf. Process. 2017, 27, 87–97. [Google Scholar] [CrossRef]
  36. Chen, Q.; Yang, J.; Liu, X.; Tang, J.; Huang, B. Effect of the Groove Type When Considering a Thermometallurgical-Mechanical Model of the Welding Residual Stress and Deformation in an S355JR-316L Dissimilar Welded Joint. J. Manuf. Process. 2019, 45, 290–303. [Google Scholar] [CrossRef]
  37. Li, S.; Hu, L.; Dai, P.; Bi, T.; Deng, D. Influence of the Groove Shape on Welding Residual Stresses in P92/SUS304 Dissimilar Metal Butt-Welded Joints. J. Manuf. Process. 2021, 66, 376–386. [Google Scholar] [CrossRef]
  38. Wang, Y.; Li, Q.; Qian, L.; Yang, Y. A Modified Inherent Strain Model with Consideration of the Variance of Mechanical Properties in Metal Additive Manufacturing. J. Manuf. Process. 2021, 72, 115–125. [Google Scholar] [CrossRef]
  39. Lu, Y.; Lu, C.; Zhang, D.; Chen, T.; Zeng, J.; Wu, P. Numerical Computation Methods of Welding Deformation and Their Application in Bogie Frame for High-Speed Trains. J. Manuf. Process. 2019, 38, 204–213. [Google Scholar] [CrossRef]
  40. Biswas, P.; Mandal, N.R.; Das, S. Prediction of Welding Deformations of Large Stiffened Panels Using Average Plastic Strain Method. Sci. Technol. Weld. Join. 2011, 16, 227–231. [Google Scholar] [CrossRef]
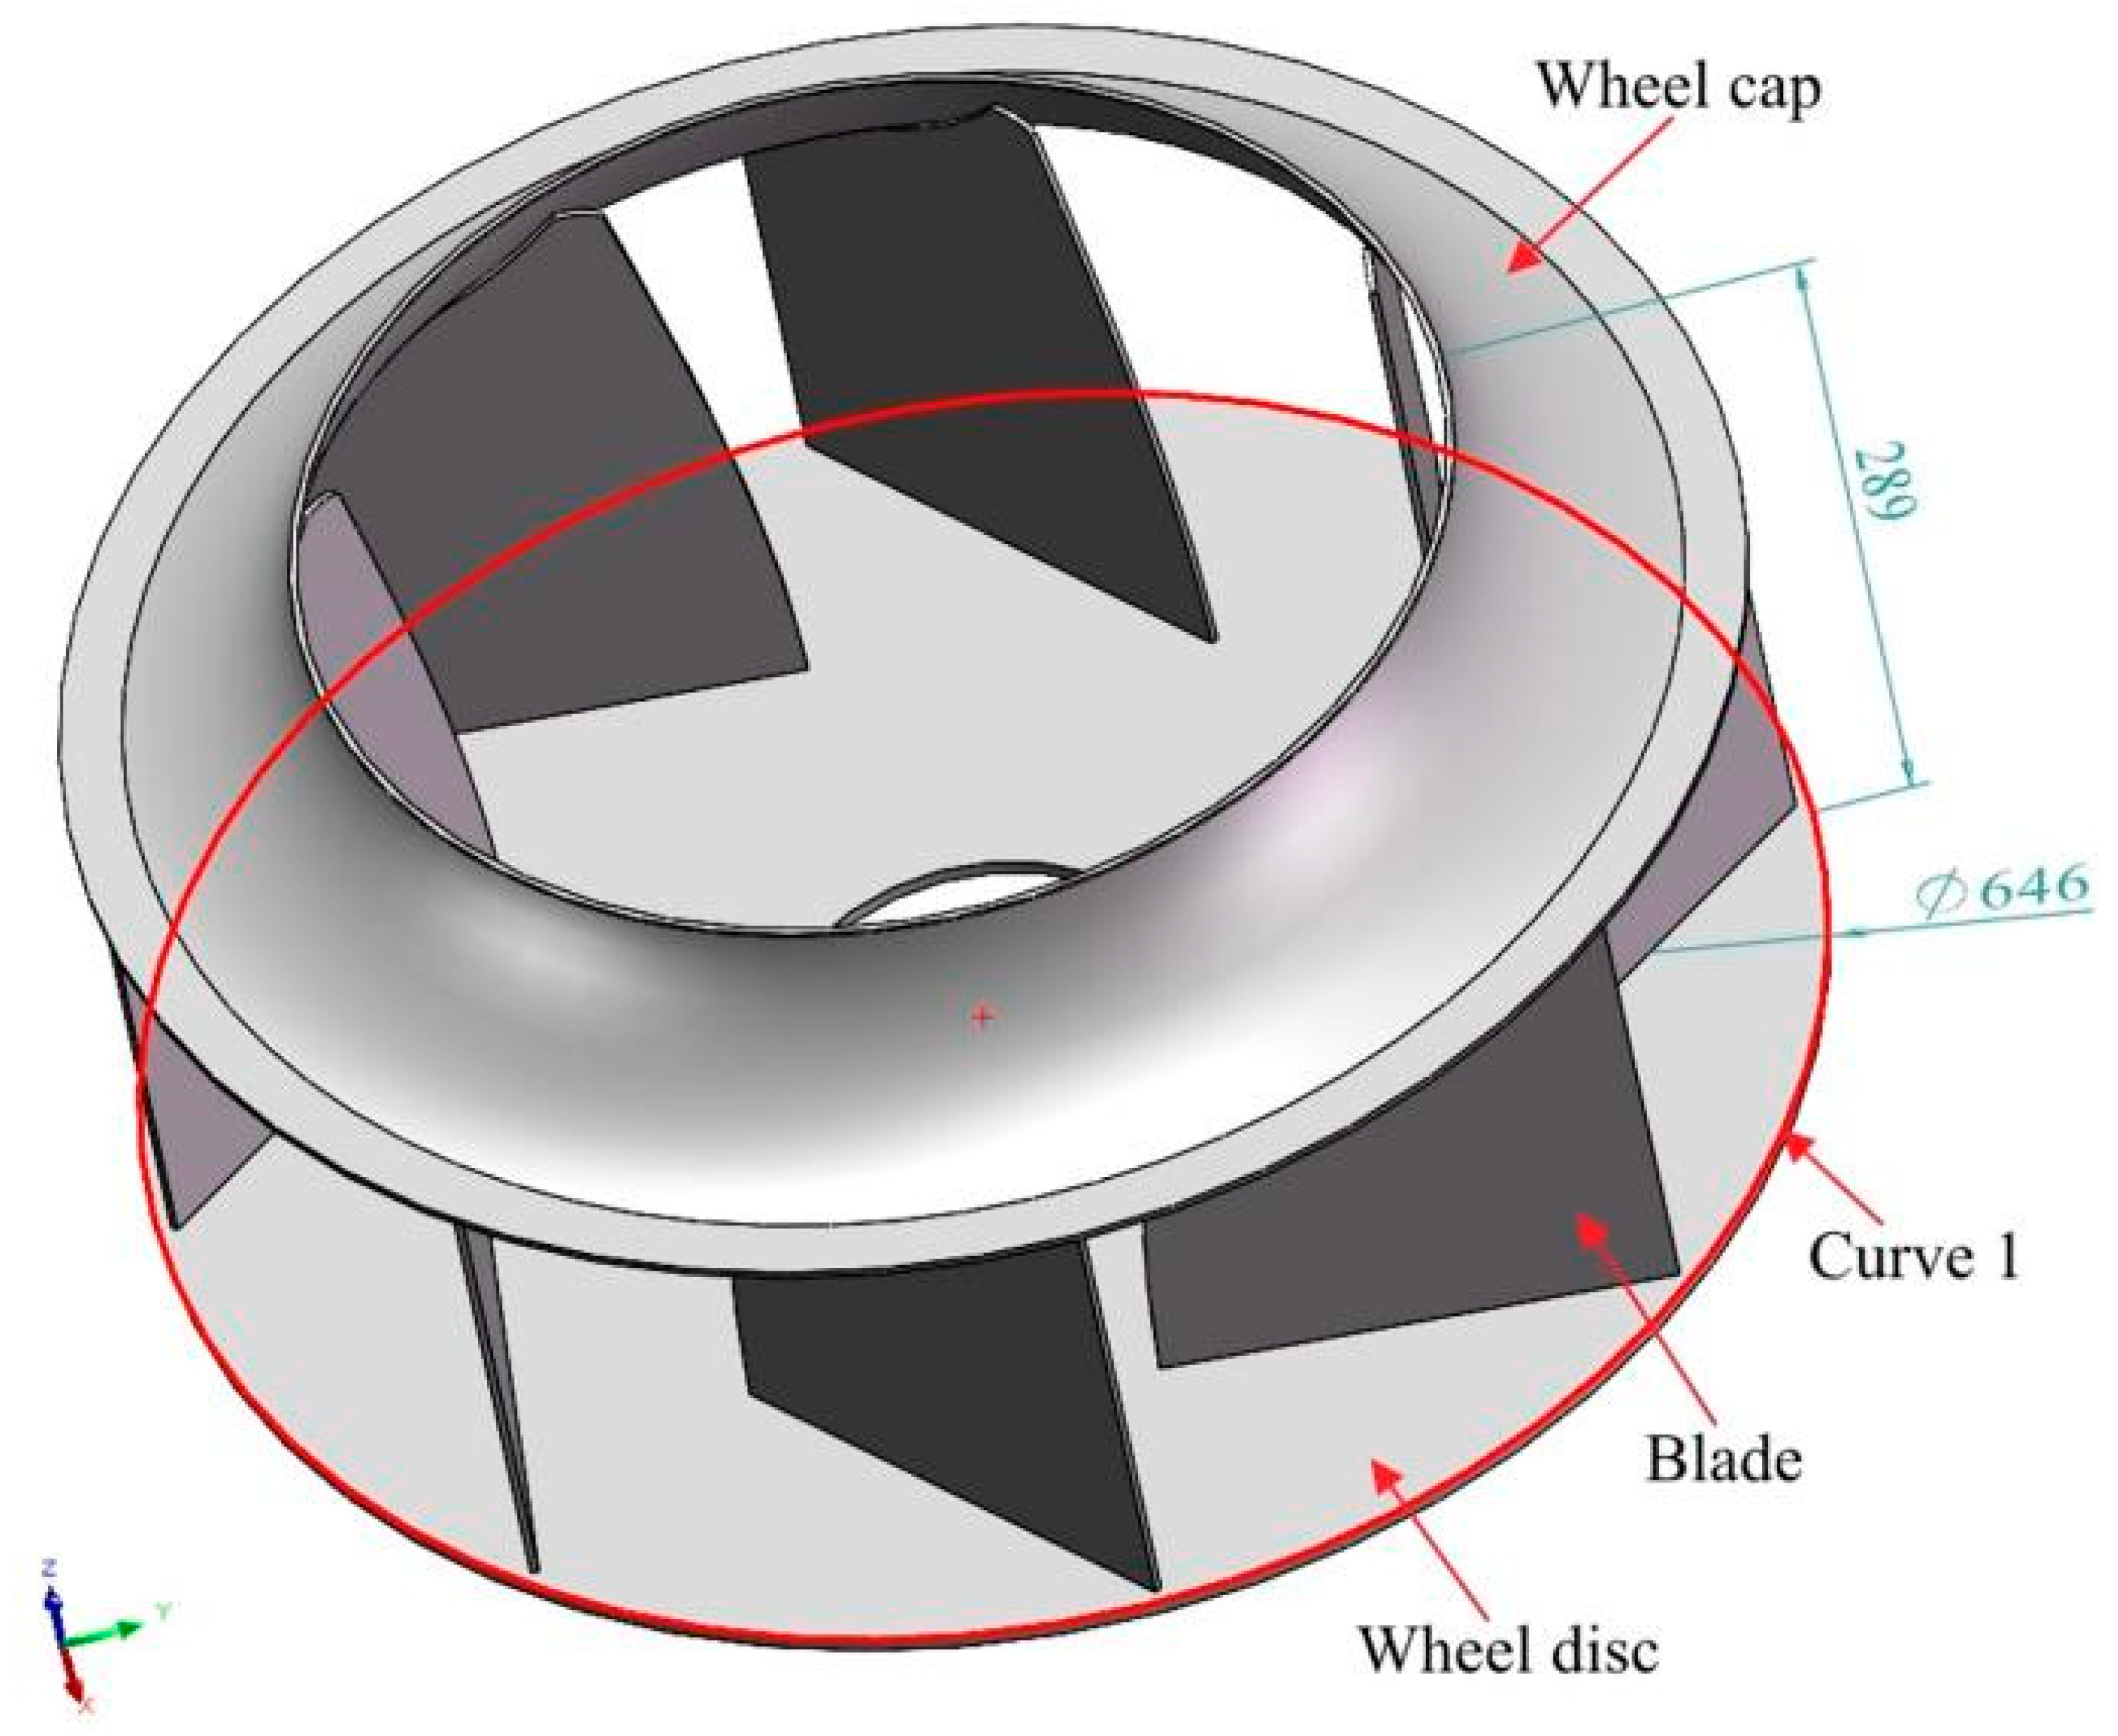
Figure 1. The backward centrifugal fan impeller model.
Metals 13 01312 g001
Figure 2. Temperature-dependent thermal physical properties of Q345D.
Metals 13 01312 g002
Figure 3. Double ellipsoid heat source model.
Metals 13 01312 g003
Figure 4. Temperature-dependent mechanical physical properties of Q345D.
Metals 13 01312 g004
Figure 5. Local finite element model (a) and mesh (b).
Metals 13 01312 g005
Figure 6. Comparison of simulated welding pool cross section and experimental weld seam shape at different welding speeds: (a) I = 160 A, U = 22 V, v = 0.35 m/min; (b) I = 160 A, U = 22 V, v = 0.45 m/min; (c) I = 160 A, U = 22 V, v = 0.55 m/min; (d) I = 160 A, U = 22 V, v = 0.65 m/min.
Metals 13 01312 g006aMetals 13 01312 g006b
Figure 7. Overall welding deformation calculated based on TEP-FEM (deformed scale: 6).
Metals 13 01312 g007
Figure 8. Welding deformation in the X-direction (a) and Y-direction (b) calculated based on TEP-FEM (deformed scale: 6).
Metals 13 01312 g008
Figure 9. Plastic strain distribution at different moments calculated based on TEP-FEM.
Metals 13 01312 g009
Figure 10. Schematic diagram of the one-step loading inherent strain method (OS-ISM).
Metals 13 01312 g010
Figure 11. Overall welding deformation calculated using OS-ISM (deformed scale: 6).
Metals 13 01312 g011
Figure 12. Welding deformation in the X-direction (a) and Y-direction (b) calculated based on OS-ISM (deformed scale: 6).
Metals 13 01312 g012
Figure 13. Schematic diagram of the step-by-step loading inherent strain method (SBS-ISM).
Metals 13 01312 g013
Figure 14. Overall welding deformation calculated using the SBS-ISM (deformed scale: 6).
Metals 13 01312 g014
Figure 15. Welding deformation in the X-direction (a) and Y-direction (b) calculated based on the SBS-ISM (deformed scale: 6).
Metals 13 01312 g015
Figure 16. Comparison of welding deformation trends in the X-direction of the web from the three calculation methods.
Metals 13 01312 g016
Figure 17. Comparison of welding deformation trends in the Y-direction of the web from the three calculation methods.
Metals 13 01312 g017
Figure 18. Comparison of welding deformation trends in the Y-direction of the flange from the three calculation methods.
Metals 13 01312 g018
Figure 19. The mesh and constraints of the backward centrifugal fan impeller.
Metals 13 01312 g019
Figure 20. Weld seams marking schematic diagram.
Metals 13 01312 g020
Figure 21. Welding deformation of the backward centrifugal fan impeller calculated using the OS-ISM for different welding sequences: (a) Scheme 1; (b) Scheme 2; (c) Scheme 3.
Metals 13 01312 g021
Figure 22. Welding deformation of the backward centrifugal fan impeller under Scheme 3 was calculated using the SBS-ISM.
Metals 13 01312 g022
Figure 23. Experimental scenario for impeller welding.
Metals 13 01312 g023
Figure 24. Comparison of wheel discs between before and after welding: (a) before welding; (b) after welding.
Metals 13 01312 g024
Figure 25. Comparison of numerical simulations and experimental result.
Metals 13 01312 g025
Table 1. Double ellipsoidal heat source model parameters.
Parameteraf (mm)ar (mm)b (mm)c (mm)fffr
Value5102.152.30.671.33
Table 2. The welding process parameters.
Welding MethodCurrent
(A)
Voltage
(V)
Diameter of Welding Wire
(mm)
Welding Speed
(m/min)
Welding Efficiency
( η )
Protective GasesGas Flow Rate
(L/min)
MAG160221.20.350.880%Ar + 20%CO215
0.45
0.55
0.65
Table 3. The optimal welding process parameters.
Welding MethodsCurrent
(A)
Voltage
(V)
Diameter of Welding Wire
(mm)
Welding Speed
(m/min)
Welding Efficiency
( η )
Protective GasesGas Flow Rate
(L/min)
MAG160221.20.550.880%Ar + 20%CO215
Table 4. Deformation in different directions under different welding sequences (mm).
MethodsOverall Maximum Deformation
(with TEP-FEM Errors)
Maximum Deformation in X-Direction
(with TEP-FEM Errors)
Maximum Deformation in Y-Direction
(with TEP-FEM Errors)
TEP-FEM3.3662.344−2.416
OS-ISM4.175 (24%)2.569 (9.6%)−3.325 (37.6%)
SBS-ISM3.378 (0.35%)2.251 (3.97%)−2.529 (4.67%)
Table 5. Welding sequence schemes.
SchemesWelding Sequences
11 → 2 → 3 → 4 → 5 → 6 → 7 → 8 → 9 → 10 → 11 → 12 → 13 → 14 → 15 → 16 → 17 → 18 → 19 → 20 → 21 → 22 → 23 → 24 → 25 → 26 → 27 → 28 → 29 → 30 → 31 → 32
21 → 9 → 2 → 10 → 3 → 11 → 4 → 12 → 5 → 13 → 6 → 14 → 7 → 15 → 8 → 16 → 17 → 25 → 18 → 26 → 19 → 27 → 20 → 28 → 21 → 29 → 22 → 30 → 23 → 31 → 24 → 32
324 → 32 → 1 → 9 → 17 → 25 → 2 → 10 → 18 → 26 → 3 → 11 → 19 → 27 → 4 → 12 → 20 → 28 → 5 → 13 → 21 → 29 → 6 → 14 → 22 → 30 → 7 → 15 → 23 → 31 → 8 → 16
Table 6. Maximum deformation in various directions resulting from different welding sequences (mm).
SchemesOverall DeformationX-DirectionY-DirectionZ-Direction
16.4701.5311.5186.451
26.4651.5111.4786.447
36.5181.4051.3396.500
Disclaimer/Publisher’s Note: The statements, opinions and data contained in all publications are solely those of the individual author(s) and contributor(s) and not of MDPI and/or the editor(s). MDPI and/or the editor(s) disclaim responsibility for any injury to people or property resulting from any ideas, methods, instructions or products referred to in the content.