Article

Numerical Investigations of Phase Transformations Controlled by Interface Thermodynamic Conditions during Intercritical Annealing of Steels

by
Clélia Couchet
1,2,*,
Frédéric Bonnet
2,
Julien Teixeira
1 and
Sébastien Y. P. Allain
1
1
Institut Jean Lamour, Centre National de la Recherche Scientifique, Université de Lorraine, Campus ARTEM, 54000 Nancy, France
2
ArcelorMittal Maizières Research SA, 57280 Maizières les Metz, France
*
Author to whom correspondence should be addressed.
Metals 2023, 13(7), 1288; https://doi.org/10.3390/met13071288
Submission received: 14 June 2023 / Revised: 5 July 2023 / Accepted: 11 July 2023 / Published: 18 July 2023
(This article belongs to the Section Computation and Simulation on Metals)

Abstract

:
Austenite formation was numerically investigated using Thermo-Calc/DICTRA in a deformed ferrite/pearlite microstructure to produce dual-phase steels. This work aims to better understand how the interface conditions (local equilibrium with negligible partitioning—LENP—or local equilibrium with partitioning—LEP) control the austenite growth kinetics during the intercritical annealing. Inspired by our experimental observations, two nucleation sites were considered. The austenite formed from pearlite islands showed a regime transition from LENP to LEP when the holding stage started. For the growth of austenite from isolated carbides, three stages were identified during the heating stage: first, slow growth under LEP; then, fast growth under LENP; and finally, after dissolution of the carbide, slow growth again. LENP and LEP interface conditions may coexist thanks to these regime transitions. In the case of competition, LEP conditions hinder austenite growth while it is promoted by LENP interface conditions. Such differences in growth kinetics explain, in part, the morphogenesis of dual-phase microstructures.

1. Introduction

Within the scope of the numerical transition of industry, steelmakers develop new modeling tools to drive their product lines [1,2,3]. Contrary to purely statistical approaches (including new machine learning capabilities), physic-based models offer additional advantages in terms of predicting ability even outside their calibration range, modularity, or possible extensions to other production steps or sites. However, such models are necessary to understand, quantify, and predict all the metallurgical mechanisms as well as their interactions all along the production line. The present work aims to contribute to the development of a such model for the production of conventional dual-phase (DP) steels but also to medium-Mn TRIP-aided steels in the future.
The DP microstructure consists of a ductile ferritic matrix hardened by martensitic dispersed islands. It is obtained by the intercritical annealing of a cold-rolled ferrite-pearlite microstructure. During the heating stage, carbides dissolve and austenite forms and grows [4,5]. The soaking in the intercritical range, during which the microstructure is ferrite-austenite, is followed by a fast cooling. During the cooling stage, ferrite can grow, but pearlite formation is prevented, and austenite transforms into quench components such as bainite or martensite (by displacive transformations). The mechanical properties of DP steels, combining both ductility and high strength, are driven by the morphology of their final heterogeneous microstructure, which is very sensitive to the intermediate austenite-ferrite microstructure formed during the intercritical annealing [2,6,7].
Our work is thus dedicated to the understanding of austenite formation from the initial microstructure, and in particular via the dissolution of cementite, as the growth of austenite in the intercritical range requires a source of carbon, and the content of carbon in ferrite is always very low.
In the cold-rolled state, cementite is found either in pearlite [4,5,8,9] or in isolated/dispersed carbides [8,9,10]. Both are observed in the initial microstructure of the steel studied in this work. A Scanning Electron Microscope (SEM) micrograph, processed by image analysis, of the studied industrial semi-product heated at 3 °C/s up to 600 °C and quenched (Picral etching) is shown in Figure 1 [9]. The image analysis (binarization, routines detailed in [4], and manual sorting) helps to discriminate the studied objects in the microstructure. The initial microstructure is composed of elongated pearlite islands, whose pearlitic cementite is colored purple, and isolated carbides, colored white, dispersed in a ferrite matrix, colored black.
These two sources of carbon are distinguished mainly by very different distances between the closest neighboring carbides and probably by different enrichments in substitutional elements. The presence of these two sources of carbon with their own thermochemical characteristics suggests that their dissolution kinetics and thus their participation in austenite transformation will also be different. In fact, the austenite transformation kinetics are known to be controlled by thermodynamic conditions at interfaces (cementite/austenite and austenite/ferrite) and long-range diffusion of alloying elements.
The austenite formation thermokinetics in Fe-C-X steels are often studied considering local equilibrium (LE) at the cementite/austenite and ferrite/austenite interfaces [5,10,11,12,13,14,15,16,17]. Two transformation regimes are defined: either substitutional partitioning is observed, called local equilibrium with partitioning (LEP), or not, called local equilibrium with negligible partitioning (LENP). The kinetics are either controlled by carbon diffusion under the LENP regime or by substitutional element diffusion under the LEP regime.
In Fe-C-Mn, starting from a ferrite-pearlite microstructure, Speich et al. [5] highlighted regime transitions during intercritical annealing. After the fast dissolution of the pearlite island, austenite grows fast in the ferrite matrix under the LENP regime. When carbon’s chemical potential reaches equilibrium, austenite grows slowly under the LEP regime. Similarly, the dissolution of isolated carbides (IC) in the matrix, simulated by Lai et al. [10], showed a regime transition. After nucleation on carbides, austenite grows fast under the LENP regime. After complete carbide dissolution, austenite grows slowly under the LEP regime.
The literature reports several modeling solutions for austenite formation. Empirical laws suit well for diffusive phase transformation [8,18,19]. However, their extrapolation to other materials is inadequate, as they rely on fitted parameters and experimental data. On the contrary, physically based models are more robust to extrapolation. The diffusion-controlled approach usually considers a sharp interface with Local Equilibrium and solves Fick’s equations [9,10,12,16,17,19,20,21]. In the interface-controlled approach, the interface friction limits the migration of the interface [22]. The mixed-mode model combines these two approaches [23,24]. However, the mobility parameters are often fitted to the studied steels. cellular automaton (CA) [25,26,27] and phase field (PF) [28,29,30,31] are the main full field models used to model phase transformation in steels. They are powerful numerical tools to simulate microstructural evolutions, but they have large computational needs. The systems are usually simplified to binary Fe-C or ternary with no (PE) or negligible (LENP) partitioning [32]. No significant substitutional partitioning (LEP) during austenite formation is modeled. Recently, machine learning (ML) approaches predicted phase transformation kinetics, microstructures, and mechanical properties [33,34,35,36] with reduced computation time. The quality of the ML models depends on the training dataset. Producing the training data and formatting it can be time-consuming in experiment time and expensive in computation time.
Moreno et al. [4,9] simulated austenite formation in a microstructure containing both pearlite and isolated carbides, as in Figure 1, using Thermo-Calc/DICTRA. The simulations reproduced well the growth regime transitions from carbon diffusion (LENP) to manganese diffusion (LEP) controlled regimes as well as the final austenite overshoot, as observed during in situ HEXRD (High Energy X-Ray Diffraction) experiments on synchrotron beam lines. However, those carbon sources were investigated in separate simulation cells. As a consequence, carbon transfer by diffusion through the ferrite matrix is prevented. This hypothesis is probably too simplistic because, as Miyamoto et al. [14] have shown, the dissolution of carbides can take place in ferrite without austenite, and the ferritic matrix is likely to sustain a significant carbon flux.
In this work, austenite formation during intercritical annealing is simulated in an industrial-like system inspired by a microstructural analysis using Transmission Electron Microscope (TEM) and SEM measurements. This paper focuses on the thermodynamic conditions at interfaces governing austenite formation kinetics and, in particular, the possible LENP/LEP competitions when encountering two close sources of carbon of different natures (pearlite/isolated carbide). It will be highlighted that only austenite with LENP interface conditions continues to grow significantly, fed by a carbon flux in ferrite and from austenite with LEP interface conditions.

2. Materials and Methods/Simulation Settings

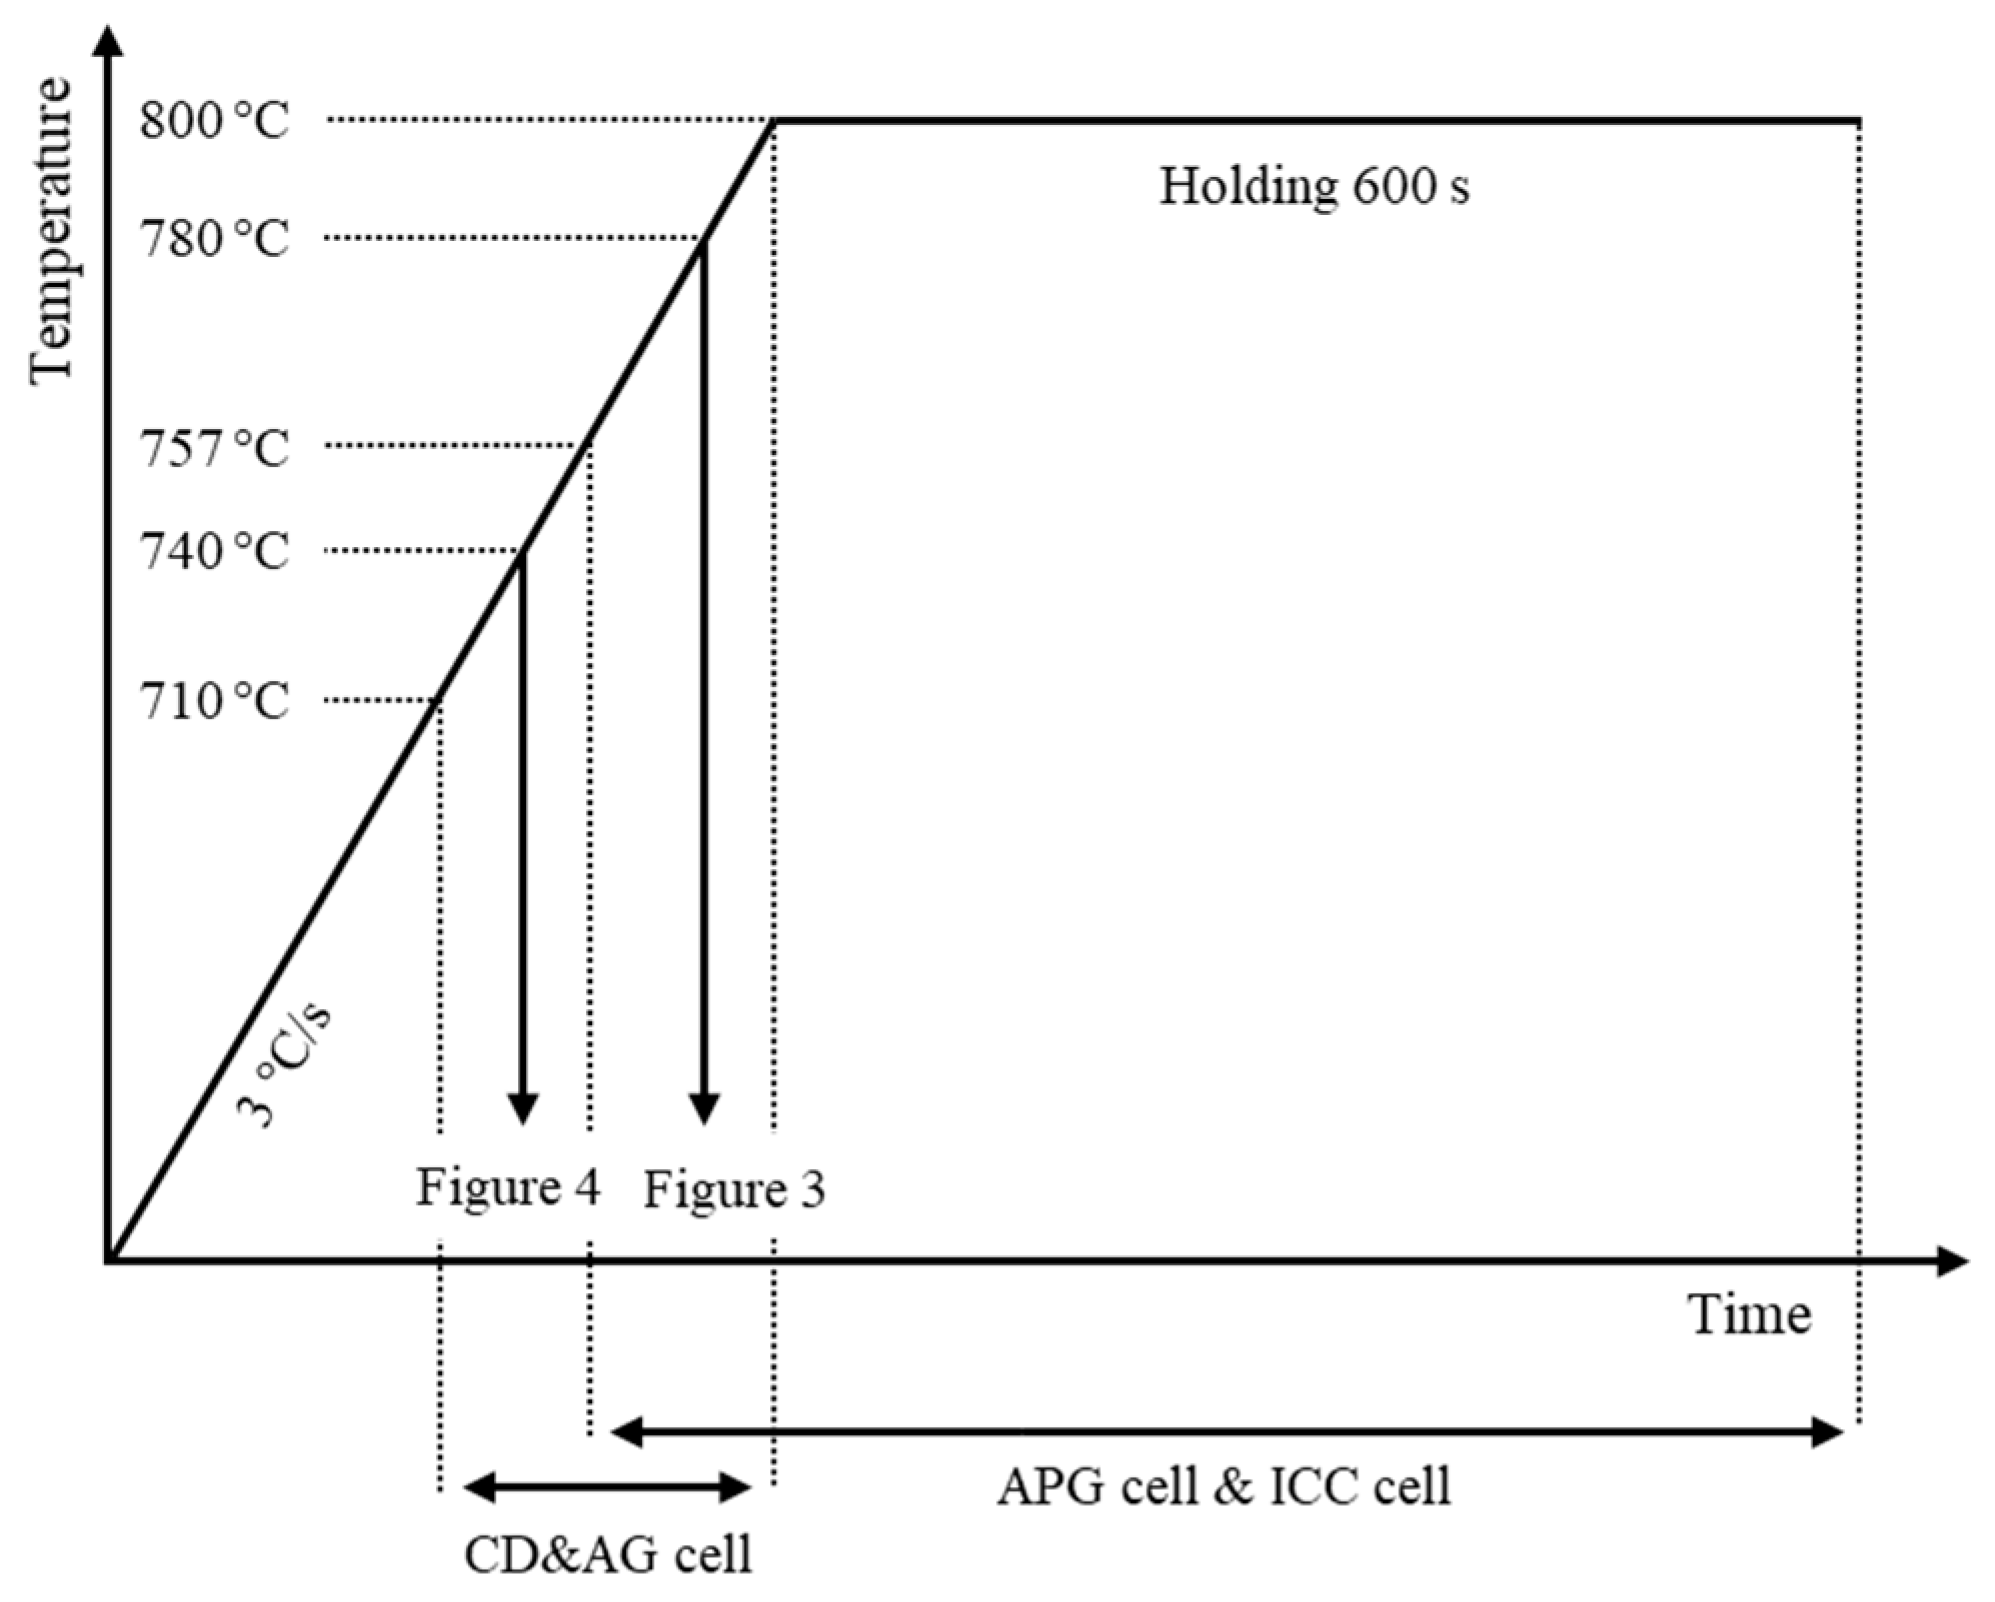
Austenite growth during the intercritical annealing at 800 °C is investigated in an industrial-like semi-product (i.e., as cold-rolled) for DP600 production by numerical simulations. The constant heating rate of 3 °C/s from room temperature to 800 °C chosen to conduct the simulations corresponds to current-day industrial practices. The studied thermal cycle is schematized in Figure 2.
The industrial nominal composition of the alloy is simplified to the ternary system Fe-0.1C-1.9Mn (wt%). DP steels generally contain additional alloying elements such as Cr, Si, Al, etc. The thermodynamics of the system are affected as the ortho-equilibrium (OE) austenite volume fraction at 800 °C increases from 81%, using the full industrial nominal composition, to 88%, using the simplified composition. The use of a model system is recommended in such a case as it ensures numerical convergence and mass balance and, thus, highlights the mechanisms without any numerical perturbation, which could affect the interface conditions. Besides, considering the full nominal composition in computations would require extrapolations from lower-order systems according to the CALPHAD method [37]. Thus, computation time would significantly increase with few gains in precision. The simplification to the ternary system diminishes in no way the generality of the results obtained.
The initial microstructure in the cold-rolled state of the studied industrial semi-product is shown in Figure 1. Pearlite islands (P) and isolated carbides (IC) constitute two carbon sources for austenite formation. The purpose of this paper is to investigate the growth regimes of the austenite formed from those different sources and their possible competition.
Three simulation cells were designed to this end. The first one is used to investigate the planar growth of austenite formed from pearlite bands, and the second one is used to study the carbide dissolution and growth of austenite from isolated carbides. The third cell is designed to investigate the competition between austenite domains with different interface conditions. The frame of investigation for each cell is reported in Figure 2.
The simulations were performed using the Thermo-Calc/DICTRA software (2020b version released by Thermo-Calc in 2020) [38] with the TCFE9 and MOBFE2 databases. The simulations are based on a local field model considering sharp interface and local equilibrium (LE) interface conditions. The diffusion equations are solved using activities. Meshing nodes are distributed on a unidimensional grid according to a geometrical progression to ensure a finer mesh at the moving interface. Both time and spatial discretization were set to ensure numerical convergence. Initializing the simulation cells with a continuity of manganese u-fraction or the LE tie-line at interfaces, computed with Thermo-Calc, was found to help the simulations start and promote numerical convergence.
In the following sections, we will present in detail the parameters used for the data collection of the studied configurations based on microstructural observations. By using the parameters of a real microstructure, it is possible to set consistent conditions for comparable numerical simulations.

2.1. Simulation Cell for Austenite Planar Growth Investigation (APG Cell)
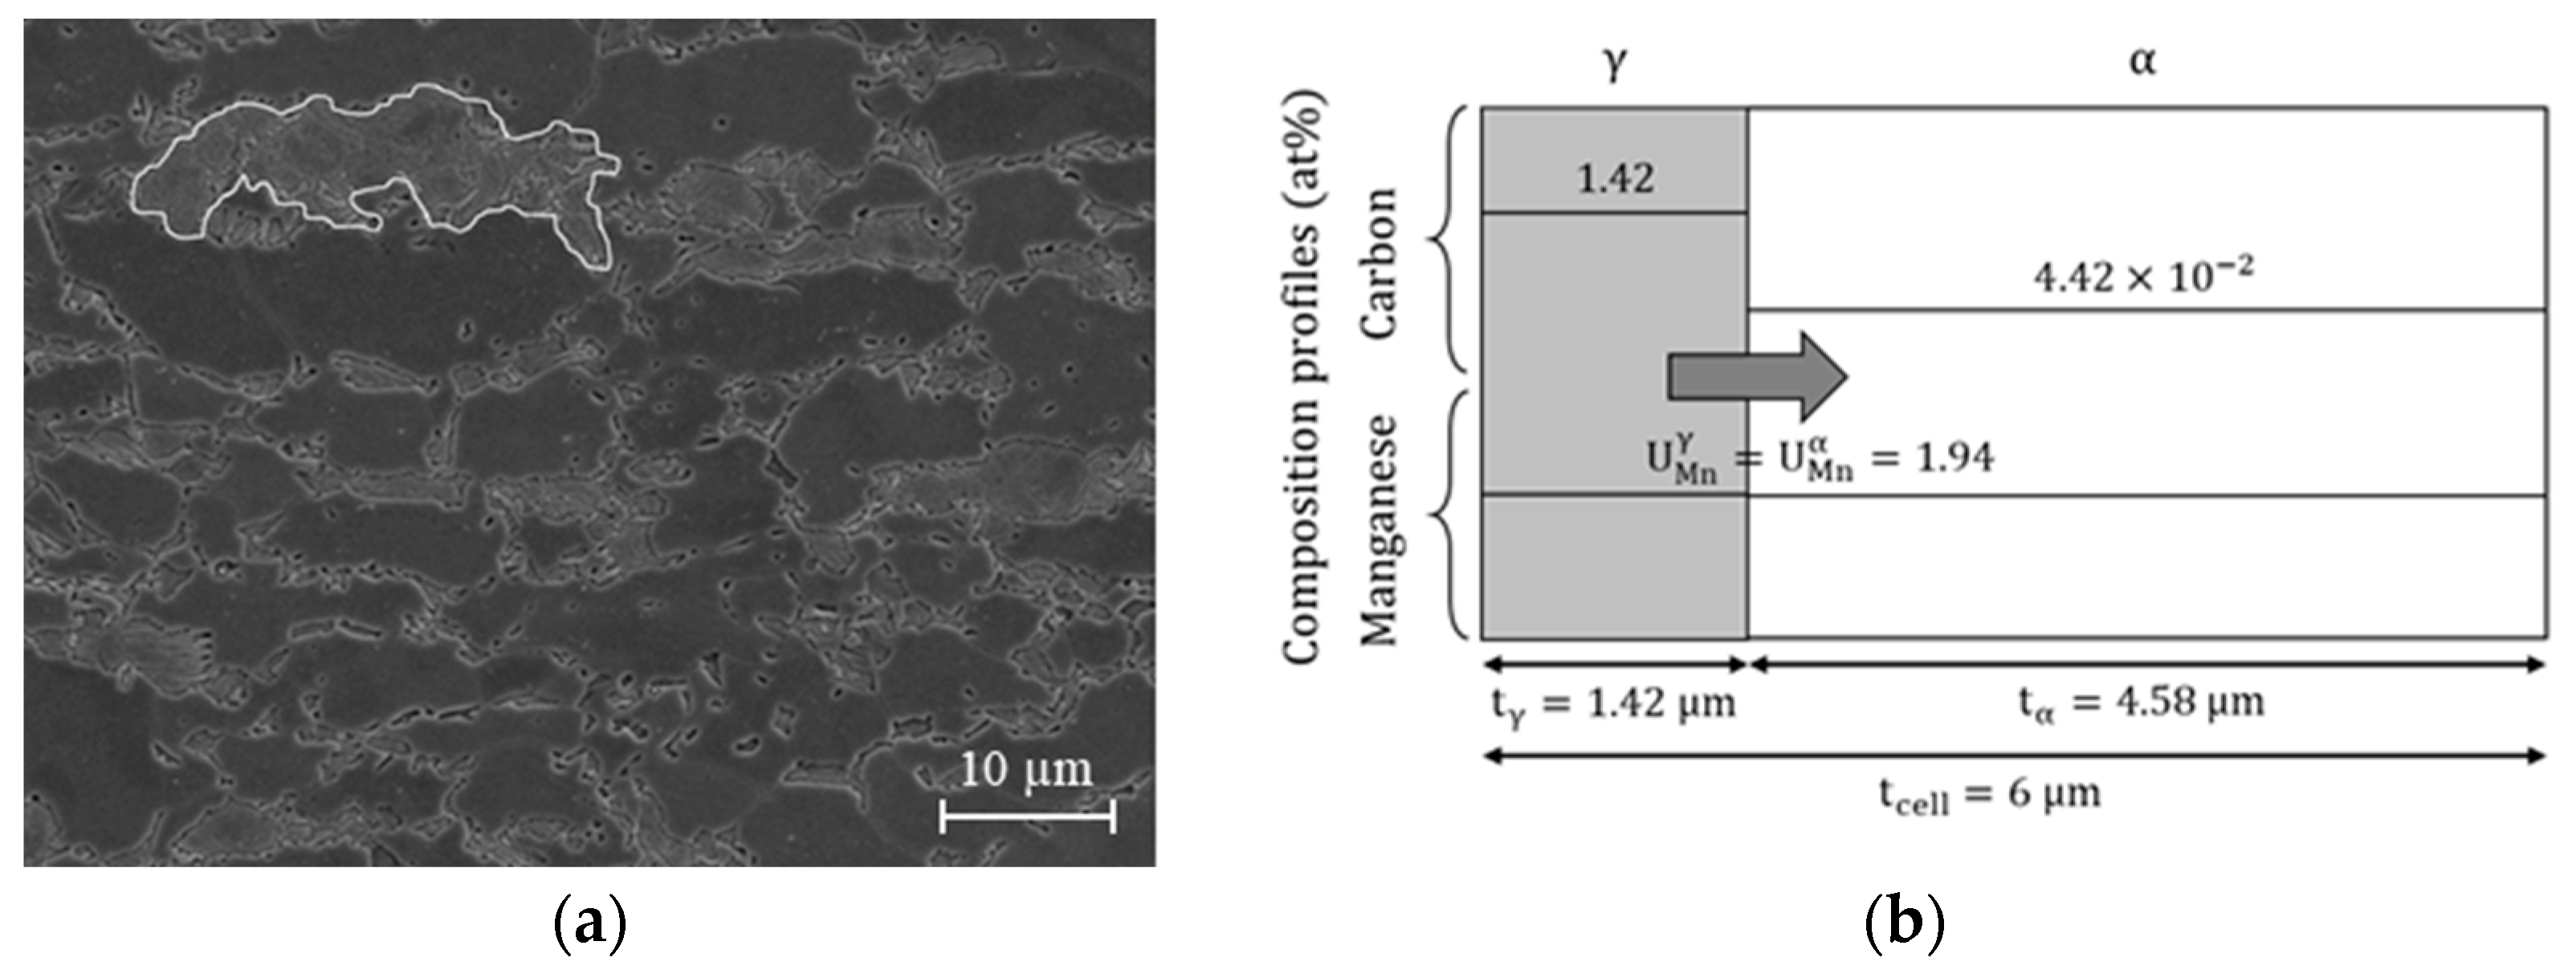
A SEM micrograph after Picral etching of the studied steel annealed up to 780 °C at 3 °C/s and quenched is shown in Figure 3a. A former pearlitic domain, already transformed into austenite at 780 °C, is contoured in white. It corresponds to the intermediate state of the microstructure at the very beginning of the austenite growth, just after the transformation of the pearlitic island into austenite. Considering its aspect ratio, the domain can be considered to grow in ferrite with a planar interface. Inspired by a complete SEM study detailed in [9], the first simulation cell, schematized in Figure 3b, aims to study the austenite (γ) growth in the ferrite matrix (α) after pearlite islands transformation considering a planar geometry. The key microstructure sizes in the simulation are also reported.
Figure 3. (a) SEM micrograph of the studied steel heated up to 780 °C and quenched (cf. Figure 1). A former pearlitic domain, transformed into austenite during heating, is delineated in white. The cell used to simulate this growth is schematized in (b).
Metals 13 01288 g003
The pearlite islands are often aligned in relation to manganese microsegregation bands observed in these industrial steels and thus form “bands” of pearlite. These pearlite islands are formed at the end of the hot-rolling process, on the run-out-table, and during coiling. After a prior study on the studied steel, pearlite formed around 570 °C. In this condition, using Hultgren’s extrapolation of Acm [39], the carbon composition of pearlite is estimated at 1.78 at% (0.39 wt%).
A previous simulation study by Moreno et al. [4,9] on this steel highlighted that pearlite dissolution and transformation into austenite is fast and occurs around 760 °C (757 °C exactly). The austenite inherits the composition of the pearlite island. Moreno’s study also showed that pearlitic cementite dissolution occurs with partitioning [4], which could involve local heterogeneities (ghost manganese enrichment [40]). However, these heterogeneities are assumed to be too far from the interface to influence its velocity. For the sake of simplicity, carbon and manganese are thus considered homogenized in the austenite in our simulations.
The level of microsegregation is only +/−0.1 wt%. Thus, manganese microsegregation is neglected, as in [4]. The manganese u-fraction is supposed to be equal and uniform throughout the system and set to the nominal composition of 1.94 at%.
Ferrite carbon composition in bulk is evaluated at 4.42 × 10⁻² at% with Thermo-Calc, considering the continuity of carbon activity at the interface.
The thickness of the simulation cell is set to tcell = 6 µm, the half of the distance between two pearlite bands. A carbon balance gives the austenite (24%) and ferrite (76%) volume fractions. The thickness of the austenite layer, tγ = 1.42 µm, and the ferrite layer, tα = 4.58 µm, are deduced from their fraction.

2.2. Simulation Cell for Carbide Dissolution and Austenite Growth Investigation (CD and AG Cell)

A SEM micrograph after Picral etching of the studied steel annealed at 740 °C at 3 °C/s and quenched is shown in Figure 4a. Remaining isolated carbides (bright white) are surrounded by austenite (etched—dark gray) either inside ferrite (light gray) grains or at grain boundaries. It corresponds to the intermediate state of the microstructure at the very beginning of the austenite growth, just after its nucleation on isolated carbides. This configuration has inspired our second simulation cell, schematized in Figure 4b. This latter aims to study the isolated carbide (θ) dissolution and the resulting austenite (γ) growth in the ferrite matrix (α), considering a spherical geometry. The key sizes to describe the initial microstructure in the simulation are reported in Figure 4b.
In the initial state, the simulation cell contains a carbide in a ferrite matrix. During the heating stage, the austenite formation starts around 710 °C, as shown by our SEM and HEXRD study detailed in [9] and supported by the empirical formula of Kasatkin [41] considering the simplified composition. The initial state is set to 710 °C. At this temperature, spheroidization has already occurred, as shown by Moreno [4,9,42]. Thus, spherical geometry has been chosen. During heating up to 710 °C, the carbides coarsen and are progressively enriched in manganese. This latter enrichment was quantified by TEM. The carbide radius and manganese u-fraction are set to Rθ = 110 nm and U M n θ = 8.8 at%, respectively, supported by the TEM measurements. As the numerical convergence of DICTRA simulation was improved by initializing the simulation cells with a continuity of manganese u-fraction or a LE tie-line at interfaces, the composition and size of both austenite and ferrite were computed using Thermo-Calc calculations.
Figure 4. (a) SEM micrograph after Picral etching of the studied steel annealed at 740 °C and quenched (cf. Figure 1). Remaining isolated carbides (bright white) are surrounded by austenite (etched—dark gray) either inside ferrite (gray) grains or at grain boundaries. The cell used to simulate this growth is schematized in the initial state at 710 °C in (b).
Metals 13 01288 g004
Facing the lack of data on the nucleation energy of austenite on carbides, the inactive phase option of Thermo-Calc/DICTRA is not used in the following simulations [4,19]. Thus, a thin layer of austenite is inserted between the carbide and the ferrite shell. The thickness of this austenite layer is arbitrarily set to tγ = 0.1 nm. Moreno et al. [43] showed that the manganese profile in cementite particles is nearly flat. The manganese u-fraction is supposed to be initially uniform inside the carbide and the matrix.
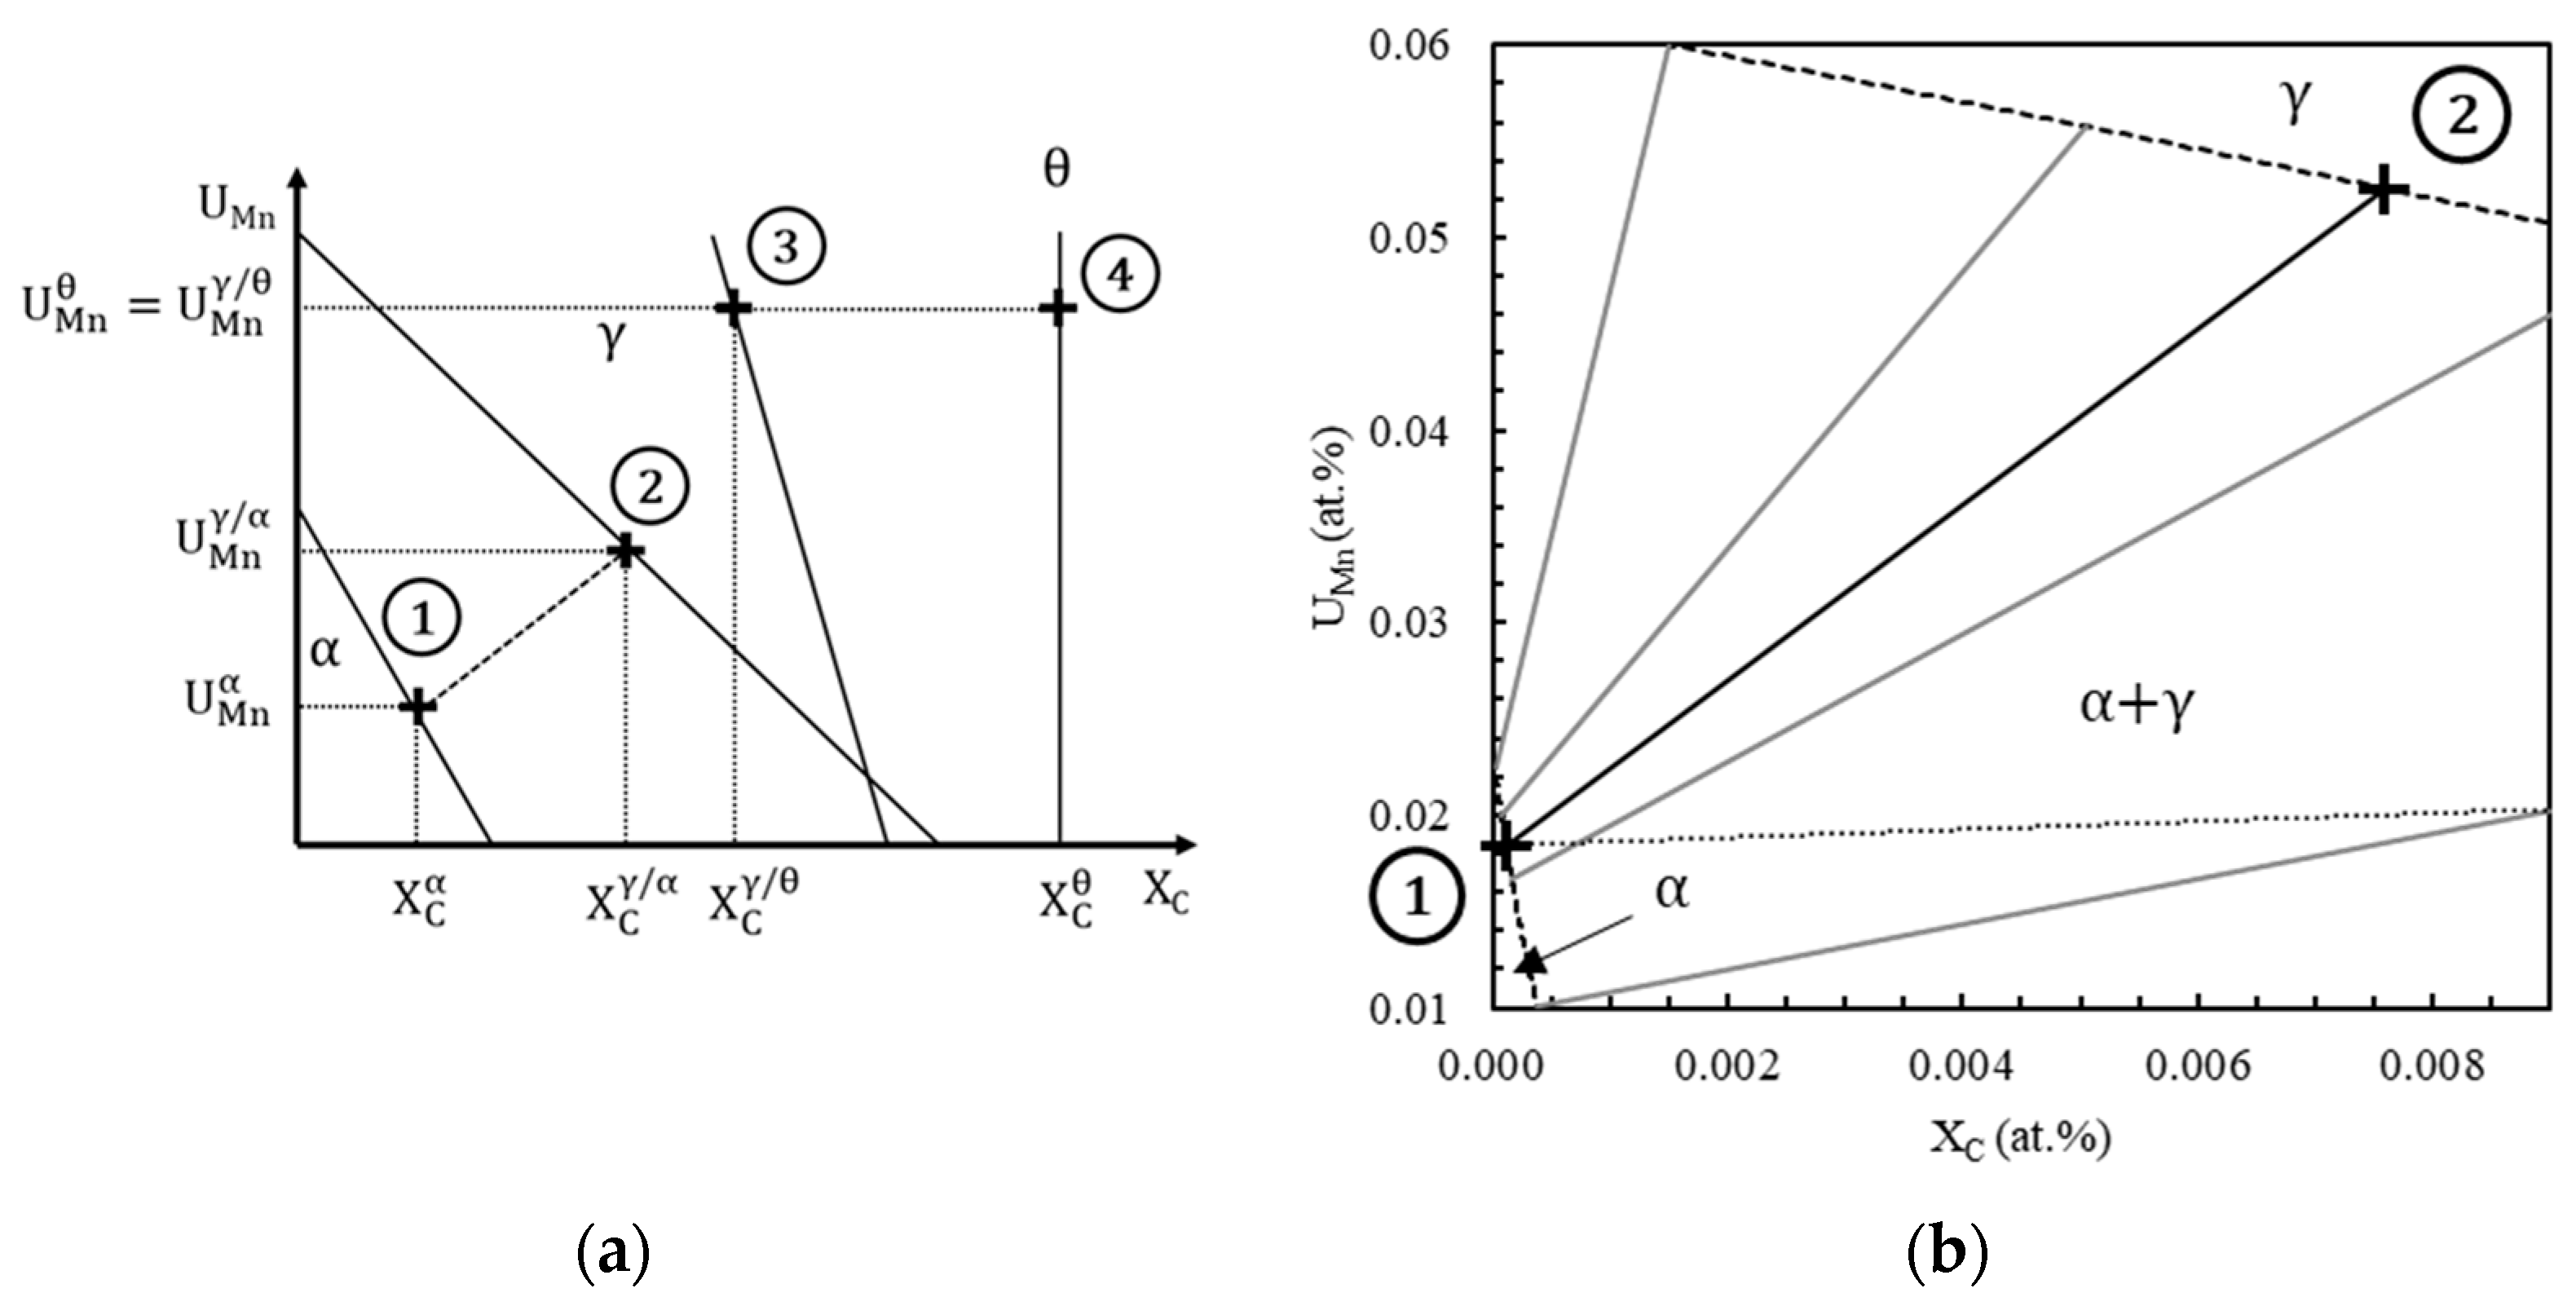
Figure 5a shows the phase diagram of the ternary Fe-C-Mn system. The composition of the carbide at the interface X C θ / γ , U M n θ / γ is supposed to be identical to its bulk composition X C θ , U M n θ and is indicated by a cross labeled 4. The composition of the austenite at the interface γ/θ, X C γ / θ = 3.0   a t % , U M n γ / θ = 8.8   a t % , is indicated by a cross labeled 3. This composition is computed using Thermo-Calc, considering the continuity of the u-fraction of manganese at the interface γ/θ ( U M n γ / θ = U M n θ ). The composition of ferrite and austenite at the interface γ/α is chosen as follows:
  • First, possible ferrite compositions X C α , U M n α , plotted in Figure 5b with a black dotted line, are computed by carbon mass balance as a function of the cell size such that the simulation cell has the nominal composition in carbon and manganese of the steel.
  • Then, Thermo-Calc is used to compute equilibrium operative tie-lines, highlighted in Figure 5b with gray solid lines, at the interface α/γ at 710 °C. There is a single ferrite composition that both belongs to an equilibrium tie-line and makes possible the mass balance. This composition, marked by a cross labeled 1 in Figure 5a,b, is chosen as ferrite bulk composition X C α = 1.2 × 10 2   a t % , U M n α = 1.8   a t % and interface composition X C α / γ , U M n α / γ . The chosen tie-line, plotted with a black solid line in Figure 5a,b, gives the austenite composition X C γ / α = 0.8   a t % , U M n γ / α = 5.3   a t % at the interface γ/α, represented by the cross labeled 2 in Figure 5a,b.
  • Finally, the carbon and manganese profiles in austenite are supposed to be linear between interface compositions. The initial carbon and manganese profiles are schematized in Figure 4b.

2.3. Simulation Cell for Interface Condition Competition Investigation (ICC Cell)

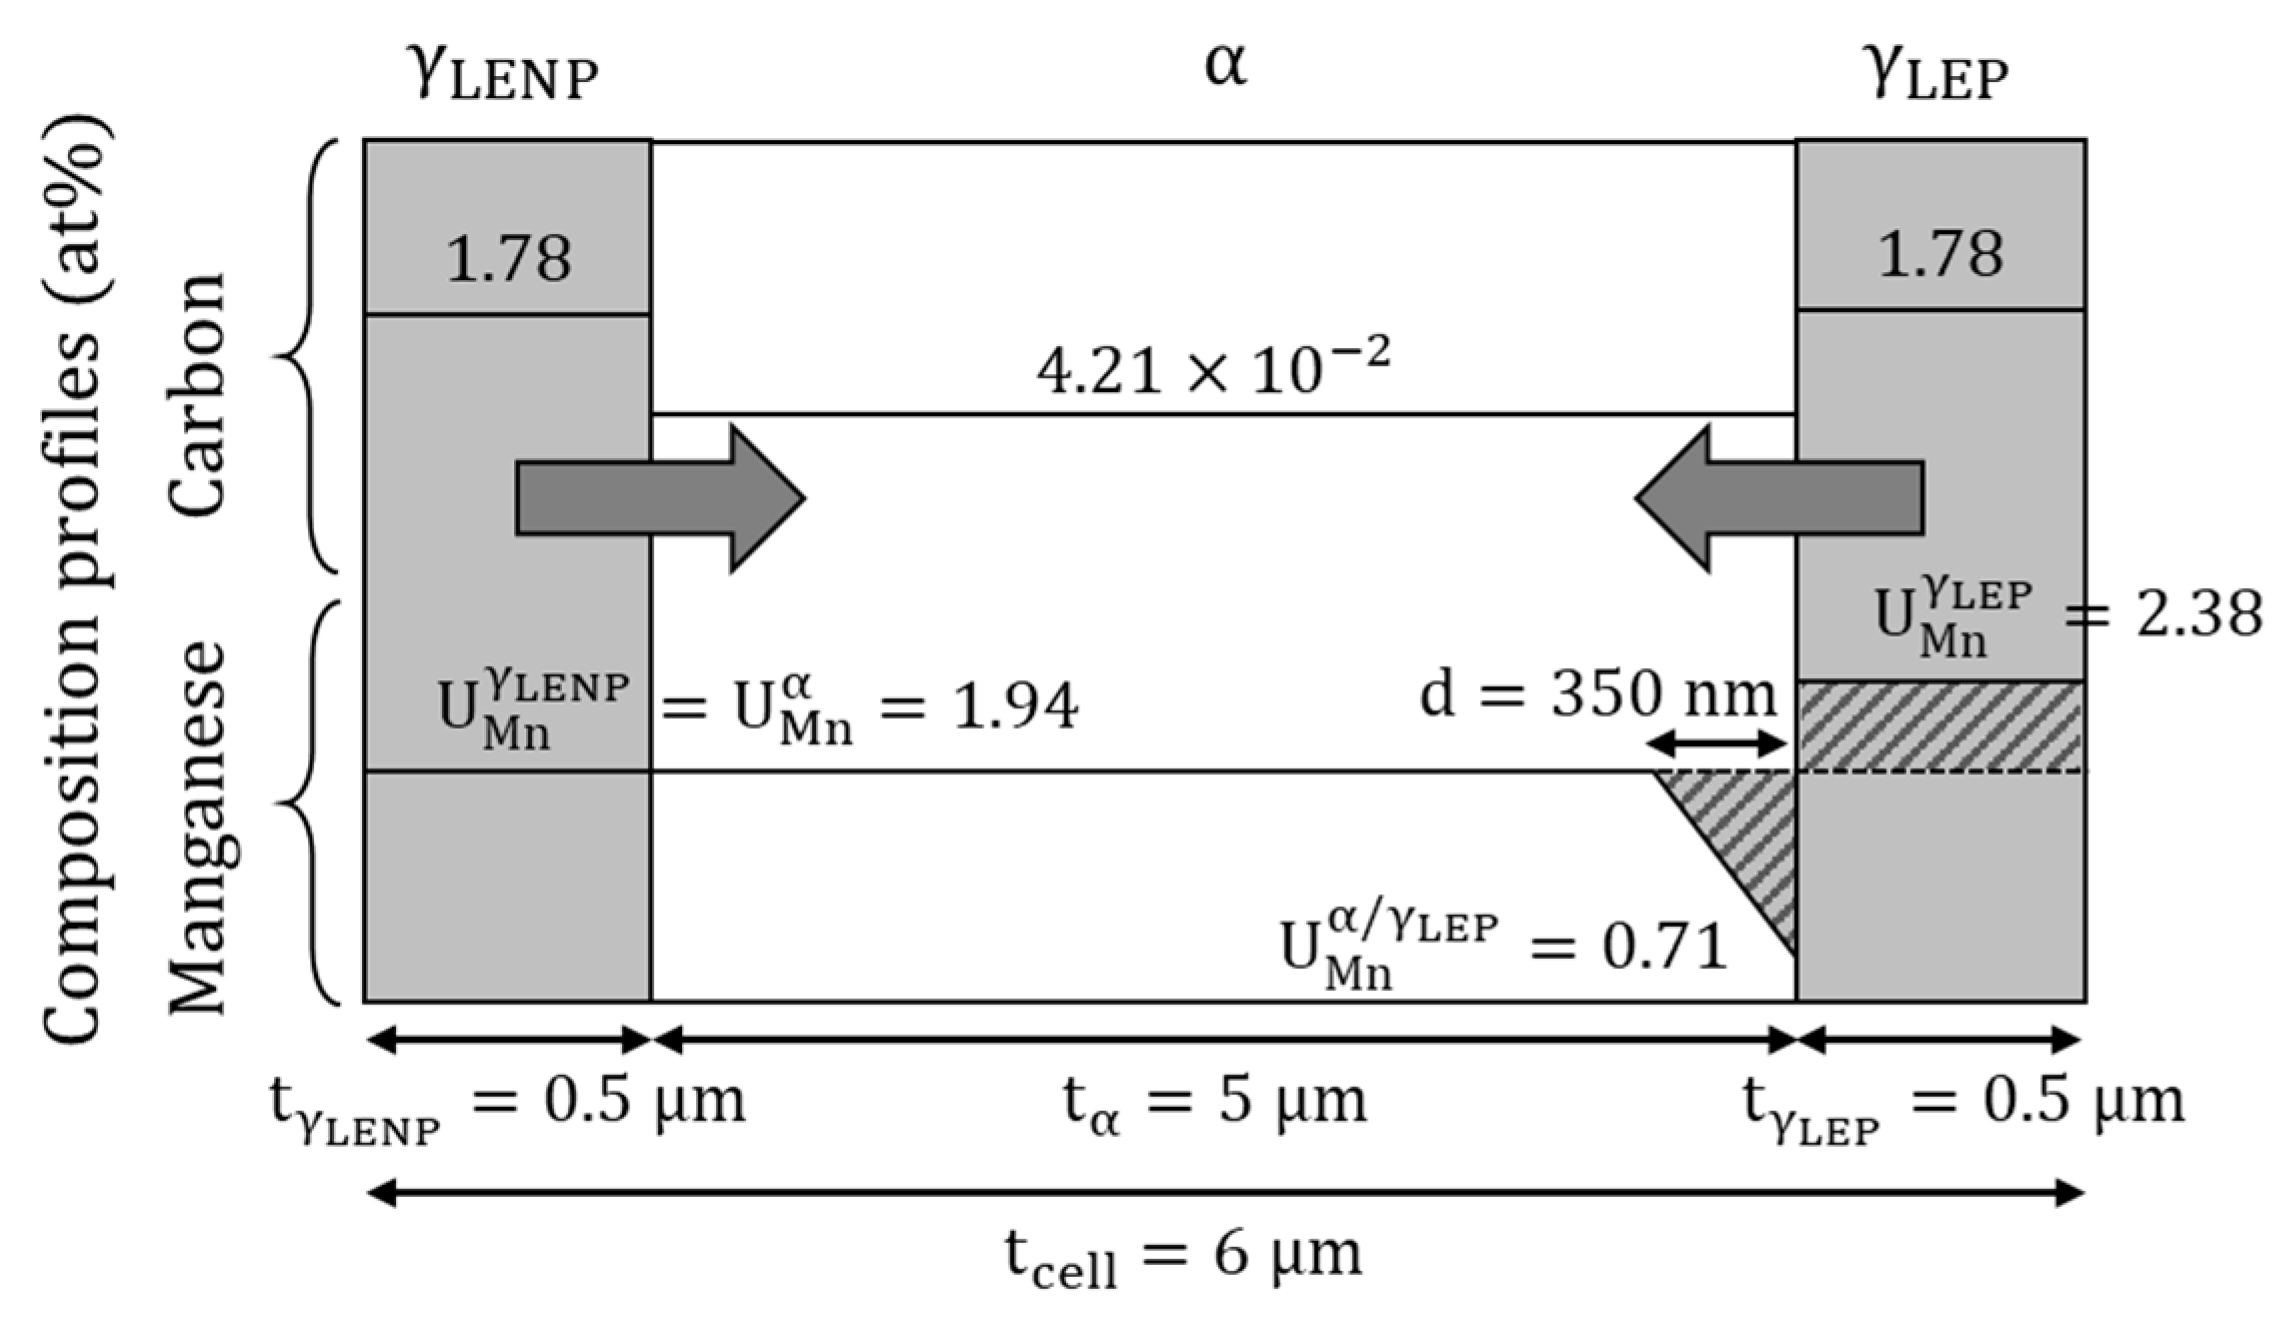
A third simulation cell is designed to investigate the possible growth competition between austenite islands with different LE interface conditions—with, labeled γLEP, or without, labeled γLENP, manganese partitioning—in the ferrite matrix (α). To this end, a planar geometry is used. Figure 6 shows size parameters and schematizes composition profiles along the simulation cell. Two austenite islands are placed at both ends of the cell.
Inspired by APG cells (2.1), their carbon composition is set to 1.78 at%. A carbon mass balance gives ferrite carbon composition in bulk. Manganese depletion due to previous growth under LEP interface conditions is imitated in ferrite at the interface α/γLEP. The depletion width is inspired by isolated carbide dissolution simulations during the heating stage at 3 °C/s. The depletion width at 757 °C, the initial temperature for the present cell, is extracted from the results of the simulation using the CD and AG cell. Considering a manganese mass balance from spherical to planar geometry, the depletion width in the ICC cell is set to 350 nm.
To initialize the LENP tie-line, the manganese u-fraction in γLENP and ferrite is set equal to the nominal u-fraction. Manganese partitioning in γR is reproduced. The manganese composition in γLEP is the composition of γLENP, to which the manganese of the depletion is added.
The cell size is set to 6 µm, inspired by the APG cell (2.1). The thickness of the austenite islands is arbitrarily set to 0.5 µm. The global composition of this model cell, wC0 = 0.073 wt% and wMn0 = 1.91 wt%, is not exactly the nominal simplified composition of the studied alloy, lowering the ortho-equilibrium (OE). If the thickness of the austenite islands were chosen by carbon mass balance so that the global composition of the cell matches the nominal composition of the studied steel, the cell becomes almost completely austenitized (97%) during the holding stage. This makes impossible the analysis of the interaction between austenite islands in the late holding stage, especially the manganese partition.

3. Results and Discussion

In the following, the results of the different simulations are presented and discussed. Austenite fractions computed with Thermo-Calc/DICTRA are compared to the expected theoretical LENP and OE fractions. The first one is the austenite fraction computed considering LENP interface conditions and no carbon or manganese gradient in austenite or in ferrite. The second one is the austenite fraction at ortho-equilibrium.
These numerical results are deliberately not compared with the experimental data [4,9], as they were obtained on a quinary alloy with a significantly different ortho-equilibrium.

3.1. Austenite Planar Growth (APG Cell)

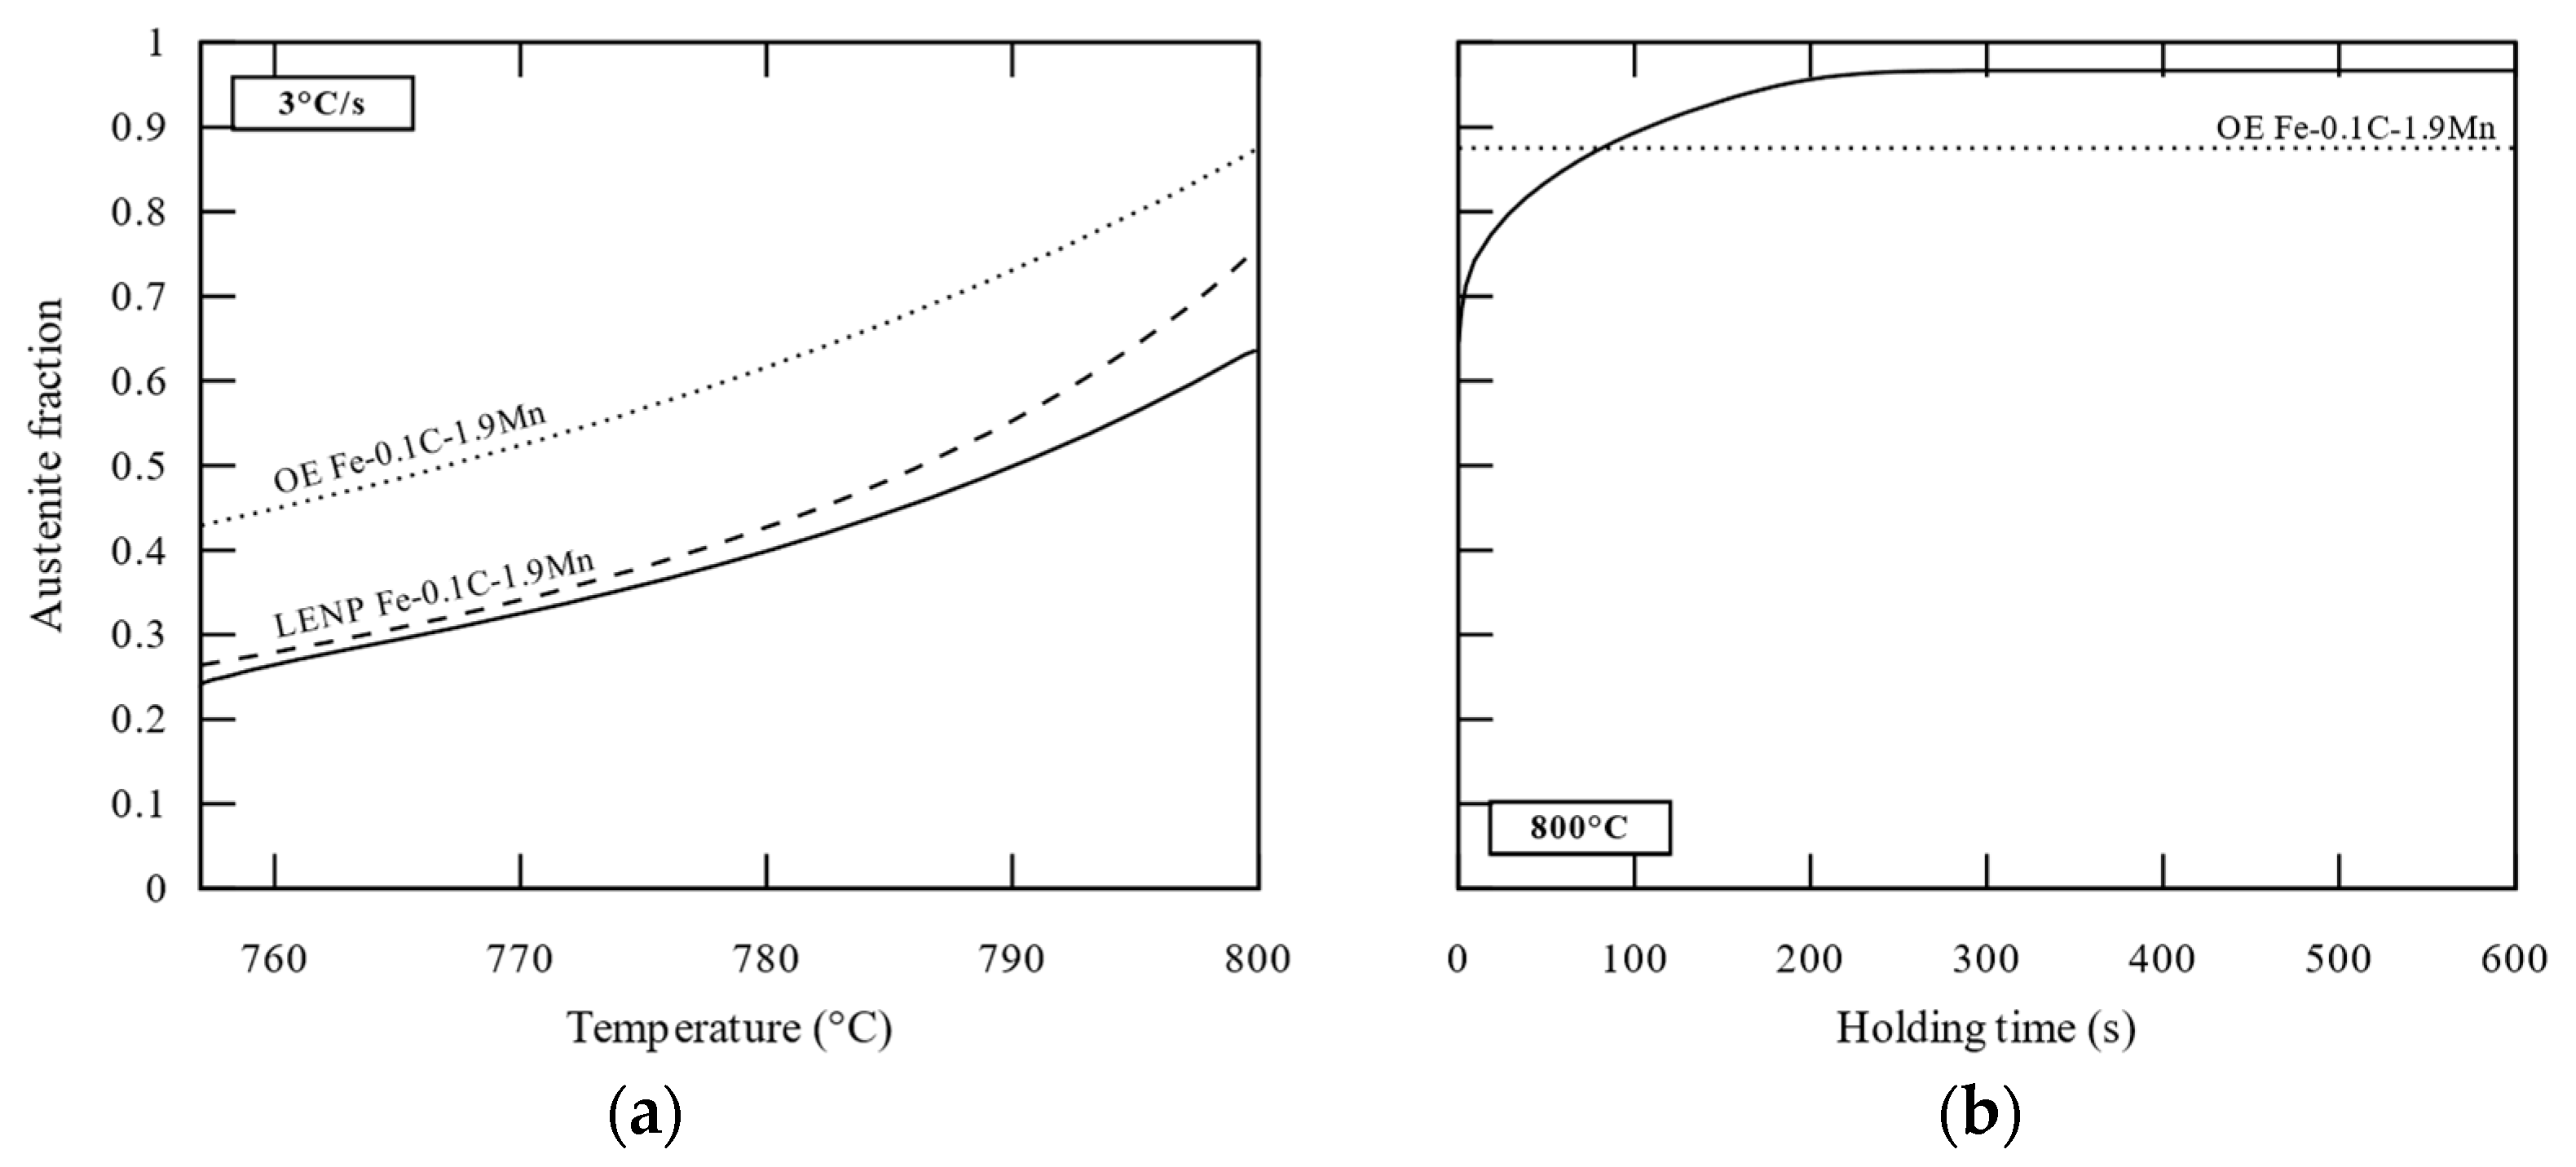
The austenite (γ) fraction computed with Thermo-Calc/DICTRA is plotted with a solid line in Figure 7 during the heating (a) and holding (b) stages.
After pearlite dissolution at about 760 °C, the simulation cell contains 24% austenite. During the heating stage, the austenite fraction increases with temperature, indicating the growth of the initial band. A gap between the austenite fraction and the LENP fraction appears and widens as the temperature increases. The austenite fraction is 63% at the end of the heating stage, lower than the expected LENP fraction. The austenite fraction keeps increasing and finally reaches 97% after 250 s holding. Then the fraction remains stable. The final fraction overshoots the OE of the simplified ternary (88%) by 9%.
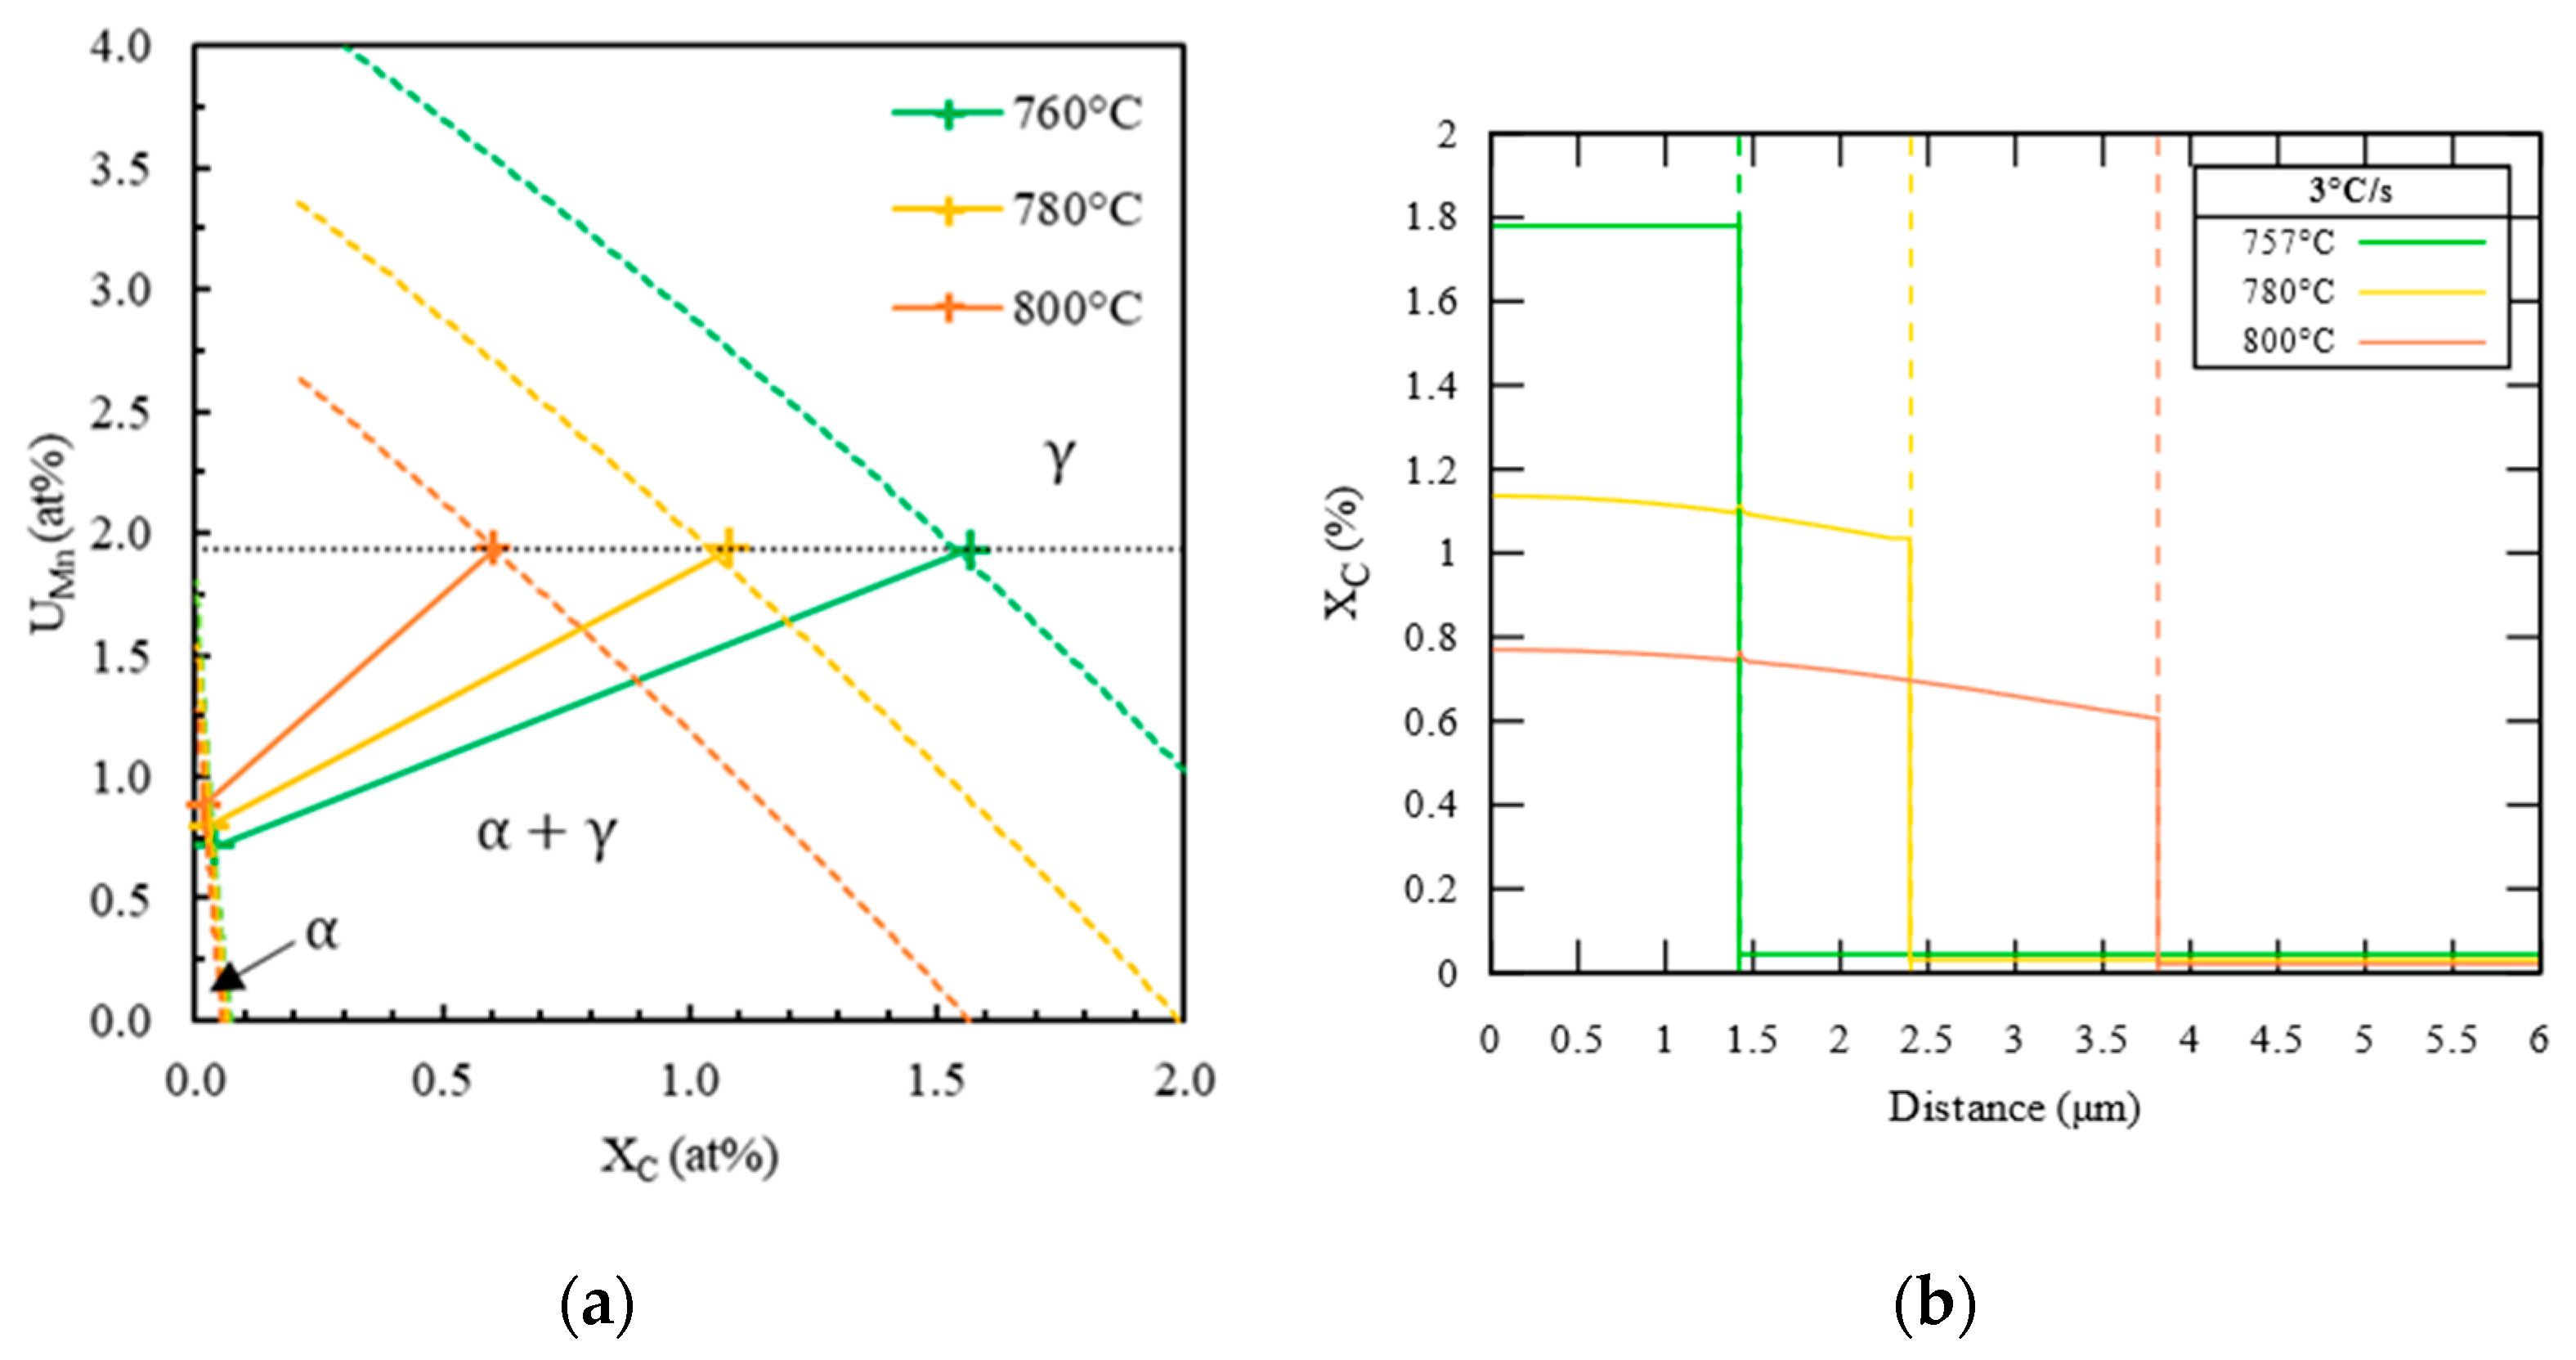
Operative tie-lines computed using Thermo-Calc/DICTRA (a) and carbon profiles (b) at 760 °C (green), 780 °C (yellow), and 800 °C (orange) during the heating stage are plotted in Figure 8. All along the heating stage, the manganese composition of austenite at the moving interface is inherited from the ferrite. Thus, austenite growth occurs under the LENP regime during the heating stage. Nevertheless, carbon in austenite is not completely homogeneous at the end of the heating at 3 °C/s. Considering the geometry of the system and the chosen dimensions, 3 °C/s is too fast for carbon to diffuse to the interface and homogenize in the whole austenite. Still, the carbon composition at the interface corresponds to LENP conditions, as pictured in Figure 8a. This carbon distribution leads to a lower austenite fraction than expected under theoretical LENP conditions (LENP interface conditions and no composition gradient). At the very beginning of the holding stage, carbon diffuses in austenite and is homogeneously distributed in less than 4 s.
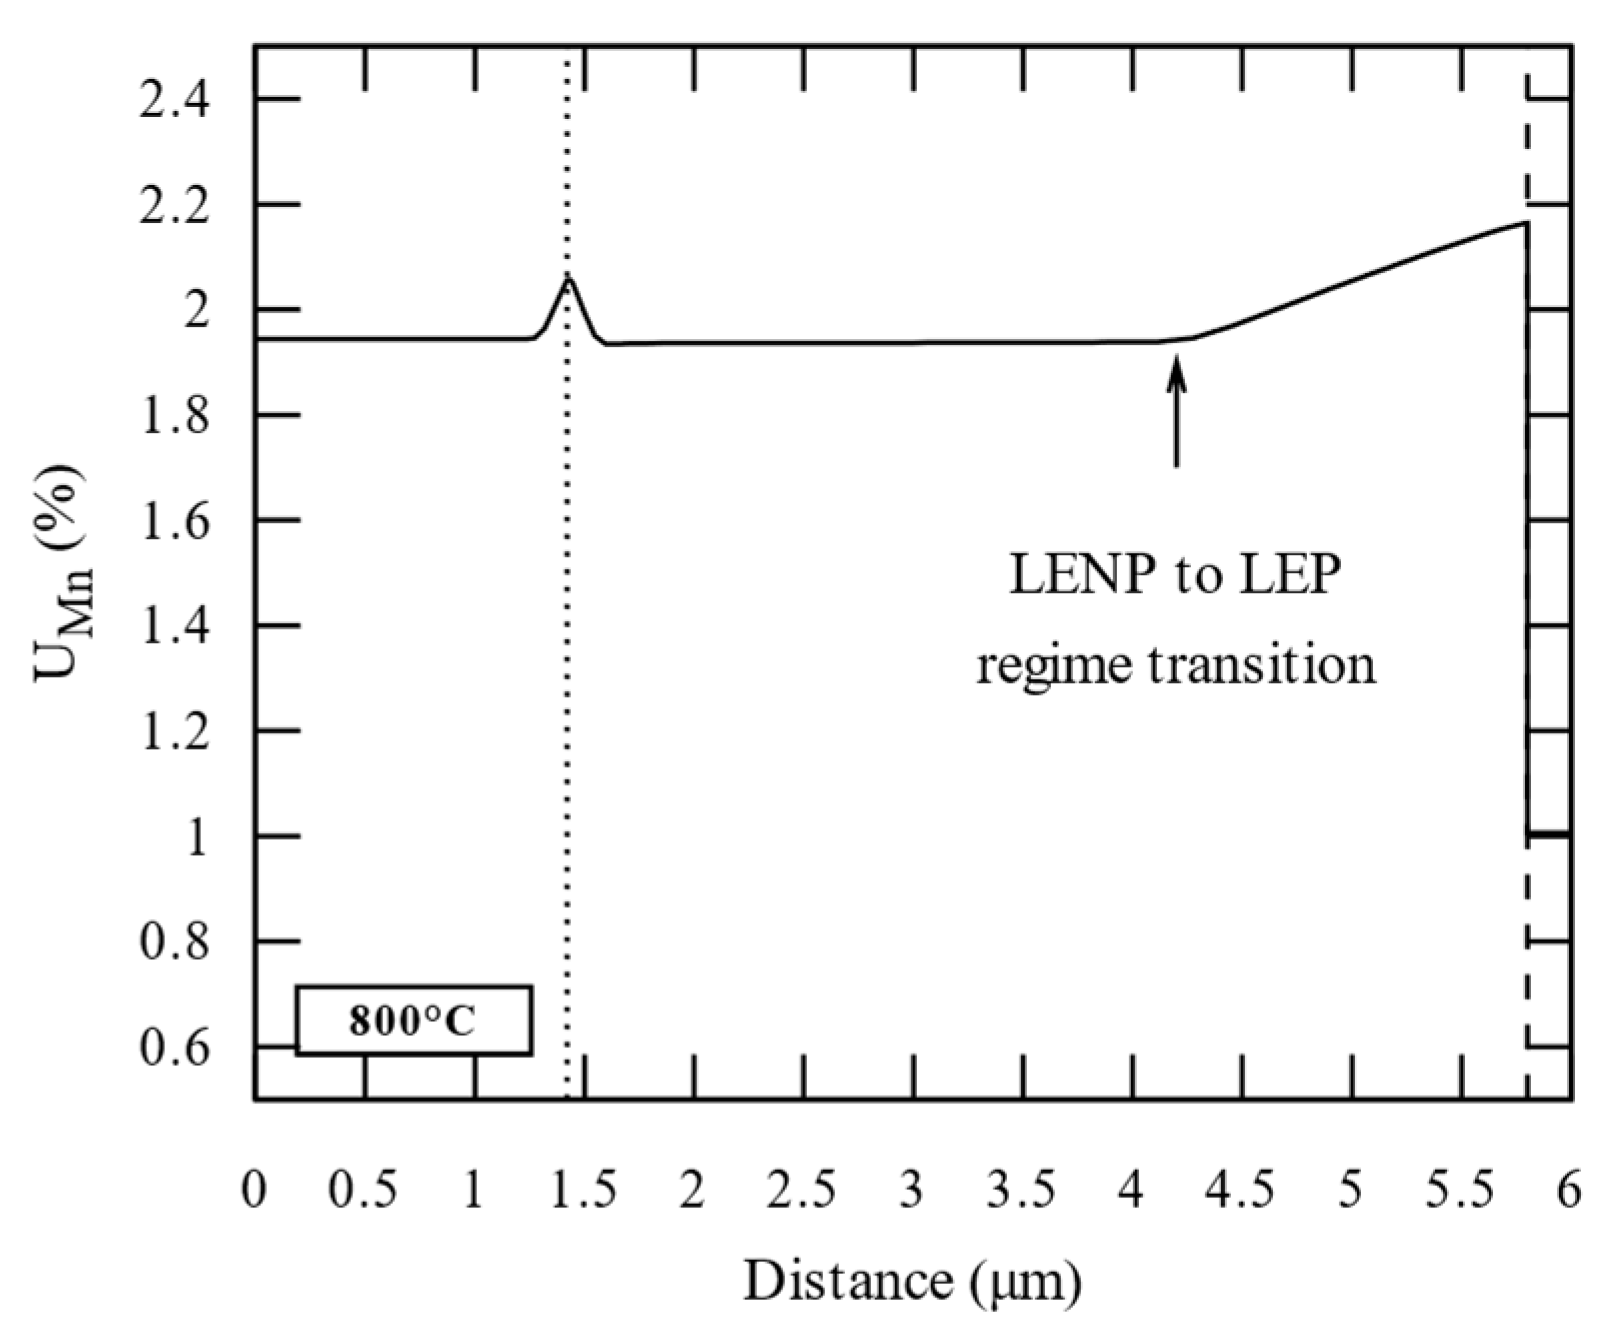
The manganese u-fraction through the simulation cell at the end of the holding stage is plotted in Figure 9. The u-fraction remains stable from the center of the simulation cell to the position of the interface at the end of carbon homogenization. A gradient is built by manganese partition from this latter position to the interface position after 600 s at 800 °C. The manganese composition in ferrite is homogenous and equals the manganese interface composition. The manganese gradient indicates a regime transition from LENP to LEP, indicated by an arrow in Figure 9. Under the LEP regime, austenite growth is controlled by slow manganese diffusion in ferrite. The austenite growth stops when manganese u-fraction in ferrite reaches the interface composition. The austenite overshoot (i.e., the austenite fraction overcoming the OE) during the holding stage is due to the manganese heterogeneity in austenite, as explained by many authors in the literature [4,10,16,19,44,45].

3.2. Carbide Dissolution and Austenite Growth Investigation (CD and AG Cell)

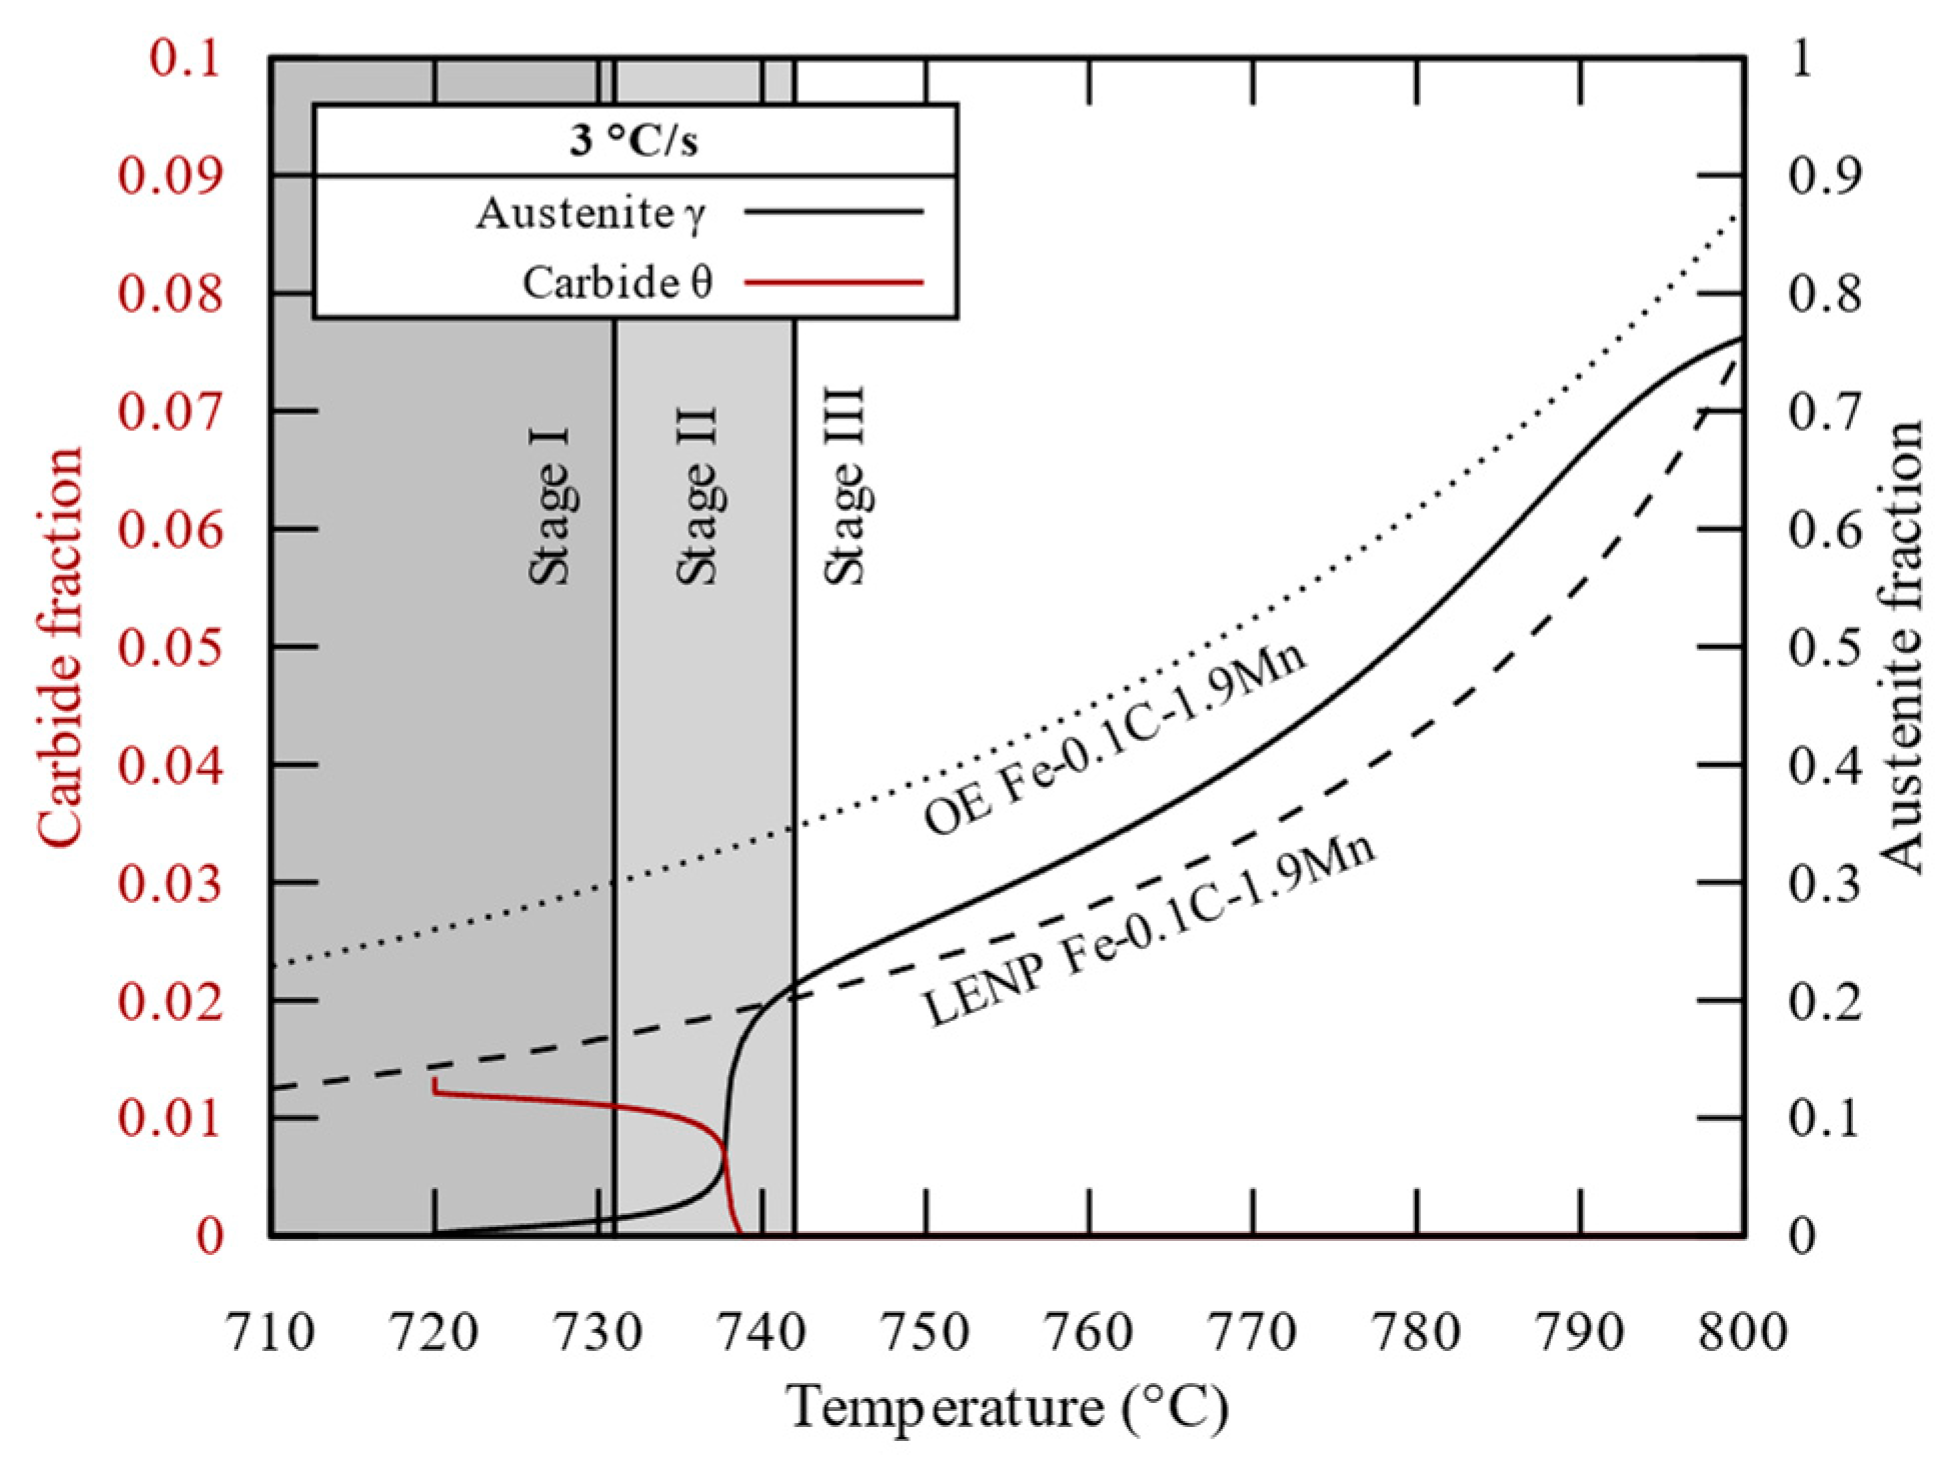
The carbide (θ—red solid line) and austenite (γ—black solid line) fractions calculated using the CD and AG cell are plotted in Figure 10 during the heating stage at 3 °C/s. The expected theoretical LENP and OE austenite fractions are plotted with dashed and dotted lines, respectively.
Initially, the simulation cell contains 1.3% carbide and a negligible fraction of austenite. During heating, three growth stages are observed. First, the carbide fraction decreases while the austenite fraction increases, both slowly (stage I). Around 740 °C (stage II), the carbide fraction shrinks down to 0% and the austenite fraction reaches approximatively the LENP fraction in a very short time (less than 0.5 s).
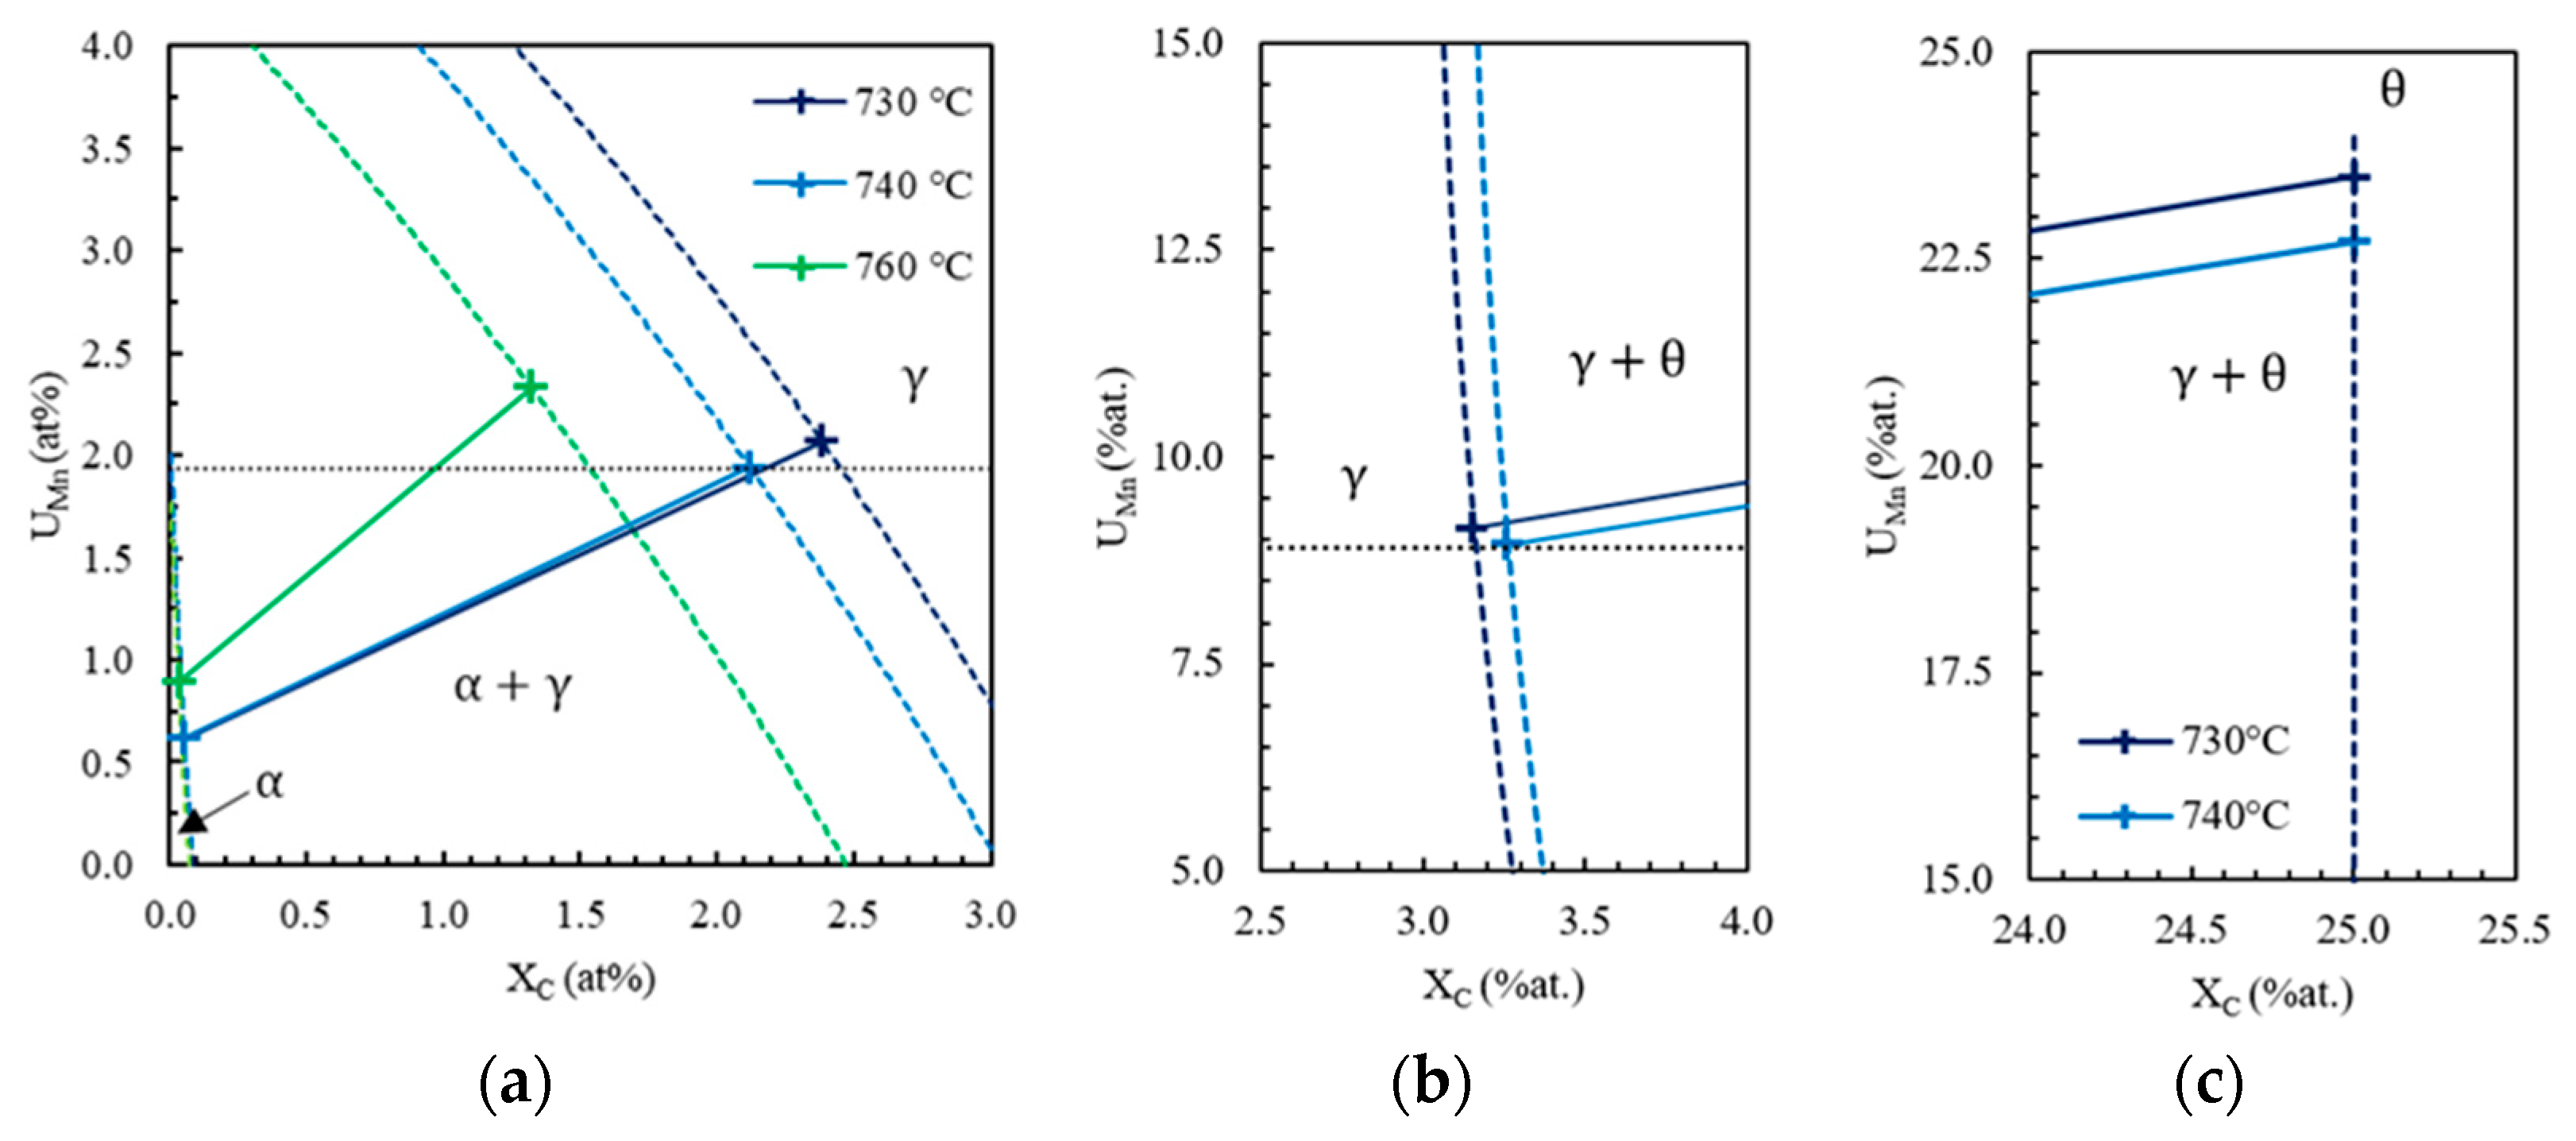
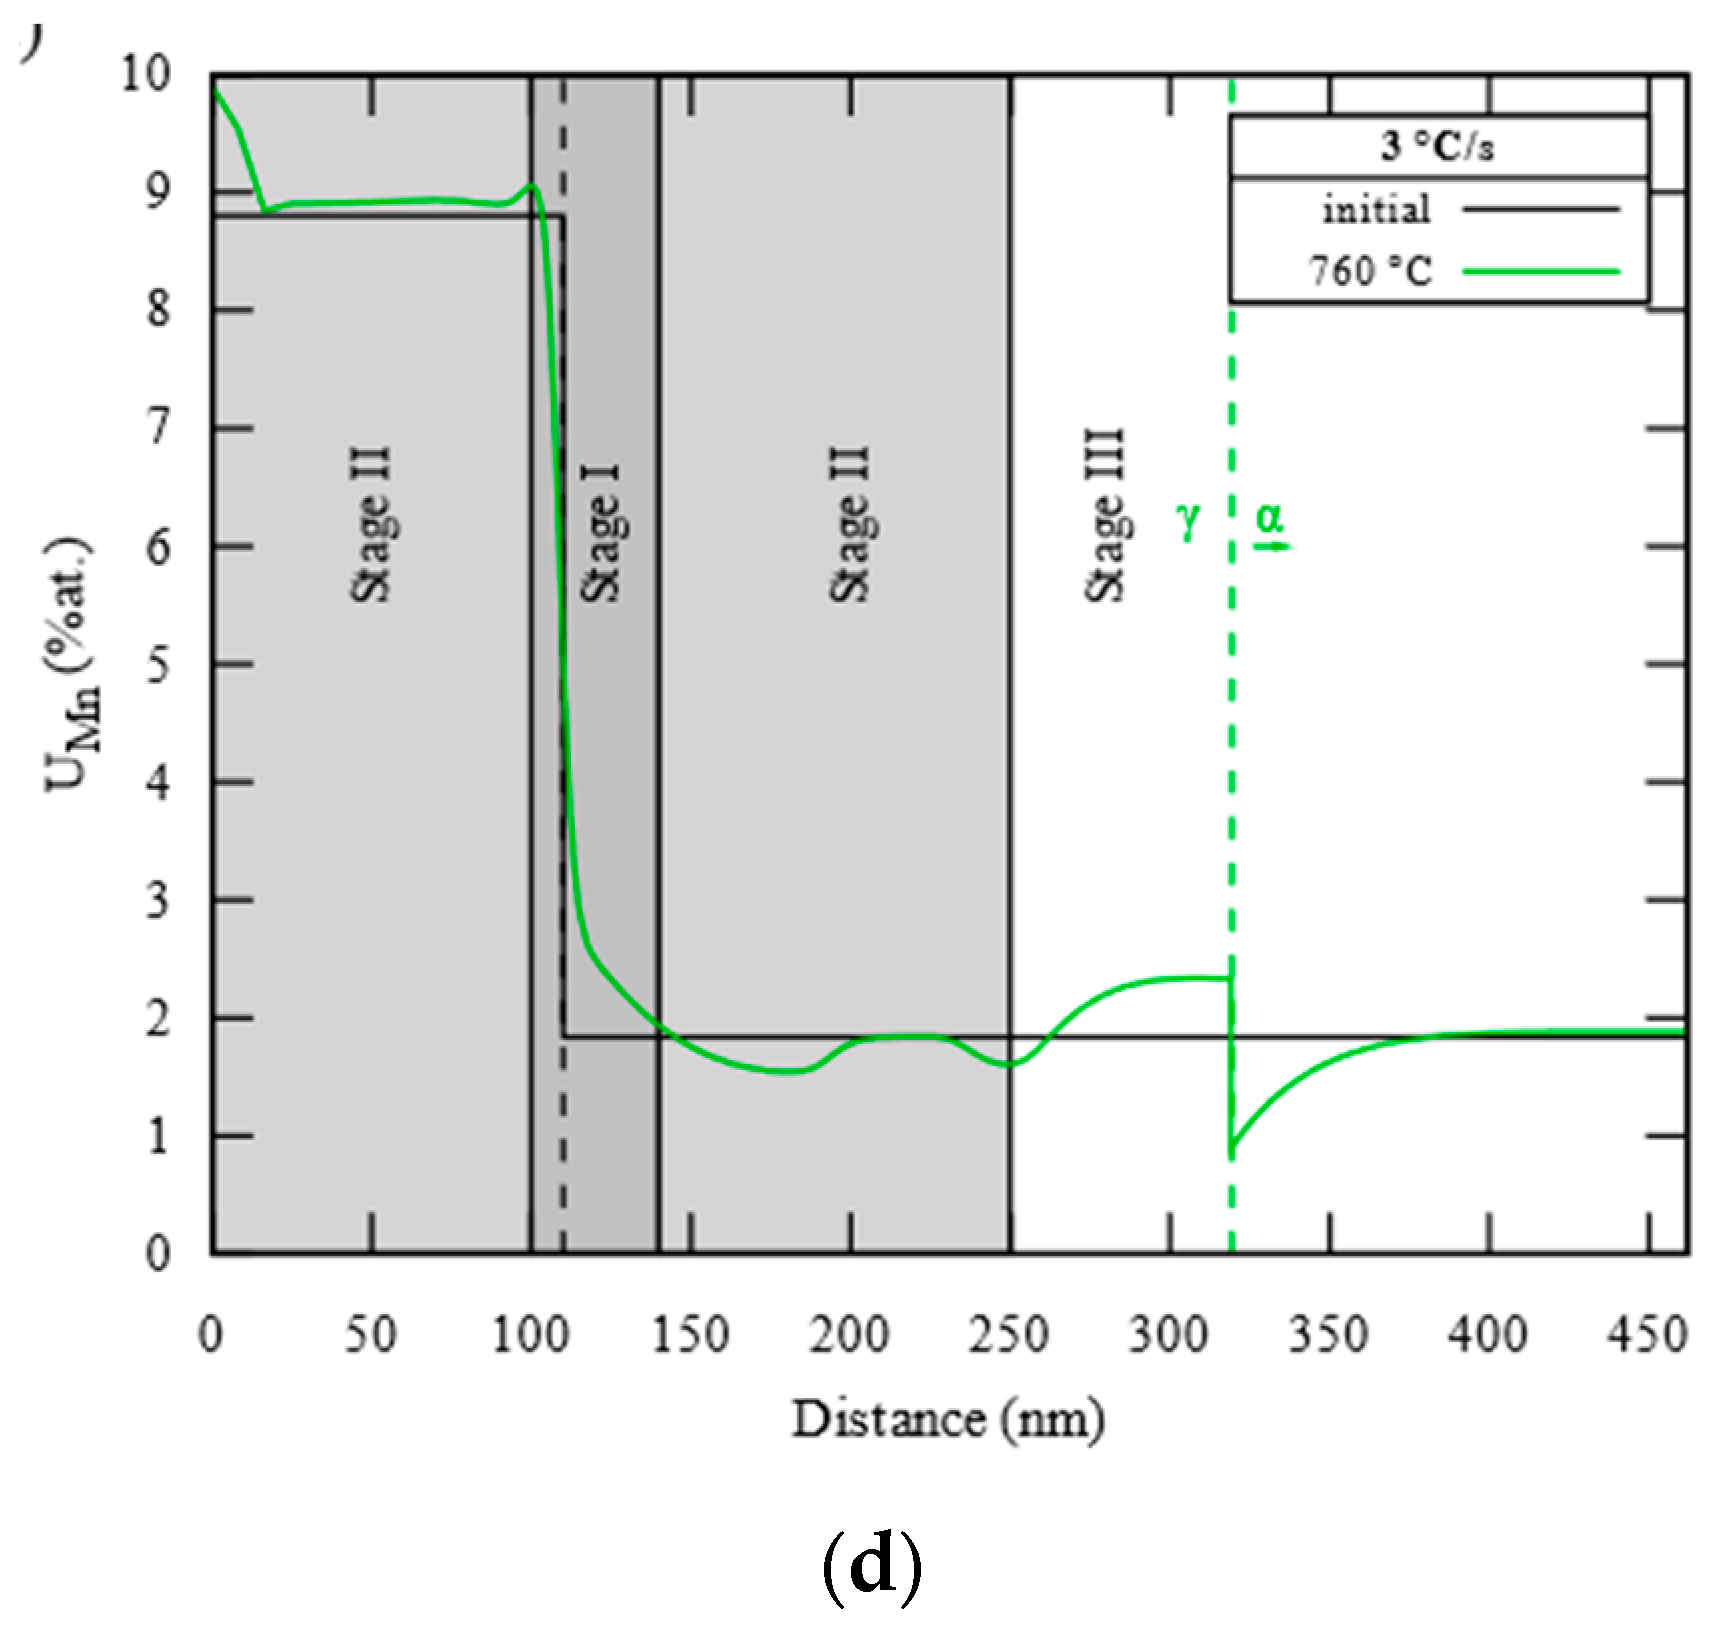
The operative tie-lines at the interface γ/α (a) and θ/γ (b—zoom on austenite side—and c—zoom on cementite side) and manganese profiles (d) at 730 °C (dark blue), 740 °C (blue), and 760 °C (green) during heating at 3 °C/s are plotted in Figure 11. At 730 °C (stage I), the operative tie-lines at both interfaces γ/α (a) and θ/γ (b) show a manganese u-fraction in the growing austenite higher than the manganese u-fraction in the parent phases (in black dotted lines), ferrite and cementite, respectively. During stage I, austenite growth occurs under LEP interface conditions, i.e., with manganese partitioning. On the contrary, at 740 °C (stage II), austenite inherits the manganese u-fraction of the parent phases at both interfaces. During stage II, austenite grows under LENP interface conditions, i.e., without manganese partitioning. At 760 °C (stage III), the carbide is completely dissolved. Once again, the manganese u-fraction in austenite is higher than in ferrite, showing manganese partitioning. During stage III, austenite growth occurs again under LEP interface conditions.
Contrary to the previous case (APG cell—3.1), LEP interface conditions appear before reaching the holding stage at 800 °C.
During the heating stage, austenite growth is subject to two regime transitions. At 760 °C, these successive transitions result in a manganese gradient built into austenite, as shown in green in Figure 11d. The initial profile is plotted with a black solid line.
In the center of the cell (distance < 10 nm), the manganese u-fraction appears higher than the initial manganese u-fraction in the carbide. This is due to numerical instabilities while the carbide comes to complete dissolution. From 10 nm to 100 nm, the manganese u-fraction equals the initial fraction in the carbide (8.8%) due to fast carbide dissolution under LENP interface conditions during stage II [4,10]. Around the initial θ/α interface (100–140 nm), manganese u-fraction is higher than the initial fraction in the carbide and ferrite (8.8% and 1.94%) due to the first slow dissolution of the carbide under LEP interface conditions during stage I. Fast austenite growth under LENP interface conditions during stage II leads to manganese u-fraction close to the fraction in ferrite between 140 nm and 250 nm. Finally, manganese u-fraction increases up to 2.2% at the current interface position (320 nm—indicated by a green dashed line) due to manganese partitioning during stage III. In ferrite, this last growth stage (III) leads to a manganese depletion in front of the interface. The width of this depletion is about 55 nm.
The slow diffusion of manganese in austenite leads to the conservation of this particular manganese profile built by the successive dissolution/growth regimes.
The first regime transition from LEP to LENP is attributed to the partitioning-negligible partitioning transition temperature (PNTT) of the carbide. This theoretical temperature indicates the temperature during heating of the slow to fast carbide dissolution regime. This temperature is determined using the criterion established by Miyamoto in [14]. Thermo-Calc is used to compute carbon activity in austenite at the interfaces θ/γ and γ/α in the ternary Fe-0.1C-1.91 Mn. The PNTT of the studied carbide is evaluated at 731 °C, which corresponds well to the observed transition from stage I to stage II.
The second regime transition from LENP to LEP is attributed to the complete dissolution of the carbide. After complete dissolution, the rich carbon source disappears. Considering the short diffusion distances in the growing austenite at this moment, carbon spreads quickly in austenite. When carbon is homogenous in austenite, the growth continues under manganese diffusion control.

3.3. Interface Condition Competition (ICC Cell)

The two simulations presented above showed that the interface conditions prevailing during the growth of austenite from pearlite or from isolated carbides are different and could appear at different stages (i.e., at different temperatures along the same heating ramp). For instance, LENP (APG cell—3.1) or LEP (CD and AG cell—3.2) interface conditions could co-exist within the same temperature range (760–800 °C). This section discusses the competition of these interface conditions when put together, studied using the ICC simulation cell (2.3). In the following, the austenite regions set with LENP and LEP interface conditions are labeled γLENP and γLEP, respectively.
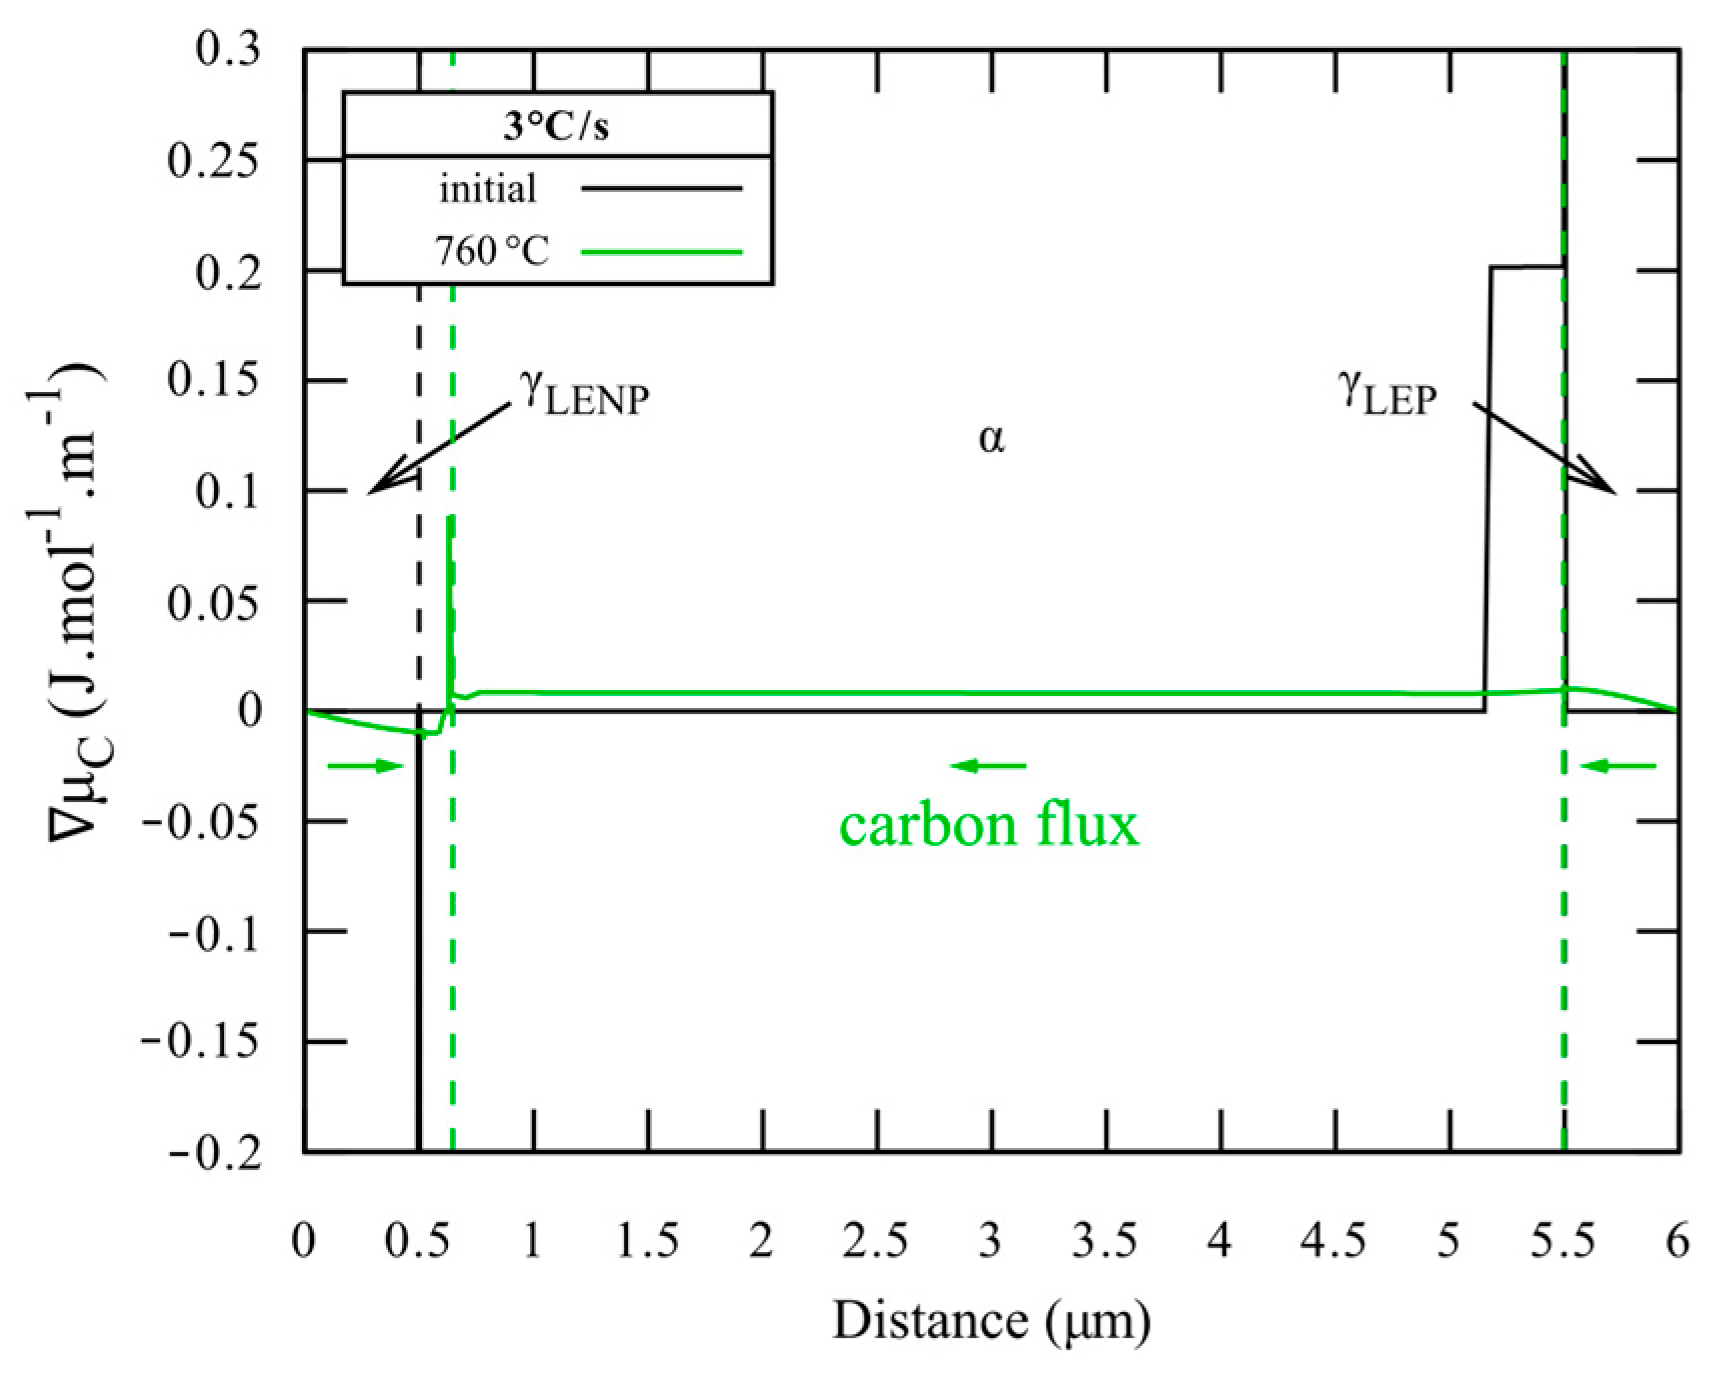
Carbon chemical potential gradients μ C are plotted in Figure 12 in the initial state (black) and at 760 °C (green) in the ICC cell. Interfaces γLENP/α and γLEP/α are indicated by dashed lines. In the initial state, a positive μ C is observed in ferrite in the manganese-depleted zone. Elsewhere in the cell, μ C equals 0. At 760 °C, a constant positive μ C is established in ferrite. A positive μ C is built in γLEP, whereas a negative one is observed in γLENP.
As the simulation starts, the carbon chemical potential gradient in the manganese-depleted zone establishes a carbon flux from the interface γLEP/α to the bulk ferrite. Once outside the manganese-depleted zone, carbon diffuses rapidly in the bulk ferrite from the manganese-depleted zone to the interface γLENP/α. This carbon flux in ferrite tends to deplete the ferrite in carbon at the interface γLEP/α and, on the contrary, accumulate carbon in ferrite at the interface γLENP/α. To keep the LENP tie-line at both interfaces, carbon diffuses through the interfaces from γLEP to ferrite and, then, from ferrite to γLENP. In the steady state, this leads to a constant positive μ C in ferrite and positive μ C at both interfaces, as observed at 760 °C, and makes the carbon flux persistent along the heating stage.
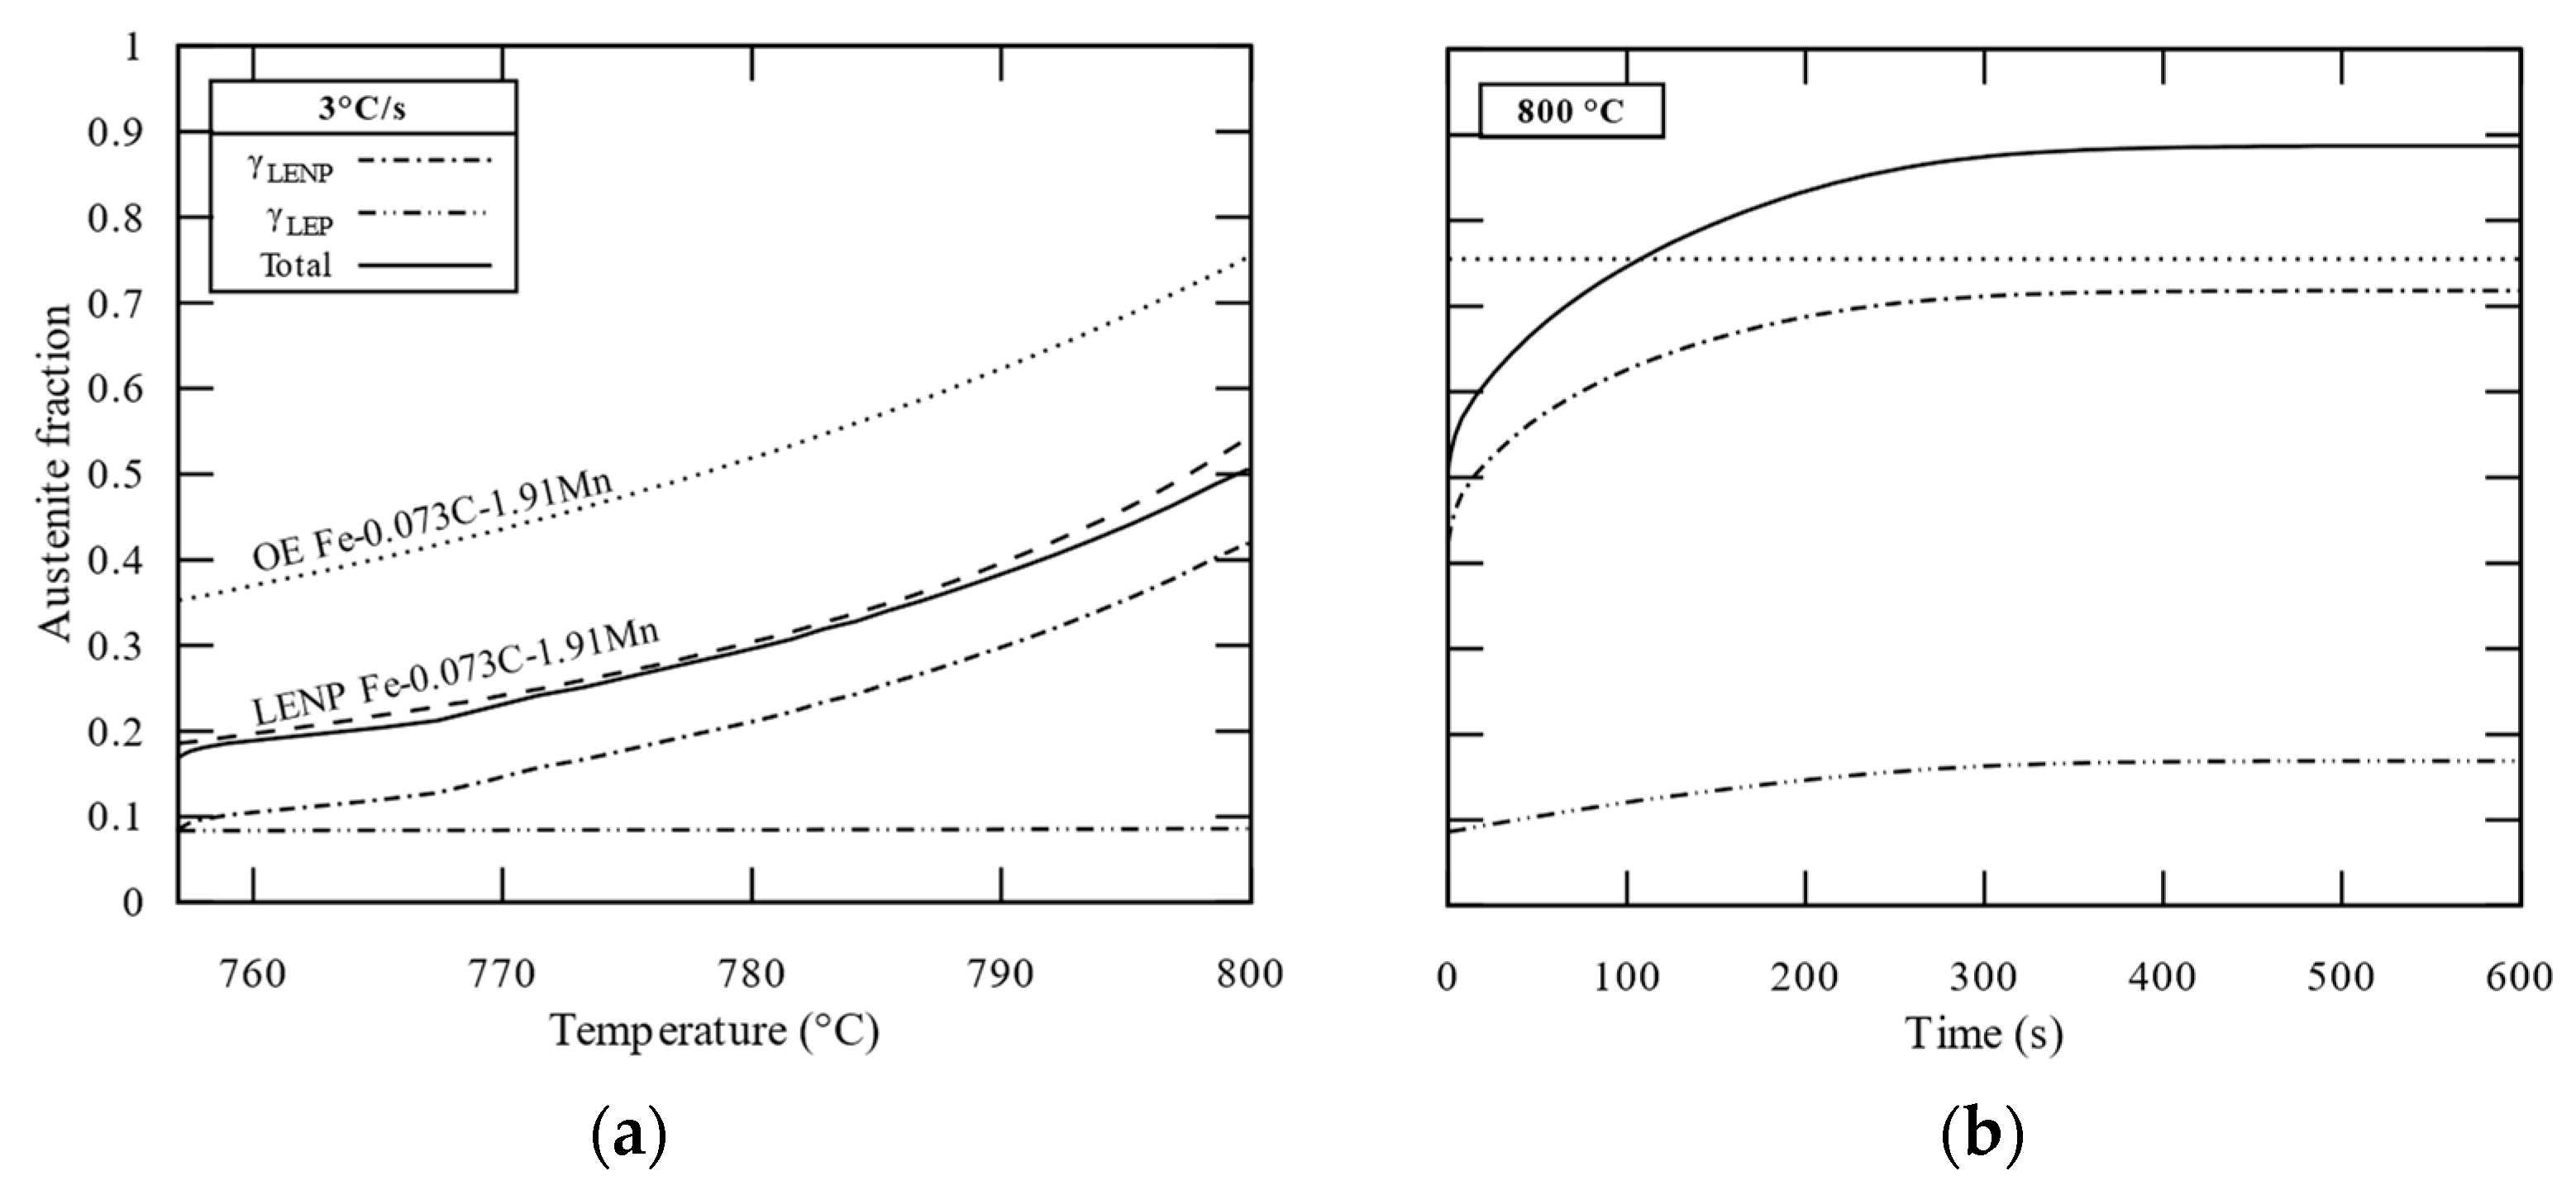
γLENP, γLEP, and total austenite fractions calculated using the ICC cell are plotted in Figure 13 during the heating stage at 3 °C/s (a) and holding stage at 800 °C (b). The γLENP fraction is plotted with a dotted-dashed line, the γLEP fraction with a double dotted-dashed line, and the total austenite fraction with a solid line. The expected theoretical LENP and OE austenite fractions are plotted with dashed and dotted lines, respectively, considering the nominal composition of the studied cell (wC0 = 0.073 wt% and wMn0 = 1.91 wt%).
During the heating stage at 3 °C/s, only γLENP grows significantly, from 10% to 42%, due to carbon transfer shown above. The γLEP fraction remains stable at 10%. The total austenite fraction closely follows the expected theoretical LENP fraction all along the heating stage. Both interfaces follow LENP conditions, and the heating rate is slow enough for carbon to spread almost uniformly in austenite.
At the beginning of the holding stage, carbon’s chemical potential homogenizes quickly (in less than 10 s), almost stopping the carbon transfer. The simultaneous growth of both γLENP and γLEP, controlled by manganese diffusion in ferrite, is made possible. Still, γLENP grows faster than γLEP. Both fractions stabilize after 350 s. The γLENP fraction stabilizes at 72%, whereas the γLEP fraction stabilizes at only 17%.
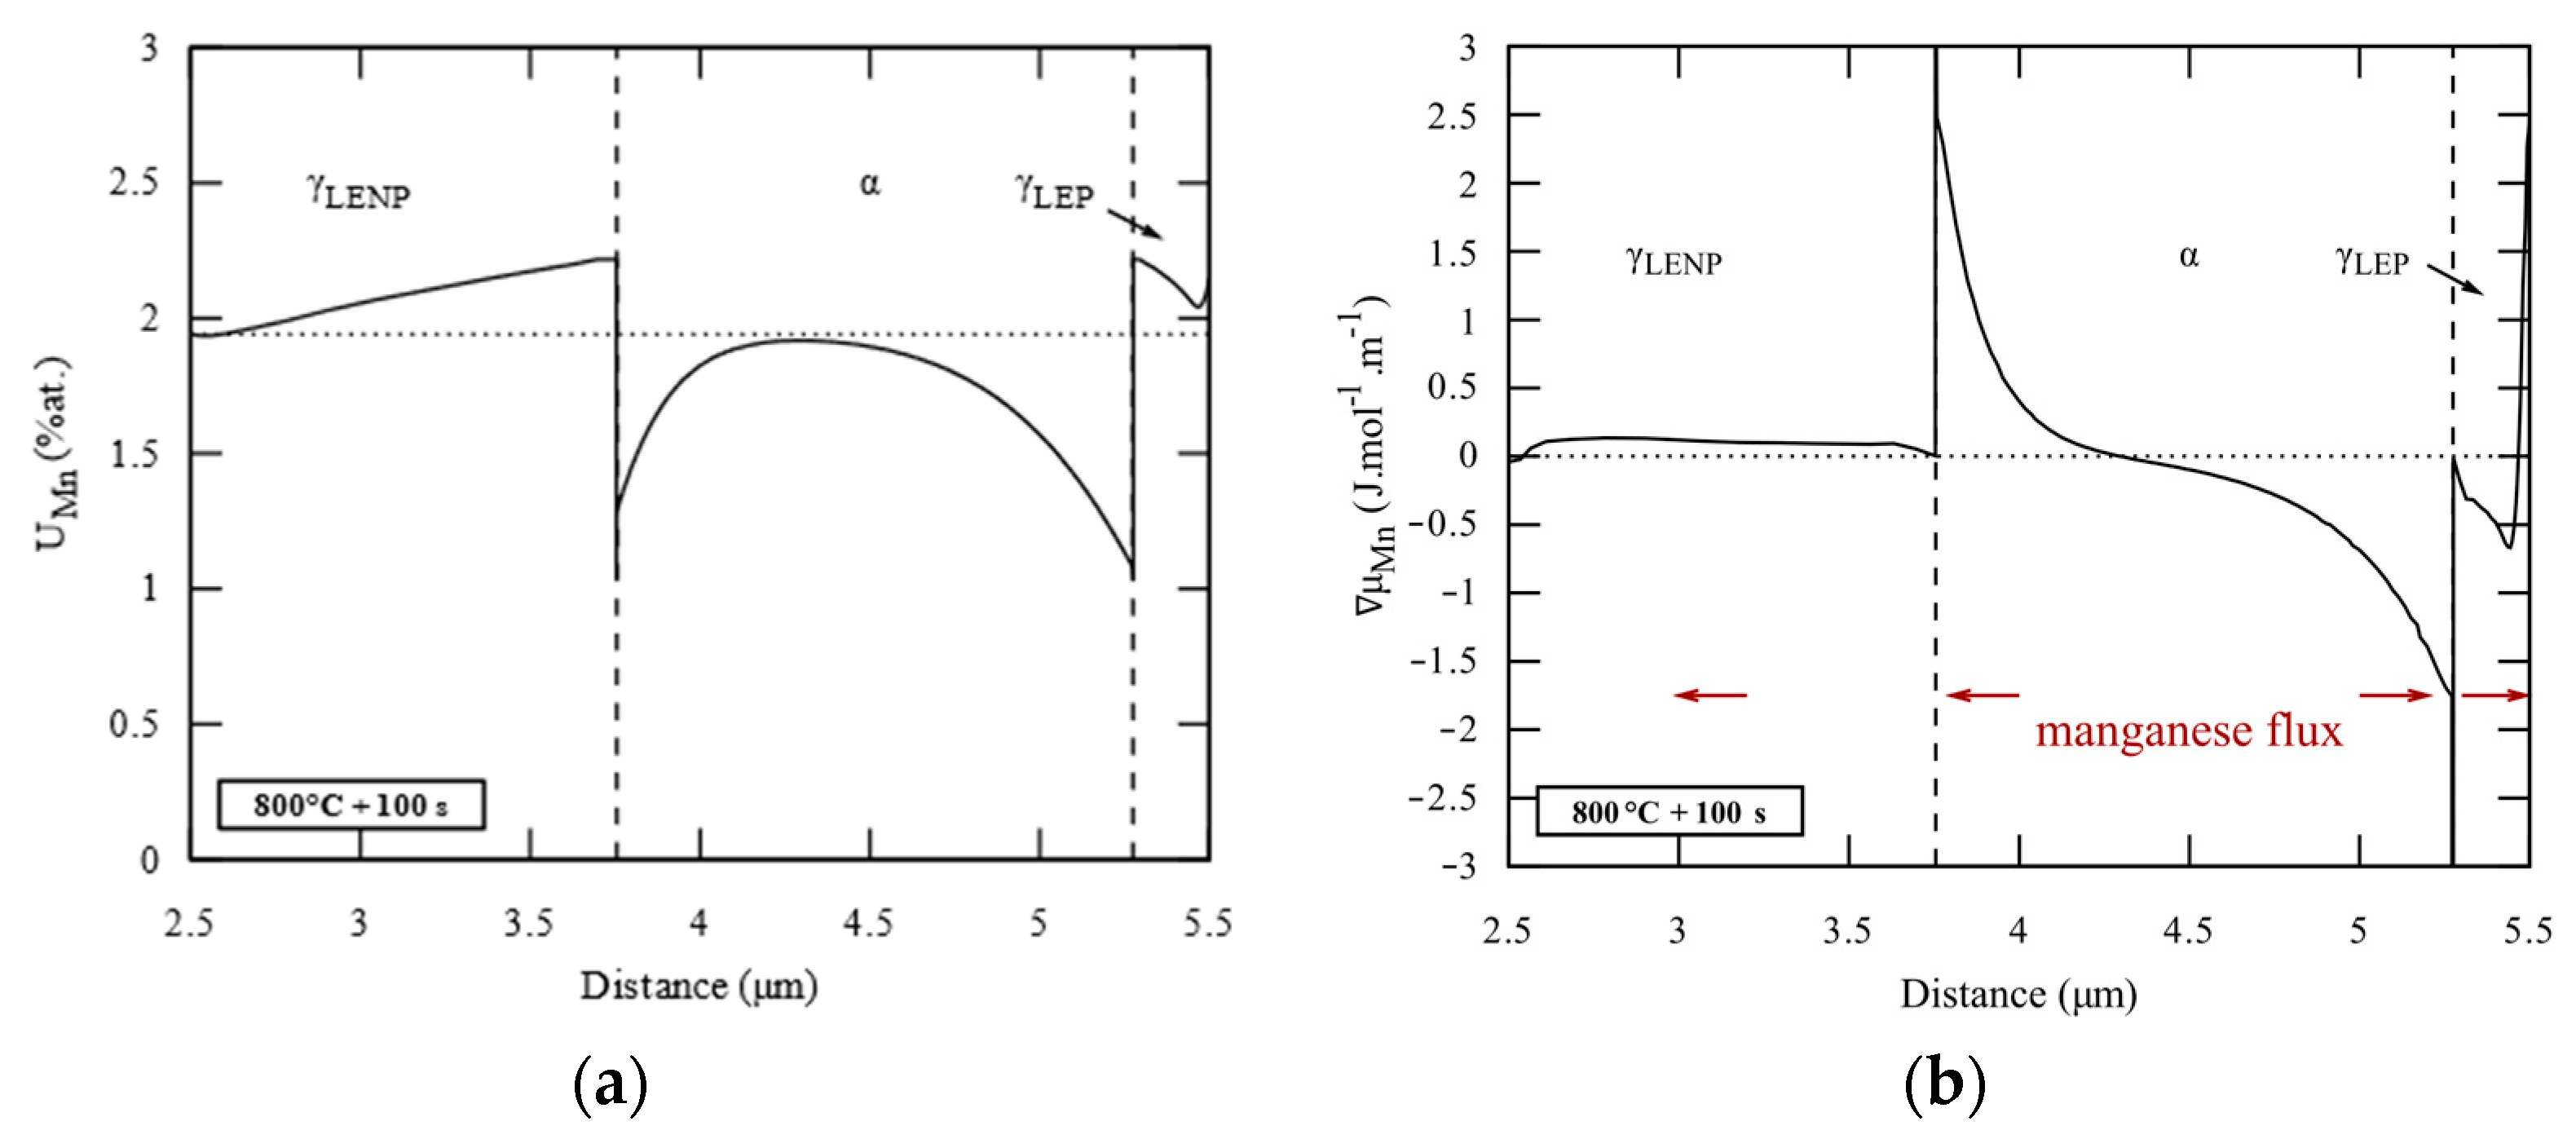
The manganese u-fraction through the ICC cell after 100 s at 800 °C is plotted in Figure 14a. Only the portion between 2.5 µm and 5.5 µm is plotted. Below 2.5 µm is where austenite growth occurred under the LENP regime, making manganese u-fraction constant at 1.94 at%. Above 5.5 µm is where the initial γLEP was, making the manganese u-fraction constant at 2.38 at%. These profiles are preserved because of very slow manganese diffusion in austenite. The current interface positions are indicated by dashed lines. Both interfaces have the same interface composition, i.e., the same tie-line. From 2.5 µm to the interface γLENP/α and from 5.5 µm to the interface γLEP/α, a manganese gradient is built up to 2.2 at% by manganese partitioning during growth under the LEP regime since the beginning of the holding stage. In ferrite, manganese u-fraction is lower in front of the interfaces, down to 1.0 at% at the interfaces. Between 4.2 µm and 4.5 µm, the manganese u-fraction is close to 1.94 at%, the initial composition of ferrite outside the manganese depletion. The manganese depletions in ferrite in front of the interfaces are due to growth with manganese partitioning. The depletion is wider at the interface γLEP/α, as this interface was initialized with a depletion.
The manganese chemical potential gradient μ M n in the ICC cell after 100 s at 800 °C is plotted in Figure 14b. Interfaces γLENP/α and γLEP/α are indicated by dashed lines. A small positive μ M n in γLENP and a small negative μ M n in γLEP are observed in the manganese gradients. Manganese tends to diffuse slowly in austenite. In the manganese-depleted zones of ferrite, a high positive μ M n in front of the interface γLENP/α and a high negative μ M n in front of the interface γLEP/α are observed. The higher μ M n in ferrite compared to austenite makes the austenite growth controlled by manganese diffusion in ferrite. μ M n is higher in front of the interface γLENP/α than in front of the interface γLEP/α because of the asymmetrical manganese depletions in ferrite. The sharper manganese depletion in front of the interface γLENP/α makes the μ M n higher. This latter leads to a faster growth of γLENP, though both γLENP and γLEP have the same tie-line.
A growth regime transition is observed at both interfaces. In less than 10 s, the LENP tie-line moves on to a LEP tie-line. Before fraction stabilization (t < 350 s), austenite growth is controlled by manganese diffusion in ferrite. Manganese partitioning builds a gradient in the growing γLENP and γLEP. As shown with the APG cell (3.1), the austenite growth becomes controlled by slow manganese diffusion in austenite and stops when manganese u-fraction in ferrite reaches the interface composition. Once again, the final overshoot is due to the manganese heterogeneities in both γLENP and γLEP.

4. Discussions

All numerical simulations studied in this work showed particular kinetic behaviors due to interface conditions and growth regime transitions.
First, austenite growth without manganese partitioning during heating was shown by Teixeira et al. [9] using a spherical geometry. However, they showed full austenitization before the holding stage, making it impossible to study the eventual transition from the LENP to the LEP regime at the beginning of the holding stage. In the present work, full austenitization does not take place and the transition from the LENP to the LEP regime at the beginning of the holding stage is observed. This transition was studied under isothermal conditions by Speich et al. [5], without taking into account the previous heating stage. The present simulation of austenite planar growth (APG cell—3.1) from transformed pearlite islands showed both a growth under the LENP regime, i.e., without manganese partitioning, during the heating stage and the transition from growth controlled by carbon diffusion in austenite (LENP interface conditions) to growth controlled by manganese diffusion in ferrite (LEP interface conditions) at the very beginning of the holding stage.
Secondly, during their work on carbide dissolution and subsequent austenite growth, Teixeira et al. [9] and Lai et al. [10] both highlighted a regime transition. The work of Teixeira et al. [9] highlighted a regime transition from the LEP to the LENP when reaching the PNTT during carbide dissolution under industrial heating conditions. Meanwhile, Lai et al. [10] showed a transition from the LENP to the LEP regime on low-enriched carbides under isothermal conditions. This work showed both transitions under industrial heating conditions: a first transition from the LEP to the LENP regime when reaching the PNTT of the carbide and a second transition from the LENP to the LEP after complete dissolution of the carbide.
Thus, under typical industrial conditions (3 °C/s up to 800 °C), different interface conditions and growth regimes coexist during the heating stage.
The work of Miyamoto et al. [14] highlighted a carbon flux in ferrite, starting with carbides as carbon sources. In the present work, the analysis is extended to rich carbon austenite as carbon sources (inspired from austenite formed from pearlite islands). The third and last simulation showed that the coexistence of interfaces under LENP and LEP conditions promotes an interaction of austenite growth thanks to a carbon flux in the ferrite matrix from the LEP interface to the LENP interface. As a consequence, an austenite island with LENP interface conditions can exaggeratedly grow at the expense of the growth of an austenite island with LEP interface conditions. Such growth competition can partially explain the impacts of heating parameters on the final microstructure of steels. Indeed, the heating rate can promote either LENP or LEP interface conditions during austenite formation from different carbon-rich structures (pearlite islands, isolated carbides) [4,9]. Then, the chosen heating rate may promote interface condition interactions, as shown in the present work, leading to strongly different austenite morphologies.

5. Conclusions

In this work, phase transformations controlled by interface thermodynamic conditions during intercritical annealing of an industrial-like semi-product for DP steel production were numerically investigated using Thermo-Calc/DICTRA. The phase transformation was modeled by a local field model considering sharp interface and local equilibrium (LE) interface conditions. These simulations aimed to better understand the interface conditions during intercritical annealing and how they control austenite formation kinetics. Pearlite bands and spheroidized carbides isolated in the ferrite matrix were the two carbon sources for austenite formation.
First, the austenite, formed from pearlite island, planar growth showed a regime transition. During the heating stage, the growth kinetics are governed by carbon diffusion under LENP interface conditions. A carbon gradient builds up in austenite, making its fraction lower than the LENP fraction. During the holding stage, manganese partitioning, due to LEP interface conditions and slow manganese diffusion in austenite, leads to an austenite overshoot.
Then, the carbide dissolution and austenite spherical growth simulations showed three stages during the heating stage. The austenite undergoes slow growth due to a LEP tie-line at both the θ/γ and γ/α interfaces. When the PNTT is reached, the carbide dissolves, and the austenite grows quickly without manganese partitioning. When the carbide is completely dissolved, austenite grows again with manganese partitioning.
Hence, different interface conditions (LENP or LEP) may coexist during the heating stage. A simulation cell was designed to investigate the growth competition due to interface conditions. At the interface set with LEP conditions (γLEP/α), a manganese depletion, inspired from previous simulations, was imitated. Only austenite set with LENP interface conditions (γLENP) grew during the heating stage. The manganese depletion was found responsible for a constant μ C established in ferrite and at both interfaces, leading to a stable carbon flux from austenite set with LEP interface conditions (γLEP), to γLENP along the heating stage. This carbon flux hindered γLEP growth and promoted γLENP growth.
Thus, our numerical study indicates that thermodynamic interface conditions competition promotes the growth of austenite islands under LENP interface conditions, at the expense of the growth of austenite islands under LEP interface conditions. Such a difference in growth kinetics impacts the final microstructure via austenite morphology.

Author Contributions

Conceptualization, C.C. and J.T.; methodology, C.C and J.T.; formal analysis, C.C.; investigation, C.C.; writing—original draft preparation, C.C.; writing—review and editing, C.C., S.Y.P.A., J.T. and F.B.; supervision, F.B.; project administration, C.C., S.Y.P.A., J.T. and F.B.; funding acquisition, S.Y.P.A. and F.B. All authors have read and agreed to the published version of the manuscript.

Funding

This work was funded by ArcelorMittal Maizières-lès-Metz (Product Research Centre), by the Université de Lorraine, by the CNRS (Centre National de la Recherche Scientifique), and by the French ANRT (Agence Nationale de la Recherche et de la Technologie) under the CIFRE convention (2020/1022). This work was also related to the French State via the program “Investment in the Future” operated by the National Research Agency (ANR) and referenced by ANR-11-LABX-0008-01 (LabEx DAMAS).

Data Availability Statement

The experimental data required to reproduce these findings cannot be shared at this time as the data also form part of an ongoing study.

Conflicts of Interest

The authors declare no conflict of interest. The funders had no role in the design of the study, in the collection, analysis, or interpretation of data, in the writing of the manuscript, or in the decision to publish the results.

References

  1. Allain, S.Y.P.; Moreno, M.; Lamari, M.; Zurob, H.; Teixeira, J.; Bonnet, F. A Physics-Based Mean-Field Model for Ferrite Recovery and Recrystallization. Metals 2020, 10, 622. [Google Scholar] [CrossRef]
  2. Pushkareva, I.; Allain, S.; Scott, C.; Redjaïmia, A.; Moulin, A. Relationship between Microstructure, Mechanical Properties and Damage Mechanisms in High Martensite Fraction Dual Phase Steels. ISIJ Int. 2015, 55, 2237–2246. [Google Scholar] [CrossRef] [Green Version]
  3. Allain, S.; Bouaziz, O. Microstructure Based Modeling for the Mechanical Behavior of Ferrite–Pearlite Steels Suitable to Capture Isotropic and Kinematic Hardening. Mater. Sci. Eng. A 2008, 496, 329–336. [Google Scholar] [CrossRef]
  4. Moreno, M. Metallurgical Mechanisms and Their Interactions during the Annealing of Cold-Rolled Ferrite-Pearlite Steels: Characterization and Modeling. Ph.D. Thesis, Université de Lorraine, Lorraine, France, 2019. [Google Scholar]
  5. Speich, G.R.; Demarest, V.A.; Miller, R.L. Formation of Austenite During Intercritical Annealing of Dual-Phase Steels. MTA 1981, 12, 1419–1428. [Google Scholar] [CrossRef]
  6. Allain, S.Y.P.; Bouaziz, O.; Pushkareva, I.; Scott, C.P. Towards the Microstructure Design of DP Steels: A Generic Size-Sensitive Mean-Field Mechanical Model. Mater. Sci. Eng. A 2015, 637, 222–234. [Google Scholar] [CrossRef]
  7. Scott, C.P.; Fazeli, F.; Shalchi Amirkhiz, B.; Pushkareva, I.; Allain, S.Y.P. Structure-Properties Relationship of Ultra-Fine Grained V-Microalloyed Dual Phase Steels. Mater. Sci. Eng. A 2017, 703, 293–303. [Google Scholar] [CrossRef]
  8. Kulakov, M.; Poole, W.J.; Militzer, M. The Effect of the Initial Microstructure on Recrystallization and Austenite Formation in a DP600 Steel. Metall. Mater. Trans. A 2013, 44, 3564–3576. [Google Scholar] [CrossRef]
  9. Teixeira, J.; Moreno, M.; Allain, S.Y.P.; Oberbillig, C.; Geandier, G.; Bonnet, F. Intercritical Annealing of Cold-Rolled Ferrite-Pearlite Steel: Microstructure Evolutions and Phase Transformation Kinetics. Acta Mater. 2021, 212, 116920. [Google Scholar] [CrossRef]
  10. Lai, Q.; Gouné, M.; Perlade, A.; Pardoen, T.; Jacques, P.; Bouaziz, O.; Bréchet, Y. Mechanism of Austenite Formation from Spheroidized Microstructure in an Intermediate Fe-0.1C-3.5Mn Steel. Metall. Mater. Trans. A 2016, 47, 3375–3386. [Google Scholar] [CrossRef]
  11. Wycliffe, P.A.; Purdy, G.R.; Embury, J.D. Growth of Austenite in the Intercritical Annealing of Fe-C-Mn Dual Phase Steels. Can. Metall. Q. 1981, 12, 1236. [Google Scholar] [CrossRef]
  12. Liu, Z.-K.; Höglund, L.; Jönsson, B.; Ågren, J. An Experimental and Theoretical Study of Cementite Dissolution in an Fe-Cr-C Alloy. MTA 1991, 22, 1745–1752. [Google Scholar] [CrossRef]
  13. Bourne, J.P.; Atkinson, C.; Reed, R.C. Diffusion-Controlled Growth in Ternary Systems. Metall. Mater. Trans. A 1994, 25, 2683–2694. [Google Scholar] [CrossRef]
  14. Miyamoto, G.; Usuki, H.; Li, Z.-D.; Furuhara, T. Effects of Mn, Si and Cr Addition on Reverse Transformation at 1073K from Spheroidized Cementite Structure in Fe–0.6 Mass% C Alloy. Acta Mater. 2010, 58, 4492–4502. [Google Scholar] [CrossRef]
  15. Gouné, M.; Maugis, P.; Drillet, J. A Criterion for the Change from Fast to Slow Regime of Cementite Dissolution in Fe–C–Mn Steels. J. Mater. Sci. Technol. 2012, 28, 728–736. [Google Scholar] [CrossRef]
  16. Wei, R.; Enomoto, M.; Hadian, R.; Zurob, H.S.; Purdy, G.R. Growth of Austenite from As-Quenched Martensite during Intercritical Annealing in an Fe–0.1C–3Mn–1.5Si Alloy. Acta Mater. 2013, 61, 697–707. [Google Scholar] [CrossRef]
  17. Wu, Y.X.; Wang, L.Y.; Sun, W.W.; Styles, M.J.; Studer, A.J.; Bréchet, Y.; Arlazarov, A.; Hutchinson, C.R. Austenite Formation Kinetics from Multicomponent Cementite-Ferrite Aggregates. Acta Mater. 2020, 18, 234. [Google Scholar] [CrossRef]
  18. Kulakov, M.; Poole, W.J.; Militzer, M. A Microstructure Evolution Model for Intercritical Annealing of a Low-Carbon Dual-Phase Steel. ISIJ Int. 2014, 54, 2627–2636. [Google Scholar] [CrossRef] [Green Version]
  19. Ollat, M. Characterization and Modeling of Microstructural Evolutions during the Thermal Treatment of Cold-Rolled Dual-Phase Steels. Ph.D. Thesis, Université de Lyon, Lyon, France, 2017. [Google Scholar]
  20. Gouné, M.; Danoix, F.; Ågren, J.; Bréchet, Y.; Hutchinson, C.R.; Militzer, M.; Purdy, G.; van der Zwaag, S.; Zurob, H. Overview of the Current Issues in Austenite to Ferrite Transformation and the Role of Migrating Interfaces Therein for Low Alloyed Steels. Mater. Sci. Eng. R Rep. 2015, 92, 1–38. [Google Scholar] [CrossRef]
  21. Marceaux dit Clément, A.; Hoummada, K.; Drillet, J.; Hébert, V.; Maugis, P. Effects of Cementite Size and Chemistry on the Kinetics of Austenite Formation during Heating of a High-Formability Steel. Comput. Mater. Sci. 2020, 182, 109786. [Google Scholar] [CrossRef]
  22. Christian, J.W. Deformation by Moving Interfaces. Metall. Trans. A 1982, 13, 509–538. [Google Scholar] [CrossRef]
  23. Mecozzi, M.G.; Bos, C.; Sietsma, J. A Mixed-Mode Model for the Ferrite-to-Austenite Transformation in a Ferrite/Pearlite Microstructure. Acta Mater. 2015, 88, 302–313. [Google Scholar] [CrossRef]
  24. Ollat, M.; Militzer, M.; Massardier, V.; Fabregue, D.; Buscarlet, E.; Keovilay, F.; Perez, M. Mixed-Mode Model for Ferrite-to-Austenite Phase Transformation in Dual-Phase Steel. Comput. Mater. Sci. 2018, 149, 282–290. [Google Scholar] [CrossRef]
  25. Bos, C.; Mecozzi, M.G.; Sietsma, J. A Microstructure Model for Recrystallisation and Phase Transformation during the Dual-Phase Steel Annealing Cycle. Comput. Mater. Sci. 2010, 48, 692–699. [Google Scholar] [CrossRef]
  26. Madej, L.; Sieradzki, L.; Sitko, M.; Perzynski, K.; Radwanski, K.; Kuziak, R. Multi Scale Cellular Automata and Finite Element Based Model for Cold Deformation and Annealing of a Ferritic–Pearlitic Microstructure. Comput. Mater. Sci. 2013, 77, 172–181. [Google Scholar] [CrossRef]
  27. Zheng, C.; Raabe, D. Interaction between Recrystallization and Phase Transformation during Intercritical Annealing in a Cold-Rolled Dual-Phase Steel: A Cellular Automaton Model. Acta Mater. 2013, 61, 5504–5517. [Google Scholar] [CrossRef]
  28. Zhu, B.; Militzer, M. Phase-Field Modeling for Intercritical Annealing of a Dual-Phase Steel. Metall. Mater. Trans. A 2015, 46, 1073–1084. [Google Scholar] [CrossRef]
  29. Azizi-Alizamini, H.; Militzer, M. Phase Field Modelling of Austenite Formation from Ultrafine Ferrite–Carbide Aggregates in Fe–C. Int. J. Mater. Res. 2010, 101, 534–541. [Google Scholar] [CrossRef]
  30. Lv, S.; Wang, S.; Wu, G.; Gao, J.; Yang, X.; Wu, H.; Mao, X. Application of Phase-Field Modeling in Solid-State Phase Transformation of Steels. J. Iron Steel Res. Int. 2022, 29, 867–880. [Google Scholar] [CrossRef]
  31. Lv, S.; Wu, H.-H.; Wang, K.; Zhu, J.; Wang, S.; Wu, G.; Gao, J.; Yang, X.-S.; Mao, X. The Austenite to Polygonal Ferrite Transformation in Low-Alloy Steel: Multi-Phase-Field Simulation. J. Mater. Res. Technol. 2023, 24, 9630–9643. [Google Scholar] [CrossRef]
  32. Rudnizki, J.; Böttger, B.; Prahl, U.; Bleck, W. Phase-Field Modeling of Austenite Formation from a Ferrite plus Pearlite Microstructure during Annealing of Cold-Rolled Dual-Phase Steel. Metall. Mater. Trans. A 2011, 42, 2516–2525. [Google Scholar] [CrossRef]
  33. Geng, X.; Wang, H.; Xue, W.; Xiang, S.; Huang, H.; Meng, L.; Ma, G. Modeling of CCT Diagrams for Tool Steels Using Different Machine Learning Techniques. Comput. Mater. Sci. 2020, 171, 109235. [Google Scholar] [CrossRef]
  34. Hart-Rawung, T.; Buhl, J.; Bambach, M. A Fast Approach for Optimization of Hot Stamping Based on Machine Learning of Phase Transformation Kinetics. Procedia Manuf. 2020, 47, 707–712. [Google Scholar] [CrossRef]
  35. Li, Y.; Li, S. Deep Learning Based Phase Transformation Model for the Prediction of Microstructure and Mechanical Properties of Hot-Stamped Parts. Int. J. Mech. Sci. 2022, 220, 107134. [Google Scholar] [CrossRef]
  36. Durodola, J.F. Machine Learning for Design, Phase Transformation and Mechanical Properties of Alloys. Prog. Mater. Sci. 2022, 123, 100797. [Google Scholar] [CrossRef]
  37. Diffusion Module (DICTRA) Documentation Set. 2020. Available online: https://thermocalc.com/wp-content/uploads/Documentation/Current_Static/diffusion-module-dictra-documentation-set.pdf (accessed on 10 July 2023).
  38. Andersson, J.-O.; Helander, T.; Höglund, L.; Shi, P.; Sundman, B. Thermo-Calc & DICTRA, Computational Tools for Materials Science. Calphad 2002, 26, 273–312. [Google Scholar] [CrossRef]
  39. Hultgren, A. A Metallographic Study on Tungsten Steels; John Wiley: Hoboken, NJ, USA, 1920. [Google Scholar]
  40. Sun, W.W.; Wu, Y.X.; Yang, S.C.; Hutchinson, C.R. Advanced High Strength Steel (AHSS) Development through Chemical Patterning of Austenite. Scr. Mater. 2018, 146, 60–63. [Google Scholar] [CrossRef]
  41. Kasatkin, O.G.; Vinokur, B.B.; Pilyushenko, V.L. Calculation Models for Determining the Critical Points of Steel. Met. Sci. Heat Treat. 1984, 26, 27–31. [Google Scholar] [CrossRef]
  42. Yang, D.Z.; Brown, E.L.; Matlock, D.K.; Krauss, G. Ferrite Recrystallization and Austenite Formation in Cold-Rolled Intercritically Annealed Steel. MTA 1985, 16, 1385–1392. [Google Scholar] [CrossRef]
  43. Moreno, M.; Teixeira, J.; Ghanbaja, J.; Bonnet, F.; Allain, S. Evolution of Cementite Composition along the Processing of Cold-Rolled and Annealed Dual-Phase Steels. Materialia 2019, 6, 100179. [Google Scholar] [CrossRef]
  44. Huang, J.; Poole, W.J.; Militzer, M. Austenite Formation during Intercritical Annealing. Metall. Mater. Trans. A 2004, 35, 3363–3375. [Google Scholar] [CrossRef]
  45. Kamoutsi, H.; Gioti, E.; Haidemenopoulos, G.N.; Cai, Z.; Ding, H. Kinetics of Solute Partitioning During Intercritical Annealing of a Medium-Mn Steel. Metall. Mater. Trans. A 2015, 46, 4841–4846. [Google Scholar] [CrossRef]
Figure 1. SEM micrograph of the industrial semi-product after heating at 3 °C/s up to 600 °C and gas quenched. An image analysis (data from [4]) is used to discriminate the studied objects: Ferrite is artificially colored black, pearlitic cementite purple, and isolated carbides white.
Metals 13 01288 g001
Figure 2. Thermal cycle of the studied annealing treatment. The interrupted thermal treatments followed to produce the microstructures shown in Figure 3 and Figure 4 are represented, as are the time/temperature domains used for the respective simulation cells. (See the main text for detailed explanations.)
Metals 13 01288 g002
Figure 5. (a) Phase diagram of ternary Fe-C-Mn with compositions at interfaces θ/γ (black dotted line) and γ/α (black dashed line). Portion 1 is the bulk and interface ferrite composition, 2 is the austenite composition at the interface γ/α, 3 is the austenite composition at the interface γ/θ, and 4 is the bulk carbide composition. (b) Phase diagram of ternary Fe-C-Mn at 710 °C at the interface γ/α. Ferrite bulk compositions computed by mass balance are plotted with a dotted line. Ferrite and austenite interface compositions under LENP conditions computed with Thermo-Calc are plotted with dashed lines, respectively. The unique LENP tie-line respecting the mass balance is plotted with a black solid line.
Metals 13 01288 g005
Figure 6. ICC cell size parameters and schematized carbon and manganese profiles.
Metals 13 01288 g006
Figure 7. Austenite fraction during (a) heating at 3 °C/s and (b) holding stages calculated with the APG cell. Fractions calculated using the studied cell are plotted with solid lines, expected theoretical LENP fractions with a dashed line, and OE fractions with a dotted line.
Metals 13 01288 g007
Figure 8. (a) Computed tie-lines and (b) carbon profiles during the heating stage at 760 °C (green), 780 °C (yellow), and 800 °C (orange) for APG cell.
Metals 13 01288 g008
Figure 9. Manganese profiles at the end (600 s) of the holding stage (800 °C). The dotted line indicated the initial position of the interface. The arrow indicates the transition between the LENP and LEP regimes. The gradient built during the LEP regime is stable due to the slow manganese diffusion in austenite at 800 °C.
Metals 13 01288 g009
Figure 10. Carbide (red) and austenite (black) fractions during heating stages (3 °C/s) calculated with the CD and AG cell. Austenite fractions calculated using the studied cell are plotted with solid lines, expected theoretical LENP fractions with a dashed line, and OE fractions with a dotted line.
Metals 13 01288 g010
Figure 11. Operative tie-lines (a) at the interface γ/α, (b,c) at the interface θ/γ and (d) manganese profiles at 730 °C (dark-blue), 740 °C (blue), and 760 °C (green) during heating at 3 °C/s according to the simulation conducted on CD and AG cell. The manganese u-fraction in bulk ferrite and in bulk cementite are indicated by a black dotted line in (a,b), respectively. The initial manganese profile is represented by a black solid line in (d).
Metals 13 01288 g011aMetals 13 01288 g011b
Figure 12. Carbon chemical potential gradient in the initial state (black) and at 760 °C (green) during heating at 3 °C/s according to the simulation conducted on the ICC cell. Interfaces γLENP/α (on the left) and γLENP/α (on the right) are indicated by dashed lines.
Metals 13 01288 g012
Figure 13. Austenite fraction during heating at 3 °C/s (a) and holding (b) stages calculated using the ICC cell. γLENP, γLEP, and total austenite fractions are plotted with a dotted-dashed line, double dotted-dashed line, and solid line, respectively.
Metals 13 01288 g013
Figure 14. Manganese profiles (a) and chemical potential gradient (b) after 100 s at 800 °C according to the simulation conducted on the ICC cell. Interfaces γLENP/α (on the left) and γLENP/α (on the right) are indicated by dashed lines.
Metals 13 01288 g014
Disclaimer/Publisher’s Note: The statements, opinions and data contained in all publications are solely those of the individual author(s) and contributor(s) and not of MDPI and/or the editor(s). MDPI and/or the editor(s) disclaim responsibility for any injury to people or property resulting from any ideas, methods, instructions or products referred to in the content.