Abstract
This work aimed to fabricate two varieties of near-equiatomic TiNbZr and TiTaZr medium-entropy alloy (MEA) claddings on pure Ti as protective layers by stepwise laser cladding. Their stratified component distribution, microstructural characteristics, and phase constitutions were analyzed, with their hardness and wear resistance were compared with that of pristine Ti. It was found that a single body-centered-cubic solid-solution phase in both MEA claddings were realized on the hexagonal closed-packed pure Ti substrates. The subgrain structures in the TiNbZr cladding were cellular grains, while the ones in the TiTaZr cladding were much denser dendrite arms, which led to increased residual stress. The results showed that the hardness of the TiNbZr and TiTaZr claddings were 450 ± 30 HV0.2 and 513 ± 27 HV0.2, respectively, 2.6 times and 3 times that of the pure Ti (170 ± 11 HV0.2). Also, the consequent wear rates decreased from 2.08 × 10⁻⁴ mm3·N−1·m−1 (pure Ti) to 0.49 × 10⁻⁴ mm3·N−1·m−1 (TiNbZr) and 0.32 × 10⁻⁴ mm3·N−1·m−1 (TiTaZr). Such high hardness and enhanced wear resistance are attributed to the solid-solution strengthening of the body-centered-cubic phase and the residual stress in the claddings. The realization of hard MEA layers by stepwise laser cladding offers a flexible and effective way for protecting pure Ti.
1. Introduction
Compared with common steel materials, the combination of low density, high specific strength, and good corrosion resistance makes titanium (Ti) and titanium alloys ideal alternative materials for applications in aerospace, biomedical implants, and marine equipment [1,2,3]. Nevertheless, the relatively low hardness of pure Ti and its corresponding poor wear resistance become the Achilles’ heel when subjected to high-friction working conditions [4,5]. Generally, the mechanical properties can be improved by introducing alloying elements. However, traditional Ti-based alloys still exhibit inadequate hardness even after alloyed with other elements [6], such as Ti-6Al-4V (~375 HV) [7]. To fulfill the comprehensive demands mentioned above, researchers have been devoted to enhancing Ti materials through surface modifications [5,8,9,10].
In the exploring process, a novel multi-component alloy design strategy attracted the attention of researchers and had been applied. Different from the traditional alloy design concept based on one or two principal elements, high-entropy alloys (HEAs) contain more than five near-equiatomic elements with high configuration entropy (ΔS > 1.5R, R is the gas constant) [11,12,13]. High configuration entropy significantly suppressing the Gibbs energy of the alloy systems would lead to the formation and stabilization of a single-phase solid solution, and their optimized structures were reported to produce extraordinary mechanical properties [14]. One of the first few papers on HEAs was focused on HEA coatings for building up protective surface layers [15]. In that work, AlCoCrFeMo0.5NiSiTi and AlCrFeMo0.5NiSiTi HEA powders were used for thermal spray coatings on 304 stainless steel substrate, and the as-sprayed hardness reached 486 HV and 524 HV, respectively, suggesting great potential of HEAs in surface enhancement. In recent years, based on the concept of HEAs, alloy systems containing fewer elements (3–4 components) with relatively lower configuration entropy (1R ≤ ΔS < 1.5R) have been studied [16]. They are defined as medium-entropy alloys (MEAs), which also possess remarkable comprehensive properties [17,18]. Their fewer principal components reduce the design complexity and fabrication difficulty of MEAs.
Surface HEA and MEA modification of Ti can spring up thanks to the advantages of concentrated energy density, good metallurgical bonding, and high flexibility of laser cladding [19,20,21]. In previous works, AlNbMoTaCux and CoCrFeNiNbx HEA coatings have been fabricated on TC4 and pure Ti substrates by laser cladding, respectively [22,23]. Though these multicomponent alloy coatings possess some advantages, the inevitable Ti element dilution induced from the Ti-based substrates would influence the morphology and the properties of the cladding layer [24]. Therefore, fabricating Ti-containing multicomponent coatings is an ideal way to make use of the Ti dilution. Xiang et al. prepared CoNiTi MEA claddings consisting of a BCC phase with Ti2Ni and Ti2Co intermetallic compounds on Ti substrates by pulsed laser cladding of pre-placed Co and Ni powders mixtures and obtained an enhanced hardness reaching 571 HV [25]. Chai et al. tremendously improved the hardness and wear resistance of pure Ti in a similar way by laser cladding a CrNiTi MEA layer composed of a BCC matrix with Cr2Ti Laves phase and NiTi intermetallic layer [26]. Surface Ti-containing MEA modification is deemed to be an efficient method to optimize wear resistance. In most studies, element powders were pre-mixed in a mechanical ball milling machine and then pre-placed on the to-be-coated substrate with specific binders before the laser cladding was conducted. This guarantees homogenous structures, but on the other hand, time needs to be spent preparing raw materials and unexpected impurities may be introduced, affecting the quality of the manufactured samples [27,28]. It is noted that, to date, there have been very few reports on the following two aspects: (i) MEA claddings with a complete single solid-solution phase fabricated by laser cladding on Ti with their microstructures and properties analyzed and (ii) substituting directly ejecting element powders in steps during laser cladding instead of pre-mixing and pre-placing powders before laser cladding to build an MEA layer [29]. Based on previous research, the refractory TiZrHfNbTa HEA and its MEA derivatives (TiNbZr, TiZrHf, TiTaZr, etc.) with a single BCC phase structure possess excellent strength and hardness [30,31,32,33]. Among them, TiNbZr and TiTaZr are two of the most commonly used ternary MEA systems, which indicates their feasibility for the surface enhancement of Ti materials [34,35].
Therefore, in this work, a simple pathway was applied to fabricate two ternary MEA derivatives (TiNbZr and TiTaZr) from quinary TiZrHfNbTa HEA by directly laser cladding the element powders layer-by-layer on pure Ti substrate. Structural and compositional characterizations were conducted to explore their microstructural characteristics, and the formation mechanism of the single BCC solid-solution phase was analyzed. In addition, the hardness and wear resistance of the MEA claddings were also measured and compared with those of the pure Ti. This work expects to offer a flexible and effective strategy for enhancing pure Ti surfaces by stepwise laser cladding, thereby broadening its application.
2. Materials and Methods
As-received, commercial, cold-rolled, pure Ti (>99 at.%) sheets without subsequent annealing were applied as the substrate materials. Several rectangular specimens with geometric dimensions of 50 mm × 50 mm × 5 mm were cut from the Ti sheets by wire-electrode cutting. Later, the Ti specimens were polished with abrasive papers and then dipped into anhydrous ethanol for ultrasonic cleaning to remove surface oxides and contaminations before laser cladding. The cladding equipment used in this work consists of a fiber laser system, three powder feeders, and a KUKA six-axis robot arm integrated with a powder nozzle. During laser cladding, the powder nozzle ejects metal powders through the central powder hole surrounded by three laser beam paths. Pure Nb and Ta powders (>99.9 at.%) with a size distribution of 15~45 μm and Zr powders (>99.9 at.%) with a size distribution of 50~105 μm were utilized as cladding powder materials. They were poured into three separate powder feeders which were connected to the powder nozzle and controlled by a central controller. Thus, the powder flows could be easily adjusted by controlling each powder feeder. As shown in Figure 1, all element powders had a high degree of sphericity, which ensures good fluidity of the powders stream. During the stepwise laser cladding processes, Nb or Ta powders were firstly in situ laser alloyed with Ti element diluted from the substrates, forming transition layers. After two transition layers, the dilution rate of the Ti substrate was lowered, Zr powders were finally laser cladded and the MEA claddings were prepared on the top surface. Figure 2 exhibits the schematic diagrams of the stepwise laser cladding process. The two obtained cladding specimens were denoted as C1 and C2. Based on the features of the stepwise laser cladding processes, the three cladding layers in each cladding specimen were named L1, L2, and L3. C1-L1 and C1-L2 are Nb-cladded transition layers, while C2-L1 and C2-L2 are Ta-cladded transition layers. Both C1-L3 and C2-L3 are Zr-cladded MEA layers. Hereinafter, for the convenience of description, the phrase the top surface layers or the codes C1-L3, C2-L3, and analogous expressions all refer to the two MEA top layers. The laser cladding parameters are listed in Table 1.
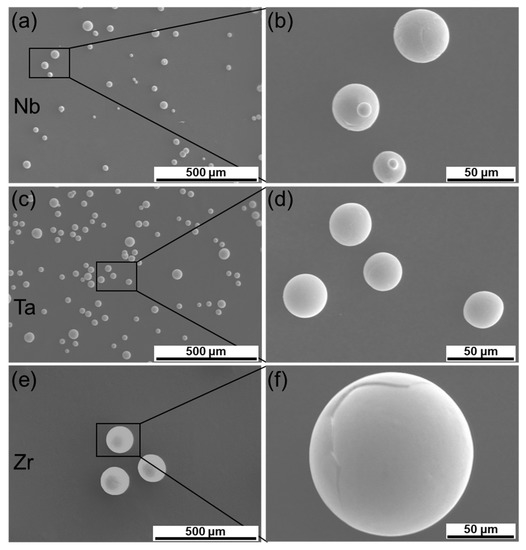
Figure 1.
Pure element powders used in this work. (a,b) Nb powders; (c,d) Ta powders; and (e,f) Zr powders.
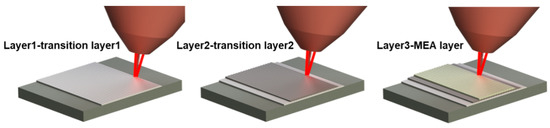
Figure 2.
Schematic diagrams of the cladding process.

Table 1.
Cladding parameters for each cladding layer. The grey rows distinguish the parameters of the two MEA layers.
After the fabrication, the as-cladded surfaces were mechanically ground by SiC abrasive papers up to #2000 and polished with SiO2 polishing solution before being subjected to X-ray diffraction (XRD, Shimadzu 6000, Kyoto, Japan) examination with Cu Kα radiation for phase characterization. Chemical and microstructural analyses were carried out on the ground and polished cross-section using a scanning electron microscope (SEM, HITACHI SU-8010, Tokyo, Japan) equipped with an energy dispersive spectrometer (EDS, Oxford X-mas80, Oxford, Britain) and Electron Back-Scattered Diffraction instrument (EBSD, Hikari XP, Hillsboro, OR, USA). Vickers microhardness tests at a load of 0.2 kgf and a dwell time of 10 s were performed to measure the hardness distribution along the depth of the specimens. Such measurements were repeated at least eight times at the same height to determine the average hardness values. The dry sliding wear tests were conducted on an HSR-2M reciprocating friction tester at room temperature. The friction pair was a 1045 steel ball with a radius of 6 mm. The normal load was 3 N, and the reciprocating frequency was 300 times per min with a 10 mm sliding distance. The total sliding distance for each sample in the wear test was set as 25 m, to maintain consistency in the test conditions. The 3-dimensional worn morphologies were reconstructed using a LEICA DCM3D laser confocal microscope after wear tests and the corresponding wear volumes and wear rates were calculated from five sectional profiles of the wear tracks. The wear rate (δ) was calculated using Equation (1):
where ΔV is the wear volume and ΣW is the accumulated frictional work. Fn represents the applied load and indicates the sliding distance.
3. Results
3.1. Microstructural Characteristics
Figure 3a presents the XRD profiles of the Ti substrate and the two laser-cladding specimens. The Ti substrate was composed of a typical HCP phase, while the C1-L3 and the C2-L3 possess a completely single BCC solid-solution phase. Compared with the peaks in the standard BCC Ti profiles, the ones in both the C1-L3 and C2-L3 were obviously shifted to the left due to the lattice distortion caused by the laser-alloyed elements. It was noted that the C2-L3 had a higher half-width than those of the C1-L3 (Figure 3b), which is probably caused by the higher residual stress and will be discussed below.
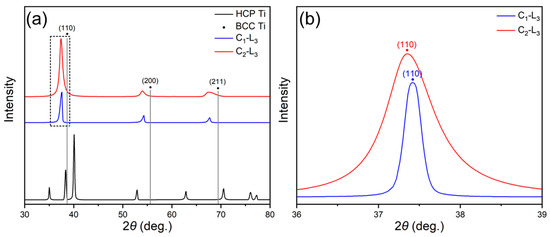
Figure 3.
(a) XRD profiles of the Ti substrate and the cladded specimens. (b) Magnified area of the profiles boxed in Figure 3a.
The microstructural morphology and the elemental distribution captured by SEM and EDS from the cross-section of the C1 specimen are shown in Figure 4. It can be seen from Figure 4a that the as-cladded C1 sample had three layers (corresponding to C1-L1, C1-L2, and C1-L3) due to the stepwise cladding process. The thickness of the top surface layer C1-L3 was approximately 550 μm and that of the two transition layers, the C1-L1 and the C1-L2 altogether, was about 510 μm. No obvious defect or crack was found in the claddings or the corrugated interfaces between layers, which indicates the high quality of the fabricated claddings with good metallurgical bonding. The inset in Figure 4a zooms in on the partial region of the transition layers. Some quasi-circular granules could be clearly recognized from the main part. According to the EDS mapping results displayed in Figure 4b, these granules were confirmed as un-melted Nb powders. There are always a few incompletely melted refractory metal powders with a high melting point present in laser-fabricated parts [36,37]. During laser cladding, as the laser center moves forward, the preceding molten pool begins to cool down. Meanwhile, many metal powders continue to be ejected from the powder nozzle into the preceding molten pool before it has fully solidified. By this time, the temperature is insufficient to fully melt the metal powders and thus those powders remain after solidification. It is worth mentioning that no unmelted powder was in the top surface layer after subsequent laser cladding and remelting, suggesting a sufficient mixture of those elements and a more homogeneous composition. Also, a stratified elemental distribution in the claddings can be obtained from Figure 4b, which accords with the stepwise fabricating strategy and the feature of the cladding layers microstructure. All the components were evenly distributed in each cladding layer. The component quantification of each layer is given in Table 2. The dilution rate of the Ti substrate decreased in the transition layers as the number of the cladding layers increased, and a chemical composition of Ti33.44Nb34.97Zr31.59 (at.%) was obtained in the C1-L3. Therefore, combined with the aforementioned XRD result (Figure 3a), a near-equiatomic TiNbZr MEA cladding composed of a single BCC solid-solution phase was successfully fabricated through stepwise laser cladding. Figure 4c focuses on the cellular structure in the TiNbZr MEA cladding. The cellular core and the darker cellular wall can be distinctly distinguished in the further magnified inset, and Figure 4d indicates that the cellular wall regions had a lower Nb content. In other words, the Nb element with the highest melting point concentrated inside the cellular core. The component metal powders would be melted in the molten pool after absorbing the laser energy and then the molten pool would rapidly cool down and solidify at the extremely high cooling rate up to 104~106 K·s−1, resulting in a non-equilibrium solidification process [38]. According to the non-equilibrium solidification theory, once nucleation starts, elements with a higher melting point tend to be enriched first [39]. In this case, Nb, with the highest melting point (2750 K) in the TiNbZr ternary system, concentrates inside the cellular core where solidification begins. As expected in the laser process, the achieved high cooling rate and high temperature gradient facilitate the formation of a cellular structure [40].
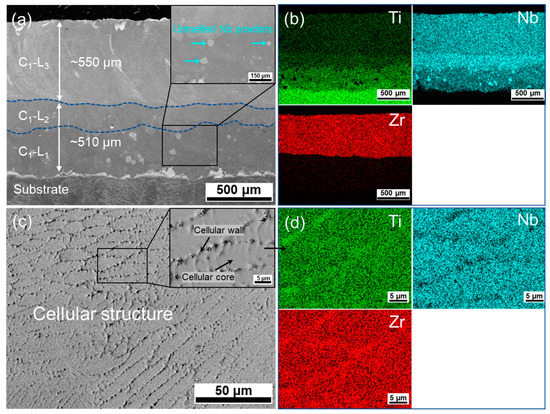
Figure 4.
Microstructure and component distribution of the C1 specimen. (a) A cross-sectional SEM image of the overall morphology; the inset shows the transition layers at a higher magnification. (b) The corresponding EDS mapping of the cross-section. (c) The cellular structure in the top surface layer; the inset shows the cellular core and wall at a higher magnification. (d) The EDS elements mapping of the magnified view in the boxed region of the cellular structure.
Table 2.
Chemical compositions of cladding layers. The grey rows distinguish the compositions of the two MEA layers.
In the same way, the transverse cross-section and the corresponding element analysis of the C2 specimen are shown in Figure 5. The two transition layers were about 400 μm thick in all, and the top surface layer was 530 μm thick (Figure 5a). Likewise, the existing unmelted Ta powders were caught in the transition layers, and the component elements were uniformly distributed in each cladding layer, as shown in Figure 5a,b. The component quantification of each layer is listed in Table 2, and a near-equiatomic Ti36.59Ta36.59Zr31.88 (at.%) MEA cladding was obtained through stepwise laser cladding. The TiTaZr MEA cladding was composed of a single BCC solid-solution phase without any precipitation observed as well (Figure 3a). Different from the TiNbZr MEA layer, the subgrain microstructure of the TiTaZr MEA layer turned from cellular to dendritic. In Figure 5c, the typical dendritic structure can be observed in the C2-L3, with developed dendrite and even secondary dendrite arms. The inter-dendritic regions amongst the dendrites imply that composition segregation occurs in the solid solution. Figure 5d points out the segregation of the component elements; the Ta elements (3290 K) were mainly concentrated in the dendrites, while the Ti and Zr were enriched within the interdendrites, conforming to the laser-introduced non-equilibrium solidification phenomenon. Compared with the cellular structure of the TiNbZr cladding layer in Figure 4c at the same magnification, the dendrite structure of the TiTaZr cladding layer (Figure 5c) showed a denser substructure.
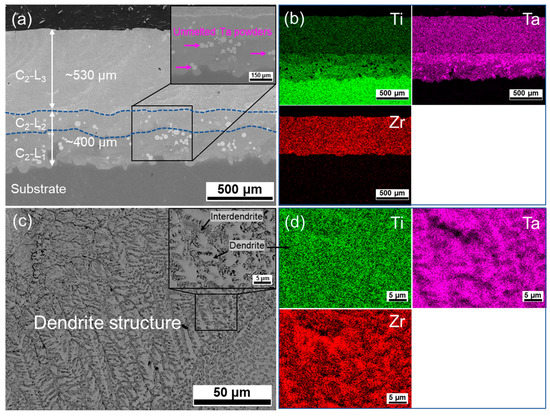
Figure 5.
Microstructure and component distribution of the C2 specimen. (a) A cross-sectional SEM image of the overall morphology; the inset shows the transition layers at a higher magnification. (b) The corresponding EDS mapping of the cross-section. (c) The dendrite structure in the top surface layer; the inset shows the dendrite and interdendrite at a higher magnification. (d) The EDS elements mapping of the magnified view in the boxed region of the dendrite structure.
Figure 6 shows the EBSD characterizations of the claddings with the Ti substrate in the C1 and C2 specimens. The EBSD phase maps related to the cross-sections in Figure 6a,e verify that the cladding layers were composed of a complete BCC phase, while the Ti substrate remained in the HCP phase, consistent with the XRD results in Figure 3a. The inverse pole figure (IPF) maps in Figure 6b,f reveal that the two obtained MEA cladding layers consisted of irregularly shaped grains without a preferred orientation (the overall IPF maps including the boxed regions A and B are presented in Figure S1), different from other laser fabricated alloy systems like NiTi with a specific crystal orientation that was reported previously [41]. The average grain sizes of the TiNbZr layer and the TiTaZr layer were measured to be 45.04 ± 28.71 μm and 7.46 ± 11.53 μm, respectively (the grain size distribution histograms can be observed in Figure S2). The statistics of the latter had an abnormal deviation, as abundant ultrafine and trivial equiaxed grains formed along the molten pool boundaries between the coarse grains in the TiTaZr layer (Figure 6f). The principal average grain size of the TiTaZr layer was revised to 19.35 ± 10.92 μm, excluding those ultrafine equiaxed grains. Indeed, the substitution of Ta for Nb markedly decreased the grain size. H. Dobbelstein et al. conducted a contrast experiment to identify the factors affecting the grain size of additive laser-manufactured TiZrNbTa HEA alloys and drew a conclusion that the chemical segregation of Ta gave rise to a decrease in grain size [37]. The corresponding Kernel average misorientation (KAM) maps that showed that the residual strains induced micro stress inside the grains are shown in Figure 6c and g, respectively. The KAM map of the TiNbZr layer revealed a uniform distribution with a relatively low average value of 0.43°. In contrast, the TiTaZr layer showed a higher average value of 0.55°, implying a higher and concentrated residual stress. In addition, the KAM value particularly increased within and alongside the ultrafine equiaxed grains, suggesting a remarkable stress concentration in these regions [42]. Figure 6d,h reveal that most of the grain boundaries in the TiNbZr layer possessed high misorientation angles, indicating limited residual stress [43], while the TiTaZr layer had a more dispersive grain boundaries angles distribution with some amount of low misorientation angles. This is consistent with the fact that the colors indicating orientations were uniform inside individual grains in Figure 6b but presented a slight orientation gradient in Figure 6f. Meanwhile, the complicated orientation relationship among the ultrafine equiaxed grains also gave rise to more disordered misorientation angles. Generally, fine grain size and high stress state both led to the strengthening of materials [44], as these microstructure differences would be reflected in the corresponding hardness.
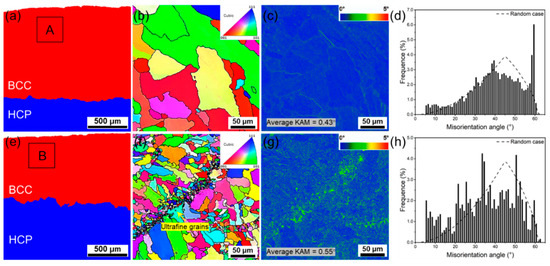
Figure 6.
EBSD characterizations. (a,e) EBSD phase maps of the C1 and C2, respectively. (b–d) IPF maps, KAM maps, and misorientation histograms of the boxed region A in Figure 6a and (f–h) the boxed region B in (e).
3.2. Hardness and Wear Resistance
Figure 7 shows the microhardness distribution of both cladding specimens along the depth direction. The average hardness value of the TiNbZr layer was 450 ± 30 HV0.2 and that of the TiTaZr layer was up to 513 ± 27 HV0.2, about 2.6 times and 3 times that of the pristine Ti specimen (170 ± 11 HV0.2), respectively. Obviously, the hardness of the TiTaZr layer was ~60 HV or ~13% higher than that of the TiNbZr layer. As mentioned above, the higher hardness is closely related to the finer grain sizes and higher residual stress in the TiTaZr layer.
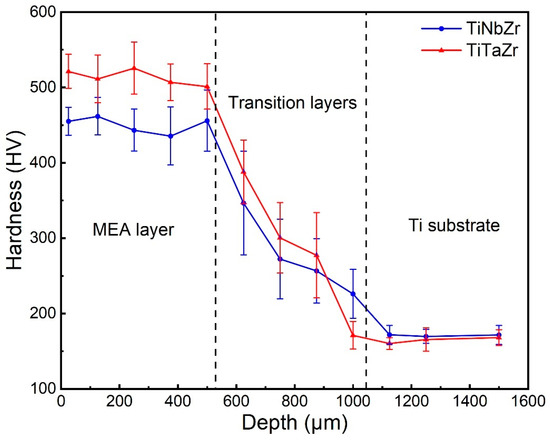
Figure 7.
Hardness distribution along the depth direction.
After the wear test, the 3D worn surface morphologies of the specimens were reconstructed. As shown in Figure 8, the wearing depth of the Ti specimen was remarkably deeper compared to those of the two MEA layers. Severe adhesive wear and large surface plastic deformation were observed on the worn surface of the Ti specimen, while the two MEA layers were just slightly and homogeneously worn, with much narrower and shallower tracks. An extensive worn scar about 1169 μm in width with severe grooves was observed along the sliding direction on the Ti specimen in Figure 9a. In addition, many adhesive layers and deep furrows were formed due to the ploughing of the friction pair. For materials with low hardness, they always undergo severe plastic deformation and loss of substance during friction sliding under the combined action of normal force and tangential force. Therefore, the wear mechanism of the Ti specimen was primarily adhesive wear, which is universal in soft and ductile materials. In contrast, the worn morphologies of the TiNbZr and the TiTaZr layers were relatively smooth and slight, with a wear scar depth of 359 μm and 340 μm (Figure 9b,c). The amounts of adhesive layers decreased dramatically, due to the reduction of plastic deformation. Instead, some debris occurred on the worn surface, indicating the presence of three-body abrasion wear (Figure 9a’–c’). The wear volumes of the Ti specimen, the TiNbZr layer, and the TiTaZr layer were measured to be 1.56 × 10⁷, 0.36 × 10⁷, and 0.24 × 107 μm3, respectively. The wear rates of the Ti specimen, the TiNbZr layer, and the TiTaZr layer were calculated to be 2.08 × 10⁻⁴, 0.49 × 10⁻⁴, and 0.32 × 10⁻⁴ mm3·N−1·m−1, respectively (Figure 10). Indeed, both the MEA layers possessed improved wear resistance compared to the pristine Ti, and the TiTaZr layer performed best. According to Archard’s law [45,46], the wear resistance of materials correlates with their surface hardness. Thus, the hard MEA layers of the cladding specimens were responsible for the reduction in wear rate, and the TiTaZr layer with the higher hardness possessed better wear resistance compared with the TiNbZr layer. Owing to the higher hardness, the TiTaZr layer had a less worn scratch and tiny debris compared with the TiNbZr layer, revealing the best wear resistance in this work. The main wear mechanisms turned from adhesive wear to abrasive wear after laser cladding the HEA layers.
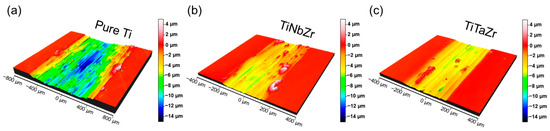
Figure 8.
3D worn morphologies across the wear track. (a) Pure Ti; (b) TiNbZr MEA cladding; and (c) TiTaZr cladding layer.
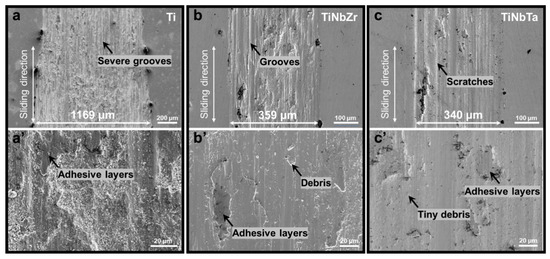
Figure 9.
Worn surface morphologies. (a,a’) Pure Ti; (b,b’) TiNbZr MEA cladding; (c,c’) TiTaZr MEA cladding.
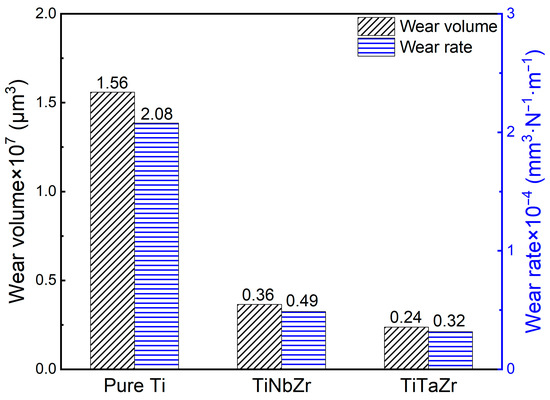
Figure 10.
Wear volumes and wear rates of the pure Ti and the two MEA cladding layers.
4. Discussion
4.1. Phase Formation in the MEA Cladding Layers
Based on the XRD analysis and the EBSD results, both the MEA cladding layers consisted of a single BCC solid-solution phase that was different from the HCP phase of the Ti substrate, which meets the expectation for the experimental design. In previous works, many researchers have been devoted to predicting the phase formation in multicomponent alloys (HEAs or MEAs), and several quantitative criteria have been considered to be useful. Atomic size plays an important role in both the Hume-Rothery rules describing the phase formation of binary systems and the Inoue principle describing the formation of bulk metallic glasses [47,48], and it is still functional in multicomponent systems. The atomic size difference is expressed as Equation (2):
where xi and di are the atomic percentage and atomic radius of the th element. In addition, Zhang et al. proposed a Ω parameter to express the coupling effect of mixing entropy and enthalpy on the stability of multicomponent solid-solution alloys [49]. The Ω parameter is defined by Equation (3):
where Tm, ΔSmix, and ΔHmix are the melting point, the mixing entropy, and the mixing enthalpy of the alloys, which are defined by Equations (4)–(6), respectively:
where (Tm)i is the melting point of the ith element and is the mixing enthalpy of binary liquid AB alloys. R is the gas constant (8.314 J·K−1·mol−1). When the parameter Ω and δ satisfy Ω ≥ 1.1 and δ ≤ 6.6% concurrently, multicomponent alloys tend to present a stable single solid-solution phase.
The crystal structure information of multi-component solid-solution alloys is also parameterized to optimize alloy design. Guo et al. investigated the impact of valence electron concentration (VEC) on the phase stability in series of solid-solution HEAs, and figured out that here was a threshold effect on VEC to control the phase preference for FCC or BCC solid-solutions [50]. Stable FCC phases exist at a higher VEC (≥8) and single BCC phases prefer to appear at a lower VEC (<6.87). The VEC is calculated using Equation (7):
where xi is the atomic percentage for the ith component and VECi is the VEC for the ith component.
The parameters δ, Ω, and VEC of the near-equiatomic MEA layers obtained in this work can be calculated from Table 3 and Table 4, and the results are presented in Table 5, together with the parameters from the nominal equiatomic ones. Clearly, both the near-equiatomic Ti33.44Nb34.97Zr31.59 and the Ti36.59Ta31.88Zr31.53 MEA systems in this work were in accordance with the criteria for the formation of a single BCC solid-solution phase, close to the theoretical value of the nominal equiatomic ones.
Table 3.
Characteristic parameters of Ti, Nb, Ta, and Zr elements data from [51].
Table 4.
Mixing enthalpy of binary liquid AB alloys data from [52].
Table 5.
Parameters δ, Ω, and VEC calculated from the MEA layers in this work and from the nominal ones.
4.2. Microstructure and Corresponding Surface Properties
As disclosed in Figure 10, the increase in the hardness of both MEA layers reduced their wear rate in comparison with the pure Ti substrate, improving the wear resistance of pure Ti. Alloys with a BCC phase usually exhibit higher strength and hardness than their FCC or HCP counterparts [53,54]. Thus, the BCC phase transformation in both MEA layers certainly contributed to the significant hardening effect in this work. Meanwhile, solution strengthening is also a prominent mechanism for enhancing materials. As shown in Figure 3a, the leftward BCC phase diffraction peaks imply the presence of lattice distortion. Atomic radius differences between each component in the solid-solution MEAs could induce aggressive lattice distortion which would impede dislocation movement and result in solid-solution hardening.
The much higher hardness in the TiTaZr layer than that in the TiNbZr layer also cannot be neglected. First of all, the TiTaZr layer exhibited finer average grain size than the TiNbZr layer (Figure 6). As revealed in the Hall–Petch relationship, refined grains would lead to strengthening and hardening of metallic materials [43]. According to the solidification theory, the solidification behavior during the laser process is mainly determined by the temperature gradient (G) and solidification rate (R) in the liquid/solid interface of the molten pool [55]. The crystal morphology is influenced by G/R, and the grain size is dependent on G × R. As G/R decreases, the columnar grains transfer to equiaxed grains. In laser-assisted manufacturing, the formation of columnar grains is usually facilitated as G values are extremely high, up to 103 K·mm−1 [56]. Nevertheless, the relatively higher laser scanning speed (0.06 m·s−1) in this work compared to general laser cladding processes (<0.01 m·s−1) increased the solidification rate and decreased the G/R ratio. Thereby, the columnar grains were suppressed, changing to the irregular-shaped grains in the two MEA layers. In addition, a finer grain size can be attributed to increased solidification rate (higher G × R value). The cooling rate is maximal at the solidification front of the molten pool boundary because heat directly and rapidly spreads out through the solid. In the case of the TiTaZr layer, its much higher Tm than the TiNbZr layer and the segregation of Ta elements with a significantly high melting point in the dendrite region inevitably gave rise to a high degree of composition supercooling which promotes the nucleation of ultrafine equiaxed grains at the molten pool boundary [57,58,59]. In the same way, finer grains than those of the TiNbZr layer were obtained in the subsequently solidified part.
Moreover, the half-width of the main diffraction peak of the C2 broadened a bit more than the one of the C1 when Nb was substituted by Ta, as shown in Figure 3b. A broadened diffraction peak could be caused by an amorphous phase, nano-scaled crystals, and microscopic residual stress. As analyzed above, theoretically, it is hard to form an amorphous phase in these two MEA systems, and the EBSD results in Figure 6f indeed confirmed the complete BCC crystal phase with micron-sized grains in the TiTaZr layer. Therefore, it is reasonable that the higher existing residual stress mainly led to the broadened diffraction peak. Subgrain structures like cellular and dendrite structures can serve as obstacles to dislocation movement and enhance dislocation pinning along cellular walls and dendrites, thus increasing residual stress [60]. Since it was revealed that the TiTaZr cladding layer had obviously denser subgrain dendrite structures than the TiNbZr cladding layer, the more concentrated dislocations which induce more stress in the TiTaZr cladding layer were reflected in the more dispersive XRD peak and the higher KAM value, further enhancing the hardness of the cladding layers. Compared to bulk TiTaZr (465 ± 11 HV) MEA, the increased hardness in the TiTaZr (513 ± 27 HV) cladding in this work could be attributed to refined grains and residual stress during the laser process [61].
5. Conclusions
In this work, two varieties of near-equiatomic MEA (TiNbZr and TiTaZr) claddings were fabricated on pure Ti substrate by direct in situ alloying of element powders through stepwise laser cladding. This stepwise cladding strategy demonstrated great efficiency and flexibility. The results from this study are summarized as follows:
- (1)
- The TiNbZr and the TiTaZr MEA layers fabricated by stepwise laser cladding on pure HCP Ti substrates were comprised of a single BCC solid-solution phase with irregular-shaped grains. The phase formation preference of the two MEA cladding layers meets the criteria for the formation of single BCC solid-solution phase in multicomponent alloys.
- (2)
- The TiNbZr and the TiTaZr MEA layers possessed higher microhardness than the Ti substrates, reaching 450 ± 30 HV0.2 and 513 ± 27 HV0.2, respectively. The enhanced hardness was mainly attributed to the effect of BCC solid-solution strengthening and residual stress. The refined grains with denser dendrite subgrain structures in the TiTaZr layer gave rise to a stronger hardening effect than the grains with cellular structures in the TiNbZr layer.
- (3)
- Thanks to the improvement of the surface hardness by the MEA layers, the specific wear rate decreased from 2.08 × 10⁻⁴ mm3·N−1·m−1 (Ti substrate) to 0.49 × 10⁻⁴ mm3·N−1·m−1 (TiNbZr layer). The hardest TiTaZr layer had the best wear resistance with the lowest wear rate of 0.32 × 10⁻⁴ mm3·N−1·m−1. The increasing hardness led to a change in the primary wear mechanisms from adhesive wear to abrasive wear.
Supplementary Materials
The following supporting information can be downloaded at: https://www.mdpi.com/article/10.3390/met13071280/s1, Figure S1: Overall IPF maps of (a) the TiNbZr layer and (b) the TiTaZr layer. Regions A and B are the areas analyzed in the main article; Figure S2: Grain size distribution histograms of (a) the TiNbZr layer and (b) the TiTaZr layer.
Author Contributions
Conceptualization, H.L. and J.L.; Investigation, H.L.; Resources, M.G., W.D. and X.L.; Data Curation, H.L. and Y.F.; Writing—original draft, H.L.; Writing—review and editing, J.L., Y.F., W.D. and X.L. All authors have read and agreed to the published version of the manuscript.
Funding
This study was funded by the National Natural Science Foundation of China (No. 92266202).
Data Availability Statement
The raw and processed data in this work are available on reasonable request from the corresponding author Jiabin Liu.
Conflicts of Interest
The authors declare no conflict of interest.
References
- Banerjee, D.; Williams, J.C. Perspectives on Titanium Science and Technology. Acta Mater. 2013, 61, 844–879. [Google Scholar] [CrossRef]
- Hao, Y.L.; Li, S.J.; Yang, R. Biomedical titanium alloys and their additive manufacturing. Rare Metals. 2016, 35, 661–671. [Google Scholar] [CrossRef]
- Zhang, L.C.; Chen, L.Y. A Review on Biomedical Titanium Alloys: Recent Progress and Prospect. Adv. Eng. Mater. 2019, 21, 1801215. [Google Scholar] [CrossRef]
- Gepreel, M.A.-H.; Niinomi, M. Biocompatibility of Ti-alloys for long-term implantation. J. Mech. Behav. Biomed. Mater. 2013, 20, 407–415. [Google Scholar] [CrossRef] [PubMed]
- Wang, T.T.; Zeng, L.G.; Li, Z.J.; Chai, L.J.; Cheng, T.J.; Zhang, L.; Fallah, V.; Dong, Q.S.; Yao, Z.W. Influences of Laser Surface Alloying with Cr on Microstructural Characteristics and Hardness of Pure Ti. Metall. Mater. Trans. A 2019, 50, 3794–3804. [Google Scholar] [CrossRef]
- Zhang, L.C.; Chen, L.Y.; Wang, L.Q. Surface Modification of Titanium and Titanium Alloys: Technologies, Developments, and Future Interests. Adv. Eng. Mater. 2020, 22, 1901258. [Google Scholar] [CrossRef]
- Niinomi, M. Mechanical properties of biomedical titanium alloys. Mater. Sci. Eng. A 1998, 243, 231–236. [Google Scholar] [CrossRef]
- Chai, L.J.; Wu, H.; Zheng, Z.Y.; Guan, H.T.; Pan, H.C.; Guo, N.; Song, B. Microstructural characterization and hardness variation of pure Ti surface-treated by pulsed laser. J. Alloys Compd. 2018, 741, 116–122. [Google Scholar] [CrossRef]
- Höche, D.; Schikora, H.; Zutz, H.; Emmel, A.; Queitsch, R.; Schaaf, P. TiN-coating formation by pulsed Nd:YAG laser irradiation of titanium in nitrogen. J. Coat. Technol. Res. 2008, 5, 505–512. [Google Scholar] [CrossRef]
- Golkovsky, M.G.; Zhuravina, T.V.; Bataev, I.A.; Bataev, A.A.; Veselov, S.V.; Bataev, V.A.; Prikhodko, E.A. Cladding of Tantalum and Niobium on Titanium by Electron Beam, Injected in Atmosphere. Adv. Mat. Res. 2011, 314–316, 23–27. [Google Scholar] [CrossRef]
- Yeh, J.W.; Chen, S.K.; Lin, S.J.; Gan, J.Y.; Chin, T.S.; Shun, T.T.; Tsau, C.H.; Chang, S.Y. Nanostructured High-Entropy Alloys with Multiple Principal Elements: Novel Alloy Design Concepts and Outcomes. Adv. Eng. Mater. 2004, 6, 299–303. [Google Scholar] [CrossRef]
- Cantor, B.; Chang, I.T.H.; Knight, P.; Vincent, A.J.B. Microstructural development in equiatomic multicomponent alloys. Mater. Sci. Eng. A 2004, 375–377, 213–218. [Google Scholar] [CrossRef]
- Yeh, J.W. Alloy Design Strategies and Future Trends in High-Entropy Alloys. JOM 2013, 65, 1759–1771. [Google Scholar] [CrossRef]
- Zhang, Y.; Zuo, T.T.; Tang, Z.; Gao, M.C.; Dahmen, K.A.; Liaw, P.K.; Lu, Z.P. Microstructures and properties of high-entropy alloys. Prog. Mater. Sci. 2014, 61, 1–93. [Google Scholar] [CrossRef]
- Huang, P.K.; Yeh, J.W.; Shun, T.T.; Chen, S.K. Multi-Principal-Element Alloys with Improved Oxidation and Wear Resistance for Thermal Spray Coating. Adv. Eng. Mater. 2004, 6, 74–78. [Google Scholar] [CrossRef]
- Wu, Z.; Bei, H.; Otto, F.; Pharr, G.M.; George, E.P. Recovery, recrystallization, grain growth and phase stability of a family of FCC-structured multi-component equiatomic solid solution alloys. Intermetallics 2014, 46, 131–140. [Google Scholar] [CrossRef]
- Son, S.; Lee, D.; Kwon, H.; Moon, J.; Park, K.B.; Kim, A.; Choi, J.; Jeong, J.H.; Cho, S.; Kim, H.S. Microstructure and mechanical properties of equiatomic Ti-containing medium-entropy alloys. J. Alloys Compd. 2023, 935, 168089. [Google Scholar] [CrossRef]
- Zhang, Y.G.; Bu, Z.Q.; Yao, T.T.; Yang, L.; Li, W.; Li, J.F. Novel BCC Ti-Al-Nb-Zr medium-entropy alloys with ultrahigh specific strength and ductility. J. Alloys Compd. 2023, 936, 168290. [Google Scholar] [CrossRef]
- Geng, Y.; Konovalov, S.V.; Chen, X. Research Status and Application of the High-Entropy and Traditional Alloys Fabricated via the Laser Cladding. Prog. Phys. Met. 2020, 21, 26–45. [Google Scholar] [CrossRef]
- Zhao, H.; Zhao, C.; Xie, W.; Wu, D.; Du, B.; Zhang, X.; Wen, M.; Ma, R.; Li, R.; Jiao, J.; et al. Research Progress of Laser Cladding on the Surface of Titanium and Its Alloys. Materials 2023, 16, 3250. [Google Scholar] [CrossRef]
- Arif, Z.U.; Khalid, M.Y.; Rehman, E.U.; Ullah, S.; Atif, M.; Tariq, A. A review on laser cladding of high-entropy alloys, their recent trends and potential applications. J. Manuf. Process. 2021, 68, 225–273. [Google Scholar] [CrossRef]
- Liu, S.S.; Zhao, G.L.; Wang, X.H.; Zhou, C.J. Design and characterization of AlNbMoTaCux high entropy alloys laser cladding coatings. Surf. Coat. Technol. 2022, 447, 128832. [Google Scholar] [CrossRef]
- Xiang, K.; Chen, L.Y.; Chai, L.J.; Guo, N.; Wang, H. Microstructural characteristics and properties of CoCrFeNiNbx high-entropy alloy coatings on pure titanium substrate by pulsed laser cladding. Appl. Surf. Sci. 2020, 517, 146214. [Google Scholar] [CrossRef]
- Li, Y.; Liang, H.; Nie, Q.; Qi, Z.; Deng, D.; Jiang, H.; Cao, Z. Microstructures and Wear Resistance of CoCrFeNi2V0.5Tix High-Entropy Alloy Coatings Prepared by Laser Cladding. Crystals 2020, 10, 352. [Google Scholar] [CrossRef]
- Xiang, K.; Chai, L.J.; Wang, Y.Y.; Wang, H.; Guo, N.; Ma, Y.L.; Murty, K.L. Microstructural characteristics and hardness of CoNiTi medium-entropy alloy coating on pure Ti substrate prepared by pulsed laser cladding. J. Alloys Compd. 2020, 849, 156704. [Google Scholar] [CrossRef]
- Chai, L.J.; Wang, C.; Xiang, K.; Wang, Y.Y.; Wang, T.; Ma, Y.L. Phase constitution, microstructure and properties of pulsed laser-clad ternary CrNiTi medium-entropy alloy coating on pure titanium. Surf. Coat. Technol. 2020, 402, 126503. [Google Scholar] [CrossRef]
- Dastanpoor, E.; Enayati, M.H. Role of Impurities in Mechanical Alloying Amorphization of Cu-Zr and Cu-Zr-Al Systems. Indian. J. Eng. Mater. Sci. 2017, 24, 77–82. [Google Scholar]
- Qi, P.B.; Liang, X.B.; Tong, Y.G.; Chen, Y.X.; Zhang, Z.B. Effect of Milling Time on Preparation of NbMoTaW High Entropy Alloy Powder by Mechanical Alloying. Rare Metal. Mat. Eng. 2019, 48, 2623–2629. [Google Scholar]
- Ron, T.; Shirizly, A.; Aghion, E. Additive Manufacturing Technologies of High Entropy Alloys (HEA): Review and Prospects. Materials 2023, 16, 2454. [Google Scholar] [CrossRef]
- Xiang, T.; Du, P.; Cai, Z.Y.; Li, K.; Bao, W.Z.; Yang, X.X.; Xie, G.Q. Phase-tunable equiatomic and non-equiatomic Ti-Zr-Nb-Ta high-entropy alloys with ultrahigh strength for metallic biomaterials. J. Mater. Sci. Technol. 2022, 117, 196–206. [Google Scholar] [CrossRef]
- Hu, S.W.; Li, T.J.; Su, Z.Q.; Liu, D.X. Research on suitable strength, elastic modulus and abrasion resistance of Ti–Zr–Nb medium entropy alloys (MEAs) for implant adaptation. Intermetallics 2022, 140, 107401. [Google Scholar] [CrossRef]
- Yang, R.; Rahman, K.M.; Rakhymberdiyev, A.N.; Dye, D.; Vorontsov, V.A. Mechanical behaviour of Ti-Nb-Hf alloys. Mater. Sci. Eng. A 2019, 740–741, 398–409. [Google Scholar] [CrossRef]
- Ren, Z.Y.; Hu, Y.L.; Tong, Y.; Cai, Z.H.; Liu, J.; Wang, H.D.; Liao, J.Z.; Xu, S.; Li, L.K. Wear-resistant NbMoTaWTi high entropy alloy coating prepared by laser cladding on TC4 titanium alloy. Tribol. Int. 2023, 182, 108366. [Google Scholar] [CrossRef]
- Senkov, O.N.; Kuhr, S.J.; Shank, J.M.; Payton, E.J.; Woodward, C. Microstructure and properties of an equiatomic TaTiZr alloy. Mater. Sci. Eng. A 2021, 814, 141168. [Google Scholar] [CrossRef]
- Whitfield, T.E.; Pickering, E.J.; Christofidou, K.A.; Jones, C.N.; Stone, H.J.; Jones, N.G. Elucidating the microstructural development of refractory metal high entropy superalloys via the Ti–Ta–Zr constituent system. J. Alloy Compd. 2020, 818, 152935. [Google Scholar] [CrossRef]
- Zhang, L.C.; Attar, H. Selective Laser Melting of Titanium Alloys and Titanium Matrix Composites for Biomedical Applications: A Review. Adv. Eng. Mater. 2016, 18, 463–475. [Google Scholar] [CrossRef]
- Dobbelstein, H.; Gurevich, E.L.; George, E.P.; Ostendorf, A.; Laplanche, G. Laser metal deposition of compositionally graded TiZrNbTa refractory high-entropy alloys using elemental powder blends. Addit. Manuf. 2019, 25, 252–262. [Google Scholar] [CrossRef]
- Juan, Y.F.; Zhang, J.; Dai, Y.B.; Dong, Q.; Han, Y.F. Designing Rules of Laser-Clad High-Entropy Alloy Coatings with Simple Solid Solution Phases. Acta Metal. Sin.-Engl. 2020, 33, 1064–1076. [Google Scholar] [CrossRef]
- Wołczyński, W.; Krajewski, W.; Ebner, R.; Kloch, J. The use of equilibrium phase diagram for the calculation of non-equilibrium precipitates in dendritic solidification. Theory. Calphad 2001, 25, 401–408. [Google Scholar] [CrossRef]
- Prashanth, K.G.; Eckert, J. Formation of metastable cellular microstructures in selective laser melted alloys. J. Alloys Compd. 2017, 707, 27–34. [Google Scholar] [CrossRef]
- Zhou, Q.; Hayat, M.D.; Chen, G.; Cai, S.; Qu, X.H.; Tang, H.P.; Cao, P. Selective electron beam melting of NiTi: Microstructure, phase transformation and mechanical properties. Mater. Sci. Eng. A 2019, 744, 290–298. [Google Scholar] [CrossRef]
- Wright, S.I.; Nowell, M.M.; Field, D.P. A review of strain analysis using electron backscatter diffraction. Microsc. Microanal. 2011, 17, 316–329. [Google Scholar] [CrossRef] [PubMed]
- Hansen, N. Hall–Petch relation and boundary strengthening. Scr. Mater. 2004, 51, 801–806. [Google Scholar] [CrossRef]
- Guan, H.T.; Chai, L.J.; Wu, J.Y.; Gong, X.Y.; Xiang, K.; Wu, L.; Pan, H.C.; Li, Y.Q.; Wang, Q.S. Laser-clad Nb(Ta)TiZr medium-entropy alloy coatings on pure Zr sheet: Microstructural characteristics, hardness and wear resistance. Intermetallics 2022, 143, 107498. [Google Scholar] [CrossRef]
- Popov, V. Generalized Archard Law of Wear Based on Rabinowicz Criterion of Wear Particle Formation. Facta Univ.-Ser. Mech. Eng. 2019, 17, 39–45. [Google Scholar] [CrossRef]
- Archard, J.F. Contact and Rubbing of Flat Surfaces. J. Appl. Phys. 1953, 24, 981–988. [Google Scholar] [CrossRef]
- Li, S.Z.; Zhang, H.R.; Dai, D.B.; Ding, G.T.; Wei, X.; Guo, Y.K. Study on the factors affecting solid solubility in binary alloys: An exploration by Machine Learning. J. Alloys Compd. 2019, 782, 110–118. [Google Scholar] [CrossRef]
- Inoue, A. Stablization of metallic supercooled liquid and bulk amorphous alloys. Acta Mater. 2000, 48, 279–306. [Google Scholar] [CrossRef]
- Yang, X.; Zhang, Y. Prediction of high-entropy stabilized solid-solution in multi-component alloys. Mater. Chem. Phys. 2012, 132, 233–238. [Google Scholar] [CrossRef]
- Guo, S.; Ng, C.; Lu, J.; Liu, C.T. Effect of valence electron concentration on stability of fcc or bcc phase in high entropy alloys. J. Appl. Phys. 2011, 109, 103505. [Google Scholar] [CrossRef]
- Miracle, D.B.; Senkov, O.N. A critical review of high entropy alloys and related concepts. Acta Mater. 2017, 122, 448–511. [Google Scholar] [CrossRef]
- Takeuchi, A.; Inoue, A. Classification of Bulk Metallic Glasses by Atomic Size Difference, Heat of Mixing and Period of Constituent Elements and Its Application to Characterization of the Main Alloying Element. Mater. Trans. 2005, 46, 2817–2829. [Google Scholar] [CrossRef]
- Gou, S.Y.; Li, S.C.; Hu, H.L.; Fang, Y.T.; Liu, J.B.; Dong, W.P.; Wang, H.T. Surface hardening of CrCoFeNi high-entropy alloys via Al laser alloying. Mater. Res. Lett. 2021, 9, 437–444. [Google Scholar] [CrossRef]
- Tong, C.J.; Chen, M.R.; Chen, S.K.; Yeh, J.W.; Shun, T.T.; Lin, S.J.; Chang, S.Y. Mechanical performance of the Al x CoCrCuFeNi high-entropy alloy system with multiprincipal elements. Metall. Mater. Trans. A 2005, 36, 1263–1271. [Google Scholar] [CrossRef]
- Jun, L.M.; Cang, Y.G.; He, Z.Y. Comments on ‘Solidification modes and microstructure of Fe–Cr alloys solidified at different undercoolings’. Mater. Sci. Eng. A 1999, 270, 267–269. [Google Scholar]
- Guan, S.; Wan, D.; Solberg, K.; Berto, F.; Welo, T.; Yue, T.M.; Chan, K.C. Additive manufacturing of fine-grained and dislocation-populated CrMnFeCoNi high entropy alloy by laser engineered net shaping. Mater. Sci. Eng. A 2019, 761, 138056. [Google Scholar] [CrossRef]
- Hunt, J.D. Steady state columnar and equiaxed growth of dendrites and eutectic. Mater. Sci. Eng. 1984, 65, 75–83. [Google Scholar] [CrossRef]
- Gkmann, M.; Trivedi, R.; Kurz, W. Nucleation ahead of the advancing interface in directional solidification. Mater. Sci. Eng. A 1997, 226–228, 763–769. [Google Scholar]
- Willnecker, R.; Herlach, D.M.; Feuerbacher, B. Evidence of nonequilibrium processes in rapid solidification of undercooled metals. Phys. Rev. Lett. 1989, 62, 2707–2710. [Google Scholar] [CrossRef]
- Wang, Y.M.; Voisin, T.; McKeown, J.T.; Ye, J.; Calta, N.P.; Li, Z.; Zeng, Z.; Zhang, Y.; Chen, W.; Roehling, T.T.; et al. Additively manufactured hierarchical stainless steels with high strength and ductility. Nat. Mater. 2018, 17, 63–71. [Google Scholar] [CrossRef]
- Wang, Z.N.; Yan, Y.; Wu, Y.; Su, Y.J.; Qiao, L.J. Repassivation and dry sliding wear behavior of equiatomic medium entropy TiZr (Hf, Ta, Nb) alloys. Mater. Lett. 2022, 312, 131643. [Google Scholar] [CrossRef]


Disclaimer/Publisher’s Note: The statements, opinions and data contained in all publications are solely those of the individual author(s) and contributor(s) and not of MDPI and/or the editor(s). MDPI and/or the editor(s) disclaim responsibility for any injury to people or property resulting from any ideas, methods, instructions or products referred to in the content. |
© 2023 by the authors. Licensee MDPI, Basel, Switzerland. This article is an open access article distributed under the terms and conditions of the Creative Commons Attribution (CC BY) license (https://creativecommons.org/licenses/by/4.0/).