Article

Puzzles of Surface Segregation in Binary Pt–Pd Nanoparticles: Molecular Dynamics and Thermodynamic Simulations

Physico-Technical Faculty, Tver State University, 33, Zhelyabova Str., Tver 170100, Russia
*
Author to whom correspondence should be addressed.
Metals 2023, 13(7), 1269; https://doi.org/10.3390/met13071269
Submission received: 8 June 2023 / Revised: 29 June 2023 / Accepted: 5 July 2023 / Published: 14 July 2023

Abstract

:
Up till now, there have been extremely contradictory opinions and inadequate results concerning surface segregation in binary platinum–palladium (Pt–Pd) nanoparticles, including the problems regarding segregating components, as well as the size and temperature dependences of segregation. Taking into account such a situation, we investigated the surface segregation in Pt–Pd nanoparticles by combining atomistic (molecular dynamics) and thermodynamic simulations. For molecular dynamics experiments, the well-known program LAMMPS and the embedded atom method were employed. In the course of the atomistic simulations, two different sets of parameterizations for the Pt–Pt, Pd–Pd, and Pt–Pd interatomic interaction potentials were used. The thermodynamic simulation was based on solving the Butler equation by employing several successive approximations. The results obtained via atomistic simulation and thermodynamic simulation on the basis of the Butler equation were compared with each other, as well as with predictions that were based on the Langmuir–McLean equation and some experimental data. Both simulation methods (atomistic and thermodynamic) predicted the surface segregation of Pd, which diminishes with the nanoparticle size and with increasing temperature. Our simulation results do not confirm the predictions of some authors on surface segregation inversion, i.e., the reversal from the surface segregation of Pd to the surface segregation of Pt when diminishing the nanoparticle size.

1. Introduction

Particles of nanometer size can exhibit properties that differ from those of their corresponding bulk materials. Nowadays, metallic nanoparticles (NPs) are considered an important type of nanomaterials that have, in some cases, unique physical and chemical properties; metallic NPs provide for many applications in the fields of optics, optoelectronics, chemical production, biosensors, catalysis, and other directions of nanotechnology [1,2]. In particular, plasmonic applications should be noted [2]. Metallic and metal-based NPs can also demonstrate unique tuned magnetic properties [3,4,5,6]. In addition, NPs play a role in the building blocks of fabricated nanostructured materials; for example, via powder metallurgy technologies that are based on NP sintering [7]. In the last decade, applications of metallic NPs in biotechnology and medicine have also been reported [8,9,10]. However, nanocatalysis, including that in fuel cells, seems to be the main area of application for metallic NPs [11,12,13].
Regarding monometallic NPs, gold NPs have been discussed in the literature in great detail [14,15]. Among monometallic catalysts, Pt seems to be most effective as it is employed both as separate active atomic sites in organic compounds, and as the NPs in some metallic structures, i.e., the constituents of heterogeneous catalysts [16,17,18]. According to [16], the automotive industry is the main consumer of the noble metals platinum (Pt), palladium (Pd), and rhodium. These metals are used as components of the automotive catalysts that are applied to decrease the emissions of carbon monoxide, unburnt hydrocarbons, and nitrogen oxides in exhaust gases.
Binary NPs, including Pt–Pd, and multicomponent NPs demonstrate a variety of structures and phenomena [19,20] that are not typical for single-component systems. Binary and multicomponent NPs are also referred to as nanoalloys [19]. The phenomena specific to binary and multicomponent NPs open up new possibilities for the tuning of their properties in view of various practical applications. In particular, bimetallic NPs make it possible to combine plasmonic and catalytic metals for photocatalysis [21]. It is also worth noting that, as a rule, the terms “binary” and “bimetallic” are used as synonyms. We believe that it would be better to employ the term “bimetallic NPs” for binary NPs that have completely or almost completely segregated components, i.e., binary NPs such as those with core–shell and Janus structures. Bimetallic Pt–Pd NPs, including core–shell Pt@Pd, can have unique electronic and magnetic properties [22]. However, first of all, binary Pt–Pd NPs are known to be effective nanocatalysts [23,24,25,26,27,28,29,30,31,32,33,34,35,36,37,38,39,40].
Almost all phenomena inherent to binary and multicomponent NPs relate, to a greater or lesser extent, to the segregation of their components. First of all, we refer to surface segregation, i.e., the enrichment of the surface layer with one of two NP components. From this point of view, the core–shell bimetallic structures of A@B and B@A [19,20,21], as well as Janus structures [41], may be considered as patterns of a very pronounced segregation in binary NPs. In the above notations, the first symbol (before the @ sign) corresponds to the NP core; the second corresponds to its shell. Atomistic simulations of structural transformations in bimetallic NPs are discussed in [42,43,44]. Bimetallic core–shell NPs can also have a more complex structure. For example, in [45], three-shell onion-like A@B@A NPs with an intermediate shell B were considered. We believe, however, that it would be better to refer to these as two-shell structures. In recent years, trimetallic NPs have also attracted the attention of researchers [46].
In the review of [19] (see also monograph [47]), the following factors affecting the surface segregation in nanoalloys were detailed:
(i)
Bond strengths, i.e., the relative strengths of the A–A, B–B, and A–B bonds between metal atoms. The components that form stronger bonds should tend to the core positions, while stronger A–B bonds will favor mixing (we believe that the bond strengths are determined, first of all, by the binding energies of components A and B);
(ii)
Surface energies: the metal with the lower surface energy (and the lower surface tension) will segregate to the NP surface;
(iii)
Atomic sizes that relate to the release of strains in the NPs with smaller atoms that tend to the core positions;
(iv)
Specific electronic effects for certain metals (i.e., the directionality of bonds, according to [27]);
(v)
Charge transfer effects: the most electronegative atom tends to occupy a surface site.
The last two factors should be taken into account in certain specific cases only, e.g., in the case of a 38-atom Ag–Au nanocluster (see Chapter 8 in monograph [47]). Therefore, if the atomic size mismatch is small enough, the two first factors affecting the surface segregation seem to be considered basic. In addition, all the above factors relate to each other. In particular, the strengths of bonds determine the surface energies (i.e., the surface tensions) of components. According to the thermodynamic simulation method that was based on solving the Butler equation [48] considered in Section 4, the surface segregation in the A–B nanoalloys was determined, first of all, by the difference ( σ A ( 0 ) σ B ( 0 ) ) between the specific (per unit area) surface energies σ A ( 0 ) and σ B ( 0 ) of components A and B.
On the one hand, the Pt–Pd system may be considered simple enough for investigation. In reality, Pt and Pd have similar properties, including an absence of the atomic size mismatch and a simple type of phase diagram that corresponds to the unlimited mutual solubility of components. Only the first two inter-related factors of segregation (among the five listed above) may be of importance, and these factors can be adequately taken into account in molecular dynamics (MD) simulations. On the other hand, properties of Pt, Pd, and Pt–Pd NPs are studied much less frequently than properties of NPs of metals with lower melting temperatures. In particular, as noted in ref. [49], experimental data on the size dependence of the melting temperatures of Pt and Pd NPs seem to be absent in the literature. Experimental data on the segregation of components in Pt–Pd NPs are quite rare [50,51,52], and relate only to a few NP compositions and sizes or to quite narrow size ranges. For example, experimental data [50] relate to the Pt–Pd NP size region from 1.8 to 4.2 nm, while experimental data [52] relate to Pt–Pd NPs of 3.8, 4.5, and 4.8 nm in diameter. However, all the available experimental data predict the surface segregation of Pd.
At the same time, some theoretical models and atomistic simulations predict that the surface segregating component in Pt–Pd NPs can change at a critical size. For example, in [53], a critical value α of the NP diameter d is introduced, below which the surface segregation of Pd should be switched to the surface segregation of Pt. Then, MD results [54] predict that the segregation in Pt–Pd NPs of 2 nm in size is practically absent, whereas in NPs 4 nm in size, the surface segregation of Pd switches to the surface segregation of Pt when the molar fraction of Pd is smaller than 0.6. Experimental data and accurate density functional theory (DFT) results [55] (see also the references cited in [56]) for small Pt–Pd nanoclusters do not corroborate such a transition. Thus, it would be reasonable to investigate the size dependence of surface segregation in Pt–Pd NPs using the embedded atom method (EAM), i.e., the main alternative to other interatomic potentials used for metals including the Sutton–Chen potential [57] employed in [54].
Notably, the authors of paper [53] concluded that surface segregation in Pt–Pd NPs increases with decreasing the NP size. This statement contradicts the other conclusion about the inversion of the surface segregation made in the same paper. The temperature dependence of surface segregation in binary metallic NPs, including those composed of Pt–Pd, is also a controversial issue. In the present study, the surface segregation in Pt–Pd NPs, including their size and temperature dependences, was investigated using MD and thermodynamic simulations. The thermodynamic results obtained in the frames of thermostatics relate to the equilibrium surface segregation, whereas the MD simulations reproduce kinetics of segregation at the time scales available in the MD experiments. In general, the obtained MD and thermodynamic results agree with each other, although some kinetic effects were also revealed in our MD simulations.
In ref. [49], we revealed some problems related to parameterizations of the interatomic interaction potentials that are employed for atomistic simulations in the frames of EAM. This refers to the EAM parameterizations proposed by Zhou and his co-authors [58] for 12 metals, including Pt and Pd. As noted in ref. [49], we found that parameterizations [58] inadequately predict a higher melting temperature for Pd than for Pt. For this reason, in ref. [49], we recalculated the embedding functions for Pt and Pd to adequately predict the relationship between the bulk melting points of Pt and Pd. In the present paper, our MD results obtained by employing both EAM parameterizations ([49,58]) are compared. The abovementioned drawback of parameterizations [58] made it possible to establish whether the relationship between the melting temperatures of components A and B noticeably affects the surface segregation in A–B nanoalloys.
It is also worth noting that for the last decade, the scientific community has shown interest in trimetallic [34,59,60] and even quaternary [61] NPs containing Pt and Pd as two of the three or four components. As we believe, the above open questions concerning binary Pt–Pd NPs should be solved before proper detailed atomistic simulations of ternary and quaternary Pt- and Pd-based nanoalloys can be started.

2. Atomistic Simulation of Pt–Pd Nanoparticles

2.1. Approaches to Molecular Dynamics Simulation

For our MD simulations, the well-known open program LAMMPS (version—23 June 2022, Sandia National Laboratories, Albuquerque, NM, USA) [62], employing EAM to describe the interatomic interactions in Pt–Pd NPs, was used. LAMMPS makes it possible to perform parallel computing on graphics processing units (GPUs), which is one of the advantages of this program. The standard velocity Verlet integrator [63] and the Nosé–Hoover thermostat [64] were used in our MD simulations with the time step t 0 = 1 fs usually being chosen in contemporary MD simulations. We have found that the value t d a m p * = t d a m p / t o = 10 of the reduced damping parameter, i.e., of the relaxation time t d a m p , seems to be optimal for our MD simulations. Indeed, our preliminary MD simulations showed that for molecular (Lennard–Jones) systems and for metals at constant temperatures, t d a m p * = 100 may be suitable. However, our MD simulations included heating and cooling NPs, and a damping parameter of 100 does not ensure proper controlling temperature during these processes. No significant difference was noted in the results of NP relaxation at the final constant temperatures obtained for t d a m p * = 10 and t d a m p * = 100 . Although a more systematic study on selecting the damping parameter in isothermal MD simulations would be necessary, this problem is beyond the scope of our study.
As mentioned in the Introduction, two EAM sets of parameterizations were used: ours, [49], and that proposed in [58]. In both cases, the algorithm in [58] was employed to generate the Pt–Pd potential on the basis of Pt–Pt and Pd–Pd potentials. Both sets of parameterizations were verified on the bulk Pt and Pd phases, Pt and Pd NPs in our previous paper [49]. According to Table 1 and Table 2, both sets of parameterizations predict close and adequate values of densities of bulk Pt and Pd in solid and liquid states, but parameterizations [58] inadequately predict a higher bulk melting point T m ( ) for Pd in comparison with Pt. This disadvantage of parameterizations [58] has a positive side: such a discrepancy between the results for T m ( ) , obtained when employing two different sets of the EAM parameters, makes it possible to establish the effect of T m ( ) on segregation in Pt–Pd NPs.
Unlike ab initio methods, MD simulations reproduce kinetics of the process in the systems under study. The kinetics of segregation should strongly depend on the NP size and temperature. Due to parallel calculations on the GPUs, LAMMPS significantly expands the range of sizes of simulated objects and the time of the reproducible MD evolution. No doubt, in MD simulations, the choice of the interatomic potential and its parameterization largely determines the reliability of the simulation results. EAM and the tight-binding potential [67] can be considered as the two main and well-proven types of many-body potentials commonly used in simulations of metallic systems. In ref. [49], we verified our parameterizations and additionally verified the parameterizations [58] which were previously tested by the authors of [58] themselves.
The performance of these potentials in describing the Pt–Pd interaction is of special importance. The validity and reliability of the Pt–Pd interaction potential was not substantiated in [49]. However, according to [58], an algorithm proposed by the authors of this paper and employed in the present study provides a reasonable approximation of the cross-interaction potentials, including Pt–Pd. In particular, this algorithm adequately predicts the heats of solutions. In ref. [49], we performed more accurate calculations of the embedding functions for Pt and Pd, which determined qualitatively correct relationships between the melting temperatures of Pt and Pd. Obviously, a higher correctness of the embedding functions should not lead to a lower correctness of the Pt–Pd parameterization; our present work can be considered as a further validation of the EAM Pd–Pt interaction potential.
There is no doubt that the decrease in the NP size affects the electronic configuration of Pt and Pd atoms, and this effect cannot be fully taken into account in the framework of EAM. However, as mentioned in Introduction, accurate DFT calculations for small Pt–Pd nanoclusters [55,56] confirm our MD results, at least indirectly.
The initial configuration of a binary A–B NP corresponded to a spherical fragment of the bulk fcc lattice with the random distributions of the A and B components. According to [68,69], Pt NPs and Pt–based nanoalloys can grow as truncated octahedral, octahedral, and even tetrahedral structures. However, when subsequent melting, cooling, and annealing the initial configuration are employed to promote segregation, the shape and structure of the initial configurations are less important. After placing the initial configuration into the center of the 60 nm × 60 nm × 60 nm simulation box, the particle was relaxed (annealed) at a sufficiently low temperature, T 0 , of 300 K, and then uniformly heated up to a temperature T 1 , knowingly higher than the melting points, T m ( ) , of both components. Such a procedure made it possible to reach the melted state of the NP. Then, the NP was gradually cooled at a cooling rate of T ˙ = 0.12 TK/s, low for MD experiments, down to a temperature, T (at which then the segregation parameters would be determined), and finally, the NP relaxed for about 100 ns at the chosen fixed temperature. The subsequent binary NP melting, cooling, and annealing before registration of the segregation were used to facilitate the rearrangement of the initially non-equilibrium particle structure, i.e., to promote the potential trend to the spontaneous surface segregation of one of the NP components. Segregation was studied when the particle structure and its properties had not changed after relaxation (annealing), i.e., when the particle state could be treated as equilibrium or close to it. The relevance of such an approach will be confirmed by agreement between our MD simulation results and the results of the thermodynamic simulation, as well as some experimental and DFT results of other authors.

2.2. Results of Molecular Dynamics Simulation

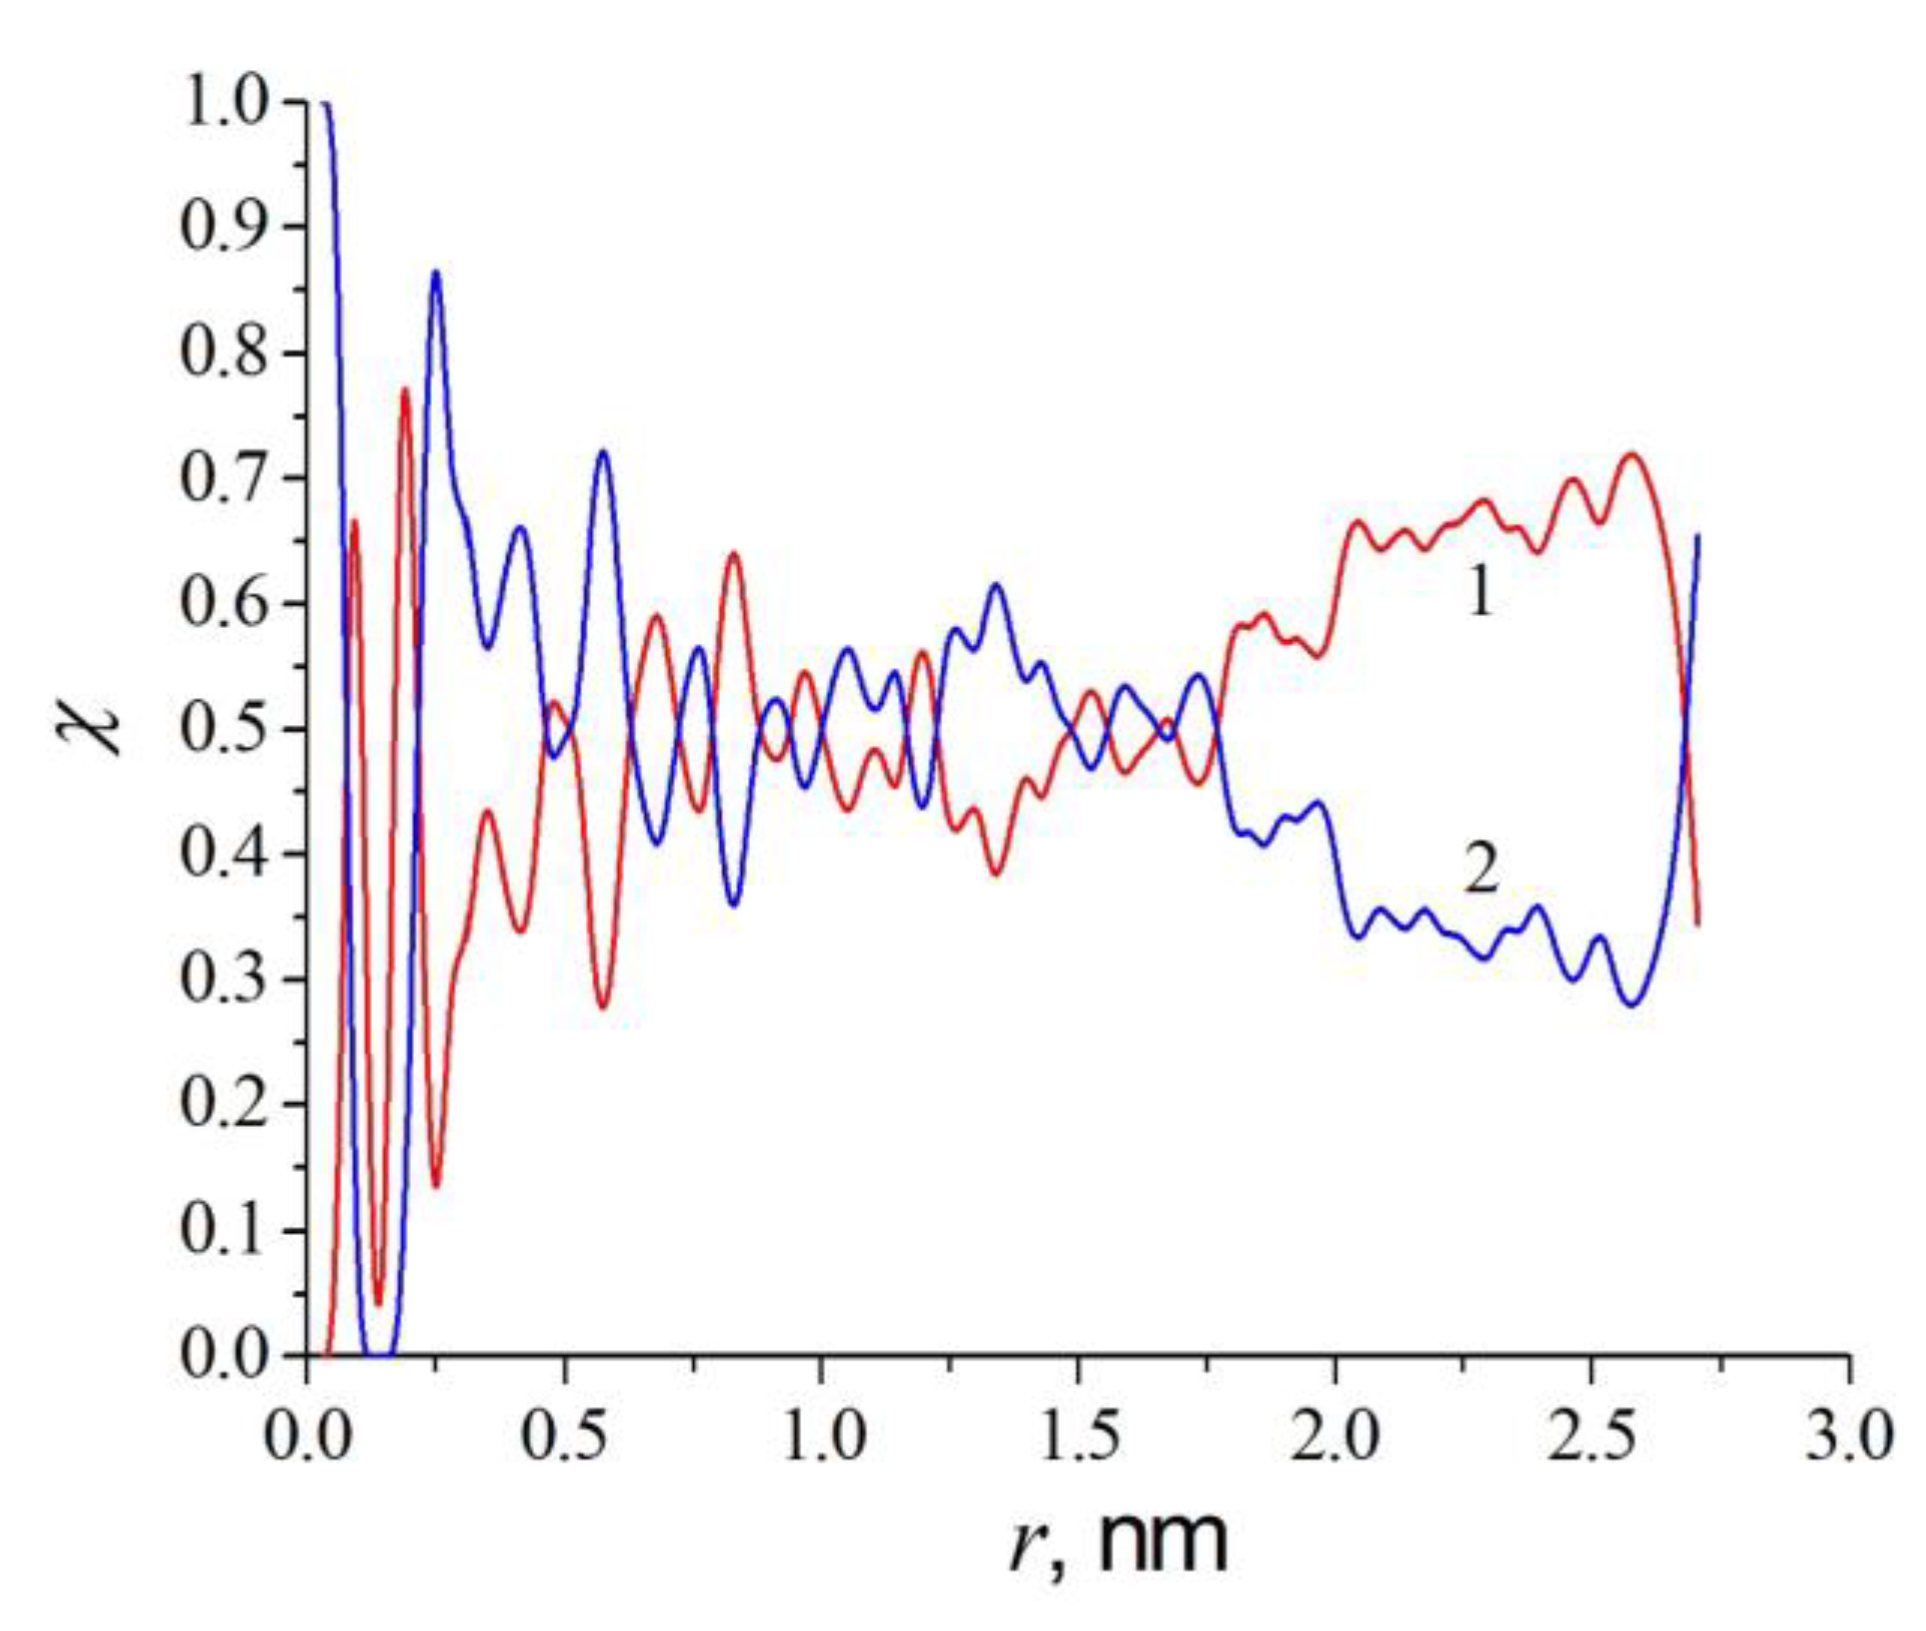
As noted in the previous subsection, the initial configurations of binary Pt–Pd NPs corresponded to spherical fragments of the fcc lattice with random and approximately uniform distributions of atoms of both components. A snapshot and a central cross-section of one of the initial configurations containing N = 5000 atoms (40% Pd, particle size 5.3 nm) are presented in Figure 1. The initial radial distributions of the local molar fractions χ P t ( r ) and χ P d ( r ) of Pt and Pd, respectively, are shown in Figure 2.
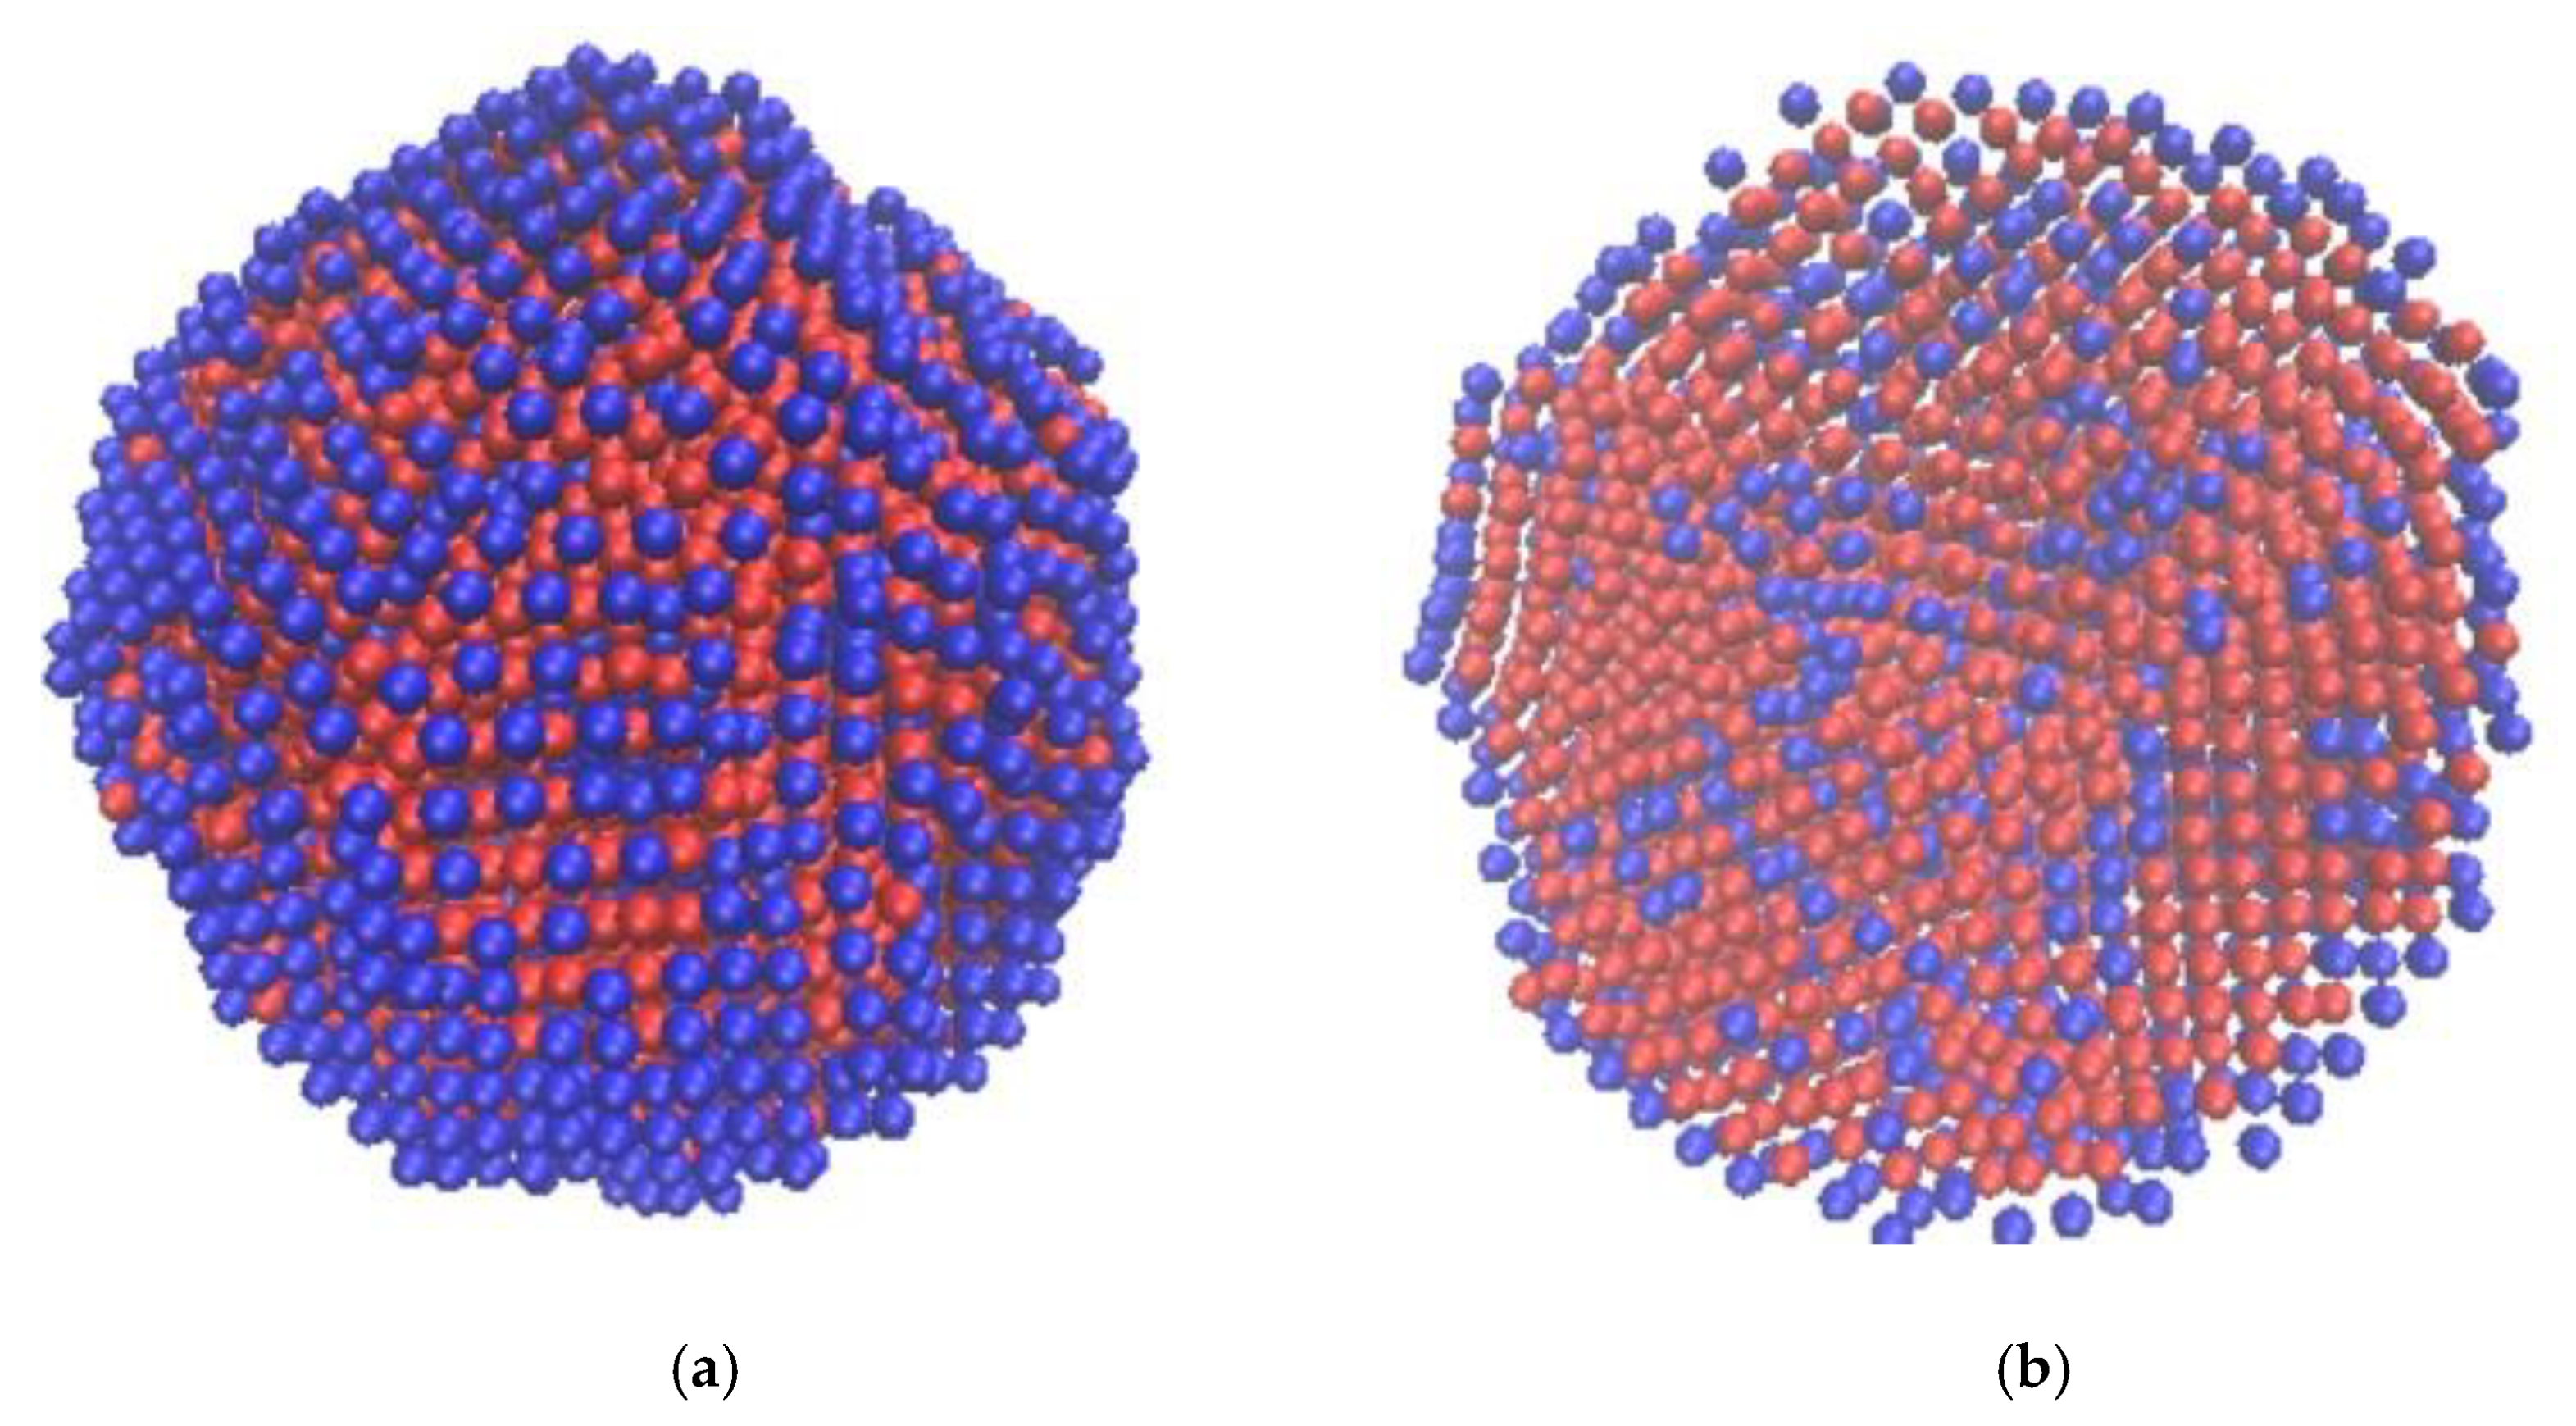
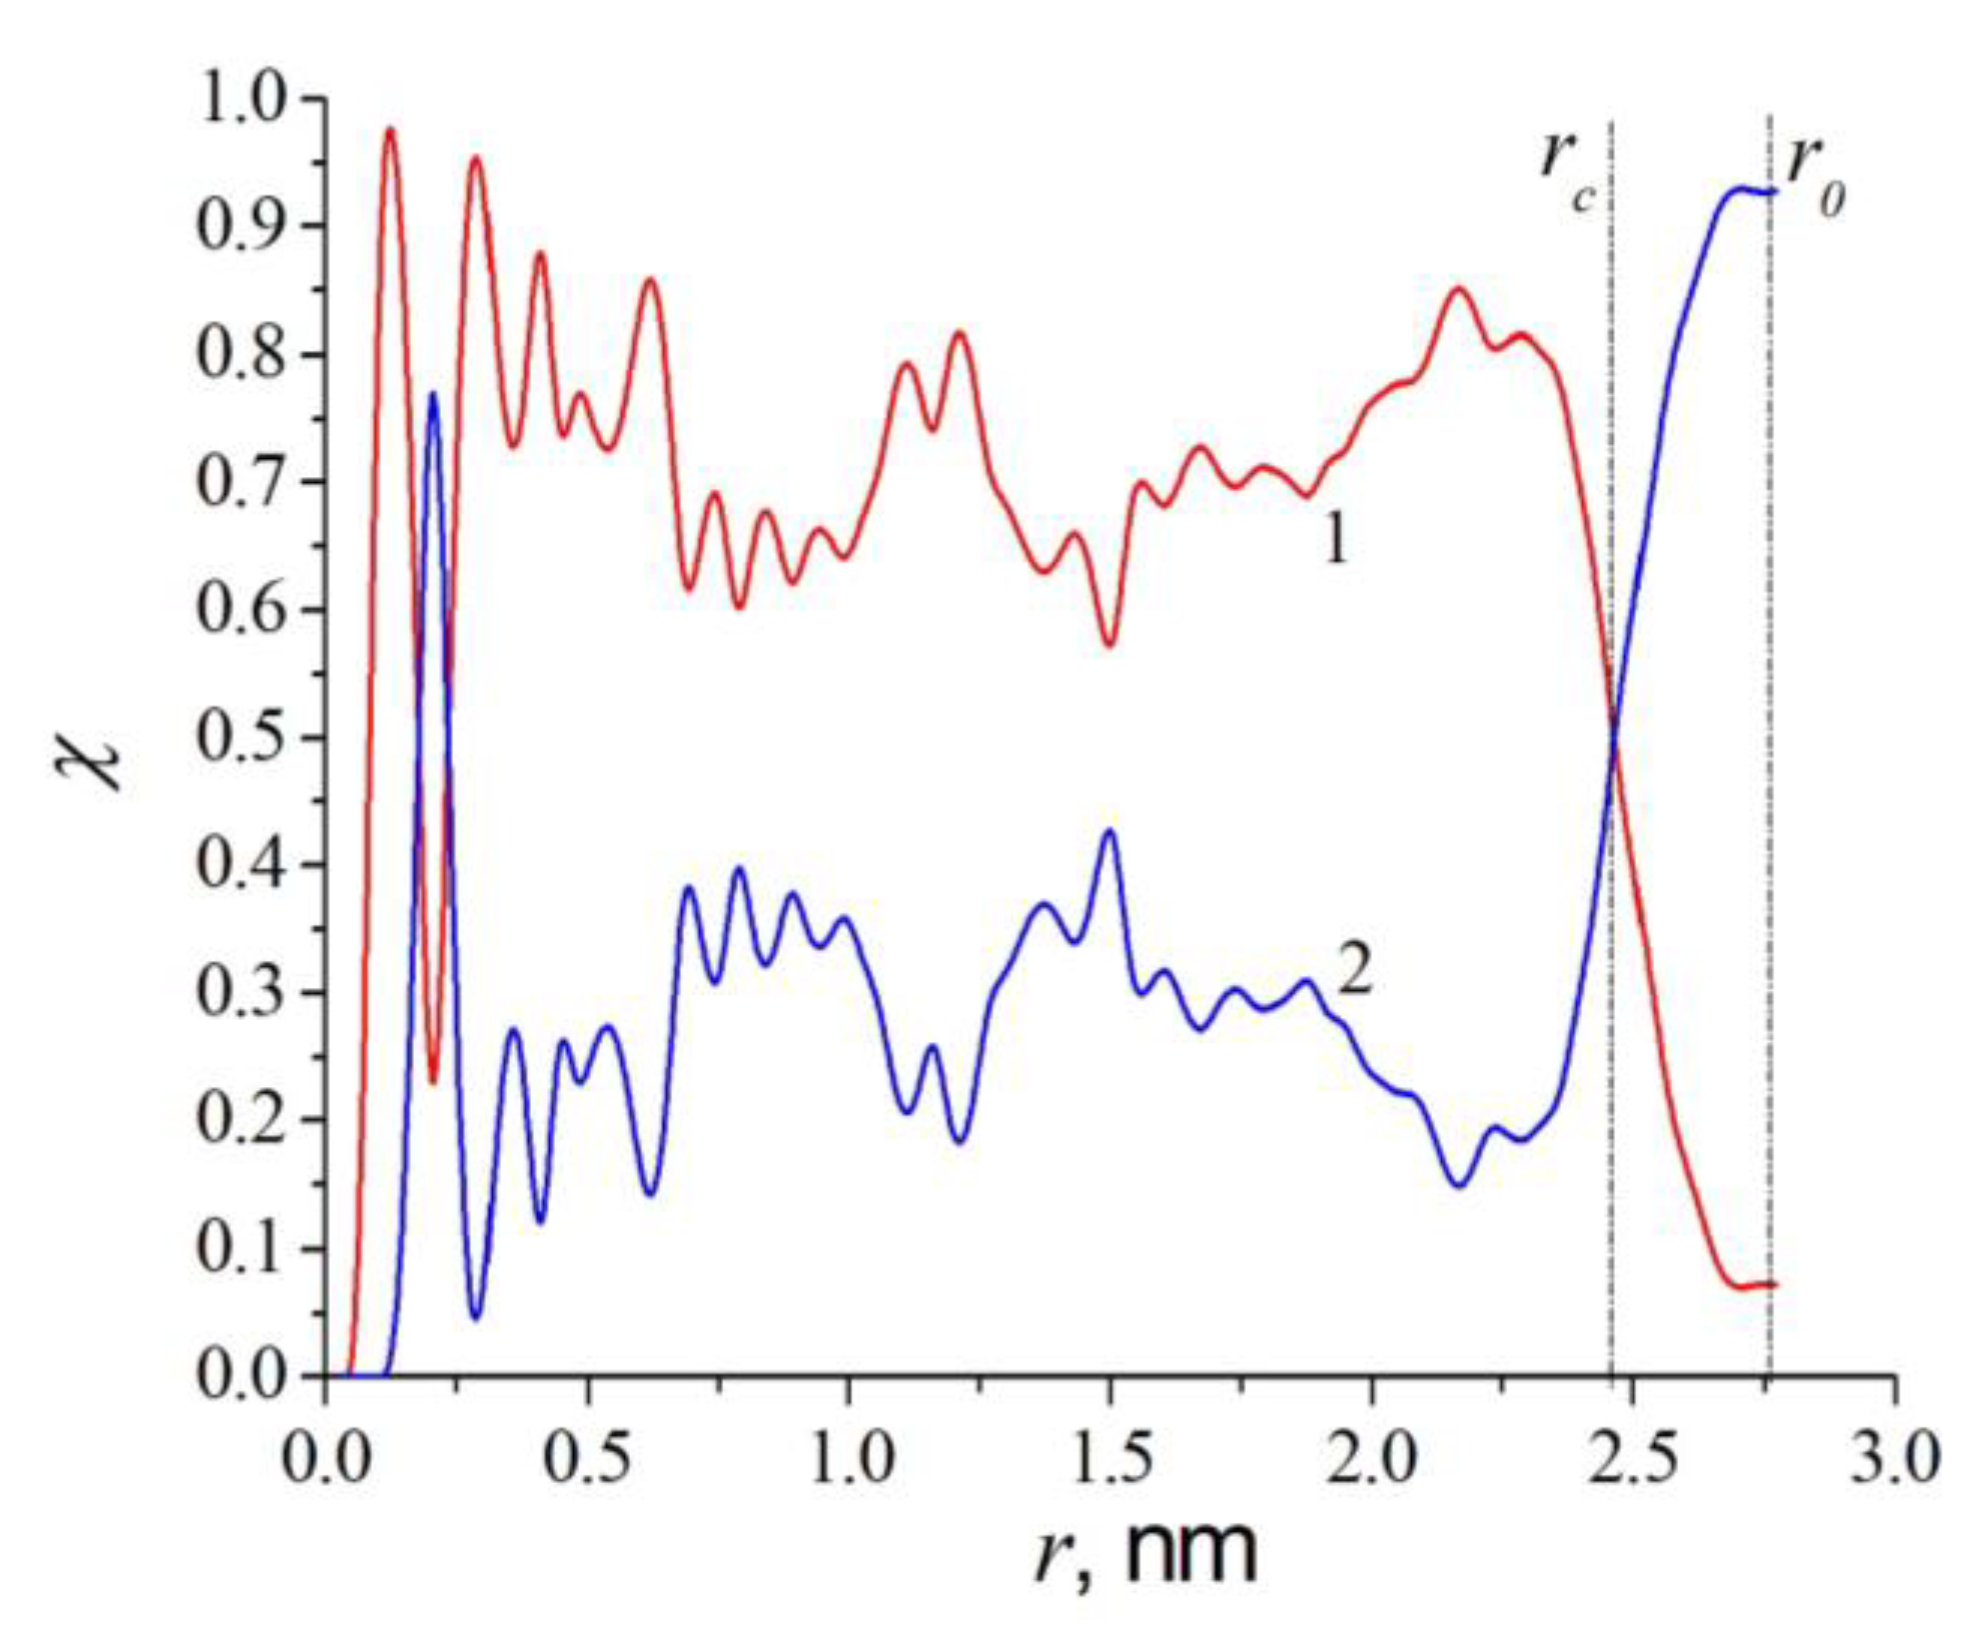
The results corresponding to the final MD configurations are presented in Figure 3 and Figure 4. These results were obtained using EAM parameterizations [58]. The figures clearly demonstrate the surface segregation of Pd in the final configurations of binary Pt–Pd NPs. The thickness of the surface outer layer, δ , can be chosen arbitrarily, for example, as the thickness of the surface monolayer or of a layer that depicts a noticeable surface segregation of one of the components. In our case, it is advisable to visually determine the spherical surface of radius r c = 2.4 nm as a geometric boundary between the particle core and its surface layer (shell). The thickness of the surface layer, δ , will be equal to r 0 r c 0.3 nm, which corresponds to the surface monolayer enriched with Pd atoms ( r 0 is the particle radius).
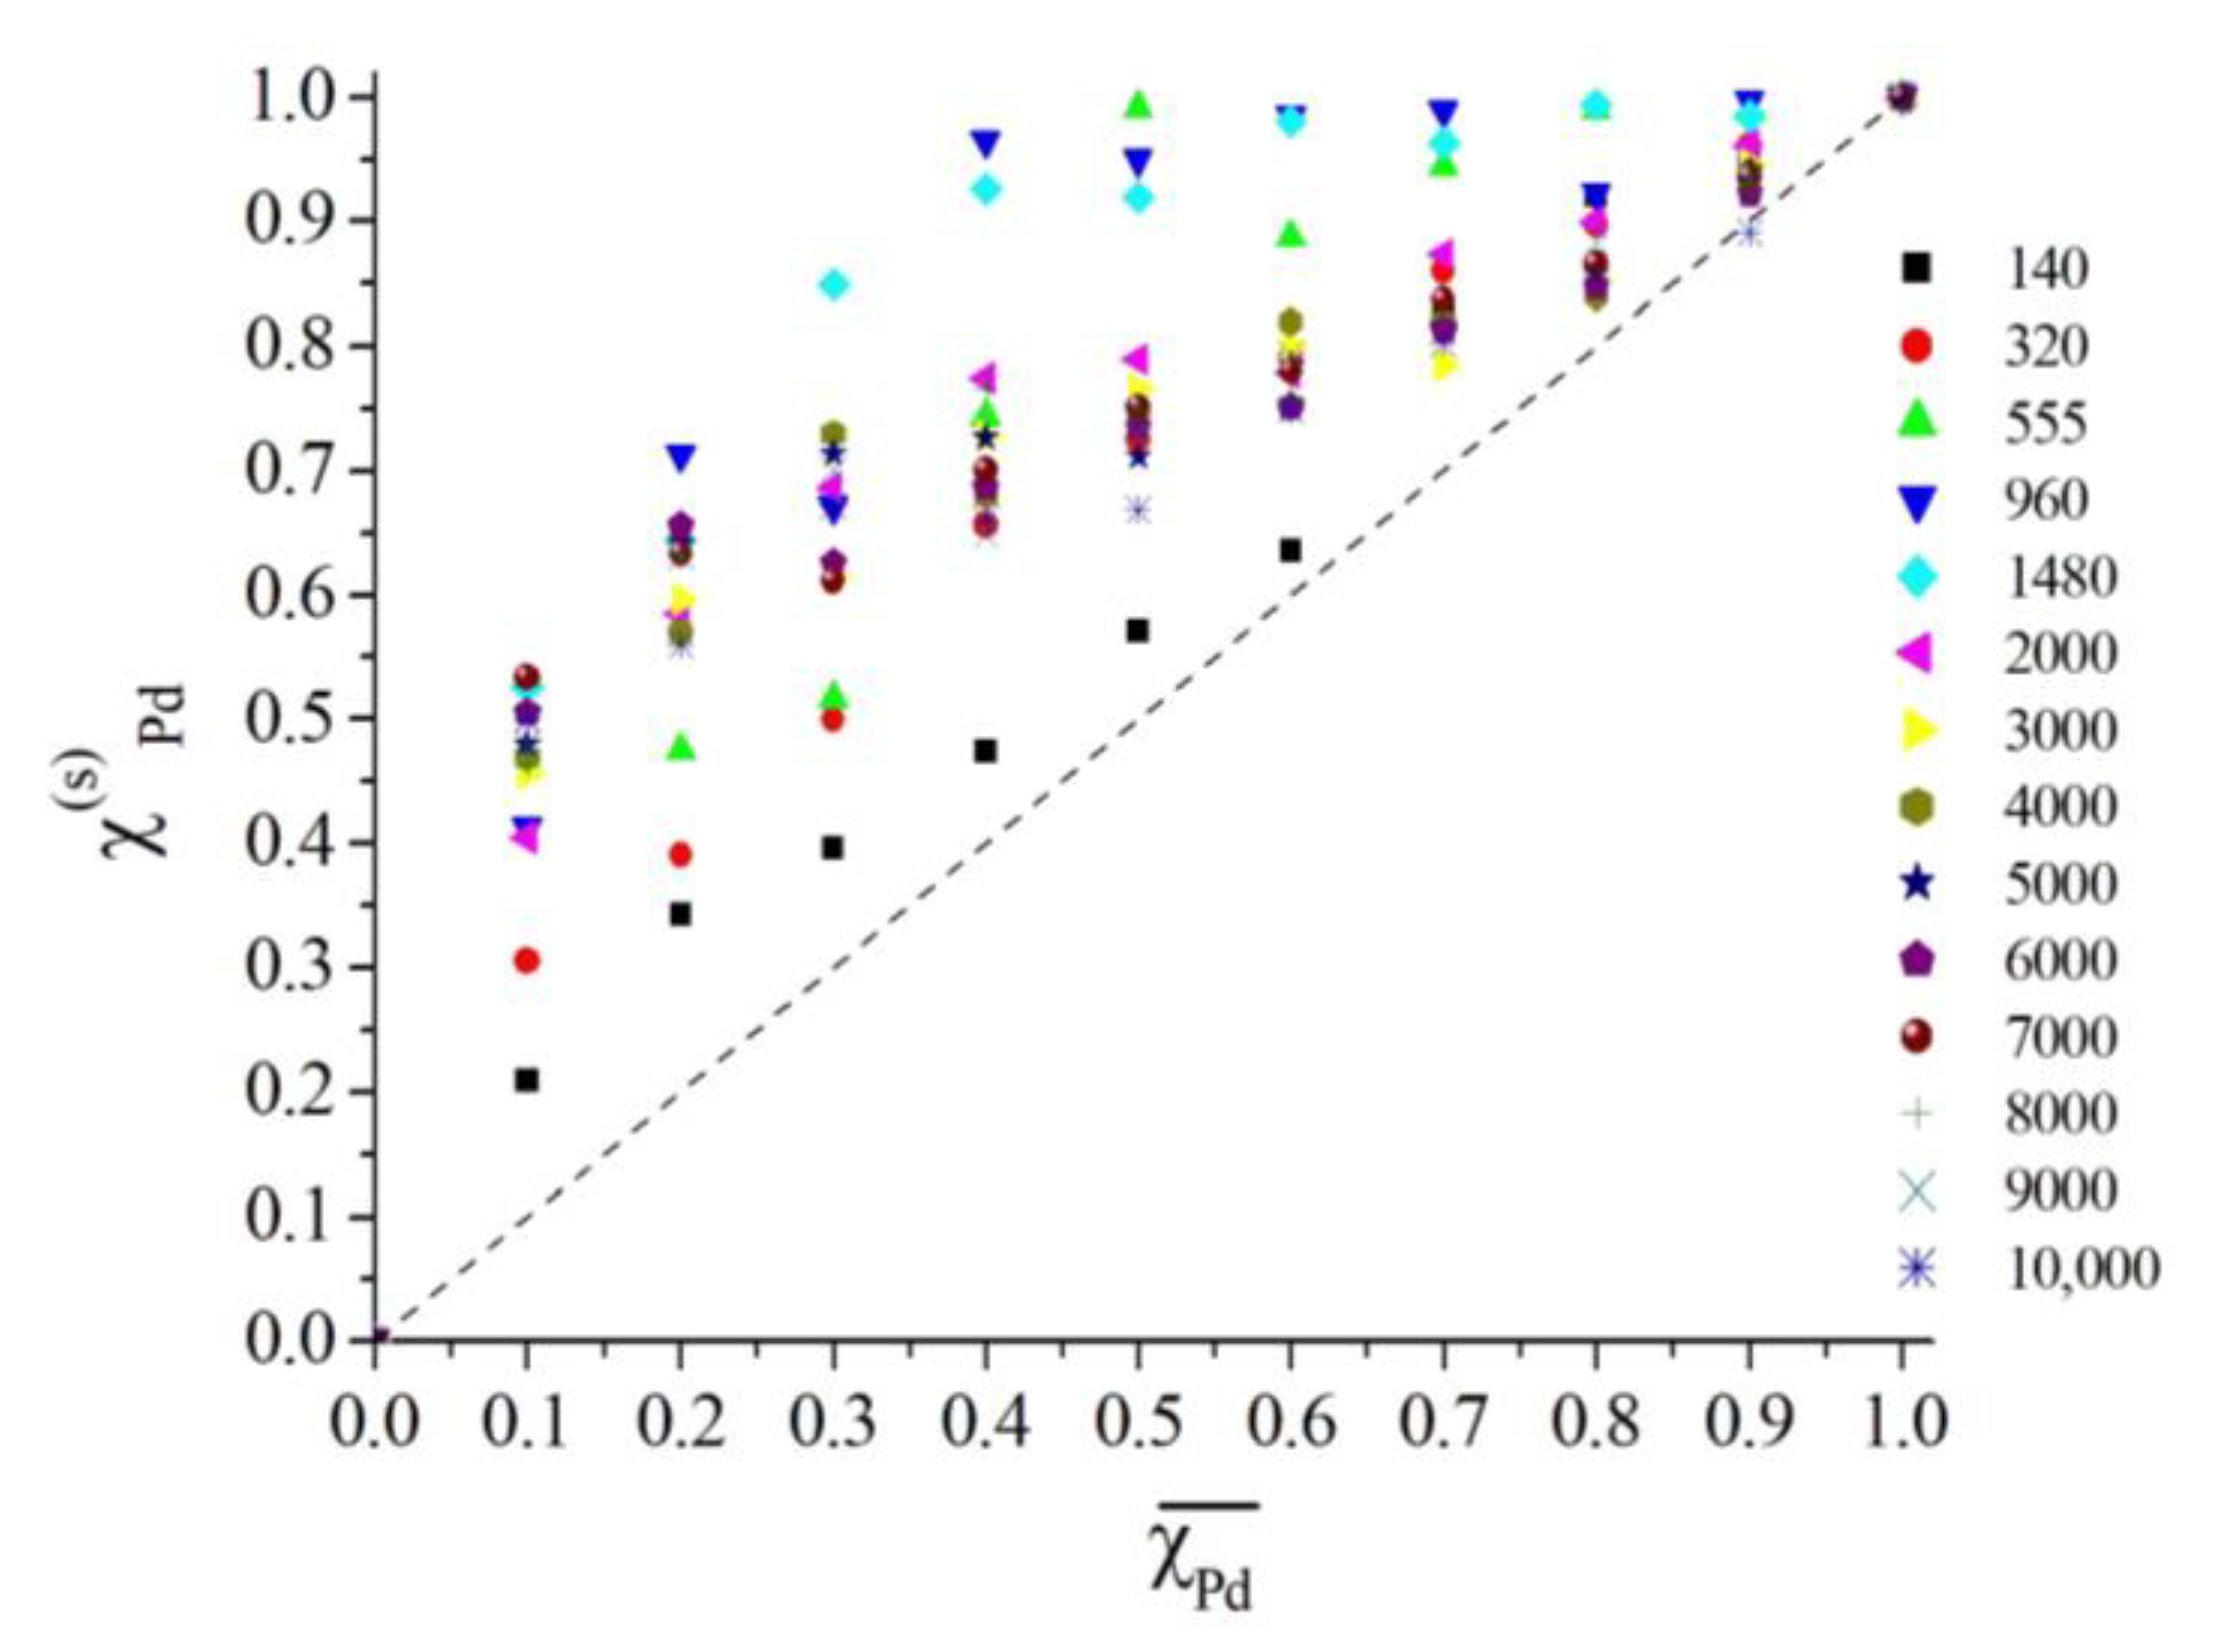
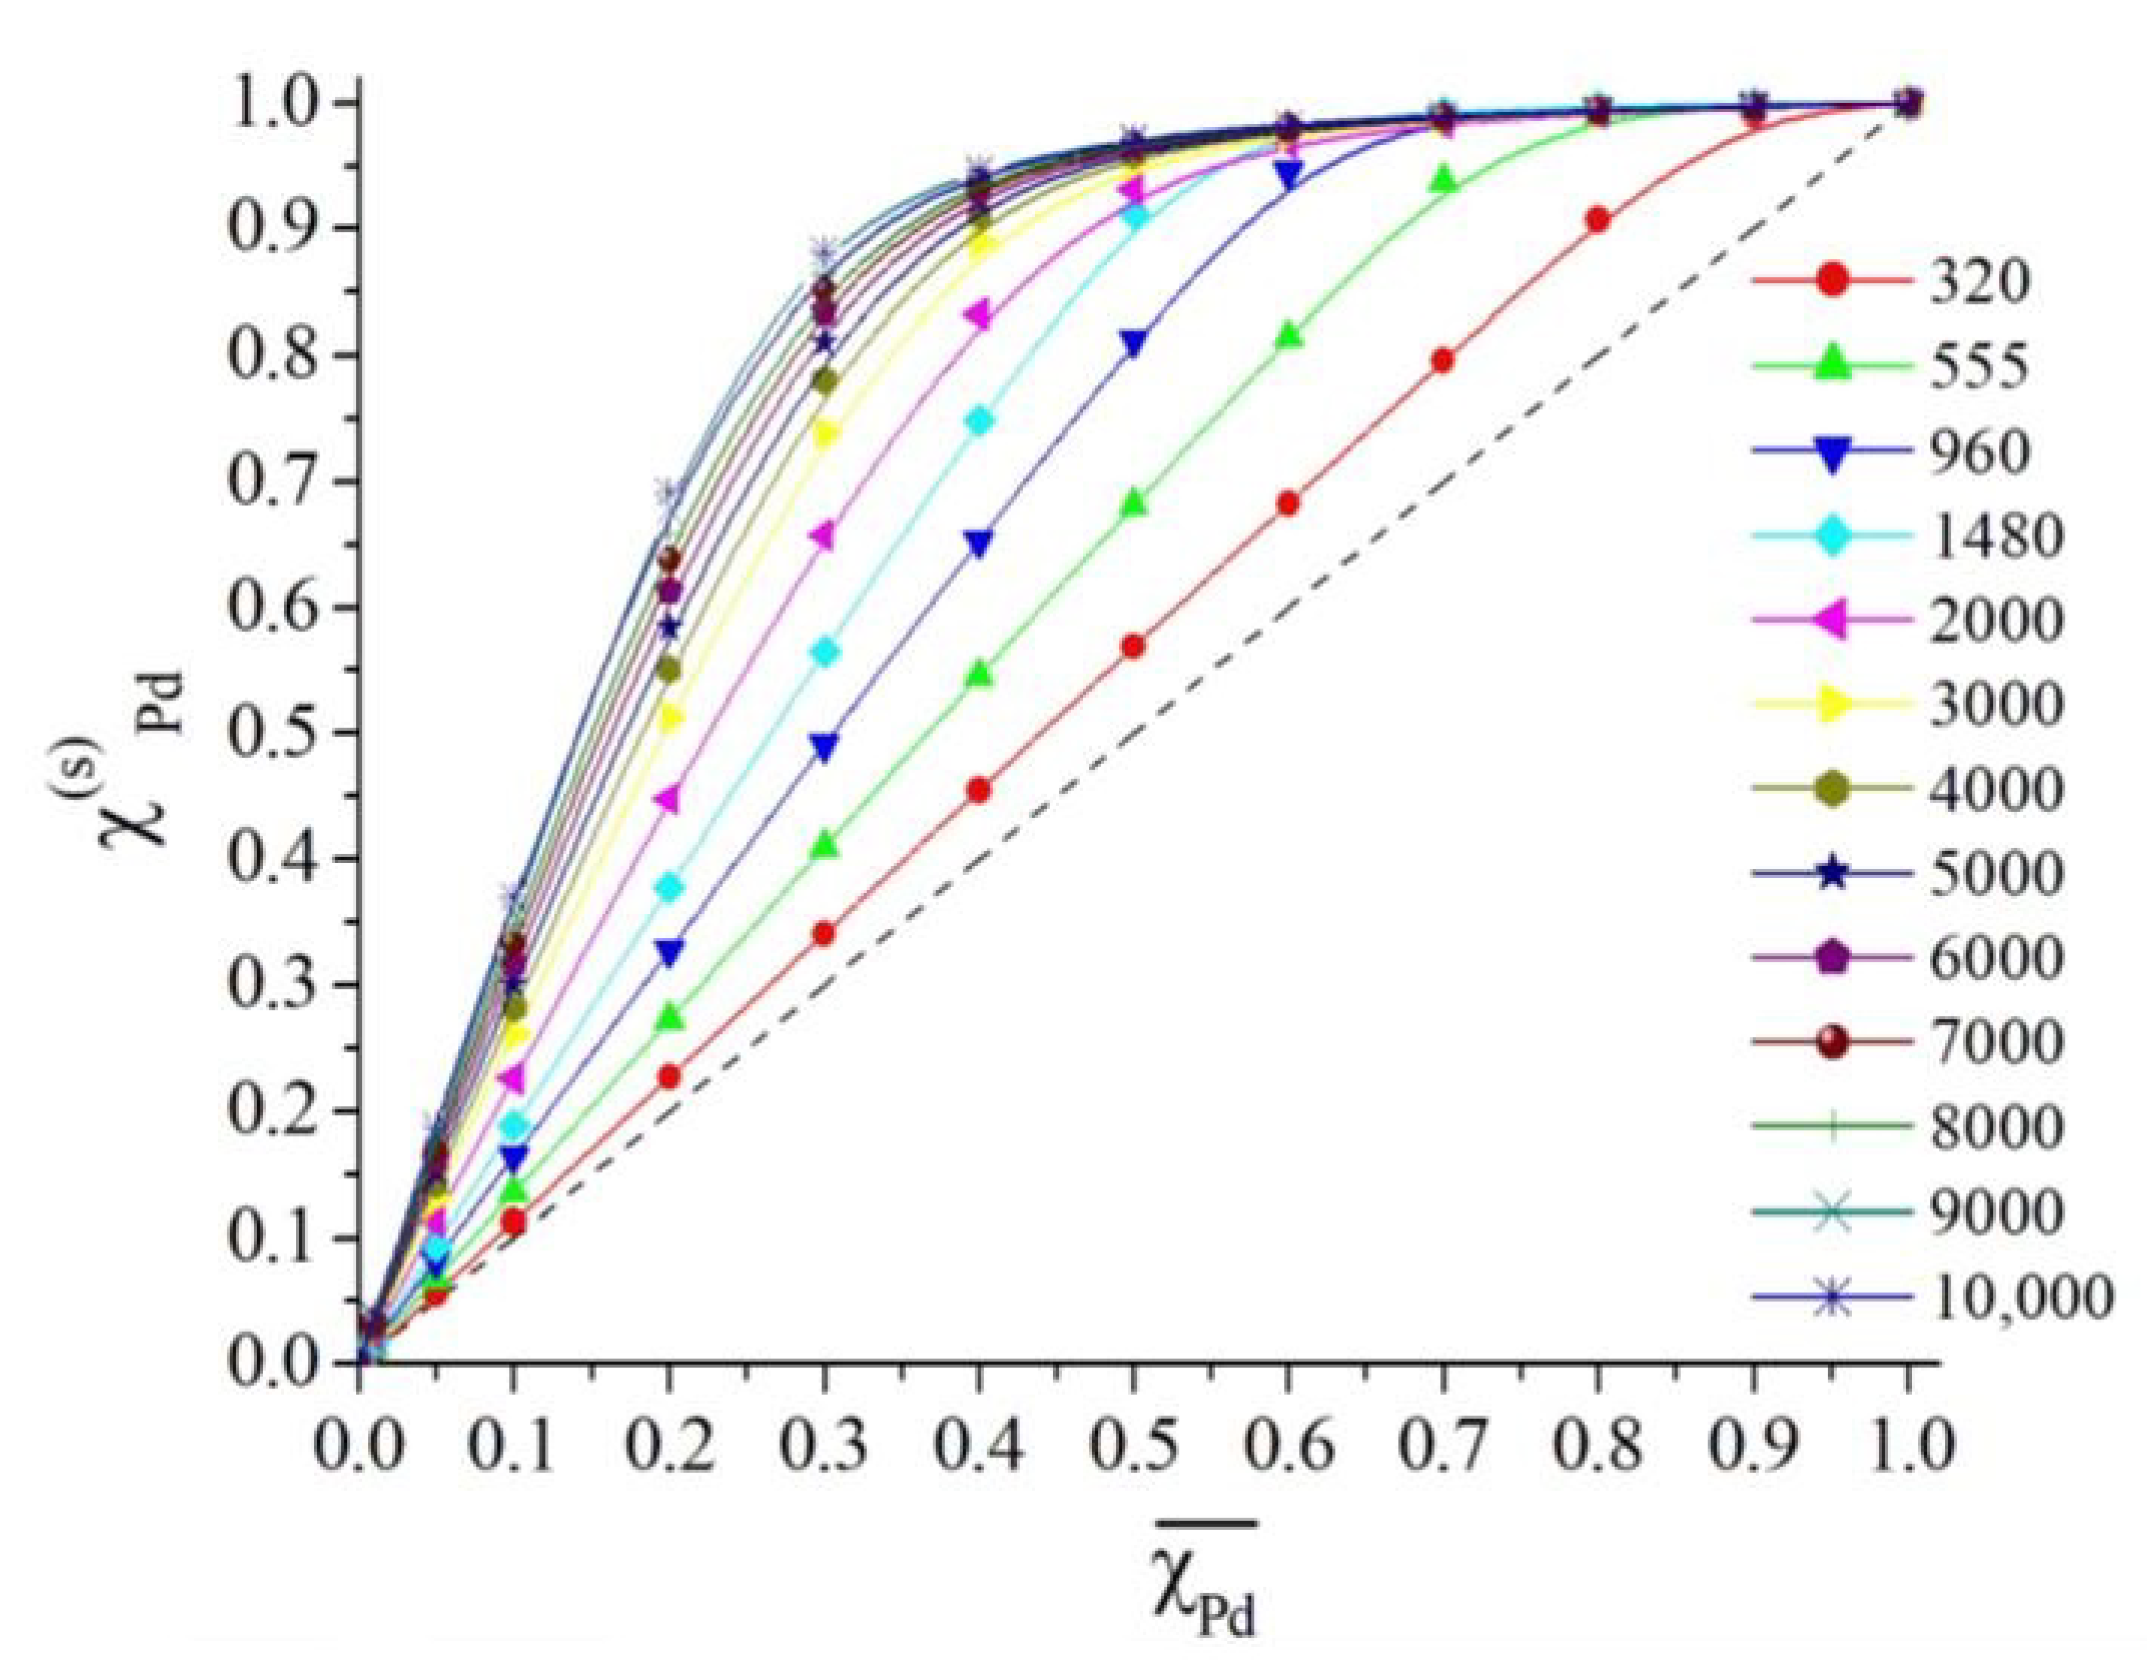
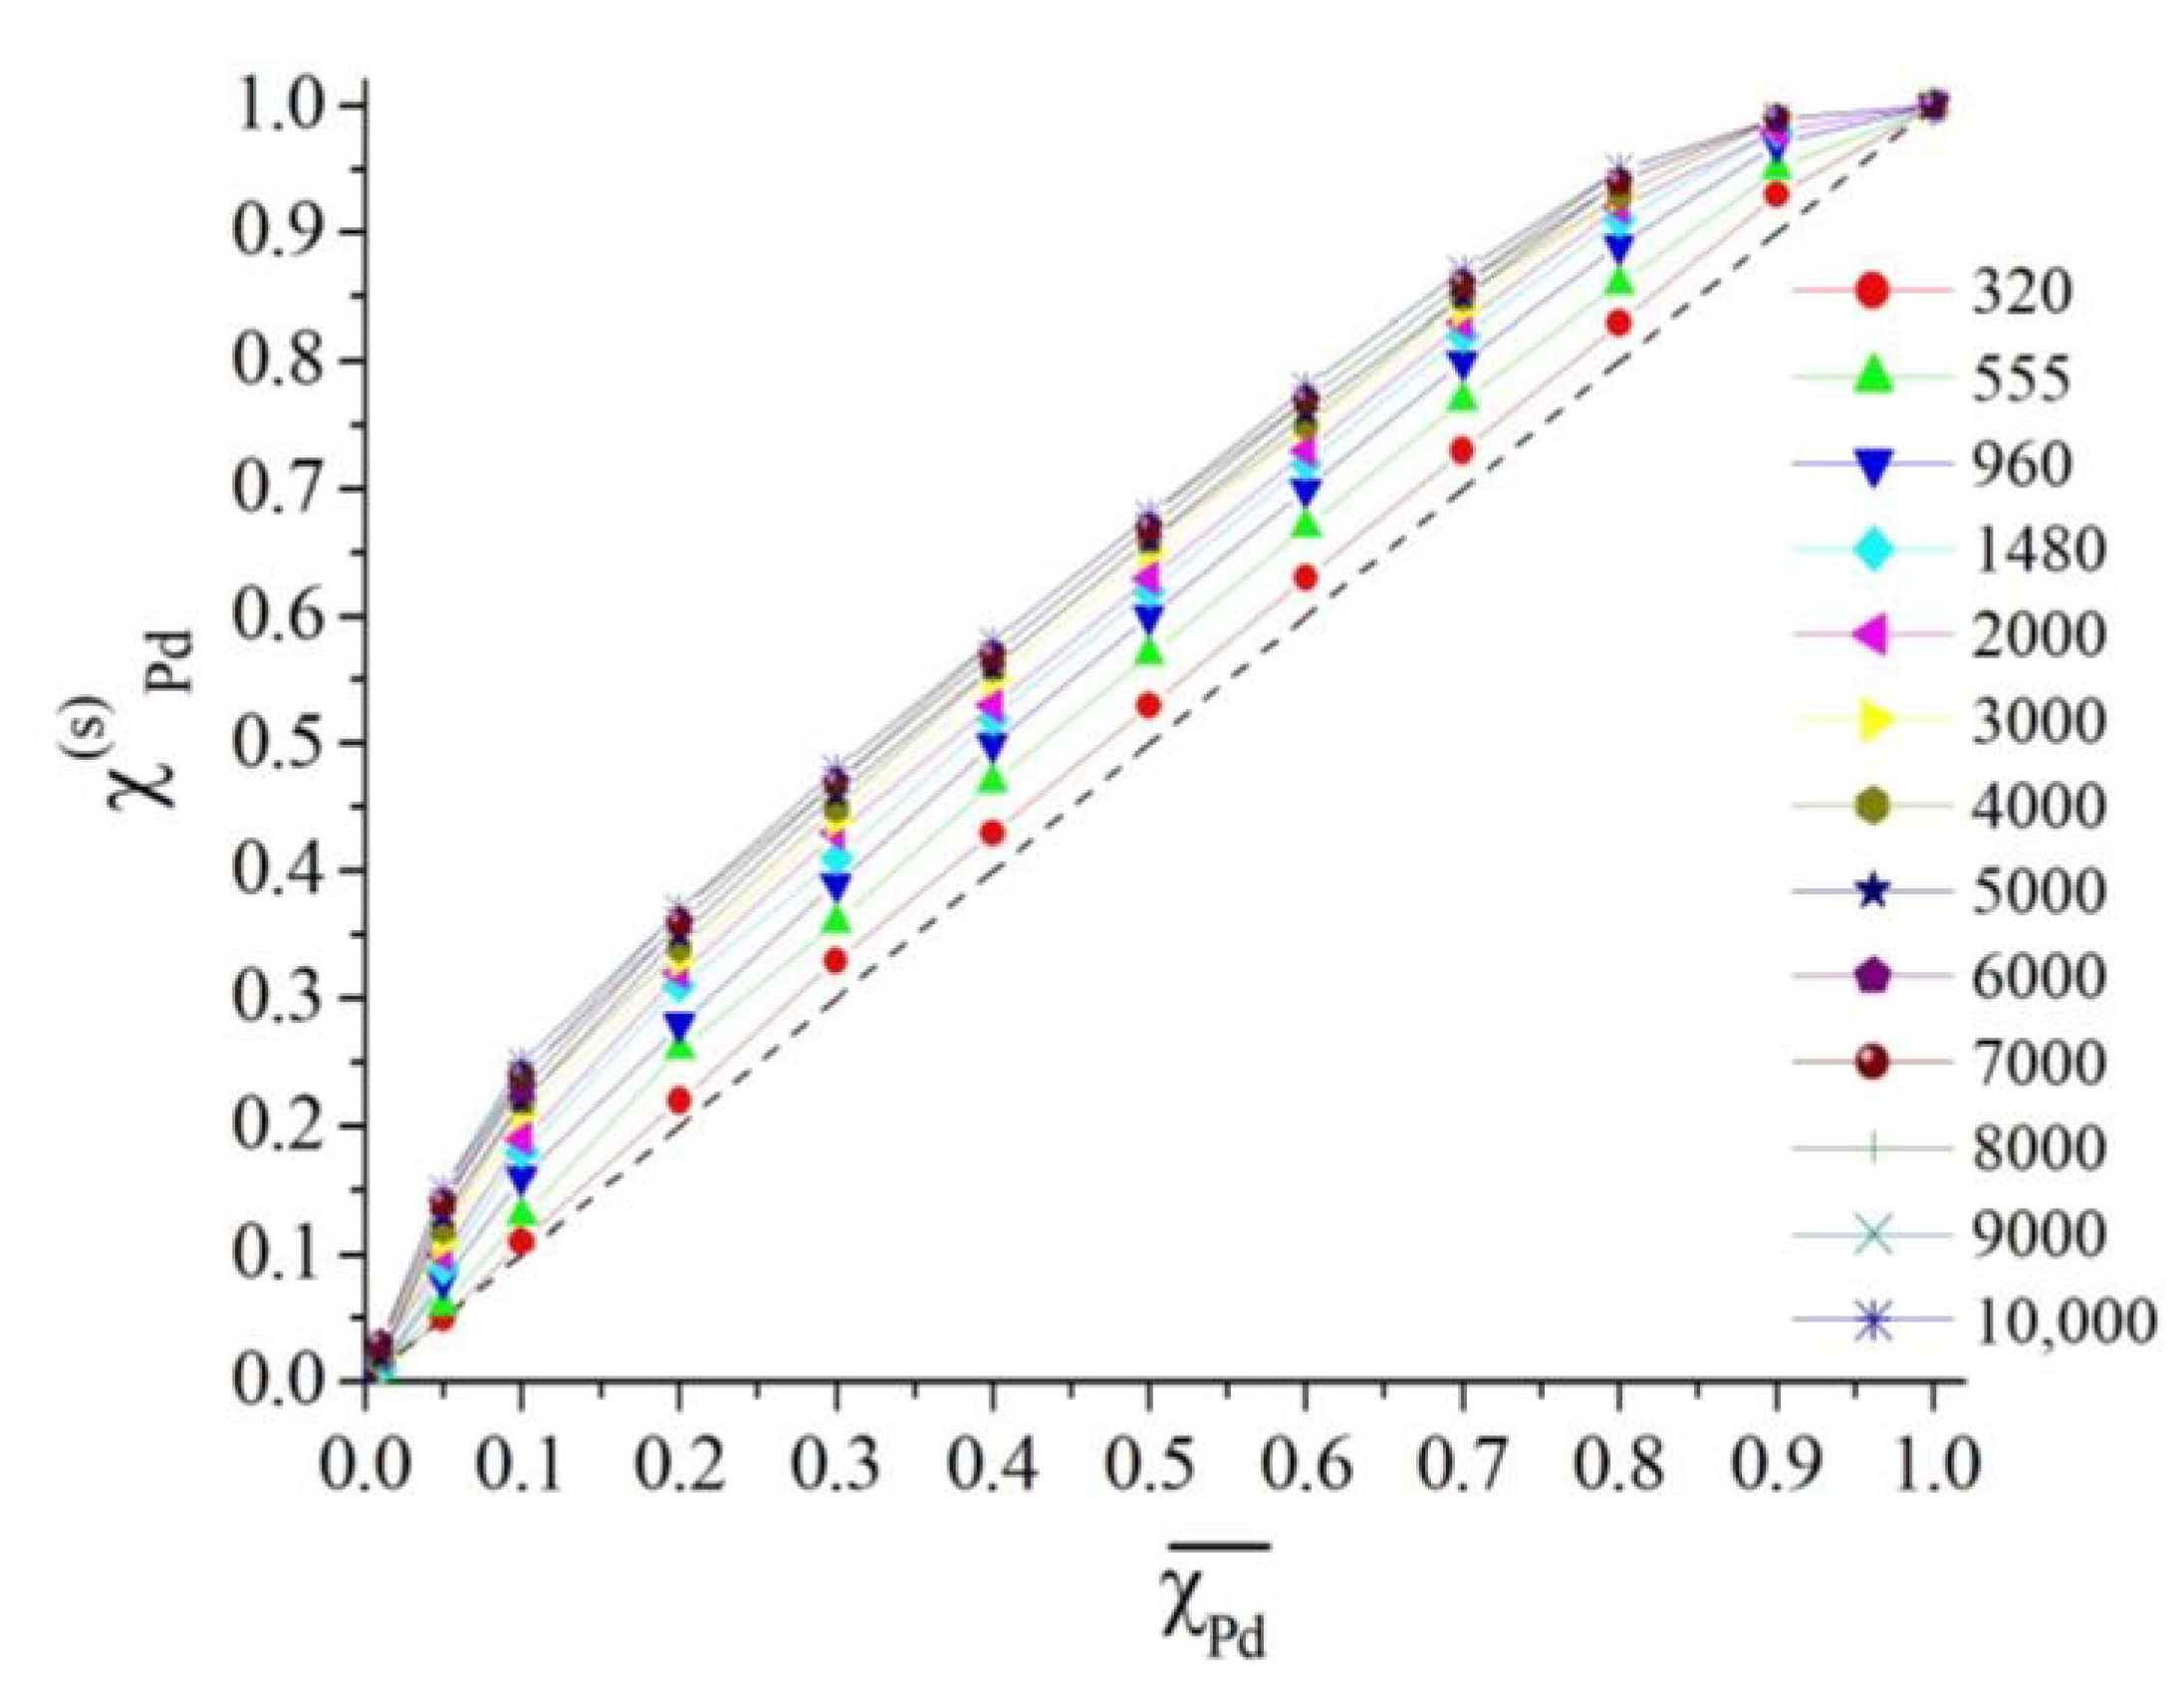
Usually, the main goal of experimental and theoretical studies of the surface segregation is evaluation of the molar fraction, χ B ( s ) , of the segregating component in the surface layer as a function of the primarily specified average molar fraction, χ B ¯ , of this component which characterizes the particle composition. For Pt–Pd NPs containing from 140 to 10,000 atoms (Figure 5 and Figure 6), our averaged MD results obtained using two alternative sets of the EAM parameterizations ([58] and ours, [49]) predict the surface segregation of Pd. The dashed straight lines in these figures correspond to the limiting case of no surface segregation. The inversion of segregation, i.e., a transition to the surface segregation of Pt, would correspond to some segments of the χ B ( s ) ( χ B ¯ ) dependences located below the dashed lines, but this was not obtained by us.
According to Figure 5 and Figure 6, surface segregation decreases with the particle size; this result agrees with our MD results obtained previously for other nanoalloys [69,70,71]. As one can see, both EAM parameterizations ([49,58]) predict practically the same results for the χ P d ( s ) ( χ P d ¯ ) dependences, except that our potentials predicted a slightly higher surface segregation of Pd. Thus, inadequately higher melting temperature of Pd (in comparison with Pt) predicted by parameterizations [58] for Pt and Pd potentials does not noticeably affect the surface segregation in binary Pt–Pd NPs. Our MD and thermodynamic results on the temperature dependence of the surface segregation in Pt–Pd NPs are presented in Section 4.

3. Thermodynamic Simulation

3.1. Approach to Thermodynamic Simulation

It is hardly possible to logically draw a definite line between the conventional thermodynamic calculations and the thermodynamic simulation. However, following our publications [70,71,72], we use the term “thermodynamic simulation” when an equation or a set of equations is solved by employing some sequential approximations or when exact values of some necessary input parameters are not known. In this study, we used a thermodynamic simulation method based on solving the Butler equation [48], derived in 1932. Much later, this equation was additionally justified and verified by Kaptay on liquid and solid alloys, including nanoalloys [73] and nanograined metals [74].
Following our papers [70,71,72], we arbitrarily divided a binary NP under consideration into a central area (core) and a surface layer (shell) surrounding the core. In particular, the outer surface monolayer can be considered as the NP shell. The goal of the thermodynamic simulation is to determine the equilibrium distributions of components in the NP core and shell. In our case, thermodynamic simulations may be performed by employing several thermodynamic models and approximations. In refs. [70,71,72], we decided to distinguish between two thermodynamic models—of the unlimited source for the segregating component and of the limited source—as well as between two sequential approximations—of the ideal solution (the partial excess Gibbs energies of mixing Δ G m , i of components are zero) and approximation, where relevant non-zero values of Δ G m , i are taken into account. The notation Δ G m , i corresponds to the partial molar excess Gibbs energy of mixing for component i . In the frames of our two-cell NP model, the particle core is treated as the source for the segregating atoms.
In accordance with the Butler equation:
σ i = σ j ,
the specific partial surface free energies, σ i , of all the particle components (including components i and j of a multicomponent system) should be equal to each other (see additional comments in [73,74] and in our papers [70,71,72]).
The specific partial surface free energy, σ i , of component i can be presented as the next function of the relative molar fraction χ i ( s ) / χ i ( c ) of this component:
σ i = σ i ( 0 ) ω i ( 0 ) ω i + R T ω i ln ( χ i ( s ) χ i ( c ) ) + Δ G m , i ( s ) Δ G m , i ( c ) ω i
where R is the molar gas constant, ω i is the partial molar surface of component i , i.e., the partial surface area in m2 mol−1, ω i ( 0 ) is the specific molar surface area for the pure component i , σ i ( 0 ) is the specific surface free energy of pure component i , and Δ G m , i ( c ) and Δ G m , i ( s ) are the partial molar excess Gibbs energies of component i in the particle core and the shell, respectively. Hereafter, superscript c and s are used to indicate the particle core and the surface shell, respectively. In the present paper, we have omitted the derivation of Equation (2) since a very detailed derivation of an analogue of this equation but for a nanograin surrounded by the grain boundary was given in [74]. In (2), the specific partial surface free energy, σ i , of component i features instead of the partial free energy of the component in the grain boundary. In addition, in (2), the partial molar excess Gibbs energies, Δ G m , i ( c ) and Δ G m , i ( s ) , of component i in the particle core and its surface shell are given instead of similar quantities for the grain and the grain boundary, respectively.
The main goal of the thermodynamic simulation of a binary A–B NP is to find the molar fractions, x B ( c ) and x B ( s ) , of component B in the NP core, x B ( c ) , and the NP shell, x B ( s ) , as some functions of the average molar fractions, χ B ¯ , of this component, which characterizes the NP composition. Algorithms of the thermodynamic simulation, including equations for x A ( c ) , x A ( s ) , x B ( c ) , and x B ( s ) , corresponding to different thermodynamic models and different approximations for the excess Gibbs energy, are presented in Appendix A.

3.2. Results of Thermodynamic Simulation

The results of our thermodynamic simulations of the surface segregation in binary Pt–Pd NPs of various sizes are shown in Figure 7. These results corresponding to T = 300 K were obtained when using the ideal solution approximation ( Δ G m , A ( s ) = Δ G m , A ( c ) = Δ G m , B ( s ) = Δ G m , B ( c ) = 0 ), i.e., when solving the system of Equations (A6) written for the case of the model of the limited source for the segregating component. In general, these results are consistent with the results of our atomistic simulations predicting the surface segregation of Pd, which decreases with the decreasing NP size. The values of the specific surface free energy, σ ( 0 ) , for Pt and Pd in the solid state (necessary when calculating the segregation coefficient (A4)) were taken from ref. [75].
Figure 8 demonstrates similar results, but were obtained when taking into account that the excess Gibbs energies were nonzero. Considering the excess Gibbs energies resulted in a significant decrease in the surface segregation (by 40% on average), but the surface segregation of Pd was not reversed into the surface segregation of Pt even at the smallest NP size.

4. Discussion

Our thermodynamic results obtained within the framework of thermostatics were related to equilibrium surface segregation, whereas MD simulations reproduce kinetics of segregation at the time scales available in the MD experiments. However, the results of the MD and thermodynamic simulations were consistent with each other and predicted the surface segregation of Pd in binary Pt–Pd NPs. As noted in the Introduction, the surface segregation of Pd was experimentally confirmed [50,51,52], but these experimental results related to Pt–Pd NPs of some certain compositions and sizes. Obviously, this is due to a number of difficulties associated with synthesis and following investigation of NPs in arbitrary wide ranges of their sizes and compositions. As a result, most of the available experimental data and theoretical results, as well as the results of atomistic and ab initio simulations, confirm the presence of Pd in the surface layers of Pt–Pd NPs, albeit only qualitatively. For example, the authors of [76] found that there was a high number of Pd atoms on the surface of synthesized Pt–Pd NPs. Then, the MD and DFT results [77,78] show that Pt atoms are predominantly localized in the Pt–Pd NP core, whereas Pd atoms on the NP surface. Two other interesting indirect confirmations, [79,80], may also be noted. The authors of [79] experimentally found that the sintering of Pt and Pd NPs results in the formation of Pt–Pd NPs with Pt-rich cores and Pd-rich shells. According to [80], synthesized Pd@Pt dendrimer-encapsulated NPs invert into ones with Pt-rich cores, and “primarily Pd in the shells”. We believe that, in both cases, the effect of Pd enrichment in the surface layers of synthesized NPs reflects a trend to the spontaneous surface segregation of Pd.
Usually, surface segregation in binary alloys [81], including Pt–Pd alloys, is interpreted as a result of a great positive value of the heat of segregation Q. According to [81], for Pd atoms on the surface of the bulk Pt–Pd alloy Q = +27.7 kJ/mol. In our case, Q is the work necessary to exchange a surface Pd atom and a core Pt atom. Our thermodynamic simulation approach (Section 3) does not involve the heat of segregation; the surface segregation of Pd follows, first of all, from a lower (in comparison with Pt) value of the specific surface free energy σ ( 0 ) of Pd: the difference ( σ Pt ( 0 ) σ Pd ( 0 ) ) between these quantities affects the segregation coefficient (A4). The depletion effect [19], i.e., the effect of the limited source for the segregating component and the effect of the non-zero excess Gibbs energy of mixing Δ G m , result in noticeable diminishing of χ P d ( s ) . However, in our atomistic and thermodynamic simulations, the surface segregation of Pd was never inverted into the surface segregation of Pt.
As for theoretical predictions of segregation in binary Pt–Pd NPs, papers [53,82] are of special interest: the authors discussed a number of important and interesting aspects of predicting the properties of Pt–Pd bimetallic nanocatalysts and processes in binary metallic NPs, including the surface segregation of one of the components. In particular, in ref. [82], the next two segregation rules were formulated, which are partially alternative to the segregation factors [19] listed in the Introduction:
(i)
If the bulk melting temperature of component A is larger than that of component B, then element A will segregate to the surface;
(ii)
If the bulk melting temperatures of both components have more or less the same magnitude, then the segregated element will be determined by a lower surface energy.
In [53], the authors additionally noted that the first rule should be used if the melting temperatures of components differ by more than 10%. For the Pt–Pd pair, this criterion is equal to 11–12%, depending on the choice of metal in the denominator of the percentage. However, the authors of paper [53] decided that for the Pt–Pd alloy, the second rule should be employed, although such a choice contradicts their above criterion. It is also worth mentioning that the second rule [53,82] coincides with our conclusion drawn in [70,71] about the ( σ A ( 0 ) σ B ( 0 ) ) difference as the main factor affecting surface segregation in binary A–B nanoalloys.
In [53], an intriguing but highly controversial (as we believe) conclusion was also drawn: at a certain characteristic value, α , of the NP diameter, d , an inversion should take place of the surface segregation. In other words, according to [53], at d < α , Pt atoms should segregate to the surface of Pt–Pd NPs instead of Pd NPs. In [53], parameter α was referred to as the form factor, since its value depends on the NP shape. The very conclusion about the existence of such a critical NP size was made on the basis of the next relationship:
Q = Q ( ) ( 1 α / d )
where Q is the heat (energy) of the segregation of Pd in NPs of diameter d , and Q ( ) is the heat of segregation for the surface of the corresponding bulk alloy. According to (3), Q > 0 for d > α and Q < 0 for d < α . Thus, the negative sign of parameter Q was interpreted in [53] as the reason of inversion in surface segregation.
In turn, Equation (3) was written in [53] as a consequence of the Thomson formula for the size dependence of the melting temperature, T m , of NPs. Derivation of the Thomson formula is discussed in our paper [83]. A more general Thomson-type equation can be written as follows [84,85]:
T m / T m ( ) = 1 α / d .
Equation (3) was written in [53] by assuming that:
  Q / Q ( ) = T m / T m ( ) .
However, for d < α , Equation (4) predicts negative values for the melting point of NPs, which is physically inadequate. Thus, in [53], the conclusion about the inversion of the surface segregation in binary Pt–Pd NPs was based on the erroneous assumption (5).
In ref. [54], another scenario of surface segregation inversion in binary Pt–Pd NPs was predicted from the results of the MD simulations. The authors of [54] used not EAM, but the Sutton–Chen potential [57]. According to [54], at T = 353.15 K, there was practically no segregation in NPs with a size of 2 nm ( χ P d ( c ) = χ P d ( s ) = χ P d ¯ ). However, at χ P d ¯ < 0.65, Pt atoms segregated to the surface of Pt–Pd NPs of 4 nm in size. Neither our results nor the available experimental data confirmed either of the two abovementioned scenarios of the inversion of segregation in binary Pt–Pd NPs.
At the same time, we have no reason to completely deny the possibility of the surface segregation inversion in binary metallic NPs. At least in principle, one should admit that some segregation effects cannot be predicted by only employing atomistic and thermodynamic simulations. Maybe, some specific effects can be predicted by ab initio calculations or discovered experimentally. From this methodological point of view, paper [86] is of interest where ab initio simulation results predicted that small additives of carbon can switch the surface segregation of Cu into the surface segregation of Ni in some Cu-Ni slabs. However, in [86] the third component was put into play.
The problem of the size dependence of the surface segregation in binary nanoalloys is also no less controversial than the problem of the surface segregation inversion. Presumably, there are no experimental data on this topic on the Pt–Pd nanosystem. However, for binary NPs of other fcc metals, e.g., for Au–Pt nanoalloys, the results of atomistic Monte Carlo simulation [43] predict a decrease in the surface segregation with the NP size.
The authors of paper [53] theoretically predicted an opposite effect, i.e., the effect of the surface segregation increasing with the decreasing NP size (see Figure 7 in [53]). However, this conclusion is inconsistent with the following known Langmuir–McLean-type relation [81]:
χ ( s ) 1 χ ( s ) = χ 1 χ e ( Q / R T )
from which the authors of [53] proceeded by quite reasonably replacing χ in Formula (6), proposed for the surface of the bulk alloy, by χ ( c ) :
χ ( s ) 1 χ ( s ) = χ ( c ) 1 χ ( c ) e Q *
Here, Q * = Q / R T is the reduced heat of segregation. If, following [53], Formula (3) is also involved, then the heat of segregation Q and, consequently, the surface segregation itself will decrease with the particle size; at d   α , χ ( s ) will tend to χ ( c ) , i.e., the segregation effect will completely disappear.
Our MD results and the results of our thermodynamic simulations based on the discussed solutions of the Butler equation demonstrate a gradual decrease in the surface segregation with the particle size. However, the results of atomistic simulations (Figure 5 and Figure 6) are less unambiguous: they show only a tendency towards a decrease in segregation with the particle size. Indeed, according to these figures, the minimum value of χ P d ( s ) also corresponds to the minimum NP size, i.e., to NPs containing 140 atoms. However, the maximum values of χ P d ( s ) corresponded to N = 960 and N = 1480, while for the largest binary Pt–Pd NPs (containing 10,000 atoms), some intermediate values of χ P d ( s ) were found.
Obviously, such a partial disagreement of our MD results with the results of the thermodynamic simulations can be explained by the fact that, despite the MD experiments combining successive stages of melting, cooling (quenching), and annealing, the final state of the largest NPs is not completely in equilibrium. This explanation is consistent with a conclusion made in paper [87] devoted to MD simulations of the sintering of small Au nanoclusters beginning with NPs containing only 147 atoms. Preliminarily, NPs (used as initial configurations in the subsequent simulation of sintering) were relaxed (annealed) for approximately 1 μs at temperatures of 400 and 500 K. The results of the relaxation of various structural isomers are interesting and, in our opinion, unexpected: at T = 500 K, the same final equilibrium state of NPs was achieved. However, at T = 400 K, even a long MD experimental annealing time was not sufficient to reach completely equilibrium states.
In accordance with both thermodynamic simulation algorithms (based on the Butler and Langmuir–McLean equations), the main reason for the decrease in the surface segregation with the NP size is the depletion effect [19]. When the size of a binary NP decreases, the stock of the segregating component in its core is depleted. The unlimited source for the segregating component model becomes more and more inadequate. Thus, the depletion effect should be taken into account in any version of the thermodynamic simulation by the second equation of system (A6), i.e., by the mass balance equation for the segregating component.
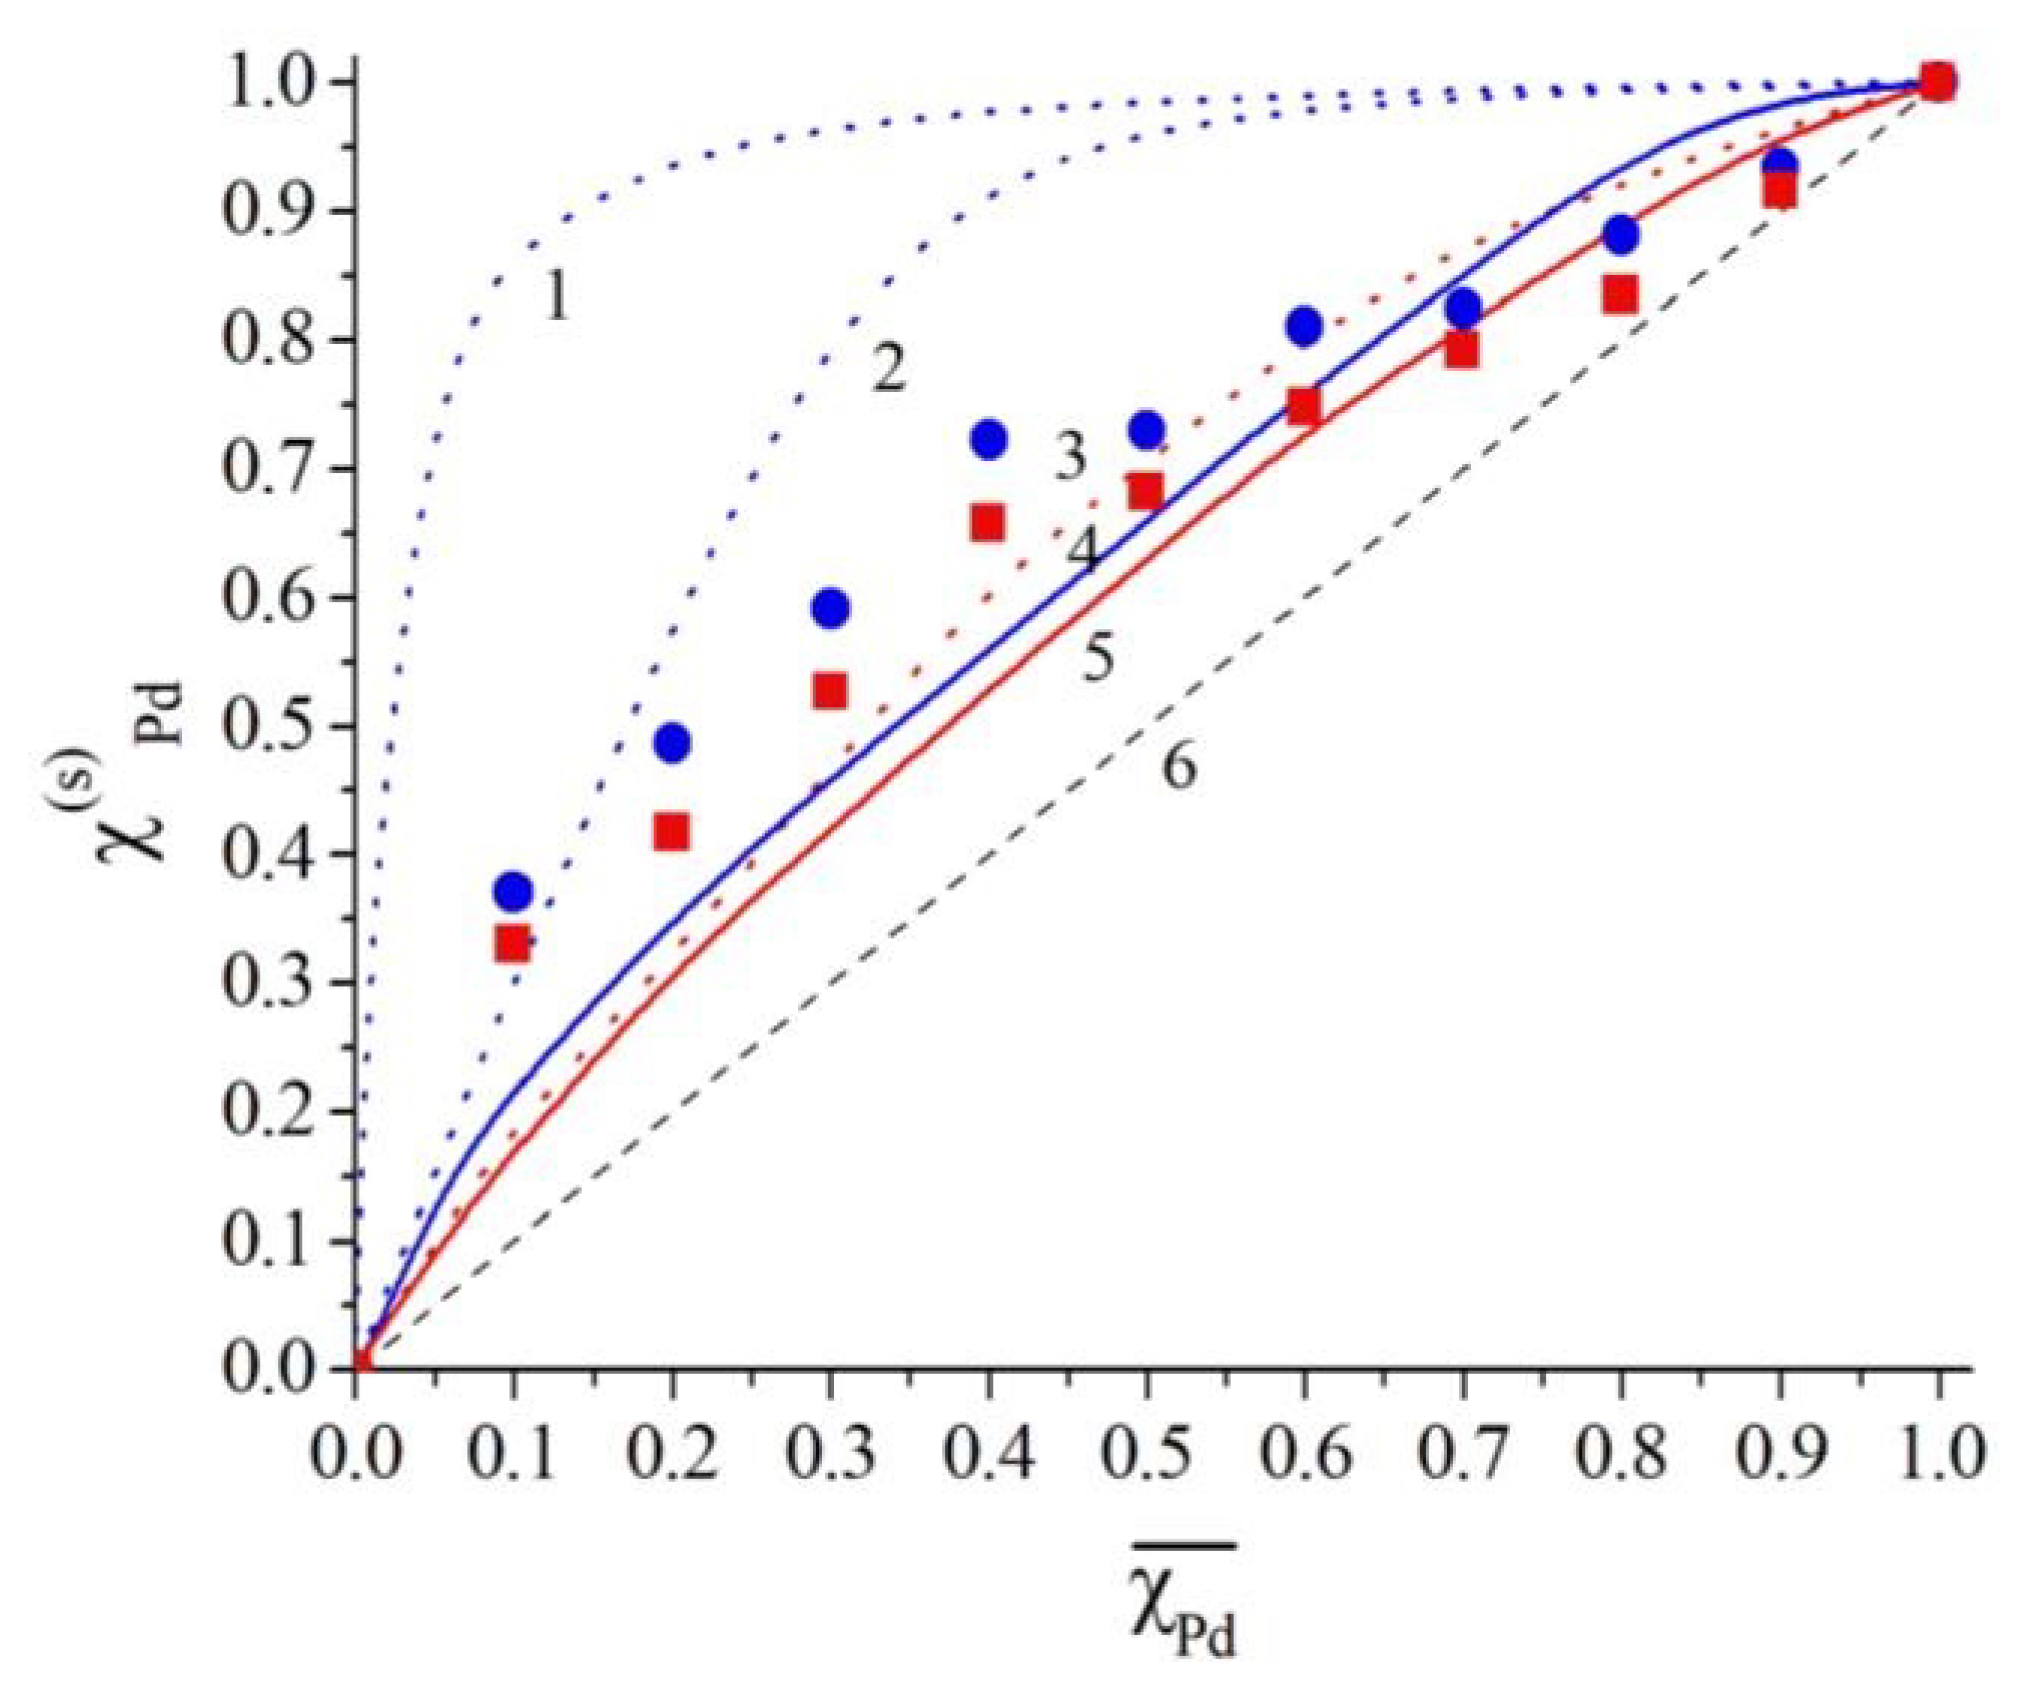
Section 2 and Section 3 present the results related to a sufficiently wide range of the Pt–Pd NP sizes (1.6–6.5 nm), but to the same temperature of 300 K, which is low for metallic NPs. Figure 9 demonstrates the results of our atomistic and thermodynamic simulations for Pt–Pd NPs of the same size ( d = 5 nm, N = 5000), but annealed at two different temperatures: 300 and 1000 K. The results shown in Figure 9 were obtained using our EAM parameterizations [49] (the results obtained using parameterizations [58] did not noticeably differ from those presented in Figure 9). One can see that the MD results are in good agreement with our most precise results of the thermodynamic simulation corresponding to the most adequate model of the limited source for the segregating component and to approximation, taking into account the excess Gibbs energy of mixing. Figure 9 shows that both alternative simulation approaches (atomistic and thermodynamic) predict a decrease in the surface segregation of Pd with increasing temperature.
Our conclusion about decreasing the surface segregation in binary NPs with increasing temperature is consistent with the available experimental data and theoretical predictions, although just for Pt–Pd NPs there are no experimental data or atomistic simulation results from other authors. Theoretically, for a thin layer of a binary alloy, the effect of a decrease in the surface segregation with a decreasing layer thickness and increasing temperature was predicted in [88]. In addition, for the bulk binary alloys and binary metallic NPs, there are some experimental data and theoretical estimations confirming the effect of decreasing equilibrium surface segregation with increasing temperature. For example, a decrease in the segregation of Cu on the surface of the bulk Cu–Ni alloy was experimentally observed in [89], and on the surface of a thin Cu–Ni film in [90]. According to [43], the atomistic Monte Carlo simulation of binary Au–Pt NPs also revealed (at T > 800 K), diminishing the surface segregation with increasing temperature.
In the frames of our approach to the thermodynamic simulation, the conclusion regarding the decrease in surface segregation with increasing temperature is quite obvious and unambiguous. Indeed, the segregation coefficient (A4) decreases with increasing temperature. At T , the segregation coefficient tends to unity, and χ B ( s ) tends to χ B ¯ .

5. Conclusions

In accordance with our results presented in this paper, two different approaches based on MD and thermodynamic simulations predict the surface segregation of Pd in Pt–Pd NPs of all selected sizes and compositions. Both methods predict a decrease in the equilibrium surface segregation with the NP size. At the same time, we did not observe any inversion of the surface segregation at a small characteristic value of the NP diameter. We also found that the surface segregation decreased with increasing temperature. Employing two EAM parameterizations [49,58], we established that the ratio between the binding energies (which is the same for parameterizations [49,58]) is a much more significant factor than the ratio between the melting temperatures of components. In turn, the ratio between the binding energies should qualitatively be the same as between the surface energies of components.
Exemplifying on Pt–Pd NPs, we have confirmed a conclusion made previously, that the difference between the surface energies (surface tensions) of components is the main factor leading to surface segregation [71]. This conclusion coincides with the second segregation rule formulated in [53,82]. At the same time, we believe that the first segregation rule [82], according to which the component with the higher melting point should segregate to the surface, is not obeyed. Obviously, the second rule [82] relates to the equilibrium surface segregation. However, if one of the components of a binary NP or of a bulk body has a lower surface energy but a higher melting temperature, the melting temperature will play the role of the main kinetic factor damping the thermodynamic trend to the surface segregation of this component. In ref. [72], we proposed to distinguish between the thermodynamic and kinetic stability of the core–shell bimetallic nanostructures, which correspond to the limiting case of the pronounced surface segregation. One cannot be entirely sure that the final state of solid NPs in MD experiments is completely in equilibrium. However, good agreement between our MD and thermodynamic results indicate that the approach used in our MD experiments, combining the preliminary melting, solidification, and subsequent annealing of NPs, ensures their final equilibrium states, or at least states close to equilibrium.
The thermodynamic simulation results relate to equilibrium segregation which, in some cases, cannot be achieved in real systems, especially at low temperatures. The accuracy and reliability of thermodynamic results seem to be lower for small nanoclusters (d < 1–2 nm) as, in particular, the employed thermodynamic simulation approach does not take into account the size dependence of the surface energies of components.
We believe that our paper will serve as a stimulus for further experimental and theoretical studies of regularities and mechanisms of segregation not only in Pt–Pd NPs, but also in other binary metallic alloys, including nanoalloys, which are of interest from a scientific point of view, and for numerous potential practical applications.

Author Contributions

Conceptualization, V.S.; methodology, V.S.; software, I.T. and A.R.; validation, A.L., D.Z. and V.P.; formal analysis, A.R.; investigation, V.S.; resources, A.L., D.Z. and V.P; data curation, A.R.; writing—original draft preparation, V.S.; writing—review and editing, V.S. and I.T.; visualization, A.R. and I.T.; supervision, V.S.; project administration, V.S.; funding acquisition, V.S. All authors have read and agreed to the published version of the manuscript.

Funding

This study was supported by the Ministry of Science and Higher Education of the Russian Federation under the State Program in the field of research activities (0817-2023-0006).

Data Availability Statement

The main simulation results were obtained by employing the open access program LAMMPS. The authors are not able now to freely share their own additional software for processing MD results (evaluation of the radial distributions of the local molar fractions of the NP components), as it is a proprietary of their organization (Tver State University). However, after the paper is published, the authors will be able to provide the trial software to interested readers. In addition, we propose to make the toolkit available on the GitHub website after the developed software has been registered.

Acknowledgments

We are grateful to G. Kaptay for consultations concerning the application of the employed thermodynamic simulation method and for providing us with parameters of the Redlich–Kister equation necessary for our calculations. We also thank M.V. Grishin for the discussions.

Conflicts of Interest

The authors declare no conflict of interest.

Appendix A. Algorithms of the Thermodynamic Simulation of the Surface Segregation in Binary NPs Based on Solving the Butler Equation

In the frames of the model of the infinite reservoir for the segregating component, we assumed that χ i ( c ) remained equal to the averaged (over the NP volume) value χ i ¯ , which characterizes the NP composition and is treated as a constant input parameter. For binary A–B NPs, in the ideal solution approximation ( Δ G m , A ( s ) = Δ G m , A ( c ) = Δ G m , B ( s ) = Δ G m , B ( c ) = 0 ), the Butler equation:
σ A = σ B
can be rewritten as follows:
σ A ( 0 ) + R T ω A ln ( 1 χ B ( s ) 1 χ B ¯ ) = σ B ( 0 ) + R T ω B ln ( χ B ( s ) χ B ¯ ) .
We have also taken into account that, according to [73,74], the equality ω i ω i ( 0 ) should be fulfilled. Then, under the assumption that ω A = ω B = ω (which is adequate for the case of small atomic size mismatch), Equation (A2) can be readily solved analytically:
χ B ( s ) = K B , s χ B ¯ 1 + χ B ¯ ( K B , s 1 ) .
The coefficient:
K B , s = exp [ ω ( σ A ( 0 ) σ B ( 0 ) ) R T ]
is referred to as the segregation coefficient for component B [73,74].
The model of the infinite reservoir for the segregating component is relevant for sufficiently large NPs, and most adequate for the surface boundary of the bulk alloy. In turn, for NP sizes smaller than 10 nm, the particle core cannot be quite adequately interpreted as an infinite reservoir for the segregating component. Therefore, the average molar fractions:
χ A ¯ = ν A ν = N A N   and   χ B ¯ = ν B ν = N B N
should differ from the corresponding quantities:
χ A ( c ) = ν A ( c ) ν ( c ) = N A ( c ) N ( c ) ;   χ B ( c ) = ν B ( c ) ν ( c ) = N B ( c ) N ( c ) ;   χ A ( s ) = ν A ( s ) ν ( s ) = N A ( s ) N ( s ) ;   χ B ( s ) = ν B ( s ) ν ( s ) = N B ( s ) N ( s )
for the particle core and its shell, respectively, where ν A and ν B are the numbers of moles of components A and B, ν = ν A + ν B is the total number of moles, N A and N B are the numbers of A and B atoms, respectively, and N = N A + N B is the total number of atoms in the particle.
As already noted, our approach to the thermodynamic simulation does not put any restrictions on the NP shell thickness. However, the fraction of the surface atoms ξ = N ( s ) / N should be preassigned as one of the input parameters. In the surface monolayer approximation, the ξ parameter is approximately equal to the reduced (dimensionless) degree of dispersity D * :
ξ = n ( s ) 4 π r 0 2 n ( 4 / 3 ) π r 0 3 = n ( s ) * n * 4 π r 0 * 2 ( 4 / 3 ) π r 0 * 3 3 r 0 * = D * .
The degree of dispersity, D , is defined as the surface-to-volume ratio for all particles of a disperse system. For the monodisperse system, D = 3 / r 0 . In (A5), n = N / ( 4 / 3 ) π r 0 3 is the average density (concentration) of atoms in the particle, n ( s ) = N ( s ) / 4 π r 0 2 is the average surface density, and r 0 * = r 0 / a , where the atomic diameter, a , can be interpreted as the average value of the atomic diameters a A and a B of the components. The corresponding reduced densities n * and n ( s ) * are defined as n a 3 and n ( s ) a 2 , respectively. A loose but adequate approximation ξ D * corresponds to n * n ( s ) * 1 . Of course, Equation (A5) does not exclude some further exact approximations for the ξ parameter.
Evaluation of χ B ( s ) in the frames of the limited source for the segregating component model and the ideal solution approximation reduces to solving the next set of two algebraic equations:
{ χ B ( s ) = K B , s χ B ( c ) 1 + χ B ( c ) ( K B , s 1 ) χ B ( s ) ξ + x B ( c ) ( 1 ξ ) = χ B ¯ .
The solution in question reduces to solving a quadratic algebraic equation for χ B ( c ) . Metallic NPs at moderate temperatures are practically non-volatile. Thus, the average molar fraction χ B ¯ of component B in the particle will not depend on time, i.e., the condition χ B ¯ = const should be fulfilled. The second equation of set (A6) has a simple physical meaning: it is the mass balance equation for the B component in the modelling particle. In the present paper, subscript B is used for Pd atoms and subscript A is used for Pt atoms.
When the ideal solution approximation is not employed, the partial molar excess Gibbs energies, Δ G m , A and Δ G m , B , can be found via the integral excess Gibbs energy Δ G m :
G m , A = Δ G m χ B ( Δ G m ) χ B ;   Δ G m , B = Δ G m + ( 1 χ B ) ( Δ G m ) χ B .
In turn, we calculated the integral excess Gibbs energy, Δ G m , using the Redlich–Kister equation [91]
Δ G m = R T χ B ( 1 χ B ) [ A 1 + A 2 ( χ A χ B ) + A 3 ( χ A χ B ) 2 + ]
where A 1 , A 2 , A 3 , etc., are the constants of expansion into the ( χ A χ B ) powers.
The Redlich–Kister equation can be rewritten in the following form [73]:
Δ G m = χ B ( 1 χ B ) [ L 0 + L 1 ( 1 2 χ B ) ] exp ( T / T 1 )
where L 0 = R T A 1 and L 1 = R T A 2 are the redefined A 1 and A 2 constants. Kaptay [74] introduced the exponential multiplier exp ( T / T 1 ) to provide the tending of Δ G m to zero at high temperatures ( T 1 is a very high characteristic temperature of 3000 K). Then, in [92], Kaptay drew the conclusion that the Pt–Pd alloy is adequate to the regular solution model, because the properties of Pt and Pd are very similar. Accordingly, the expansion coefficient, L 1 , can be assumed to be zero, and for the expansion coefficient, L 0 , Kaptay proposed the next equation [92]:
L 0 = 24500 e ( T / 3000 ) ,   J / mol .

References

  1. Fendler, J.H. Nanoparticles and Nanostructured Films; Wiley-VCH: Weinheim, Germany, 1998; p. 468. [Google Scholar]
  2. Qazi, U.Y.; Javaid, R. A review on metal nanostructures: Preparation methods and their potential applications. Adv. Nanopart. 2016, 5, 27–43. [Google Scholar] [CrossRef] [Green Version]
  3. Hernando, A.; Crespo, P.; García, M.A. Metallic magnetic nanoparticles. Sci. World J. 2005, 5, 972–1001. [Google Scholar] [CrossRef] [PubMed] [Green Version]
  4. Deshpande, M.D.; Pandey, R.; Blanco, M.A.; Khalkar, A. Magnetic properties of Ni 13 n Al n clusters with n = 0–13. J. Nanopart. Res. 2010, 12, 1129–1136. [Google Scholar] [CrossRef]
  5. Bartolomé, J.; Bartolomé, F.; García, L.M.; Figueroa, A.I.; Repollés, A.; Martínez-Pérez, M.J.; Luis, F.; Magén, C.; Selenska-Pobell, S.; Pobell, F.; et al. Strong paramagnetism of gold nanoparticles deposited on a sulfolobus acidocaldarius s layer. Phys. Rev. Lett. 2012, 109, 247203. [Google Scholar] [CrossRef] [Green Version]
  6. Karaagac, O.; Kockar, H. Optimisation of saturation magnetisation of iron nanoparticles synthesized by hydrogen reduction: Taguchi technique, response surface method, and multiple linear and quadratic regression analyses. J. Magn. Magn. Mater. 2018, 473, 190–197. [Google Scholar] [CrossRef]
  7. Samsonov, V.M.; Talyzin, I.V.; Puytov, V.V.; Vasilyev, S.A.; Romanov, A.A.; Alymov, M.I. When mechanisms of coalescence and sintering at the nanoscale fundamentally differ: Molecular dynamics study. J. Chem. Phys. 2022, 156, 214302. [Google Scholar] [CrossRef]
  8. Schmid, G.; Corain, B. Nanoparticulated gold: Syntheses, structures, electronics, and reactivities. Eur. J. Inorg. Chem. 2003, 2003, 3081–3098. [Google Scholar] [CrossRef]
  9. Daniel, M.-C.; Astruc, D. Gold nanoparticles:  assembly, supramolecular chemistry, quantum-size-related properties, and applications toward biology, catalysis, and nanotechnology. Chem. Rev. 2004, 104, 293–346. [Google Scholar] [CrossRef]
  10. Mody, V.V.; Siwale, R.; Singh, A.; Mody, H.R. Introduction to metallic nanoparticles. J. Pharm. Bioallied Sci. 2010, 2, 282–289. [Google Scholar] [CrossRef]
  11. Zhai, Y.; Han, P.; Yun, Q.; Ge, Y.; Zhang, X.; Chen, Y.; Zhang, H. Phase engineering of metal nanocatalysts for electrochemical CO2 reduction. eScience 2022, 2, 467–485. [Google Scholar] [CrossRef]
  12. Yin, H.-J.; Zhou, J.-H.; Zhang, Y. Shaping well-defined noble metal nanostructures for highperformance electrocatalysts: Advances and perspectives. Inorg. Chem. Front. 2019, 6, 2582–2618. [Google Scholar] [CrossRef]
  13. Liang, S.; Chen, S.; Guo, Z.; Lan, Z.; Kobayashi, H.; Yan, X.; Li, R. In situ generated electron-deficient metallic copper as the catalytically active site for enhanced hydrogen production from alkaline formaldehyde solution. Catal. Sci. Technol. 2019, 9, 5292–5300. [Google Scholar] [CrossRef]
  14. Azharuddin, M.; Zhu, G.H.; Das, D.; Ozgur, E.; Uzun, L.; Turner, A.P.; Patra, H.K. A repertoire of biomedical applications of noble metal nanoparticles. Chem. Commun. 2019, 55, 6964–6996. [Google Scholar] [CrossRef]
  15. Karthik, A.D.; Geetha, K. Applications of transition metal nanoparticles in antimicrobial therapy. Biomater. Tissue Eng. Bull. 2016, 3, 28–34. [Google Scholar]
  16. Balcerzak, M. Analytical methods for the determination of platinum in biological and environmental materials. A Review. Analyst 1997, 122, 67R–74R. [Google Scholar] [CrossRef]
  17. Troncoso, F.D.; Tonetto, G.M. Highly stable platinum monolith catalyst for the hydrogenation of vegetable oil. Chem. Eng. Process. 2022, 170, 108669. [Google Scholar] [CrossRef]
  18. Cha, G.; Hwang, I.; Hejazi, S.; Dobrota, A.S.; Pašti, I.A.; Osuagwu, B.; Kim, H.; Will, J.; Yokosawa, T.; Badura, Z.; et al. As a single atom Pd outperforms Pt as the most active co-catalyst for photocatalytic H2 evolution. iScience 2021, 24, 102938. [Google Scholar] [CrossRef]
  19. Ferrando, R.; Jellinek, J.; Johnston, R.L. Nanoalloys: From theory to applications of alloy clusters and nanoparticles. Chem. Rev. 2008, 108, 845–910. [Google Scholar] [CrossRef]
  20. Huynh, K.-H.; Pham, X.-H.; Kim, J.; Lee, S.H.; Chang, H.; Rho, W.-Y.; Jun, B.-H. Synthesis, properties, and biological applications of metallic alloy nanoparticles. Int. J. Mol. Sci. 2020, 21, 5174. [Google Scholar] [CrossRef]
  21. Sytwu, K.; Vadai, M.; Dionne, J.A. Bimetallic nanostructures: Combining plasmonic and catalytic metals for photocatalysis. Adv. Phys. X 2019, 4, 1619480. [Google Scholar] [CrossRef] [Green Version]
  22. Xu, H.; Liu, P.; Zhang, W.; Wang, Q.; Yang, Y. Structure, stability, electronic and magnetic properties of monometallic Pd, Pt, and bimetallic Pd-Pt core-shell nanoparticles. Chem. Phys. 2020, 539, 110953. [Google Scholar] [CrossRef]
  23. Long, N.V.; Ohtaki, M.; Hien, T.D.; Randy, J.; Nogami, M. A comparative study of Pt and Pt-Pd core-shell nanocatalysts. Electrochim. Acta 2011, 56, 9133–9143. [Google Scholar] [CrossRef]
  24. Wang, Z.-J.; Chen, J.; Huang, Y.; Chen, Z.-X. Surface segregation of PdM (M=Cu, Ag, Au) alloys and its implication to acetylene hydrogenation, DFT-based Monte Carlo simulations. Mater. Today Commun. 2021, 28, 102475. [Google Scholar] [CrossRef]
  25. Tello-Casas, F.F.; Cervantes-Aspeitia, E.Y.; Hernández-Pichardo, M.L.; Tufiño Velázquez, M.; Borja Urby, R.; del Angel, P.; González-Huerta, R. de G. Surface-enriched Pd/C electrocatalysts with a low load of Pt prepared by surface redox reactions for the oxygen reduction reaction. Int. J. Hydrogen Energy 2021, 46, 26005–26018. [Google Scholar] [CrossRef]
  26. Cai, X.; Lin, R.; Liu, X.; Zhao, Y. Effect of heat treatment on the surface structure of Pd@Pt–Ni core-shell catalysts for the oxygen reduction reaction. J. Alloys Compd. 2021, 884, 161059. [Google Scholar] [CrossRef]
  27. Zhang, Y.; Ye, K.; Gu, Q.; Jiang, Q.; Qin, J.; Leng, D.; Liu, Q.; Yang, B.; Yin, F. Optimized oxygen reduction activity by tuning shell component in Pd@Pt-based core-shell electrocatalysts. J. Colloid Interface Sci. 2021, 604, 301–309. [Google Scholar] [CrossRef]
  28. Ferrari, A.; Körmann, F. Design of compositionally complex catalysts: Role of surface segregation. J. Mater. Res. Technol. 2021, 14, 1830–1836. [Google Scholar] [CrossRef]
  29. Hashiguchi, Y.; Watanabe, F.; Honma, T.; Nakamura, I.; Poly, S.S.; Kawaguchi, T.; Tsuji, T.; Murayama, H.; Tokunaga, M.; Fujitani, T. Continuous-flow synthesis of Pd@Pt core-shell nanoparticles. Colloid Surf. A 2021, 620, 126607. [Google Scholar] [CrossRef]
  30. Akbarzadeh, H.; Mehrjouei, E.; Shamkhali, A.N.; Ramezanzadeh, S.; Abbaspour, M.; Salemi, S. Stability of Pd@void@M (M=Ni, Ag, and Pt) yolk shell nanoparticles controlled by structural factors: A molecular dynamics perspective. Colloid Surf. A 2021, 610, 125920. [Google Scholar] [CrossRef]
  31. Hang, N.T.N.; Yang, Y.; Nam, N.Q.T.; Nogami, M.; Phuc, L.H.; Long, N.V. Pt-based multimetal electrocatalysts and potential applications: Recent advancements in the synthesis of nanoparticles by modified polyol methods. Crystals 2022, 12, 375. [Google Scholar] [CrossRef]
  32. Wu, Z.-P.; Caracciolo, D.T.; Maswadeh, Y.; Wen, J.; Kong, Z.; Shan, S.; Vargas, J.A.; Yan, S.; Hopkins, E.; Park, K.; et al. Alloying–realloying enabled high durability for Pt–Pd-3d-transition metal nanoparticle fuel cell catalysts. Nat. Commun. 2021, 12, 859. [Google Scholar] [CrossRef]
  33. Li, M.; Xia, Z.; Luo, M.; He, L.; Tao, L.; Yang, W.; Yu, Y.; Guo, S. Structural regulation of Pd-based nanoalloys for advanced electrocatalysis. Small Sci. 2021, 1, 2100061. [Google Scholar] [CrossRef]
  34. Zheng, T.; Wu, F.; Fu, H.; Zeng, L.; Shang, C.; Zhu, L.; Guo, Z. Rational design of Pt-Pd-Ni trimetallic nanocatalysts for room-temperature benzaldehyde and styrene hydrogenation. Chem. Asian J. 2021, 16, 2298–2306. [Google Scholar] [CrossRef]
  35. Wang, Q.; Zhu, B.; Tielens, F.; Guesmi, H. Single Metal atoms embedded in the surface of Pt nanocatalysts: The effect of temperature and hydrogen pressure. Catalysts 2022, 12, 1669. [Google Scholar] [CrossRef]
  36. Yang, Y.; Lee, J.; Dorakhan, R.; Nie, H.; Fu, G.; Quarantotto, A.; Howe, J.Y.; Chin, Y.-H. Structure and methane oxidation reactivity of bimetallic Pd and Pt nanoparticles. Appl. Catal. A-Gen. 2021, 629, 118290. [Google Scholar] [CrossRef]
  37. Schütz, J.; Störmer, H.; Lott, P.; Deutschmann, O. Effects of hydrothermal aging on CO and NO oxidation activity over monometallic and bimetallic Pt-Pd catalysts. Catalysts 2021, 11, 300. [Google Scholar] [CrossRef]
  38. Liu, Z.; Li, Y.; Zhang, X.; Rao, S.; Li, J.; Wang, W.; Sun, Z.; Yang, J. Surface structure engineering of PtPd nanoparticles for boosting ammonia oxidation electrocatalysis. ACS Appl. Mater. Interfaces 2022, 14, 28816–28825. [Google Scholar] [CrossRef]
  39. Sarma, B.B.; Agostini, G.; Farpón, M.G.; Marini, C.; Pfänder, N.; Prieto, G. Bottom-up assembly of bimetallic nanocluster catalysts from oxide-supported single-atom precursors. J. Mater. Chem. A 2021, 9, 8401–8415. [Google Scholar] [CrossRef]
  40. Chen, J.; Wang, S.; Peres, L.; Collière, V.; Philippot, K.; Lecante, P.; Chen, Y.; Yan, N. Oxidation of methane to methanol over Pd@Pt nanoparticles under mild conditions in water. Catal. Sci. Technol. 2021, 11, 3493–3500. [Google Scholar] [CrossRef]
  41. Zhang, X.; Fu, Q.; Duan, H.; Song, J.; Yang, H. Janus nanoparticles: From fabrication to (bio)applications. ACS Nano 2021, 15, 6147–6191. [Google Scholar] [CrossRef]
  42. Song, P.; Wen, D. Molecular dynamics simulation of a core-shell structured metallic nanoparticle. J. Phys. Chem. C 2010, 114, 8688–8696. [Google Scholar] [CrossRef]
  43. Deng, L.; Hu, W.; Deng, H.; Xiao, S. Surface segregation and structural features of bimetallic Au-Pt nanoparticles. J. Phys. Chem. C 2010, 114, 11026–11032. [Google Scholar] [CrossRef]
  44. Eom, N.; Messing, M.E.; Johansson, J.; Deppert, K. General trends in core−shell preferences for bimetallic nanoparticles. ACS Nano 2021, 15, 8883–8895. [Google Scholar] [CrossRef] [PubMed]
  45. Baletto, F.; Mottet, C.; Ferrando, R. Growth of three-shell onionlike bimetallic nanoparticles. Phys. Rev. Lett. 2003, 90, 135504. [Google Scholar] [CrossRef] [PubMed]
  46. Akbarzadeh, H.; Mehrjouei, E.; Abbaspour, M.; Shamkhali, A.N. Melting behavior of bimetallic and trimetallic nanoparticles: A review of md simulation studies. Top. Curr. Chem. 2021, 379, 22. [Google Scholar] [CrossRef]
  47. Paz-Borbón, L.O. Computational Studies of Transition Metal Nanoalloys; Springer: Berlin, Germany, 2011; p. 172. [Google Scholar]
  48. Butler, J.A.V. The thermodynamics of the surfaces of solutions. Proc. R. Soc. A Math. Phys. 1932, 135, 348–375. [Google Scholar]
  49. Samsonov, V.M.; Romanov, A.A.; Kartoshkin, A.Y.; Talyzin, I.V.; Puytov, V.V. Embedding functions for Pt and Pd: Recalculation and verification on properties of bulk phases, Pt, Pd, and Pt–Pd nanoparticles. Appl. Phys. A 2022, 128, 826. [Google Scholar] [CrossRef]
  50. Rousset, J.L.; Renouprez, A.J.; Cadrot, A.M. Ion-scattering study and Monte Carlo simulations of surface segregation in Pd-Pt nanoclusters obtained by laser vaporization of bulk alloys. Phys. Rev. B 1998, 58, 2150–2156. [Google Scholar] [CrossRef]
  51. Fiermans, L.; De Gryse, R.; De Doncker, G.; Jacobs, P.A.; Martensy, J.A. Pd segregation to the surface of bimetallic Pt–Pd particles supported on H-β zeolite evidenced with X-ray photoelectron spectroscopy and argon cation bombardment. J. Catal. 2000, 193, 108–114. [Google Scholar] [CrossRef]
  52. Bernardi, F.; Alves, M.C.M.; Traverse, A.; Silva, D.O.; Scheeren, C.W.; Dupont, J.; Morais, J. Monitoring atomic rearrangement in PtxPd1−x (x = 1, 0.7, or 0.5) nanoparticles driven by reduction and sulfidation processes. J. Phys. Chem. C 2009, 113, 3909–3916. [Google Scholar] [CrossRef]
  53. Mendoza-Pérez, R.; Guisbiers, G. Bimetallic Pt-Pd nano-catalyst: Size, shape and composition matter. Nanotechnology 2019, 30, 305702. [Google Scholar] [CrossRef]
  54. Ramirez Caballero, G.E.; Balbuena, P.B. Surface segregation phenomena in Pt–Pd nanoparticles: Dependence on nanocluster size. Mol. Simulat. 2006, 32, 297–303. [Google Scholar] [CrossRef]
  55. Wang, L.-L.; Johnson, D.D. Predicted Trends of Core-Shell Preferences for 132 LateTransition-Metal Binary-Alloy Nanoparticles. J. Am. Chem. Soc. 2009, 131, 14023–14029. [Google Scholar] [CrossRef]
  56. Mélinon, P.; Begin-Colin, S.; Duvail, J.L.; Gauffre, F.; Boime, N.H.; Ledoux, G.; Plain, J.; Reiss, P.; Silly, F.; Warot-Fonrose, B. Engineered inorganic core/shell nanoparticles. Phys. Rep. 2014, 543, 163–197. [Google Scholar] [CrossRef] [Green Version]
  57. Sutton, A.P.; Chen, J. Long-range Finnis–Sinclair potentials. Philos. Mag. Lett. 1990, 61, 139–146. [Google Scholar] [CrossRef]
  58. Zhou, X.W.; Johnson, R.A.; Wadley, H.N.G. Misfit-energy-increasing dislocations in vapor-deposited CoFe/NiFe multilayers. Phys. Rev. B 2004, 69, 144113. [Google Scholar] [CrossRef] [Green Version]
  59. An, H.M.; Zhao, Z.L.; Wang, Q.; Zhang, L.Y.; Gu, M.; Li, C.M. Ternary PtPdCu multicubes as a highly active and enhanced durable catalyst toward oxygen reduction reaction. Chemelectrochem 2018, 5, 1345–1349. [Google Scholar] [CrossRef]
  60. Akbarzadeh, H.; Mehrjouei, E.; Abbaspour, M.; Salemi, S.; Yaghoubi, H.; Kamrani, M. Thermal behavior of different types of Au–Pt–Pd nanoparticles: Dumbbell-like, three-shell, core-shell, and random-alloy. Mater. Chem. Phys. 2022, 294, 126955. [Google Scholar] [CrossRef]
  61. Lu, X.-Z.; Shao, G.-F.; Xu, L.-Y.; Liu, T.-D.; Wen, Y.-. H Structural optimization and segregation behavior of quaternary alloy nanoparticles based on simulated annealing algorithm. Chin. Phys. B 2016, 25, 053601. [Google Scholar] [CrossRef]
  62. Thompson, A.P.; Aktulga, H.M.; Berger, R.; Bolintineanu, D.S.; Brown, W.M.; Crozier, P.S.; in‘t Veld, P.J.; Kohlmeyer, A.; Moore, S.G.; Nguyen, T.D.; et al. LAMMPS—A flexible simulation tool for particle-based materials modeling at the atomic, meso, and continuum scales. Comput. Phys. Commun. 2022, 271, 108171. [Google Scholar] [CrossRef]
  63. Allen, M.P.; Tildesley, D.J. Computer Simulation of Liquids; Clarendon Press: Oxford, UK, 1991; p. 641. [Google Scholar]
  64. Nosé, S. A unified formulation of the constant temperature molecular dynamics methods. J. Chem. Phys. 1984, 81, 511–519. [Google Scholar] [CrossRef] [Green Version]
  65. Grigoriev, S.; Meilikhov, E.Z.; Radzig, A.A. Handbook of Physical Quantities, 1st ed.; CRC Press: Boca Raton, FL, USA, 1997; p. 1568. [Google Scholar]
  66. Crawley, A.F. Densities of liquid metals and alloys. Int. Metall. Rev. 1974, 19, 32–48. [Google Scholar] [CrossRef]
  67. Cleri, F.; Rosato, V. Tight-binding potentials for transition metals and alloys. Phys. Rev. B 1993, 48, 22–33. [Google Scholar] [CrossRef] [PubMed]
  68. Xia, Y.; Nelli, D.; Ferrando, R.; Yuan, Y.; Li, Z.Y. Shape control of size-selected naked platinum nanocrystals. Nat. Commun. 2021, 12, 3019. [Google Scholar] [CrossRef] [PubMed]
  69. Nelli, D.; Roncaglia, C.; Ahearn, S.; Di Vece, M.; Ferrando, R.; Minnai, C. Octahedral Growth of PtPd Nanocrystals. Catalysts 2021, 11, 718. [Google Scholar] [CrossRef]
  70. Samsonov, V.M.; Talyzin, I.V.; Kartoshkin, A.Y.; Vasilyev, S.A. Surface segregation in binary Cu–Ni and Au–Co nanoalloys and the core–shell structure stability/instability: Thermodynamic and atomistic simulations. Appl. Nanosci. 2019, 9, 119–133. [Google Scholar] [CrossRef]
  71. Samsonov, V.M.; Bembel, A.G.; Kartoshkin, A.Y.; Vasilyev, S.A.; Talyzin, I.V. Molecular dynamics and thermodynamic simulations of segregation phenomena in binary metal nanoparticles. J. Therm. Anal. Calorim. 2018, 133, 1207–1217. [Google Scholar] [CrossRef]
  72. Samsonov, V.M.; Talyzin, I.V.; Kartoshkin, A.Y.; Vasiliev, S.A.; Alymov, M.I. On the problem of stability/instability of bimetallic core-shell nanostructures: Molecular dynamics and thermodynamic simulations. Comp. Mater. Sci. 2021, 199, 110710. [Google Scholar] [CrossRef]
  73. Kaptay, G. A coherent set of model equations for various surface and interface energies in systems with liquid and solid metals and alloys. Adv. Colloid Interface Sci. 2020, 283, 102212. [Google Scholar] [CrossRef]
  74. Kaptay, G. Modelling equilibrium grain boundary segregation, grain boundary energy and grain boundary segregation transition by the extended Butler equation. J. Mater. Sci. 2016, 51, 1738–1755. [Google Scholar] [CrossRef]
  75. Alchagirov, A.B.; Alchairov, B.B.; Taova, T.M.; Khokonov, K.B. Surface energy and surface tension of solid and liquid metals. Recommended values. Trans. Join. Weld. Res. Inst. Osaka Univ. 2001, 30, 287–291. [Google Scholar]
  76. Rodríguez-Proenza, C.; Palomares-Báez, J.; Chávez-Rojo, M.; García-Ruiz, A.; Azanza-Ricardo, C.; Santoveña-Uribe, A.; Luna-Bárcenas, G.; Rodríguez-López, J.L.; Esparza, R. Atomic surface segregation and structural characterization of PdPt bimetallic nanoparticles. Materials 2018, 11, 1882. [Google Scholar] [CrossRef] [Green Version]
  77. Chepkasov, I.V.; Gafner, Y.Y.; Vysotin, M.A.; Redel′, L.V. A study of melting of various types of Pt–Pd nanoparticles. Phys. Solid State 2017, 59, 2076–2081. [Google Scholar] [CrossRef]
  78. Chepkasov, I.V.; Visotin, M.A.; Kovaleva, E.A.; Manakhov, A.M.; Baidyshev, V.S.; Popov, Z.I. Stability and electronic properties of PtPd nanoparticles via MD and DFT calculations. J. Phys. Chem. C 2018, 122, 18070–18076. [Google Scholar] [CrossRef]
  79. Nelli, D.; Cerbelaud, M.; Ferrando, R.; Minnai, C. Tuning the coalescence degree in the growth of Pt–Pd nanoalloys. Nanoscale Adv. 2021, 3, 836–846. [Google Scholar] [CrossRef]
  80. Anderson, R.M.; Zhang, L.; Loussaert, J.A.; Frenkel, A.I.; Henkelman, G.; Crooks, R.M. An experimental and theoretical investigation of the inversion of Pd@Pt Core@Shell dendrimer-encapsulated nanoparticles. ACS Nano 2013, 7, 9345–9353. [Google Scholar] [CrossRef]
  81. Tománek, D.; Mukherjee, S.; Kumar, V.; Bennemann, K.H. Calculation of chemisorption and absorption induced surface segregation. Surf. Sci. 1982, 114, 11–22. [Google Scholar] [CrossRef]
  82. Guisbiers, G.; Mendoza-Cruz, R.; Bazán-Díaz, L.; Velázquez-Salazar, J.J.; Mendoza-Perez, R.; Robledo-Torres, J.A.; Rodriguez-Lopez, J.-L.; Montejano-Carrizales, J.M.; Whetten, R.L.; José-Yacamán, M. Electrum, the gold−silver alloy, from the bulk scale to the nanoscale: Synthesis, properties, and segregation rules. ACS Nano 2015, 10, 188–198. [Google Scholar] [CrossRef]
  83. Samsonov, V.M.; Vasilyev, S.A.; Nebyvalova, K.K.; Talyzin, I.V.; Sdobnyakov, N.Y.; Sokolov, D.N.; Alymov, M.I. Melting temperature and binding energy of metal nanoparticles: Size dependences, interrelation between them, and some correlations with structural stability of nanoclusters. J. Nanopart. Res. 2020, 22, 247. [Google Scholar] [CrossRef]
  84. Peters, K.F.; Cohen, J.B.; Chung, Y.W. Melting of Pb nanocrystals. Phys. Rev. B 1998, 57, 13430–13438. [Google Scholar] [CrossRef]
  85. Samsonov, V.M.; Vasilyev, S.A.; Bembel, A.G. Size dependence of the melting temperature of metallic nanoclusters from the viewpoint of the thermodynamic theory of similarity. Phys. Met Metallogr. 2016, 117, 749–755. [Google Scholar] [CrossRef]
  86. Chen, Y.; Yuan, Q. Carbon induced segregation of Ni atoms in Cu-Ni alloy. Chem. Phys. Lett. 2022, 806, 139979. [Google Scholar] [CrossRef]
  87. Nelli, D.; Rossi, G.; Wang, Z.; Palmer, R.E.; Ferrando, R. Structure and orientation effects in the coalescence of Au clusters. Nanoscale 2020, 12, 7688–7699. [Google Scholar] [CrossRef] [PubMed]
  88. Cserháti, C.; Szabó, I.A.; Beke, D.L. Size effects in surface segregation. J. Appl. Phys. 1998, 83, 3021–3027. [Google Scholar] [CrossRef]
  89. Brongersma, H.; Sparnaay, M.; Buck, T. Surface segregation in Cu-Ni and Cu-Pt alloys; A comparison of low-energy ion-scattering results with theory. Surf. Sci. 1978, 71, 657–678. [Google Scholar] [CrossRef]
  90. Yan, X.L.; Wang, J.Y. Size effects on surface segregation in Ni–Cu alloy thin films. Thin Solid Film. 2013, 529, 483–487. [Google Scholar] [CrossRef]
  91. Redlich, O.; Kister, A.T. Algebraic representation of thermodynamic properties and the classification of solutions. Ind. Eng. Chem. 1948, 40, 345–348. [Google Scholar] [CrossRef]
  92. Kaptay, G. The exponential excess Gibbs energy model revisited. Calphad 2017, 56, 169–184. [Google Scholar] [CrossRef]
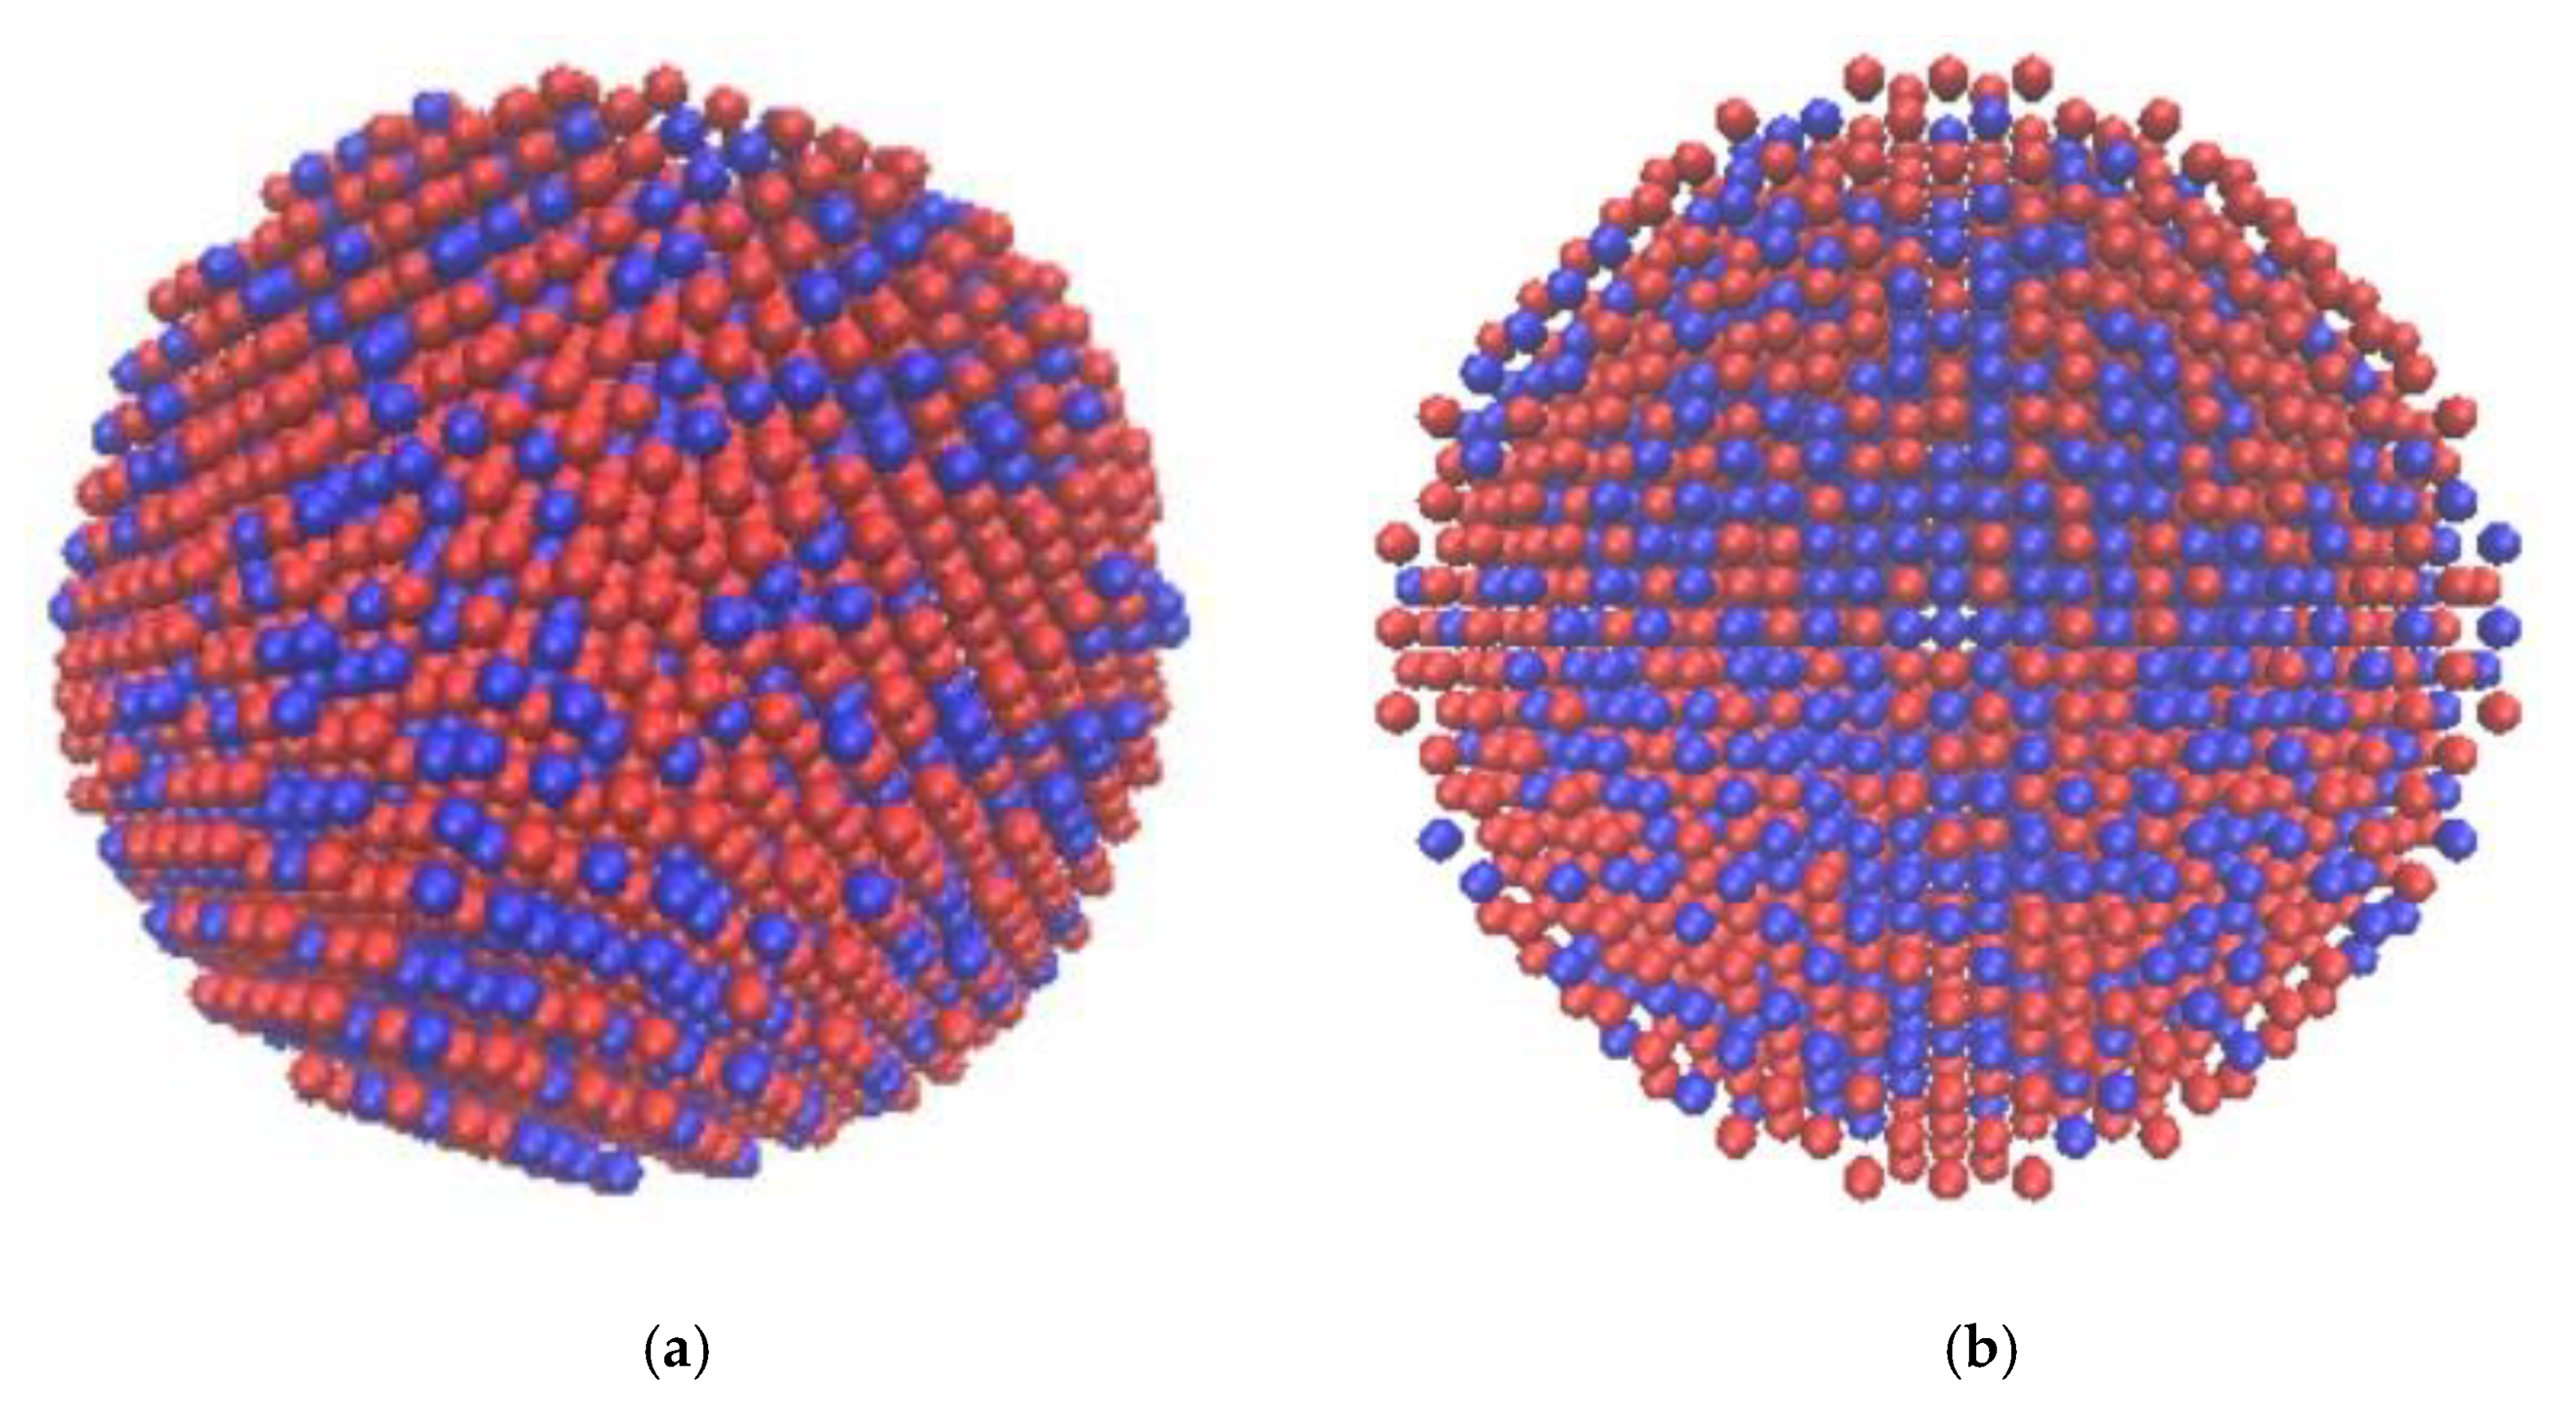
Figure 1. A snapshot (a) and a central cross-section (b) of an initial Pt–Pd NP configuration containing 40% Pd ( N = 5000). Pt atoms are marked in red; Pd atoms are marked in blue.
Metals 13 01269 g001
Figure 2. The initial radial distributions of the local molar fractions χ P t ( r ) and χ P d ( r ) in the binary Pt–Pd NP shown in Figure 1. Curve 1 corresponds to Pt; curve 2 corresponds to Pd.
Metals 13 01269 g002
Figure 3. A snapshot (a) and a central cross-section (b) of the same Pt–Pd NP (corresponding to the initial configuration shown in Figure 1) after cooling the melted NP down to T = 300 K and subsequent annealing at this final temperature.
Metals 13 01269 g003
Figure 4. The final (after annealing) radial distributions of the local molar fractions χ P t ( r ) and χ P d ( r ) in the binary Pt–Pd NP shown in Figure 3. Curve 1 corresponds to Pt, curve 2 to Pd.
Metals 13 01269 g004
Figure 5. MD dependence of the molar fraction χ P d ( s ) of Pd in the surface layer of Pt–Pd NPs containing from 140 to 10,000 atoms on the average value χ P d ¯ of the Pd molar fraction (temperature T = 300 K, EAM parameterization (data from [58]), averaging over the results of 5 MD experiments). The designations of dots corresponding to different numbers of atoms in NPs are given in the figure. The dashed line corresponds to the limiting case of the absence of segregation.
Metals 13 01269 g005
Figure 6. MD dependence of χ P d ( s ) on the average value χ P d ¯ (our EAM parameterization (data from [49])). Other designations are explained in the caption to Figure 5.
Metals 13 01269 g006
Figure 7. Thermodynamic dependence of the molar fraction, χ P d ( s ) , of Pd atoms in the surface layer of Pt–Pd NPs on the average value, χ P d ¯ , of the molar fraction of Pd (ideal solution approximation, model of the limited source for the segregating component, T = 300 K). The numbers of atoms in NPs are given in the figure.
Metals 13 01269 g007
Figure 8. Dependence of χ P d ( s ) on χ P d ¯ , obtained within the model of the limited source for the segregating component and taking into account that Δ G m 0 ( T = 300 K).
Metals 13 01269 g008
Figure 9. Thermodynamic (curves) and MD (dots) dependences of the molar fraction, x P d ( s ) , of Pd in the surface layers of Pt–Pd NPs containing 5000 atoms on the average molar fraction, x P d ¯ , of Pd in NPs: curve 1 corresponds to T = 300 K and the model of the unlimited source for the segregating component as well as to approximation of the ideal solution; curve 2 corresponds to the same temperature and the ideal solution approximation, but to the model of the limited source for the segregating component; curve 3 corresponds to T = 1000 K, the limited source model, and approximation of the ideal solution; curve 4 presents the results for T = 300 K, model of the limited source, and taking into account the non-zero excess Gibbs energy; curve 5 corresponds to the results for T = 1000 K (the same most exact model and non-zero excess Gibbs energy); the dashed straight line (6) corresponds to the limiting case of no segregation. Dots present MD results averaged over 5 independent MD experiments and obtained for temperatures T = 300 K () and T = 1000 K () employing our EAM parameterizations (data from [49]).
Metals 13 01269 g009
Table 1. Densities of bulk Pt and Pd in the solid ρ s   ( T = 300   K ) and liquid ( ρ l   ( T = T m ( ) ) states found in our MD experiments.
Metal ρ s ,   10 3   k g / m 3 ρ l ,   10 3   k g / m 3
Embedding FunctionsExperiment
[65]
Embedding FunctionsExperiment
[66]
[58]Our Functions[58]Our Functions
Pt
Pd
21.2
11.8
21.1
11.8
21.1
12.0
19.4
10.5
19.6
10.8
18.9
10.5
Table 2. Comparison of the bulk Pt and Pd melting temperatures T m ( ) found in our MD experiments employing two different sets of EAM functions.
Metal T m ( ) ,   K
Embedding FunctionsExperiment
[65]
[58]Our Functions
Pt
Pd
1837
1979
2295
1717
2041
1827
Disclaimer/Publisher’s Note: The statements, opinions and data contained in all publications are solely those of the individual author(s) and contributor(s) and not of MDPI and/or the editor(s). MDPI and/or the editor(s) disclaim responsibility for any injury to people or property resulting from any ideas, methods, instructions or products referred to in the content.