Abstract
Aluminum alloys containing transition metal alloying elements have attracted interest from researchers. The effect of Cr additions of 0.25 and 0.50% on the thermal profile, microstructure, hardness, and linear reciprocating sliding wear response of as-cast hypoeutectic Al–Cu alloys with 2.5, 3.5, and 4.5% Cu (wt.%) was investigated. The binary Al–Cu and ternary Al–Cu–Cr alloys were directionally solidified under upward non-steady state heat transfer conditions using a dedicated solidification apparatus. Thermal analysis based on differential thermal analysis (DTA) and cooling curve profiles was performed to determine solidification thermal parameters such as Liquidus temperature (TL), transformation enthalpy (ΔH), and liquid cooling rate (ṪL). Samples extracted from the solidified ingots were submitted to optical microscopy, hardness measurement, and linear reciprocating sliding wear test using a high-frequency reciprocating rig (HFRR). The results showed a decrease at the beginning of solidification (TL) and of the transformation enthalpy (ΔH) when both alloy Cu and Cr contents increased, with a higher influence of Cu. The addition of Cu decreased cooling rates, whereas the increase in the alloy Cr concentration showed an opposite behavior, increasing cooling rates. The refinement of the primary dendrite arm spacing (λ1), as a consequence of the increase in alloying elements and solidification cooling rates, enhanced the hardness of the alloys, with the maximum value of 58 HB achieved in the ternary Al–4.5Cu–0.50Cr alloy. The wear tests indicated a better response to wear associated with microstructure refinement for the alloys with 2.5% Cu, for both Cr contents, an almost constant behavior for the 3.5% Cu alloys, and an opposite performance for the alloys with 4.5% Cu alloys that showed better wear resistance with coarsening of the λ1 and with the increase in the amount of the eutectic microconstituent.
1. Introduction
It is well-known that the microstructure and mechanical, corrosion, and wear properties of aluminum alloys are affected by adding alloying elements. Some elements improve alloy strength by solid solution strengthening, while others allow for heat treatment to enhance mechanical properties by precipitation hardening mechanisms [1]. The most common alloying elements added to aluminum alloys are Cu, Mn, Si, Mg, and Zn. Some transition metal elements, such as Ti, Cr, V, Fe, Co, Ni, and Sc, are also added to increase strength and physical properties or to act as microstructure modifiers and/or grain refiners, as is the case of Ti, B, V, Sc, and Sr [2,3].
In general, transition metal elements have limited solid solubility in the α–Al matrix, with a tendency to form secondary intermetallic phases and improve specific properties. Another benefit of adding Ti, Mn, Cr, and Zr is to minimize the susceptibility to solidification cracking during casting and welding processes, in particular interdendritic cracking, attributed to both presence of intermetallic particles in the interdendritic regions and a decrease in the solidification temperature interval (between Liquidus and Solidus temperatures). Furthermore, the improvement of grain boundary cohesion, especially at elevated temperatures, is of interest when transition metal alloying elements are added to aluminum alloys [4]. Elements such as Cr, Ni, and Zr are beneficial, whereas P is harmful, and Si and Mg are considered neutral elements in this context. Alloying elements such as Mn and Sc induce eutectic transformations with Al, being segregated in the dendritic peripheral regions, while Cr, Ti, and Zr promote peritectic transformations, enriching the central region of the interdendritic zones [5]. The formation of small and distributed dispersoids in the α–Al matrix is another advantage of using transition metal elements such as Sc and Zr. These dispersoids can act as preferred sites for nucleation and stabilization of hardening precipitates during aging after solutioning, inducing strength increment [6].
Some works have investigated the influence of Cr additions on the microstructure formation, mechanical properties, and manufacturing processes of cast Al alloys. In binary Al–Cr alloys, small additions of Cr predominantly form the second phase CrAl7 due to its low equilibrium solid solubility limit in the α–Al matrix. During solidification or heat treatment, this precipitate acts as an obstacle to grain growth [7]. An important concern in this topic, in special in near-net-shape processes, such as additive manufacturing by laser powder bed fusion (LPBF), is that the addition of 3%Cr to Al has shown significant high-temperature strength by solid-solution hardening after aging heat treatment [8], demonstrating the potential of Al–Cr alloys to produce three-dimensional metal components from metal powders by additive manufacturing processes based on laser irradiation. When Cr content is higher, quasicrystals are formed over a wide composition range. These quasicrystals can be decagonal quasicrystals (DQCs—periodic along the 10-fold axis and quasiperiodic on the perpendicular plane) or icosahedral quasicrystals (IQCs—three-dimensional quasi-periodic), depending on the Cr content [9,10]. In ternary Al–Cu–Cr alloys, AlCuCr intermetallic particles can be found depending on the alloy Cu and Cr contents, solidification conditions, and heat treatment processes. With high Cr content, the Al–Cu–Cr system has been considered one of the most complex alloy systems, since this system includes some uncharacterized phases such as icosahedral and decagonal quasicrystals [11,12,13,14,15,16].
The effect of Cr addition (0.9 and 1.24 wt.%) on microstructure, mechanical properties, wear resistance, and formability of an Al–2.3%Cu alloy was analyzed by El-Nasser et al. [17]. Both as-cast and heat-treated (solutioning and aging) conditions were investigated. From the results, the authors observed a decrease in the strength with the increase of chromium addition. However, when higher Cr content was added, the best formability was achieved. Ravikumar et al. [18] investigated the effect of different Cr additions (0.1, 1, and 2%) on the microstructure, hardness, tensile strength, and dry sliding wear of the aluminum-copper casting alloy A206, containing 4.5%Cu, 0.22%Mn, 0.19%Mn, and 0.19%Ti. The alloys were analyzed in the as-cast condition, and after solutioning and aging heat treatments. In the as-cast condition, the results showed that the effect of Cr addition on hardness was insignificant. However, in the heat-treated condition, Cr acted as a stronger solid-solution strengthener in the alloy content of 0.1%. Ribeiro et al. [19] observed an identical positive behavior of 0.25 and 0.50%Cr additions in an Al–3.8%Cu alloy (wt%). The addition of Cr promoted the formation of Al–Cu–Cr–Fe precipitates, preventing the formation of detrimental Al–Fe phases. When the Cr content was increased, the hardness and tensile strength also increased. The influence of 0.3% Cr addition on microstructure, phase composition, and mechanical properties of the Al–5.1%Cu–1.7%Y–0.3%Zr alloy (wt%) in the as-cast, homogenized, and hot-rolled conditions was investigated by Amer et al. [20]. The results demonstrated that the addition of Cr promotes the precipitation of an Al–Cu–Y–Cr phase, improving mechanical responses, especially after rolling and annealing processes. Monti et al. [21] investigated the effect of Cr and Fe addition on the hot cracking formation in Al–Cu alloys processed by laser powder bed fusion (LPBF). Secondary phase formation and microstructure refining were examined under high cooling rates. The results demonstrated that under high cooling rates, Cr remained the majority in solid solution, and a small amount was observed in some precipitates with other alloying elements.
Despite the aforementioned works, the literature is still scarce in information related to the effect of small Cr additions on solidification, microstructure formation, and mechanical properties of hypoeutectic Al–Cu alloys. Furthermore, features such as macrostructural morphologies, microstructural length scales, and the presence and distribution of secondary phases can be used to correlate the positive effect of the Cu:Cr ratio on mechanical properties and wear behavior. In the present work, the influence of Cr additions (0.25 and 0.50%) to Al–(2.5, 3.5, 4.5%)Cu alloys on the solidification condition, microstructure, hardness, and linear reciprocating sliding wear response was investigated. Upward directional solidification was applied to minimize natural convection and solute segregation due to different densities between elements to be minimized, as well as to obtain a high spectrum of cooling rate during solidification, inducing diverse microstructural formation. Based on the results, interrelationships between microstructure features and mechanical properties are discussed.
2. Materials and Methods
The proposed Al–Cu–Cr alloys investigated in this work are listed in Table 1. The alloys containing 2.5, 3.5, and 4.5%Cu and 0.25 and 0.50%Cr (wt.%) were prepared from 99.9% pure Al ingots, 99.99% electrolytic Cu wires, and 99.0% pure Cr chips. The metals were melted in an electric resistance soak furnace, using silicon carbide crucibles covered with boron nitride coating. Initially, pure Al was melted at 900 °C; subsequently, Cu was added to the melt, and after 5 min., Cr was added. The molten metal was kept for 3 h under mechanical stirring at intervals of 15 min to ensure the complete dissolution of solutes. No inert atmosphere was used. Approximately 4 kg of each alloy was produced. The chemical compositions were confirmed by an arc/spark optical emission spectrometry (OES) analyzer (SpectroMaxx, Spectro Ametek, Kleve, Germany), and the average values of six measurements are presented in Table 1.

Table 1.
Chemical composition of the alloys (wt.%).
Differential thermal analyzes at heating and cooling rates of 10 °C/min were carried out using a simultaneous thermal analyzer (SDT 650 Discovery, TA Instruments) in samples extracted from the alloys. The analyses were performed using alumina crucibles 90 μg, heating/cooling steps in the ranges of 40–750 °C and 750–40 °C, respectively, under a protective N2 atmosphere with a 100 mL/min flow rate. TRIOS 5.2 software (TA Instruments, New Castle, DE, USA) was used for processing the results. Liquidus temperatures (TL) and transformation enthalpies (ΔH) were determined from the cooling curves.
Subsequently, the alloys were directionally solidified in the solidification apparatus shown in Figure 1a, which consists of a resistive tubular furnace having two independent heating zones, a cylindrical AISI 1020 carbon steel mold instrumented with six type-K thermocouples (1.6 mm diameter) positioned along the height of the mold cavity, and a water jet cooling system with a flow rate of 3 L/min located at the bottom of the mold. Our previous works present details about the solidification experimental system [19,22,23]. The alloys were melted at about 720 °C (approximately 10% above the alloy’s Liquidus temperatures). The liquid cooling rates (ṪL) were determined from the cooling curves acquired by the thermocouples, as described in [24,25].
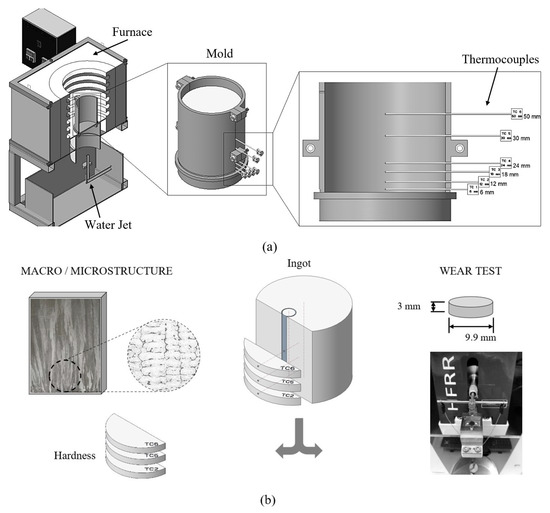
Figure 1.
Schematic representation of: (a) solidification apparatus and (b) samples extracted for microstructural analysis and wear test.
Macrostructure and microstructure analyses were performed following the recommendation of ASTM E3 and E407 standard methods [26,27] For longitudinal macrostructure revelation, the samples were etched with a fluorite aqua regia solution (270 mL DI H2O + 20 mL HNO3 + 60 mL HCl + 10 mL HF). The electro polisher/etcher power supply (ElectroMet 4, Buehler) was used with an electrolyte (800 mL ethanol 95% + 140 mL DI H2O + 60 mL HClO4 60%), 1.8 A current, and 25–30 s dwell time to reveal the microstructures. The microstructures were analyzed along the length of the ingots at 12, 30, and 50 mm distant from the bottom of the ingots, corresponding to the TC2, TC5, and TC6 thermocouple locations, respectively, as illustrated in Figure 1b, using an optical microscope (PMG, Olympus, Tokyo, Japan). The primary dendrite arm spacings (λ1) were measured at these positions (at least 15 measurements for each position) to estimate the evolution of the dendritic length scale. For the linear reciprocating sliding wear tests, disks of 9.9 mm diameter and 3.0 mm thickness were transversally extracted from the ingots at the same positions where TC2, TC5, and TC6 were located. All disc specimens were ground on one face using sandpapers (#220, 320, 400, 600, 1200 grit meshes), polished with alumina solutions (1.0 and 0.25 μm), cleaned in an ultrasonic bath for 3 min using ethanol, and dried using a hand-held hot-air device. The surface finish of the discs was measured with the surface roughness micrometer (Mitutoyo, Kawasaki, Japan, SJ-210 model, 0.002 μm precision), resulting in a superficial roughness <0.6 μm. Brinell hardness measurements, as recommended by the ASTM E10 standard test method [28], were carried in the transverse section of the ingots at the same thermocouple positions, using 2500 N test load, 5 mm ball diameter, and 30 s dwell time. The average values and standard deviations of six measurements are presented. Linear reciprocating sliding wear tests were performed according to the ASTM G133 standard test method [29] using 2 N normal applied load, 6 mm diameter counter body sphere (Zr-Y material, 1200 HV surface hardness), 50 Hz frequency, 1 mm stroke, 250 mm total sliding distance, 25 °C room temperature, and 60% humidity using a high-frequency reciprocation rig tribometer (HFRR 4.2, Ducom, Bangalore, India). All wear tests were performed in duplicate for each alloy and position (on the same face of the discs) and the average values of the coefficient of friction (COF) were determined.
3. Results and Discussion
3.1. Solidification Thermal Parameters
The thermal curves obtained from DTA analyses for the binary alloys are presented in Figure 2. During the heating of the alloys (red curves), it was noted one slight first peak at 544.7 °C for the Al–2.5Cu alloy (Figure 2a), corresponding to the temperature for the start of melting (Solidus temperature). This peak was observed for the Al–3.5Cu alloy at 544.1 °C (Figure 2b), while the Al–4.5Cu alloy showed this transformation at 543.1 °C (Figure 2c). Still considering the heating curves, the end of melting (corresponding to the Liquidus temperature) was given at 653.7, 649.6, and 648.0 °C for the Al–2.5Cu, Al–3.5Cu, and Al–4.5Cu alloys, respectively. As these curves are related to the heating step, the lowest endothermic peaks correspond to the melting point of the alloys. In all curves, the onset of these peaks ranging from 600 to 610 °C, which represents the temperature at which the material starts to melt. During the cooling of the alloys (blue curves), TL was determined at 650.7, 647.5, and 644.6 °C for the Al–2.5Cu, Al–3.5Cu, and Al–4.5Cu alloys, respectively. For the Al–3.5Cu alloy, an isolated unexpected peak was observed at 568.1 °C. Related to the Solidus temperature determined in the cooling curve (indicated by the second peak), the values were 544.4, 544.2, and 537.2 °C for the alloys with 2.5, 3.5, and 4.5%Cu contents, respectively. As mentioned by Jaradeh and Carlberg [30], it is typical to determine the Solidus temperature from the heating curve and the Liquidus temperature from the cooling curve due to the accuracy of the obtained values. However, in the present results insignificant differences between TL (<4 °C) and TS (<6 °C) during heating and cooling conditions were observed. The two transition points observed in the curves correspond to the formation of the primary α–Al phase (matrix) at TL and the eutectic microconstituent (α-Al + θ) at TS. In summary, for the binary alloys, the increase of alloy Cu content decreases both TL and TS.
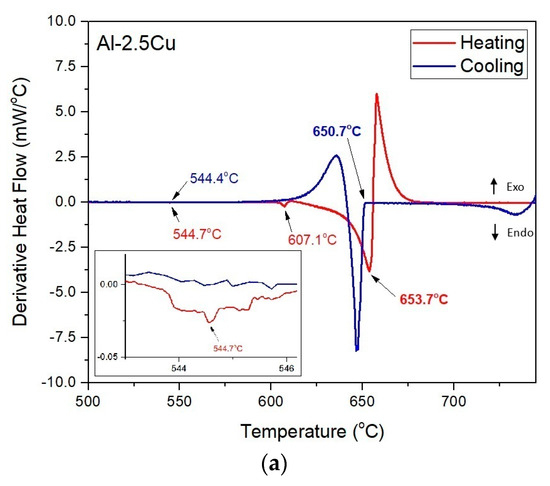
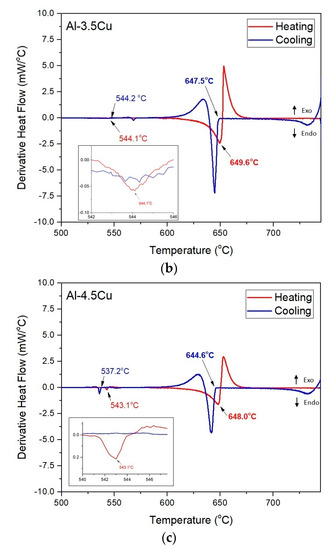
Figure 2.
DTA curves during heating and cooling: (a) Al–2.5Cu; (b) Al–3.5Cu; (c) Al–4.5Cu binary alloys.
Figure 3a–f show the results of the ternary alloys with 0.25 and 0.50%Cr contents. The alloys with 2.5%Cu indicated Liquidus temperature values of about 648.9 and 647.4 °C for the alloys with 0.25 and 0.50%Cr contents, respectively (Figure 3a,b). With the increase of the alloy Cu content to 3.5% (Figure 3c,d), the Liquidus temperature decreased from 646.8 to 643.3 °C to those alloys with 0.25 and 0.50%Cr, while the alloys with 4.5%Cu showed values of 644.8 and 643.9 °C with 0.25 and 0.50%Cr, respectively (Figure 3e,f). As observed, the temperature at the beginning of solidification (Liquidus temperature) decreased with the increase of Cu and Cr contents in the alloys. The influence of alloying elements on the Liquidus temperatures was more influenced in the case of Cu addition as compared to the addition of Cr.
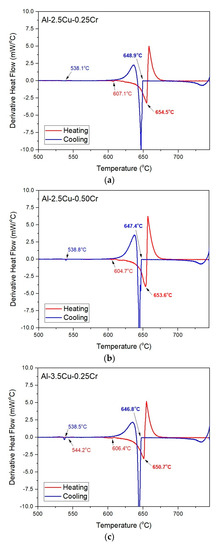
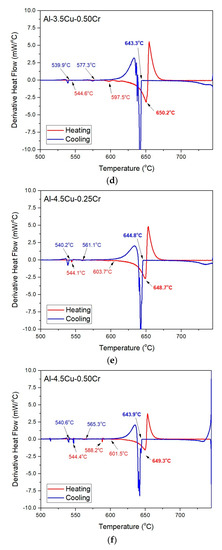
Figure 3.
DTA curves during heating and cooling: (a) Al–2.5Cu–0.25Cr; (b) Al–2.5Cu–0.50Cr; (c) Al–3.5Cu–0.25Cr; (d) Al–3.5Cu–0.50Cr; (e) Al–4.5Cu–0.25Cr; (f) Al–4.5Cu–0.50Cr ternary alloys.
As observed in Figure 3, additional peaks were detected in the solidification intervals. For the alloys with 2.5%Cu, during the heating step (red curves), peaks appeared at 607.1 and 604.7 °C when the alloy Cr content was 0.25 and 0.50%, respectively. For the alloys with 3.5%Cu, heating curves showed intermediate peaks at 606.4 and 597.5 °C for the alloys with 0.25 and 0.50%Cr. With 4.5%Cu content, the alloys with 0.25 and 0.50%Cr showed quasi-identical peaks to those alloys with lower Cu contents, with peaks at 603.7 and 601.5 °C in the heating curves. When considering the cooling curves, intermediate peaks were only observed for the Al–3.5Cu–0.25Cr, Al–4.5Cu–0.25Cr, and Al–4.5Cu–0.50Cr alloys, at 573.3, 561.1, and 565.3 °C, respectively. This can be attributed to the diffusion of alloying elements during cooling when the amount of Cu and Cr is higher than a critical value. Aluminum alloys with small Cu and Cr additions can precipitate secondary phases or intermetallic compounds at low temperatures, such as Al–Cr and Al–Cu–Cr, and if the Fe is present, Al–Fe–Cr and Al–Cu–Fe–Cr. However, the formation of these precipitates depends on the solidification conditions and solute diffusion characteristics [17,31].
The transformation enthalpies (ΔH) determined on the cooling curves are shown in Figure 4a–c. The values were calculated using the TRIOS software and considering the baseline type linear, onset type inflection, applying the command “Execute—Intelligent” in the tool “Analysis”. For the Al–2.5Cu–xCr alloys (Figure 4a), the observed values were 313.07, 334.92, and 341.02 J/g for those alloys with 0, 0.25, and 0.50%Cr, respectively, indicating an increase in enthalpy transformation during solidification with the increase of the alloy Cr content. The alloy with 0.50%Cr showed a second peak closed at 533 °C with an enthalpy value of about 2.06 J/g, demonstrating that this transformation is related to a small amount of the transformed material. The alloys with 3.5%Cu presented values of 307.28 J/g, with 0.25 and 0.50%Cr the values were 332.13, and 313.06 J/g, respectively (Figure 4b). Once again, secondary peaks were observed at temperatures of 537 °C indicating transformations with a small amount of the phases. For the Al–3.5Cu–xCr alloys, the enthalpies did not demonstrate a tendency as a function of the alloy Cr content. As the alloy Cu content increased to 4.5% (Figure 4c), the enthalpy value decreased to 188.84 J/g, and 326.41 and 283.36 J/g with 0.25 and 0.50%Cr, respectively. In general, the enthalpy values decreased more significantly with the increase of the alloy Cu content, and less with the alloy Cr content variation.
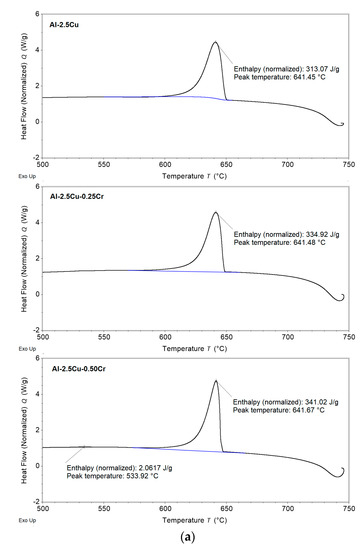
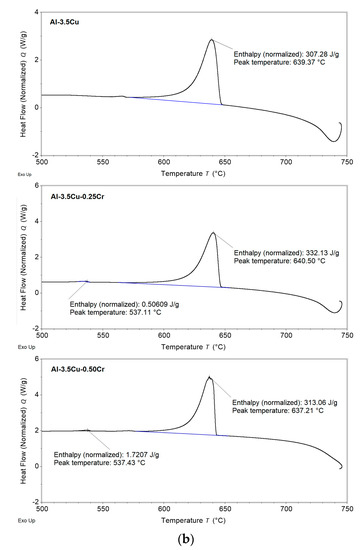
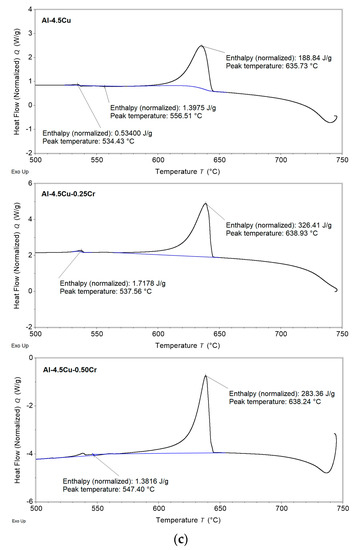
Figure 4.
Transformation enthalpies obtained from DTA curves during cooling: (a) Al–2.5Cu–xCr; (b) Al–3.5Cu–xCr; (c) Al–4.5Cu–xCr alloys. Blue lines: baseline.
3.2. Directional Solidification
Figure 5a,b show examples of the thermal profiles obtained during directional solidification of the Al–3.5Cu binary alloy and Al–3.5Cu–0.50Cr ternary alloy, respectively. Liquidus temperatures determined from DTA data during the cooling step are indicated by horizontal dashed lines on the graphs. The cooling rates ( for each thermocouple were determined in the time corresponding to the Liquidus temperature.
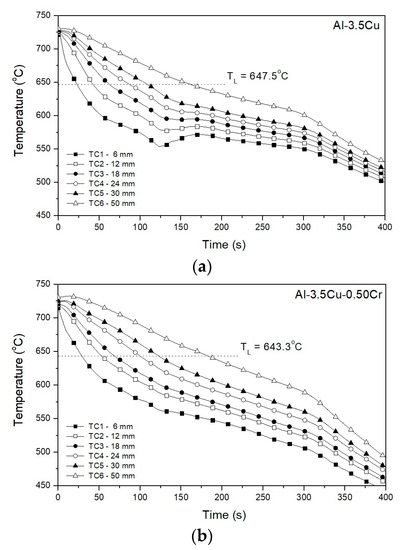
Figure 5.
Solidification thermal profiles: (a) Al–3.5Cu; (b) Al–3.5Cu–0.50Cr alloys.
The cooling rates determined during the solidification of ternary alloys with 0.25 and 0.50%Cr are shown in Figure 6a,b, respectively. The results showed that the variation of the alloy Cu content influences the cooling rate, decreasing as the Cu concentration increases. However, the cooling rate is slightly affected by the alloy Cr content, showing a tendency to increase as the Cr concentration increases from 0.25 to 0.50%. These observations agree with those reported in the literature for Al–Cu–Cr, Al–Fe–Cr, and Al–Si–Cr alloys with different Cr contents. With Al–3.8%Cu–(0.25 and 0.50)%Cr alloys, Ribeiro et al. [19] observed an increase in the liquid cooling rate with increasing Cr content. For Al–Fe alloys with 1, 2, and 3% Cr additions, Liu et al. [31] found that small additions of Cr increased both the cooling rate and the compositional undercooling during solidification. In the work reported by Rosso et al. [23] with hypoeutectic Al–Si alloys with small Cr additions (0.25 and 0.40%), it was observed that the cooling rates increased with the increase in the addition of Cr for alloys with lower Si content. However, it is important to note that the cooling rate during solidification depends not only on the chemical composition of the metal, but also on thermal parameters such as the liquid growth rate and liquid thermal gradient, the thermophysical properties of the metal and mold, the conditions of the metal/mold interface, and others [32,33,34,35,36,37,38,39].
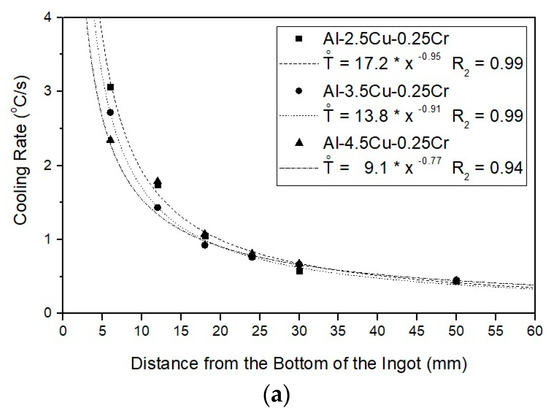
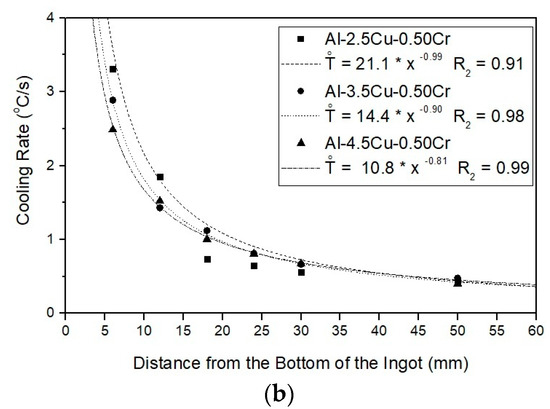
Figure 6.
Liquid cooling rates: (a) Al–xCu–0.25Cr; (b) Al–xCu–0.50Cr alloys.
3.3. Microstructure and Hardness
Longitudinal section macrographs of the ingots showed a complete columnar macrostructure in all alloys, with fine grains at the bottom of the ingots (under high cooling rates) and coarse grains close to the top of the ingots (under low cooling rates). An example is shown in Figure 7a for the Al–4.5Cu–0.50Cr alloy, which is the most critical alloy composition for exhibiting a columnar-to-equiaxed transition in the macrostructure. In Figure 7b, the microstructures of the Al–3.5Cu–0.25Cr alloy at the positions corresponding to the thermocouples TC2, TC5, and TC6 (located at 12, 30, and 50 mm from the bottom of the ingot, respectively) are shown. The solidified microstructure is composed of a directional cellular/dendritic matrix (primary α–Al phase) and a eutectic microconstituent (α–Al phase + θ) in the interdendritic regions. At high cooling rates (near the bottom of the ingot) the microstructure is predominately cellular. As the distance from the bottom increases (with low cooling rates), the microstructure changes to a dendritic morphology. Isolated Al–Cr particles were not observed in all samples, evidencing that the Cr concentration of the investigated alloys was insufficient to precipitate this type of compound. This behavior is similar to that reported by Liu et al. [31] with Al–Fe–Cr alloys.
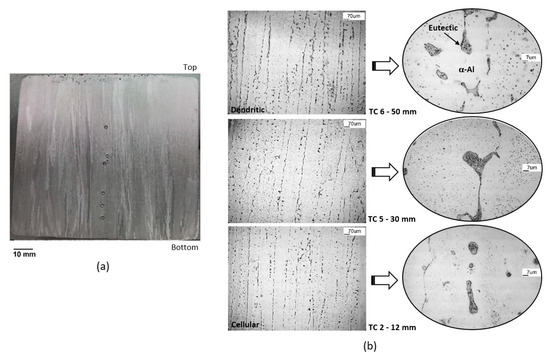
Figure 7.
(a) Macrostructure of the Al–4.5Cu–0.50Cr alloy, and (b) microstructures of the Al–3.5Cu–0.25Cr alloy at 12 mm, 30 mm, and 50 mm from the bottom of the ingot: left side (100×), right side (500×).
Figure 8 shows typical microstructures of the other alloys, at different magnifications to emphasize microstructure details. As observed, the solidified microstructure becomes more dendritic as alloying elements and cooling rates increase, as well as the distance from the bottom of the ingots. For the Al–2.5Cu–xCr alloys, a predominantly cellular microstructure was observed up to 30 mm (TC2 and TC5 positions), with a cellular/dendritic transition at 50 mm from the bottom of the ingot. When the alloy Cu contents were increased to 3.5% and 4.5%, the cellular/dendritic transition occurred at 30 mm, with complete cellular microstructure up to 12 mm and predominant dendritic microstructure after 30 mm. In all alloys, no evidence of macrosegregation was detected in the Cu and Cr profiles, since the chemical composition measurements carried out in the positions corresponding to the thermocouples TC2, TC5, and TC6 showed similar values.
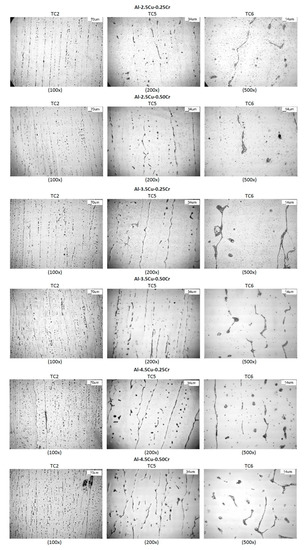
Figure 8.
Optical micrographs of the alloys at different magnifications.
In order to correlate the as-cast microstructures with the cooling rates, the primary dendrite arm spacings (λ1) as a function of the cooling rates were plotted in Figure 9a,b for the ternary alloys with 0.25 and 0.50%Cr contents, respectively. A trend of increasing λ1 with decreasing cooling rate and increasing alloying elements was noted, especially for alloys with 0.25%Cr. The highest value of λ1 was observed at the lowest cooling rate (~0.4 °C/s) for all alloys. Furthermore, alloys with 0.50%Cr showed a smaller variation of λ1 when compared to alloys with 0.25%Cr.
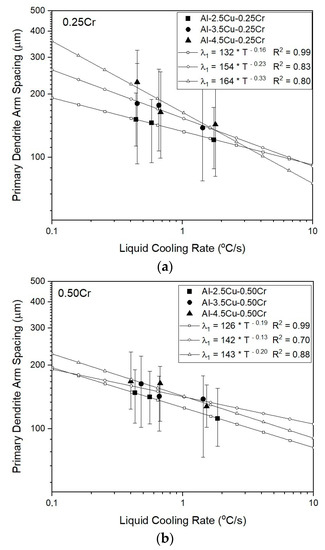
Figure 9.
Primary dendrite arm spacing as a function of the liquid cooling rate of the alloy ingots: (a) Al–xCu–0.25Cr; (b) Al–xCu–0.50Cr.
Brinell hardness measurements obtained along the length of the ingots are shown in Figure 10a–c. All alloys showed similar behavior, with an increase in hardness with an increase in Cu and Cr alloying elements and a decrease with an increase in the distance from the bottom of the ingots. This behavior may be associated with the refinement of the dendritic arm spacing, which minimizes dislocation movement during plastic deformation and improves mechanical strength. The Brinell hardness of the alloys with 2.5%Cu reached the maximum value of 47 HB for the alloy with 0.50%Cr in the position close to the bottom of the ingot, while the minimum value was observed for the binary Al–2.5%Cu alloy at the 50 mm position, with a value of 37.5 HB. The addition of Cu and Cr alloying elements increased the hardness of the alloys, with the maximum value observed for the alloy with 4.5%Cu and 0.50%Cr.
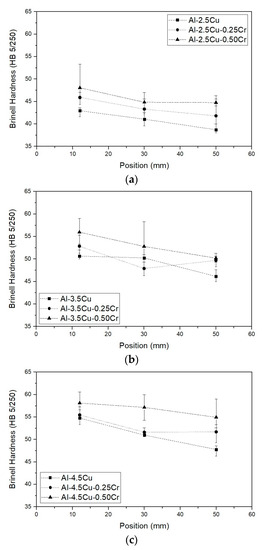
Figure 10.
Variation of Brinell hardness with position along the length of the alloy ingots: (a) Al–2.5Cu–xCr; (b) Al–3.5Cu–xCr; (c) Al–4.5Cu–xCr.
3.4. Sliding Wear Responses
The wear tests were performed in duplicate. As examples, Figure 11a shows the duplicate results obtained for the binary Al–2.5Cu alloy, in the position corresponding to the thermocouple TC2 (12 mm from the bottom of the ingot), while Figure 11b presents the behavior of the ternary Al–4.5Cu–0.25Cr alloy at 50 mm from the bottom, corresponding to the position of TC6. The results exhibited similar behavior in both runs with some fluctuation during testing. An initial transient regime was observed at the first sliding distance, followed by a quasi-steady-state behavior until the end of the test. In general, the additions of Cu and Cr to the alloys resulted in a decrease in COF, regardless of the positions. As noted, the results showed that repeatability was achieved, with result variations of less than 5% for different alloys and test conditions.
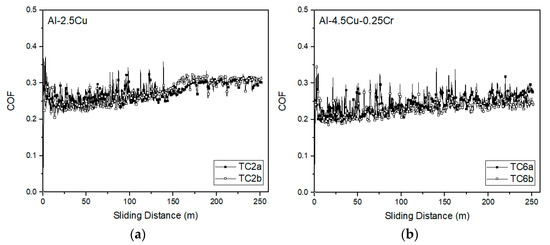
Figure 11.
Coefficient of friction (COF) as a function of sliding distance and thermocouple position: (a) Al–2.5Cu alloy—TC2 (thermocouple at 12 mm); (b) Al–4.5Cu–0.25Cr alloy—TC6 (thermocouple at 50 mm).
Figure 12 shows a summary of the COF results obtained for the binary alloys, while the results for the ternary alloys are depicted in Figure 13. As observed in Figure 12, the Al–2.5Cu alloy showed an increased COF as the distance from the bottom of the ingot increased, as a consequence of the coarsening of the microstructure. Furthermore, a higher variation during the tests was noted for those positions near the top of the ingot. For the Al–3.5Cu alloy, the initial transient regime was observed with lower COF values in relation to the Al–2.5Cu alloy, increasing slightly during the tests and with the distance. As the alloy Cu content increased to 4.5%, the COF decreased for all thermocouple positions, with similar values and reduced variation during the tests.
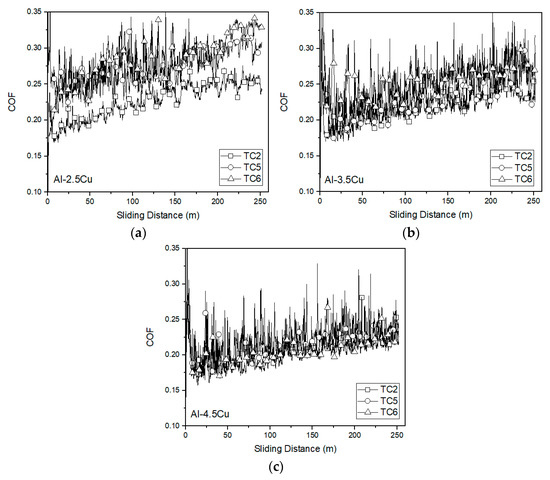
Figure 12.
Coefficient of friction (COF) as a function of sliding distance for binary alloys: (a) Al–2.5Cu; (b) Al–3.5Cu; (c) Al–4.5Cu.

Figure 13.
Coefficient of friction (COF) as a function of sliding distance for ternary alloys: (a) Al–2.5Cu–0.25Cr and Al–2.5Cu–0.50Cr; (b) Al–3.5Cu–0.25Cr and Al–3.5Cu–0.50Cr; (c) Al–4.5Cu–0.25Cr and Al–4.5Cu–0.50Cr.
With Cr additions (Figure 13), COF decreased with the increase in the Cr content for the alloys with higher Cu content and remained almost constant for the lower Cu-containing alloys. As also observed during the tests with the binary alloy, there were some fluctuations due to the heterogeneous as-cast microstructure, with the presence of interdendritic microporosity and precipitates. The highest COF fluctuation was observed in the alloy with 4.5%Cu and 0.50%Cr in positions with coarser microstructures.
The calculated wear volume loss at different thermocouple positions is shown in Figure 14. An image analyzer was used to determine the average cross-sectional area of the ellipsoid wear track and to calculate the wear volume considering the length of the stroke, as suggested in ASTM G 133 standard test method [29]. These values are the average of duplicate tests. Analyzing the results in Figure 14b–d, it can be noted that the alloys with 2.5% Cu showed a slight increase in the wear volume along the length of the ingots. An exceptionally high value was observed for the binary Al–2.5Cu alloy at the position corresponding to the TC2 thermocouple (30 mm) probably due to the presence of microporosity. In the alloys with 3.5%Cu, regardless of the percentage of Cr, the wear volume showed similar values in all positions. In the 4.5% Cu alloys, a tendency to decrease the wear volume loss was observed as the percentage of Cr and the distance from the bottom of the ingot increased.
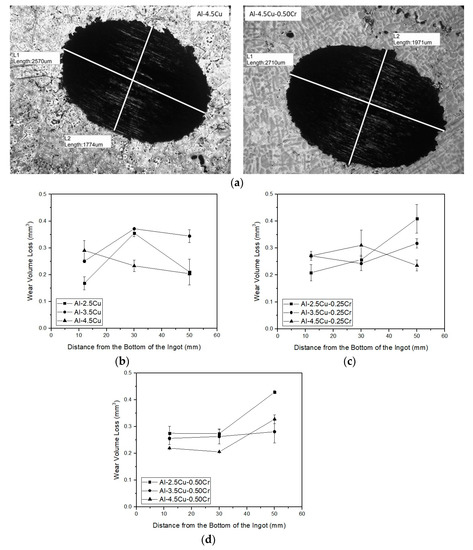
Figure 14.
(a) Examples of wear track surfaces of the Al–4.5Cu and Al–4.5Cu–0.50Cr alloys; average wear volume loss as a function of the distance of the bottom of the ingots for all alloys: (b) Al–xCu, (c) Al–xCu–0.25Cr, and (d) Al–xCu–0.50Cr.
Since hypoeutectic Al–Cu alloys with a Cu content lower than 5.65 (wt.%) can be subjected to precipitation-hardening heat treatments (solutioning and natural or artificial aging steps), improved mechanical, corrosion, wear, and thermal properties can be achieved [40] with the use of small Cr additions to form new secondary phases or intermetallic precipitates depending on the Cu–Cr ratios. The present results provide an insight into the correlation between solidification conditions, microstructural formation and some mechanical properties, allowing for future investigations of the behavior after heat treatments.
4. Conclusions
The following main conclusions can be drawn based on the experimental results obtained in this study:
- -
- Additions of Cu and Cr decreased the Liquidus temperatures (from 648.9 and 647.4 °C for the Al–2.5Cu alloys with 0.25 and 0.50%Cr, respectively, to 644.8 and 643.9 °C for the Al–4.5Cu alloys with 0.25 and 0.50%Cr, respectively) and the enthalpies of transformation of the alloys;
- -
- The addition of Cu significantly affected cooling rates, decreasing as the Cu content increased, from 3.1 °C/s (Al–2.5Cu–0.25Cr alloy) to 2.3 °C/s (Al–4.5Cu–0.25Cr alloy), and from 3.3 °C/s (Al–2.5Cu–0.50Cr alloy) to 2.5 °C/s (Al–4.5Cu–0.50Cr alloy) at those positions close to the bottom of the ingots). On the other hand, higher Cr contents increased cooling rates;
- -
- When comparing alloys with the same Cu content, Cr addition improved hardness, especially for lower Cu-containing alloys (≅10% at those positions near the bottom of the ingots). In all alloys, hardness decreased with increasing λ1;
- -
- Additions of Cu and Cr to the alloys resulted in a slight decrease in COF, with average values ranging from 0.30 to 0.20. Analyzing individually the effect of Cu and Cr additions on the wear volume loss, insignificant changes were observed, regardless of microstructure refinement. However, it is important to note that, when analyzed together, there is a tendency of decreasing wear volume loss with the coarsening of the microstructure.
Author Contributions
Conceptualization, C.A.d.S.; methodology, R.V.L., A.M.S.M. and T.V.P.; investigation, R.V.L., A.M.S.M., T.V.P., E.M.d.C. and C.A.d.S.; writing—original draft preparation, R.V.L., A.M.S.M., T.V.P., E.M.d.C. and C.A.d.S.; writing—review and editing, E.M.d.C. and C.A.d.S., funding acquisition, C.A.d.S. All authors have read and agreed to the published version of the manuscript.
Funding
This research was funded by CNPq (National Council for Scientific and Technological Development: grant: 403303/2016-8) and FINEP (Financiadora de Estudos e Projetos: grant: 0082/16).
Data Availability Statement
No new data were created or analyzed in this study. Data sharing is not applicable to this article.
Acknowledgments
The authors acknowledge the support provided by CNPq (National Council for Scientific and Technological Development: grant: 403303/2016-8), FINEP (Financiadora de Estudos e Projetos: grant: 0082/16), and PUCRS (Pontifícia Universidade Católica do Rio Grande do Sul). This study was also financed in part by the Coordenação de Aperfeiçoamento de Pessoal de Nível Superior—Brasil (CAPES)—Finance Code 001.
Conflicts of Interest
The authors declare no conflict of interest.
References
- Mondolfo, L.F. Aluminum Alloys: Structure and Properties, 1st ed.; Butterworth-Heinemann: Oxfordshire, UK, 1976; 971p. [Google Scholar]
- Kim, H.T.; Nam, S.W.; Hwang, S.H. Study on the solidification cracking behaviour of high strength aluminum alloy welds: Effects of alloying elements and solidification behaviours. J. Mater. Sci. 1996, 31, 2859–2864. [Google Scholar] [CrossRef]
- Rana, R.S.; Purohit, R.; Das, S. Reviews on the Influences of Alloying elements on the Microstructure and Mechanical Properties of Aluminum Alloys and Aluminum Alloy Composites. Int. J. Sci. Res. Publ. 2012, 2, 1–7. [Google Scholar]
- Razumovskiy, V.I.; Ruban, A.V.; Razumovskii, I.M.; Lozovoi, A.Y.; Butrim, V.N.; Vekilov, Y.K. The effect of alloying elements on grain boundary and bulk cohesion in aluminum alloys: An ab initio study. Scr. Mater. 2011, 65, 926–929. [Google Scholar] [CrossRef]
- Zakharov, V.V. About alloying of aluminum alloys with transition metals. Met. Sci. Heat Treat. 2017, 59, 67–71. [Google Scholar] [CrossRef]
- Dorin, T.; Ramajayam, M.; Lamb, J.; Langan, T. Effect of Sc and Zr additions on the microstructure/strength of Al-Cu binary alloys. Mater. Sci. Eng. A 2017, 707, 58–64. [Google Scholar] [CrossRef]
- Kaufman, J.G.; Rooy, E.L. Aluminum Alloy Castings: Properties, Processes, and Applications, 1st ed.; ASM International: Novelty, OH, USA, 2004. [Google Scholar]
- Kimura, T.; Nakamoto, T.; Ozaki, T.; Miki, T. Microstructures and mechanical properties of aluminum-transition metal binary alloys (Al-Fe, Al-Mn, and Al-Cr) processed by laser powder bed fusion. J. Alloys Compd. 2021, 872, 159680. [Google Scholar] [CrossRef]
- Predel, B. Al-Cr (Aluminum-Chromium) Datasheet from Landolt-Börnstein-Group IV Physical Chemistry. In “Ac-Ag... Au-Zr”-Phase Equilibria, Crystallographic and Thermodynamic Data of Binary Alloys; Springer Materials: Cham, Switzerland, 2006; Volume 12A. [Google Scholar] [CrossRef]
- Chen, H.; Wang, Q.; Wang, Y.; Qiang, J.; Dong, C. Composition rule for Al–transition metal binary quasicrystals. Philos. Mag. 2010, 90, 3935–3946. [Google Scholar] [CrossRef]
- Grushko, B.; Przepiórzyński, B.; Pavlyuchkov, D.; Mi, S.; Kowalska-Strzęciwilk, E.; Surowiec, M. Complex intermetallics in Al–Cu–Cr system. J. Alloys Compd. 2007, 442, 114–116. [Google Scholar] [CrossRef]
- Sugiyama, K.; Saito, H.; Hiraga, K. On the crystal structures of the Al–Cu–Cr alloy system. J. Alloys Compd. 2002, 342, 148–152. [Google Scholar] [CrossRef]
- Grushko, B. A contribution to the Al–Cu–Cr phase diagram. J. Alloys Compd. 2017, 729, 426–437. [Google Scholar] [CrossRef]
- Sviridova, T.A.; Schevchukov, A.P.; Shelekhov, E.V.; Diakonov, D.L.; Tcherdyntsev, V.V.; Kaloshkin, S.D. The quasicrystalline phaseformation in Al–Cu–Cr alloys produced by mechanicalalloying. J. Alloys Compd. 2011, 509S, S299–S303. [Google Scholar] [CrossRef]
- Fu, Y.; Kang, N.; Liao, H.; Gao, Y.; Coddet, C. An investigation onselective laser melting of Al–Cu–Fe–Cr quasicrystal: Fromsingle layer to multilayers. Intermetallics 2017, 86, 51–88. [Google Scholar] [CrossRef]
- Salimon, A.L.; Shevchukov, A.P.; Stepashkin, A.A.; Tcherdyntsev, V.V.; Olifirov, L.K. Mechanical alloying as a solid state route forfabrication of Al–Cu–M(=Fe, Cr) quasicrystalline phases. J. Alloys Compd. 2017, 707, 315–320. [Google Scholar] [CrossRef]
- El-Nasser, G.A.; Samy, S.M.; Nassef, A. Effect of chromium additions on formability and mechanical behavior of Al-Cu alloy. In Proceedings of the 10th International Mining, Petroleum, and Metallurgical Engineering Conference, Suez, Egypt, 6–8 March 2007; pp. 84–94. [Google Scholar]
- Ravikumar, A.; Sellamuthu, R.; Saravanan, R. Effect of Cr addition on mechanical properties and wear rate of cast Al–Cu alloy. Indian J. Sci. Technol. 2016, 9, 34. [Google Scholar] [CrossRef]
- Ribeiro, T.M.; Catellan, E.; Garcia, A.; Santos, C.A. The effects of Cr addition on microstructure, hardness and tensile properties of as-cast Al–3.8wt.%Cu–(Cr) alloys. J. Mater. Res. Technol. 2020, 9, 6620–6631. [Google Scholar] [CrossRef]
- Amer, S.M.; Glavatskikh, M.V.; Barkov, R.Y.; Loginova, I.S.; Pozdniakov, A.V. Effect of Cr on the Microstructure and Mechanical Properties of the Al-Cu-Y-Zr Alloy. Metals 2023, 13, 349. [Google Scholar] [CrossRef]
- Monti, C.; Turani, M.; Papis, K.; Bambach, M. A new Al-Cu alloy for LPBF developed via ultrasonic atomization. Mater. Des. 2023, 229, 111907. [Google Scholar] [CrossRef]
- Ache, C.T.; Lopes, M.M.; Reis, B.P.; Garcia, A.; Santos, C.A. Dendritic Spacing/Columnar Grain Diameter of Al–2Mg–Zn Alloys Affecting Hardness, Tensile Properties, and Dry Sliding Wear in the As-Cast/Heat-Treated Conditions. Adv. Eng. Technol. 2020, 22, 1901145. [Google Scholar] [CrossRef]
- Rosso, E.; Santos, C.A.; Garcia, A. Microstructure, Hardness, Tensile Strength, and Sliding Wear of Hypoeutectic Al–Si Cast Alloys with Small Cr Additions and Fe-Impurity Content. Adv. Eng. Mater. 2021, 24, 2001552. [Google Scholar] [CrossRef]
- Quaresma, J.M.V.; Santos, C.A.; Garcia, A. Correlation between unsteady-state solidification conditions, dendrite spacings, and mechanical properties of Al-Cu alloys. Metall. Mater. Trans. A 2000, 31, 3167–3178. [Google Scholar] [CrossRef]
- Reis, B.P.; Lopes, M.M.; Garcia, A.; Santos, C.A. The correlation of microstructure features, dry sliding wear behavior, hardness and tensile properties of Al-2wt%Mg-Zn alloys. J. Alloys Compd. 2018, 764, 267–278. [Google Scholar] [CrossRef]
- ASTM E3; Standard Guide for Preparation of Metallographic Specimens. ASTM International: West Conshohocken, PA, USA, 2017. [CrossRef]
- ASTM E407; Standard Practice for Microetching Metals and Alloys. ASTM International: West Conshohocken, PA, USA, 2015. [CrossRef]
- ASTM E10; Standard Test Method for Brinell Hardness of Metallic Materials. ASTM International: West Conshohocken, PA, USA, 2018. [CrossRef]
- ASTM G133; Standard Test Method for Linearly Reciprocating Ball-on-Flat Sliding Wear. ASTM International: West Conshohocken, PA, USA, 2010. [CrossRef]
- Jaradeh, M.; Carlberg, T. Differential thermal analysis and differential scanning calorimetry studies of aluminum 3003 alloys with Zn and Cu additions. Metall. Mater. Trans. A 2007, 38, 2138–2147. [Google Scholar] [CrossRef]
- Liu, B.; Yang, X.G.; Huang, H.J.; Guo, Z. The effect of alloying elements on the microstructure of Al–5Fe alloys. J. Miner. Metals Mater. Soc. 2012, 64, 316–322. [Google Scholar] [CrossRef]
- Santos, C.A.; Quaresma, J.M.V.; Garcia, A. Determination of transient interfacial heat transfer coefficients in chill mold castings. J. Alloys Compd. 2001, 319, 174–186. [Google Scholar] [CrossRef]
- Santos, C.A.; Siqueira, C.A.; Garcia, A.; Quaresma, J.M.V.; Spim, J.A. Metal–mold heat transfer coefficients during horizontal and vertical Unsteady-State solidification of Al–Cu and Sn–Pb Alloys. Inv. Probl. Sci. Eng. 2004, 12, 279–296. [Google Scholar] [CrossRef]
- Souza, E.N.; Cheung, N.; Santos, C.A.; Garcia, A. Factors affecting solidification thermal variables along the cross-section of horizontal cylindrical ingots. Mater. Sci. Eng. A 2005, 397, 239–248. [Google Scholar] [CrossRef]
- Alfaia, M.Â.O.; Oliveira, R.; Lima, T.S.; Mariani, F.E.; Casteletti, L.C.; Cheung, N.; Garcia, A. Effects of cooling rate and microstructure scale on wear resistance of unidirectionally solidified Al-3.2wt.%Bi-(1; 3) wt.%Pb alloys. Mater. Today Comm. 2020, 25, 101659. [Google Scholar] [CrossRef]
- He, C.; Yu, W.; Li, Y.; Wang, Z.; Wu, D.; Xu, G. Relationship between cooling rate, microstructure evolution, and performance improvement of an Al–Cu alloy prepared using different methods. Mater. Res. Express 2020, 7, 116501. [Google Scholar] [CrossRef]
- Júnior, P.F.; de Olivé Ferreira, L.; Garção, W.J.L.; de Paula Almeida, R.; Melo, C.M.; Ferreira, A.F. Heat-flow parameters affecting microstructure and mechanical properties of Al–Cu and Al–Ni alloys in directional solidification: An experimental comparative study. Int. J. Mater. Res. 2022, 113, 181–193. [Google Scholar] [CrossRef]
- Stapóri, S.; Górny, M.; Kawalec, M.; Gracz, B. Effect of manganese content on microstructure of Al-Cu alloys. Arch. Metall. Mater. 2020, 65, 1377–1383. [Google Scholar] [CrossRef]
- Wang, J.; Yang, Z.; Ma, Z.; Bai, Y.; Duan, H.; Tao, D.; Shi, G.; Zhang, J.; Wang, Z.; Li, J. Influence of cerium content on the microstructure and thermal expansion properties of suction cast Al-Cu-Fe alloys. R. Soc. Open Sci. 2021, 8, 210584. [Google Scholar] [CrossRef] [PubMed]
- Czerwinski, F. Thermal stability of aluminum alloys. Materials 2020, 13, 3441. [Google Scholar] [CrossRef]


Disclaimer/Publisher’s Note: The statements, opinions and data contained in all publications are solely those of the individual author(s) and contributor(s) and not of MDPI and/or the editor(s). MDPI and/or the editor(s) disclaim responsibility for any injury to people or property resulting from any ideas, methods, instructions or products referred to in the content. |
© 2023 by the authors. Licensee MDPI, Basel, Switzerland. This article is an open access article distributed under the terms and conditions of the Creative Commons Attribution (CC BY) license (https://creativecommons.org/licenses/by/4.0/).