Article

Optimization of a Certain Type of Aero-Engine Three-Tooth Mortise and Tenon Joint Structure against Fretting Fatigue

1
AECC Hunan Aviation Powerplant Research Institute, Zhuzhou 412002, China
2
College of Energy and Power Engineering, Nanjing University of Aeronautics and Astronautics, Nanjing 210016, China
*
Author to whom correspondence should be addressed.
Metals 2023, 13(6), 1116; https://doi.org/10.3390/met13061116
Submission received: 18 April 2023 / Revised: 7 June 2023 / Accepted: 9 June 2023 / Published: 13 June 2023
(This article belongs to the Section Metal Failure Analysis)

Abstract

:
In turbine tenon joint structures, fretting fatigue is common and can have detrimental effects on the components. To increase the fretting fatigue life, the design of tenon joint structures must be optimized. A parametric model of the three-tooth mortise and tenon joint structure is developed in this research. Sensitivity analysis yields the primary characteristic parameters, which are then employed as design variables. The objective function is the life of fretting fatigue. An aero-engine turbine three-tooth mortise and tenon joint structure was optimized against fretting fatigue using a Multi-Island Genetic Algorithm (MIGA), which was then experimentally verified. The optimization was based on the multidisciplinary optimization platform ISIGHT to write batch files integrating ANSYS and MATLAB. According to the findings, the three-tooth mortise and tenon joint structure’s fretting fatigue life can be increased by 51.3% by applying the MIGA. The contact pressure was reduced by 0.54% and the maximum slip amplitude has been reduced by 13%. The approach of optimization’s efficacy was confirmed.

1. Introduction

Under the influence of alternating stresses, fretting develops on the surfaces of some nominally secured connection systems. In other words, the contact surface will have demonstrate small-distance sliding [1,2]. Fretting fatigue is commonly understood to be the development of surface cracks as a result of the combined action of surface damage and external working stress, followed by the cracks’ progressive growth and eventual fracture of the member [3]. Fretting is a relatively typical phenomenon in engineering practice. For instance, fretting fatigue frequently happens in riveted joints, bearings, bolted connections, and other structures and can considerably shorten their service lives.
Engine performance requirements have been rising in recent years, and one of the key performance indicators is a long service life. As a result, the fatigue problem is becoming more and more crucial. The fretting fatigue problem has gradually come to be recognized as a significant subset of the fatigue problem. The clamping rivets of the fuselage and engine blades are two examples of airplane parts that degrade due to fretting fatigue.
The optimal layout of the tenon and mortise joint structure between the engine blade and the blade disc is currently the subject of extensive study both domestically and internationally. For each pair of tenon teeth, Zong et al. [4] used distinct tooth-shape parameters in two-dimensional parametric modeling. The maximum equivalent stress was reduced by 19.93% and the stress distribution for each tooth was made more uniform as a result of the experimental design method’s selection and optimization of the factors that have the greatest impact on it. Hao et al. [5] proposed and established a coordinate correlation method suitable for optimal design modeling, and applied it to the optimal design of aero-engine mortise and tenon joint structures. 790 geometric modelling runs were completed at the time of optimization without any problems. The inability to generate a structural model due to changes in geometry was avoided. Yu et al. [6] used the superellipse function to simulate the fir-tree configuration, defining the superellipse’s characteristic properties as design variables. The objective function is to minimize the p-norm of the nodal stress rather than the maximum stress to minimize repetitive oscillations and speed up convergence. It is shown that the method is effective in locating an optimal structure with improved stress distribution and reduced stress concentration using the P-series fir-tree root design as an example. They also model the fir-tree root using a spline curve [7]. Geometric constraints can be obtained from industrial cases. The horizontal positions of a number of specified control points in the plane of symmetry are defined as design variables, and the minimum value of the maximum Von-Mises stress, rather than the minimum value of the plastic strain, is used as the objective function. The Multi-Island Genetic Algorithm (MIGA) was employed. Finally, a root structure for a fir-tree was created with improved stress distribution and lower stress concentration. Based on static strength and lifetime reliability, You et al. [8] optimized the design of the double-spoke plate turbine disk/tenon structure. The overall fatigue life of the turbine disk/tenon structure has increased by 47.28% since optimization, exceeding the design requirement for wheel reliability life while reducing mass by 3.43%, in addition to the 16.66% mass reduction from the wheel static strength optimization. The Drosophila optimization approach was utilized by Chen, C.Y. et al. [9] to extend the average fatigue life of the blade and wheel disc by 3.24% and 1.93%, respectively, and narrow the probability interval by 10.13% and 8.16%. The impeller structure’s fatigue life toughness has also been increased. Dmitry Sapronov et al. [10] used the ANSYS software module to optimize the dovetail joint structure based on the zero-order subproblem approximation method with the objective function of minimizing the first principal stress at the root of the leaf. Yang et al. [11] established an integrated structural design optimization system for turbine tenon slots, and the results showed that the integrated optimization design resulted in a significant improvement in turbine blade/blade disc performance. Tao et al. [12] used the minimum total mass of the mortise structure as the optimization objective and the critical stress of the mortise structure as the constraint to optimize the turbine mortise structure. The total mass of the optimized turbine mortise structure was reduced by 10.96% compared with that before optimization. Niu et al. [13] used the interpolation method, the probabilistic cumulative fatigue life method and the Kriging agent model to optimize the design of the structural reliability of the leaf disc by combining the life prediction results. The results showed that the fatigue life of the leaf discs by the above three methods was improved by 27%, 1.4% and 108%, respectively. Yan et al. [14] used a dovetail joint as the research object, took the main characteristic parameters as the design parameters and the fretting fatigue life as the objective function, and completed the optimal design of the dovetail joint. Using Non-Linear Programming by Quadratic Lagrangian (NLPQL) and MIGA, respectively, they improved the fretting fatigue life of the dovetail joint and improved the stress distribution of the structure at the same time. Du et al. [15] used the B spline curve method to optimize the mortise and tenon structure to address the life bottleneck problem of structural parts caused by the stress concentration in the aero-engine pan and mortise. The optimized structure reduces the maximum stress by 45% and increases the low cycle fatigue life by 36 times. Yu et al. [16] developed three finite element analysis (FEA) models of a typical turbine disk-blade system (TDS) based on the tenon structure. Three types of contact conditions, including bonded, frictionless and frictional conditions, were used to simulate the contact between the turbine disc and the blades. According to the comparison between FEA and experimental modal analysis (EMA) results, the most accurate model is the frictional contact FEA model. Tan et al. [17] proposed an arc tenon connection structure and its fretting fatigue was analyzed by using the finite element (FE) method. The result shows that the arc tenon structure can decrease the stress concentration, and thus effectively improve the fretting fatigue performance.
For the analysis of fretting fatigue, Xu et al. [18] analyzed the variation in contact stress and strain in dovetail joint structures. The fatigue damage parameters CCB, FS, MSSR and SWT of the multi-axis critical fatigue plane method are introduced in the study of the prediction of fatigue life of dovetail joint structures based on the principle of multi-axis fatigue critical damage planes. The predicted life is compared with the test life. It is shown that the life prediction model based on the critical plane method has good predictive capability. Shi et al. [19] combined the critical plane method and fretting damage mechanism. They proposed a fretting damage parameter with the following components: the surface condition influence coefficient, strain amplitude, contact half-width, slip amplitude, equivalent force, and normal stress. They also established the corresponding fretting fatigue life prediction model and tested the validity of the life prediction. Wang et al. [20] created a high-temperature fretting fatigue test loading device with a dovetail structure and tested the TC11 titanium alloy under these conditions at 200 °C and 500 °C. The test results demonstrate a more pronounced effect of the temperature environment on the fretting fatigue life. Yan et al. [21] proposed a method for the design of fretting-fatigue-simulated parts for mortise and tenon joint structures based on the consistency of damage control parameters. On the basis of geometrical similarity, the consistency of the equivalent force distribution within the maximum relative slip distance and the critical distance was ensured, and the rationality of this method was verified by fretting fatigue tests. Qu et al. [22] investigated the fretting fatigue behavior of a dovetail specimen at 630 °C through experiment and numerical simulation. The calculated area of maximum contact pressure gradient through the finite element method was in good agreement with the experimental position of the initial fretting fatigue cracks. Hu et al. [23] designed a sub-scale specimen and its structure and tested it under cyclic loading at three load levels. The stress distribution in the contact zone was calculated, the direction and location of crack sprouting was predicted using SWT and FS parameters, and the sprouting life was predicted. The test piece’s fretting fatigue life will steadily decrease as the test temperature rises. In order to analyze the fretting fatigue life of mortise and tenon joint structures at various temperatures, Wu et al. [24] developed a high-temperature fretting fatigue life prediction model based on the damage mechanics of the connecting medium (NLCD). The errors in the predicted life compared to the test life were within a factor of two error bands, demonstrating the validity of the life prediction model. According to research by Zhang et al. [25], laser quenching hardening had a more noticeable impact at low-stress levels than it did at high-stress levels on the fretting fatigue characteristics of theTC11 alloy. The traditional SWT (Smith–Watson–Topper) parameter was updated and utilized to describe the fretting fatigue life of the TC11 alloy after hardening. The variation in the elastic modulus of the hardened layer was also taken into consideration. Yang et al. [26] looked at how TC11’s fretting fatigue properties were affected by laser impact strengthening. The findings of the experiment demonstrated that the specimens’ fretting fatigue life was greatly increased by the laser surface treatment, with the highest improvement occurring at 4.8 GW/cm2. Xing et al. [27] tested the ZSGH4169 nickel-based high-temperature alloy’s tenon joint structure for fretting fatigue under various loads and temperatures, while also examining the direction in which the joint structures for the mortise and tenon break under fretting fatigue. A high-temperature fretting fatigue life prediction model that takes surface hardness into account was developed at the same time [28], and fretting fatigue experiments on a double-tooth tenon joint structure were used to confirm the correctness of the life prediction results. Xu et al, [29] using a titanium alloy Ti-6Al-4V dovetail joint structure as an example and extended fretting fatigue life as a function of crack length was established. The extended fretting fatigue life was predicted based on the crack end value length. The predicted results are in good agreement with the tests.
The majority of the previous study findings were geared toward lowering the stress level at the mortise and tenon joint structure’s stress concentration location in order to improve the stress distribution, and hence contribute to longer fatigue life. The optimization of the contact surface’s fretting fatigue has received little investigation. In other words, fewer studies have been carried out to optimize the use of fretting fatigue life assessment methods. Due to the presence of preload in the assembly, the contact surface in the mortise and tenon joint will fret when the blade tenon section slides outward at the beginning under the influence of high-frequency pneumatic force or strong centrifugal force. The majority of fretting movement fatigue in the mortise and tenon joint structure of rotating components is caused by fretting movement, which accelerates the wear of the contact material [30].
In this paper, we parametrically model a simulated portion of an aero-engine turbine three-tooth mortise and tenon joint structure and then analyze the key structural parameters affecting the fretting fatigue life. We then use these parameters as design variables to improve the fretting fatigue life of this tenon joint structure for the design of an aero-engine turbine three-tooth mortise and tenon joint structure.
Compared to previous studies, this paper establishes a parametric model of the three-tooth tenon joint structure, which allows for rapid finite element modelling and subsequent analysis of the three-tooth tenon joint structure. Optimization using a Multi-Island Genetic Algorithm can be used to better accomplish the task of extending the fretting fatigue life of the three-tooth tenon joint structure.

2. Parametric Model of Three-Tooth Tenon Joint Structure

The geometry of the structure must continuously alter in order to change the outcomes of the optimization process for the design of the structure. The premise and foundation of the optimized design is that parametric modeling of the three-tooth mortise and tenon joint structure, in other words, using some relatively independent geometric parameters to complete the model design, can effectively and quickly realize the structural size change in its key components.
The three-tooth mortise and tenon joint structure is modeled after the cross-sectional tooth shape of a certain kind of engine turbine mortise and tenon. A parametric model of the simulation of the three-tooth tenon joint structure is constructed, as illustrated in Figure 1, using the analysis to identify the parameters that may accurately characterize the three-tooth shape.
Table 1 displays the descriptions for each parameter.
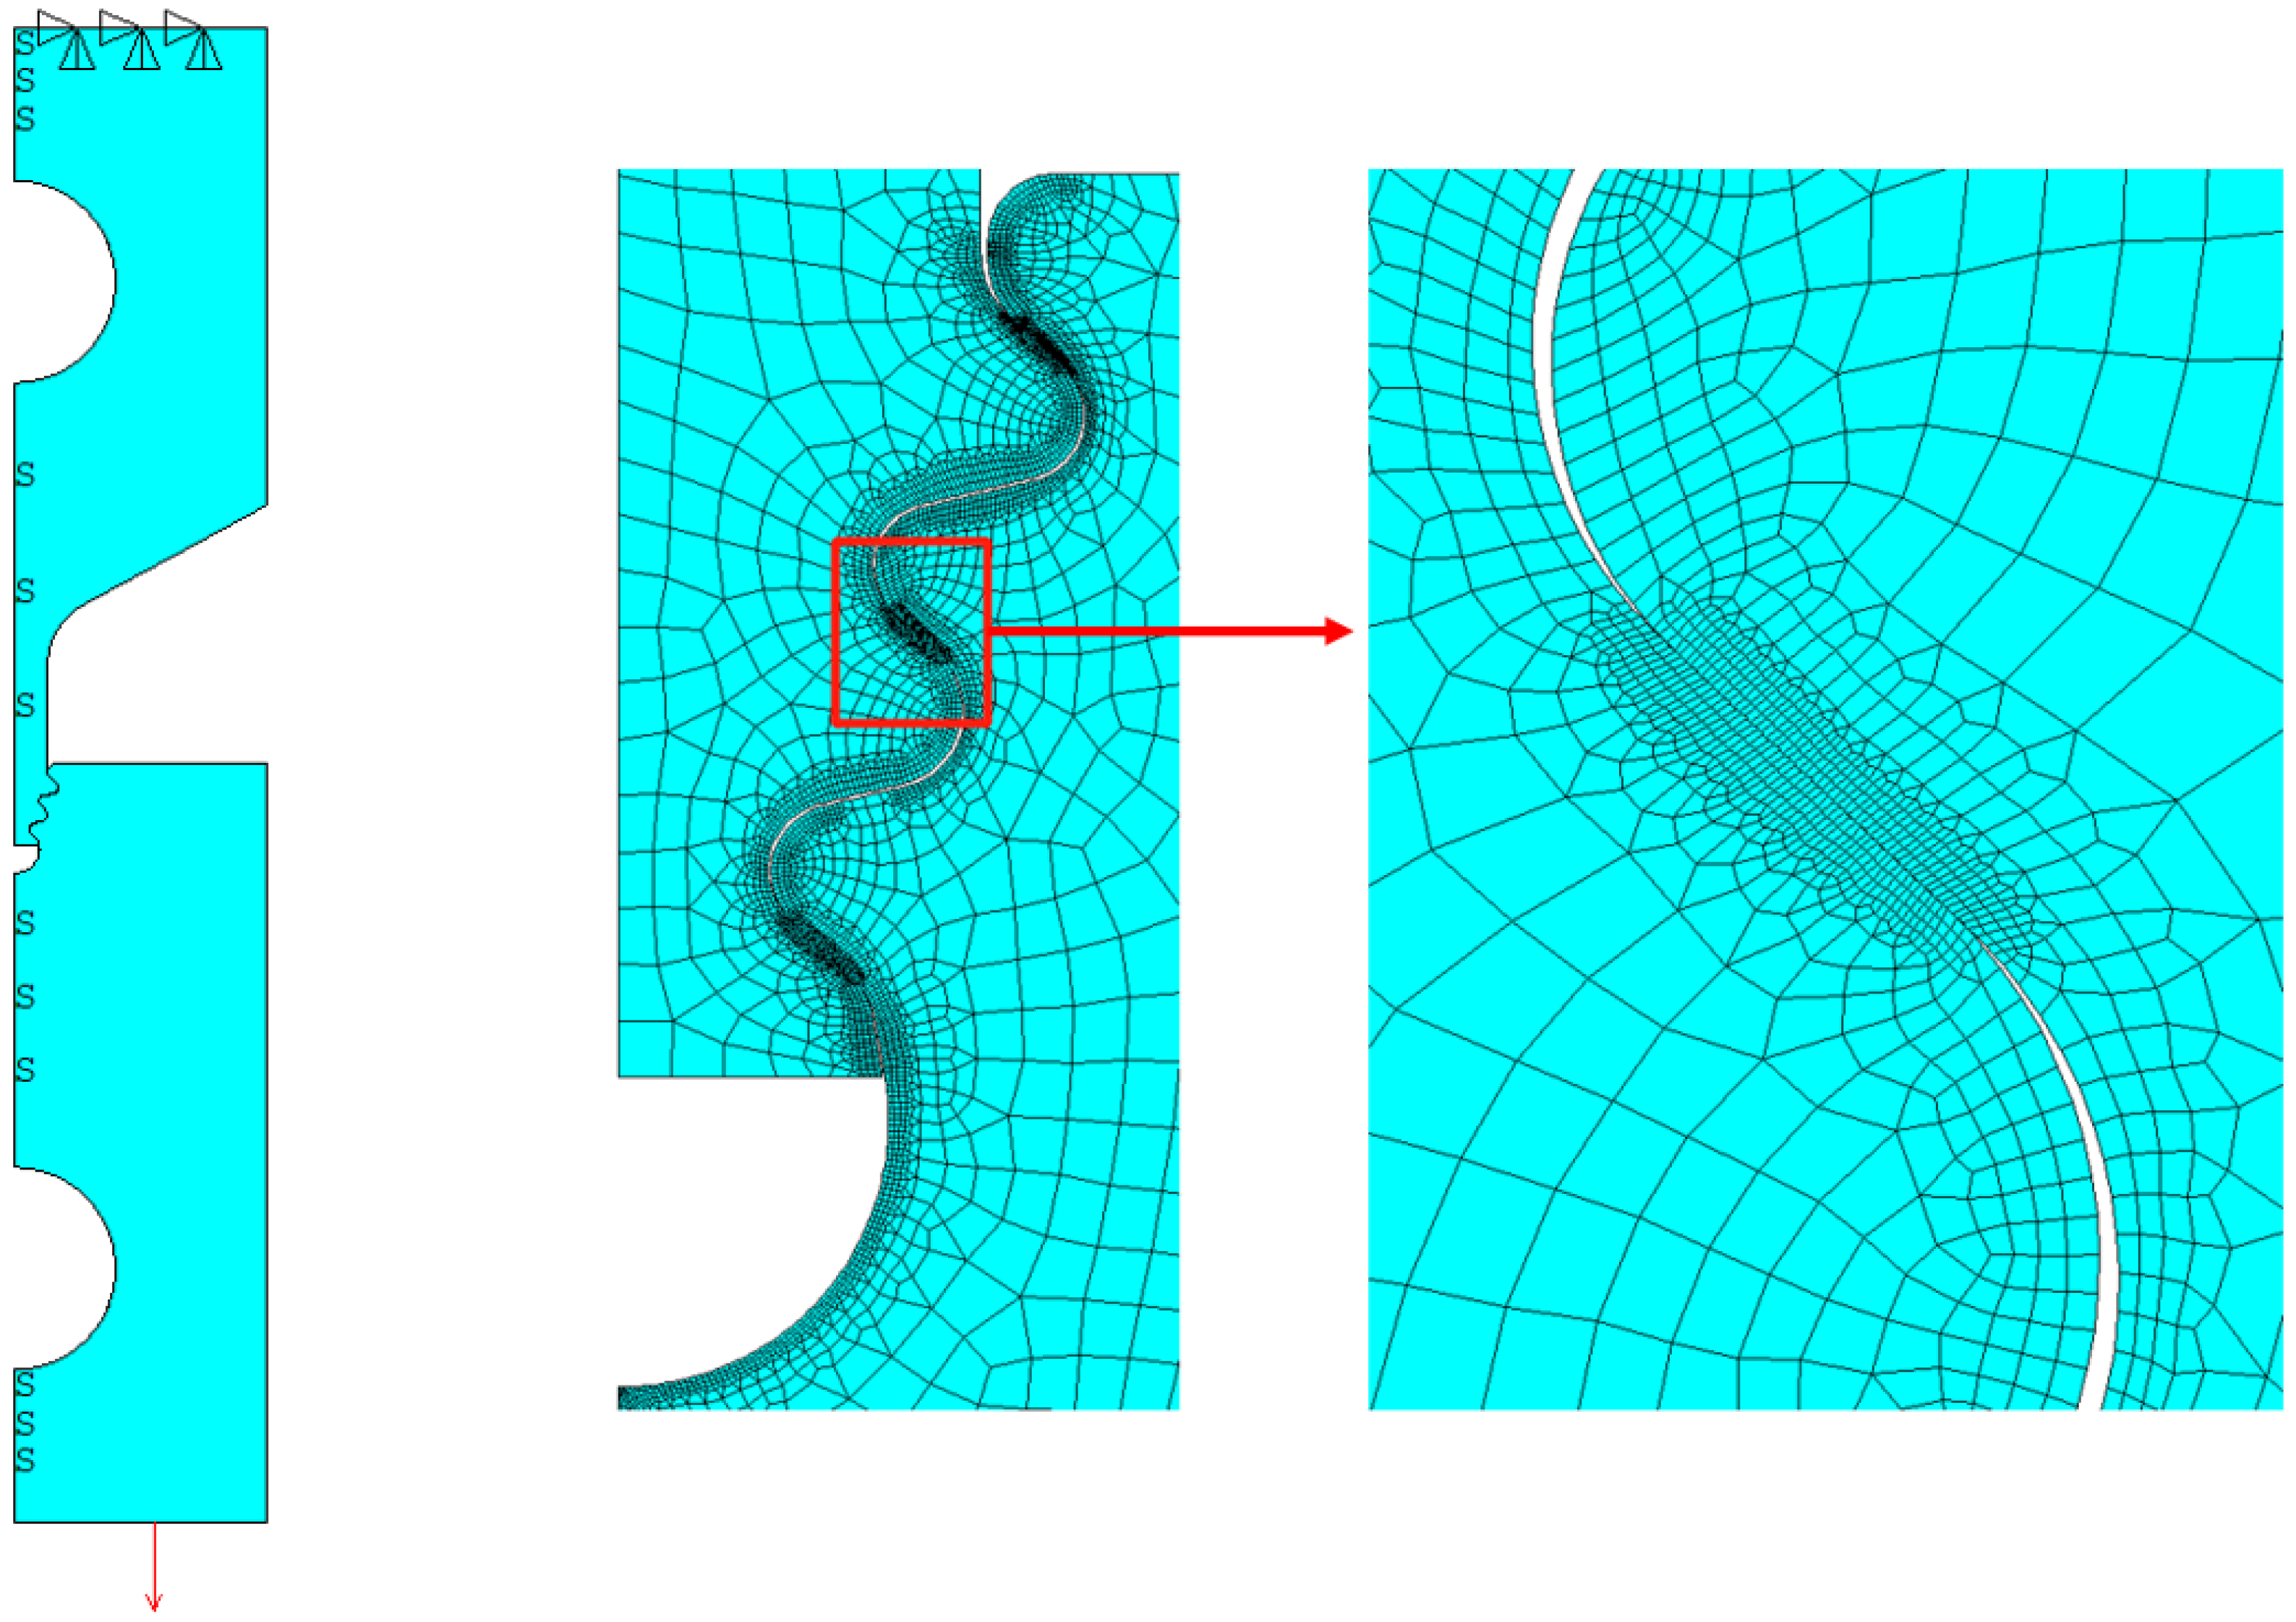
To increase the calculation efficiency, only a 1/2 finite element (FE) model needs to be created in light of the structure’s symmetry. A parametric finite element model of the three-tooth simulation of the turbine tenon connection structure is created using the ANSYS APDL language and the geometric relationship of the parameters in Figure 1, as illustrated in Figure 2. The tenon is made of the directional solidification alloy DZ125, while the mortise is made of the powdered high-temperature alloy FGH95. The mesh encryption is performed in and close to the contact area between the mortise and tenon to increase computation accuracy. The element type is chosen to be the 8-node plane element PLANE82. The total grid size is 0.5 mm. We apply fixed constraints on the upper edge of the model, symmetric constraints on the left edge, and axial loads on the lower edge. Contact elements are created on the contact surface of the tenon and mortise with the friction coefficient set to 0.3 [19,20,24,28]. The TARGE169 and the CONTA172 are selected as the target element and the contact element for contact creation in the contact section, as shown by the red arrows in Figure 2. The contact algorithm uses Augmented Lagrangian. The initial contact stiffness is 125.5 GPa for the stiffness of the material. We use a default range for stiffness updating and the sliding behavior is finite sliding. The contacting interface can undergo separation, relative large sliding, and arbitrary rotation.

3. Sensitivity Analysis

Because the model has a high number of parameters, optimizing every parameter as a design variable can produce better optimization results but significantly worse optimization efficiency. Prior to performing any optimization calculations, all parameters are typically subjected to sensitivity analysis. A number of parameters with a high impact on the objective function are selected as design variables for optimization.
The ISIGHT software’s Design of Experiments (DOE) module performs the sensitivity analysis of the three-tooth structure’s structural dimensions. The optimal Latin hypercube design (Opt LHD) approach is chosen in the experimental design due to the strong interaction between the three-tooth structure’s defining parameters. This approach enhances the random Latin hypercube design (LHD) [31].
The principle of LHD is to evenly divide the n -dimensional space x k min , x k max , k 1 , n , into m small intervals. Each interval is denoted as x k i 1 , x k i , i 1 , m . M points are randomly selected, and each level of different factors is used only once. A Latin hypercubic design with n-dimensional space and a sample number of m is established. Although LHD is better than other experimental design methods in terms of space filling ability, the distribution of sample points is still not uniform enough. As the number of levels increases, so does the likelihood of losing some areas of the design space. Opt LHD solves this problem, as it improves the uniformity of LHD, so that all the test points are distributed as evenly as possible in the design space, with adequate space filling and balance.
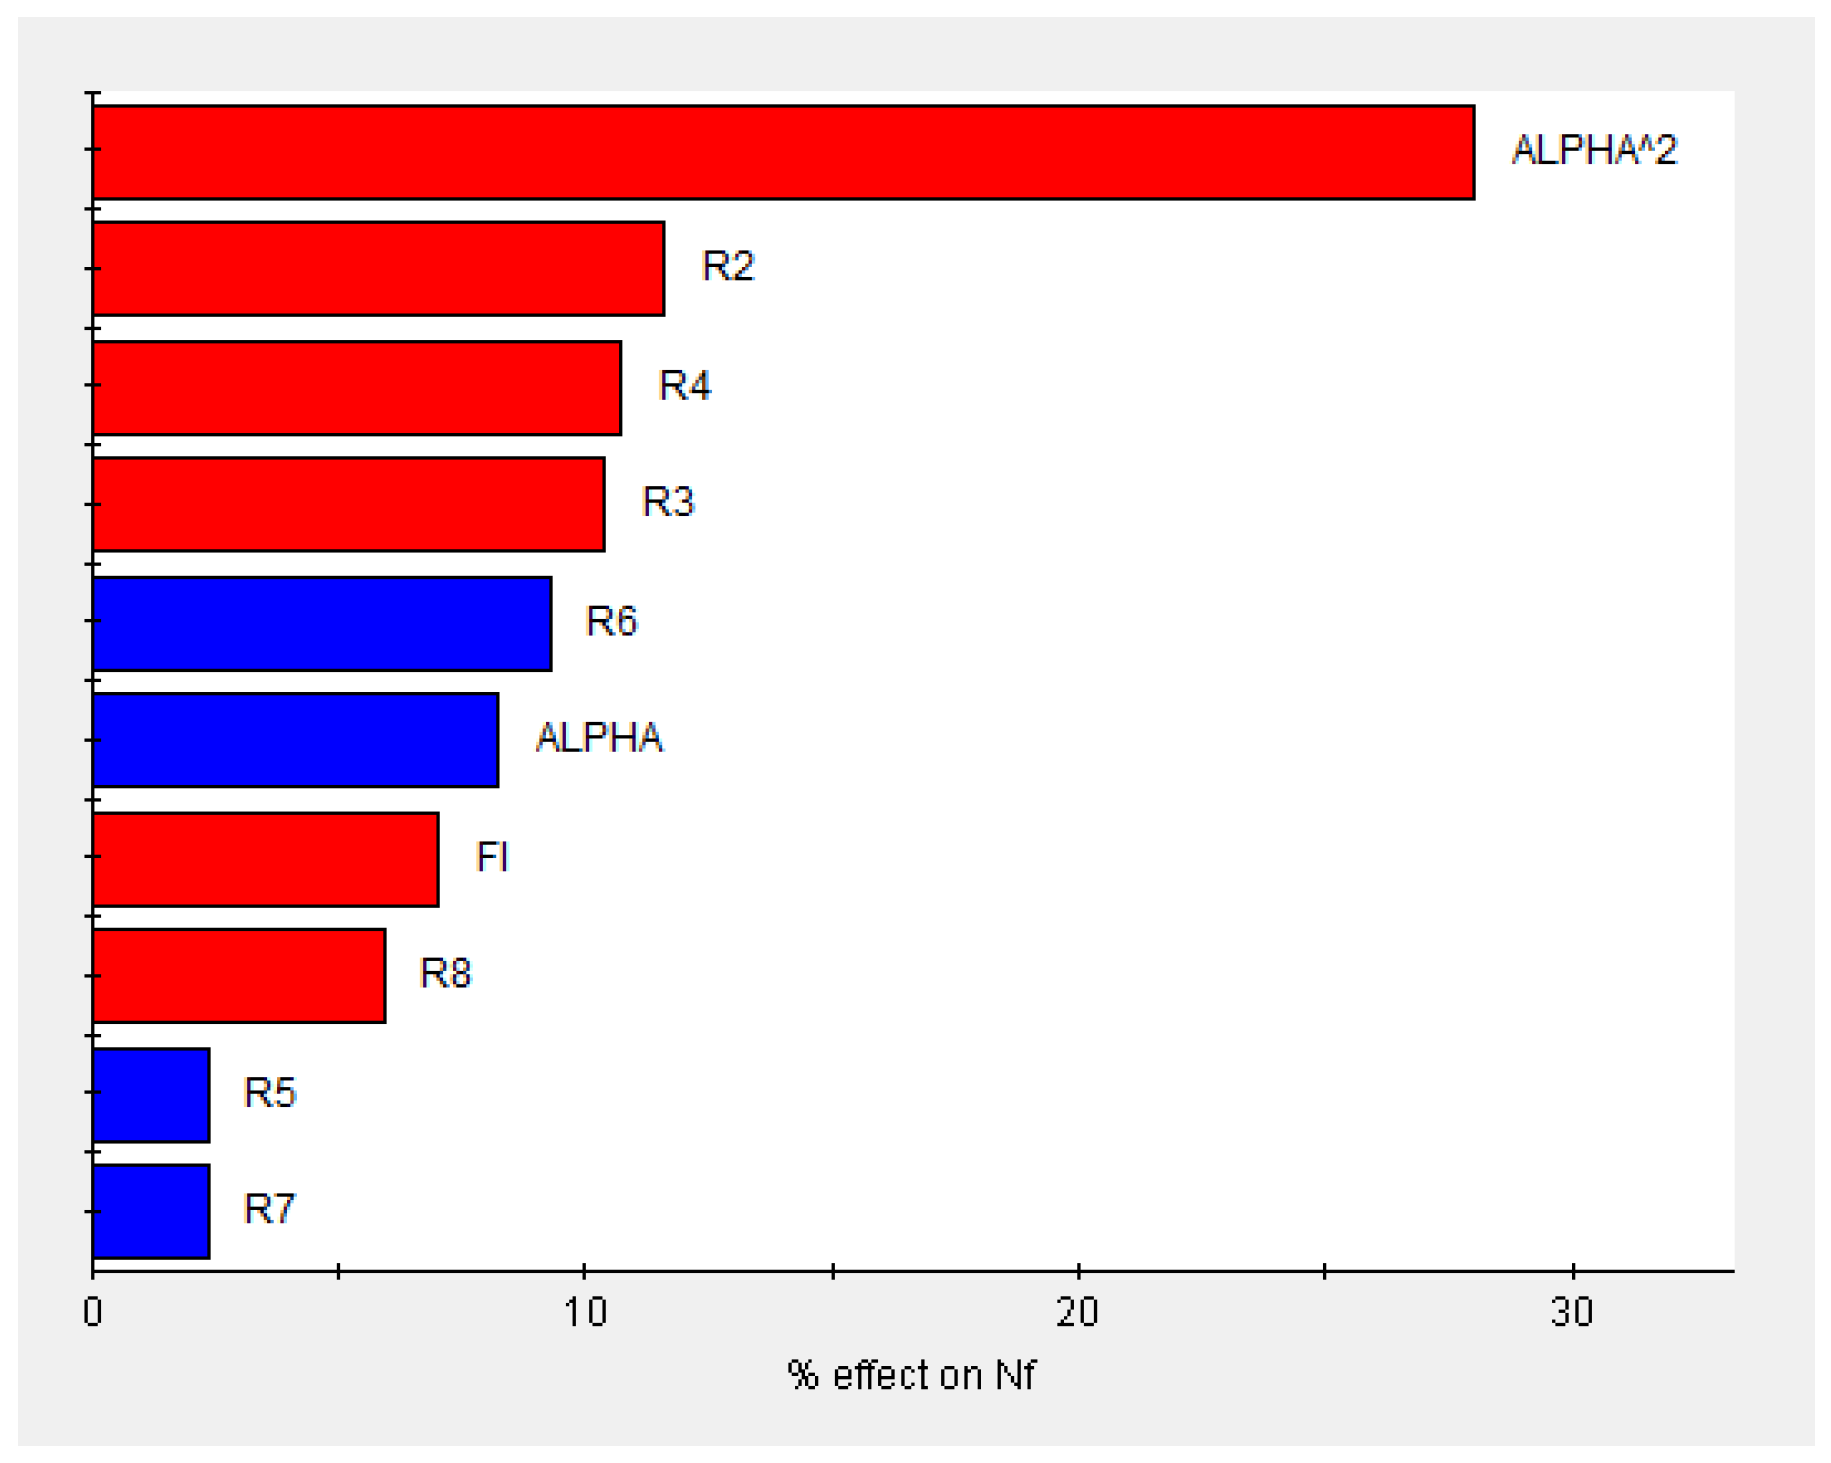
Figure 3 displays how sensitive the three-tooth structural parameters are to the fretting fatigue life, as shown by the Pareto chart. The horizontal coordinates of the graph indicate the percentage of the effect of a change in a parameter on the calculated results. The blue bar indicates that the fretting fatigue life increases as that parameter increases, and the red indicates that the fretting fatigue life decreases as that parameter increases.
After the sensitivity analysis of all the structural parameters, the top-ranked ALPHA, R2, R3, R4, R6, and FI parameters were selected as the design variables for the optimization of the three-tooth mortise and tenon joint structure after several trial calculations in conjunction with the requirement for as few design variables as possible in multi-objective optimization.

4. Optimized Design of Three-Tooth Mortise and Tenon Joint Structure

4.1. Description of the Optimization Problem

The description of the optimization problem contains the design variables and the objective functions, the constraints and the mathematical model of the optimization.
Following sensitivity analysis, the following six parameters make up the design variables, which have a significant impact on the fatigue life of fretting:
X = ALPHA R 2 R 3 R 4 R 6 FI
The objective function of the optimal design of the three-tooth structure is its fretting fatigue life. The prediction of the fretting fatigue life is based on the non-linear fatigue damage prediction model developed in the Ref. [20].
N f = k 1 + β × 1 a M 0 β σ b σ eqv , max A II σ 1 1 3 b 1 σ H , mean × A II 1 3 b 2 σ H , mean β ( Δ ε eq cr ) p 2 ω
where k and ω are material parameters that can be fitted from the material fretting fatigue test data. β , a , b 1 , b 2 and M 0 are parameters fitted from uniaxial fatigue tests of the material. σ 1 is the fatigue limit for a stress ratio of −1, σ b is the strength limit of the material and σ H , mean is the mean hydrostatic pressure, which is expressed as follows:
σ H , mean = 1 2 σ H , max + σ H , min = 1 6 max σ 11 + σ 22 + σ 33 + min σ 11 + σ 22 + σ 33
where σ 11 , σ 22 and σ 33 are the three principal stresses. A II is the equivalent variation range under multi-axial fatigue loading, and Δ ε eq cr is the equivalent strain range on the critical surface, which is calculated as follows:
A II = 1 2 3 2 σ ijmax σ ijmin σ ijmax σ ijmin = 1 2 2 σ 1 σ 2 2 + σ 2 σ 3 2 + σ 3 σ 1 2 1 / 2
Δ ε eq cr 2 = ε n 2 + 1 3 Δ γ max 2 2
where σ ijmax and σ ijmin are the maximum and minimum values of each stress bias in the cycle, respectively. σ 1 , σ 2 and σ 3 are the principal stress amplitudes, i.e., σ i = max ( σ i ) + min ( σ i ) / 2 . ε n and Δ γ max are the range of positive and maximum shear strains on the critical surface, respectively. For DZ125, the material of tenon, it is known from Ref. [24] that β = 2.813 , a M 0 β = 6.01 × 1 0 14 , b 1 = 0.711 / σ s , b 2 = 0.077 / σ s , k = 6.694 and w = 0.111 .
From the above life prediction model, after finite element analysis, it is possible to determine the fretting fatigue life N f of the tenon.
The constraints include geometric constraints and strength constraints. Geometric constraints are ranges of values for design variables that guarantee that the model is in the correct shape. The following are some examples of the strength restrictions: the maximum tensile stress cannot be greater than the allowable tensile stress; the maximum equivalent force cannot be greater than the allowable tensile force; the maximum shear stress cannot be greater than the allowable shear stress; and the maximum extrusion stress cannot be greater than the allowable extrusion stress. For plastic materials, the permissible stress σ = σ s / n , where σ s is the yield limit of the material, n = 1.2 ~ 2.2 is the safety factor, the permissible shear stress τ = 0.6 ~ 0.8 σ and the permissible extrusion stress β = 1.5 ~ 2.5 σ .
The following mathematical model can be used to describe the optimization design issue of anti-fretting fatigue damage of the three-tooth mortise and tenon joint structure:
Maximize:
N f = f ( x )
Subject to Equations (1) and (7):
g i X 0 i = 1 , 2 , 3 , , n
In the above equations, N f is the objective function, X is the design variable, and g i is the constraint.

4.2. Optimization Processes

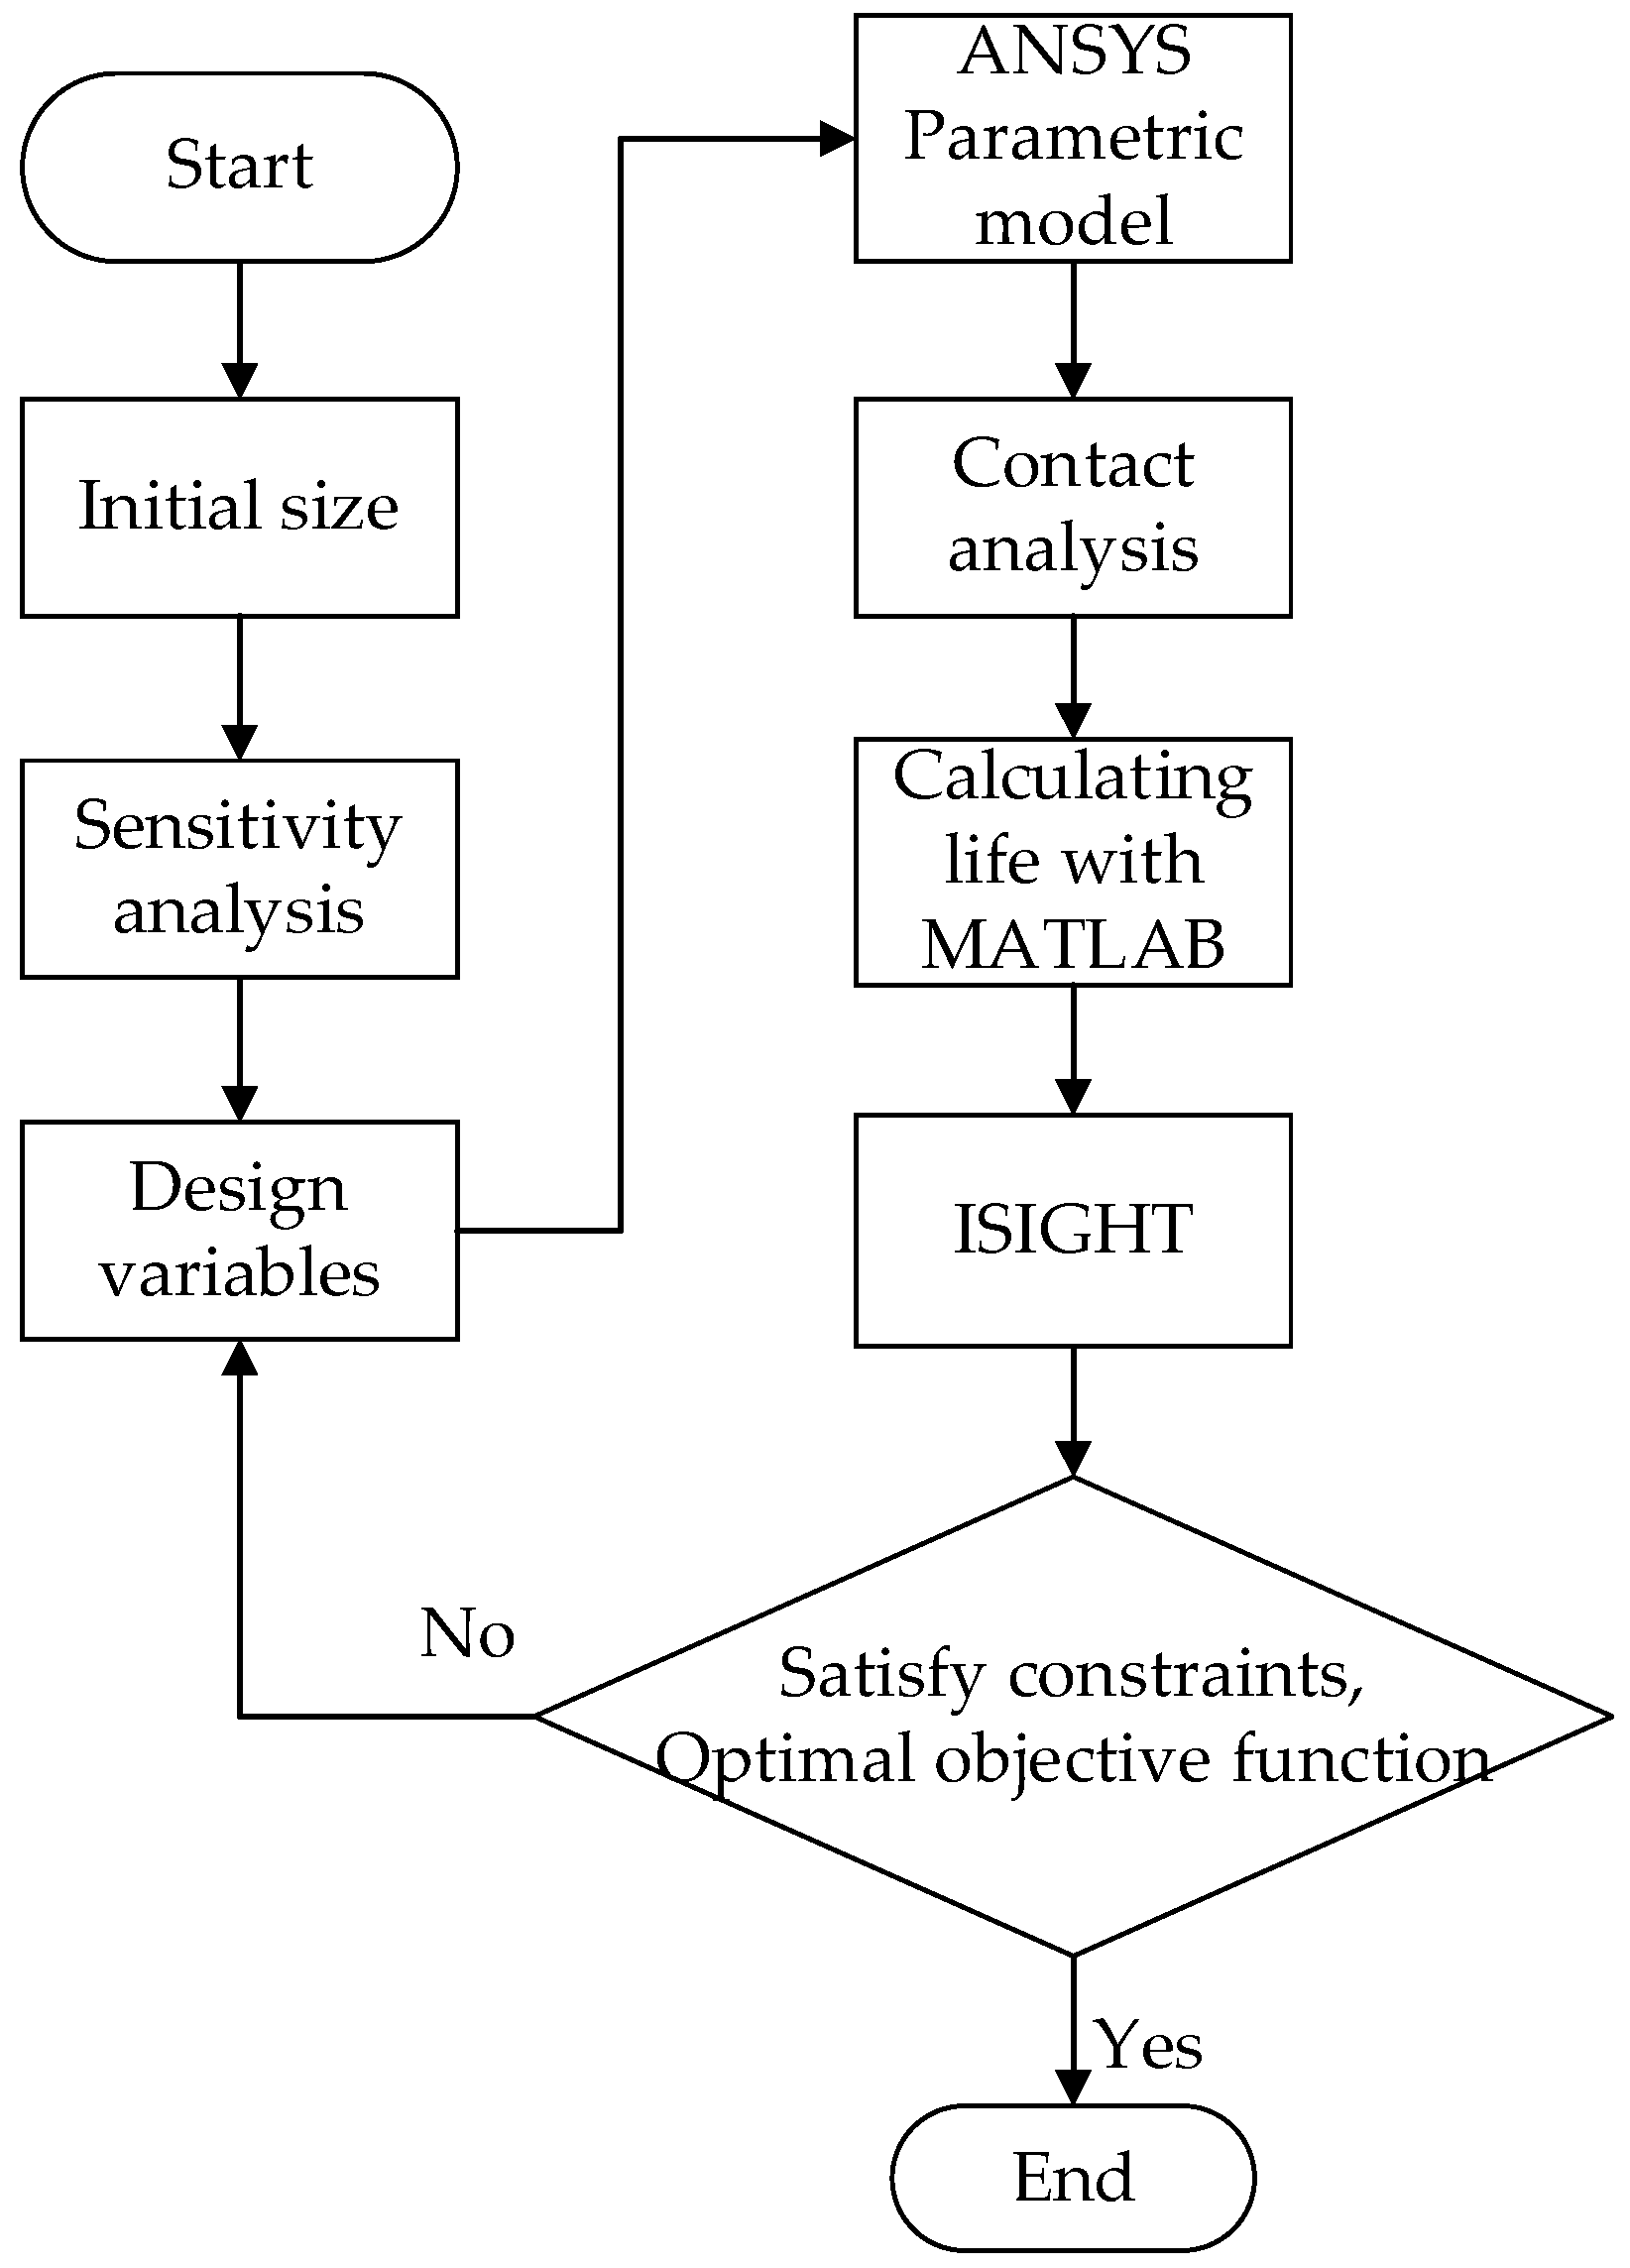
This paper integrates ANSYS and MATLAB and creates batch files based on the multidisciplinary optimization platform ISIGHT to finish the optimization design of the structure. The precise steps can be described as follows:
  • First, input the design variable values into ISIGHT. Update the parametric model and mesh the three-tooth mortise and tenon joint construction in ANSYS using a batch file. At the peak and valley of the load, non-linear contact analysis must be conducted. Identify each node’s stress and strain statistics in the contact zone under peak and valley loads. Create a result file;
  • Import the output file into MATLAB, and then use ISIGHT to run the MATLAB program to determine the structure’s fretting fatigue life based on non-linear fatigue damage;
  • The IGHGHT optimization module can be used to determine the constraints and goal functions. Change the design variables to move on to step 1 if the objective function is not convergent or the constraint is not met. The optimization is finished if the objective function is optimal and the restriction is met.
The entire optimization process is depicted in Figure 4 and all of the aforementioned processes are automated by ISHGHT.

4.3. Optimization Results and Analysis

The structure of the three-tooth mortise and tenon joint was designed with the aid of the MIGA. The main distinction between the MIGA and the conventional GA method is the way in which MIGA splits a large population into a number of smaller subpopulations, which it refers to as “islands”. In order to realize the exchange of individuals between populations, increase the diversity of individuals on each island, and use the conventional GA algorithm for subpopulation evolution on each island, some individuals on each island can be chosen and transferred to different islands after a predetermined number of iterations. Figure 5 depicts the objective function’s iteration, which has 41 iterations and an optimal result of 17,206.
Table 2 displays a comparison of each parameter’s values before and after optimization. The dimensional error for all parameters is ±0.001 mm and the lower and upper design limits are set for each parameter based on the geometric constraints of their structure. As can be observed from the results in the table, R3 and R6 increased when the optimization parameters ALPHA, FI, R2, R4, and R2 reduced. After optimization, the non-linear fatigue damage-based estimated life of fretting fatigue decreased from 9347 to 17,206. There was a 1.8-fold increase in life.
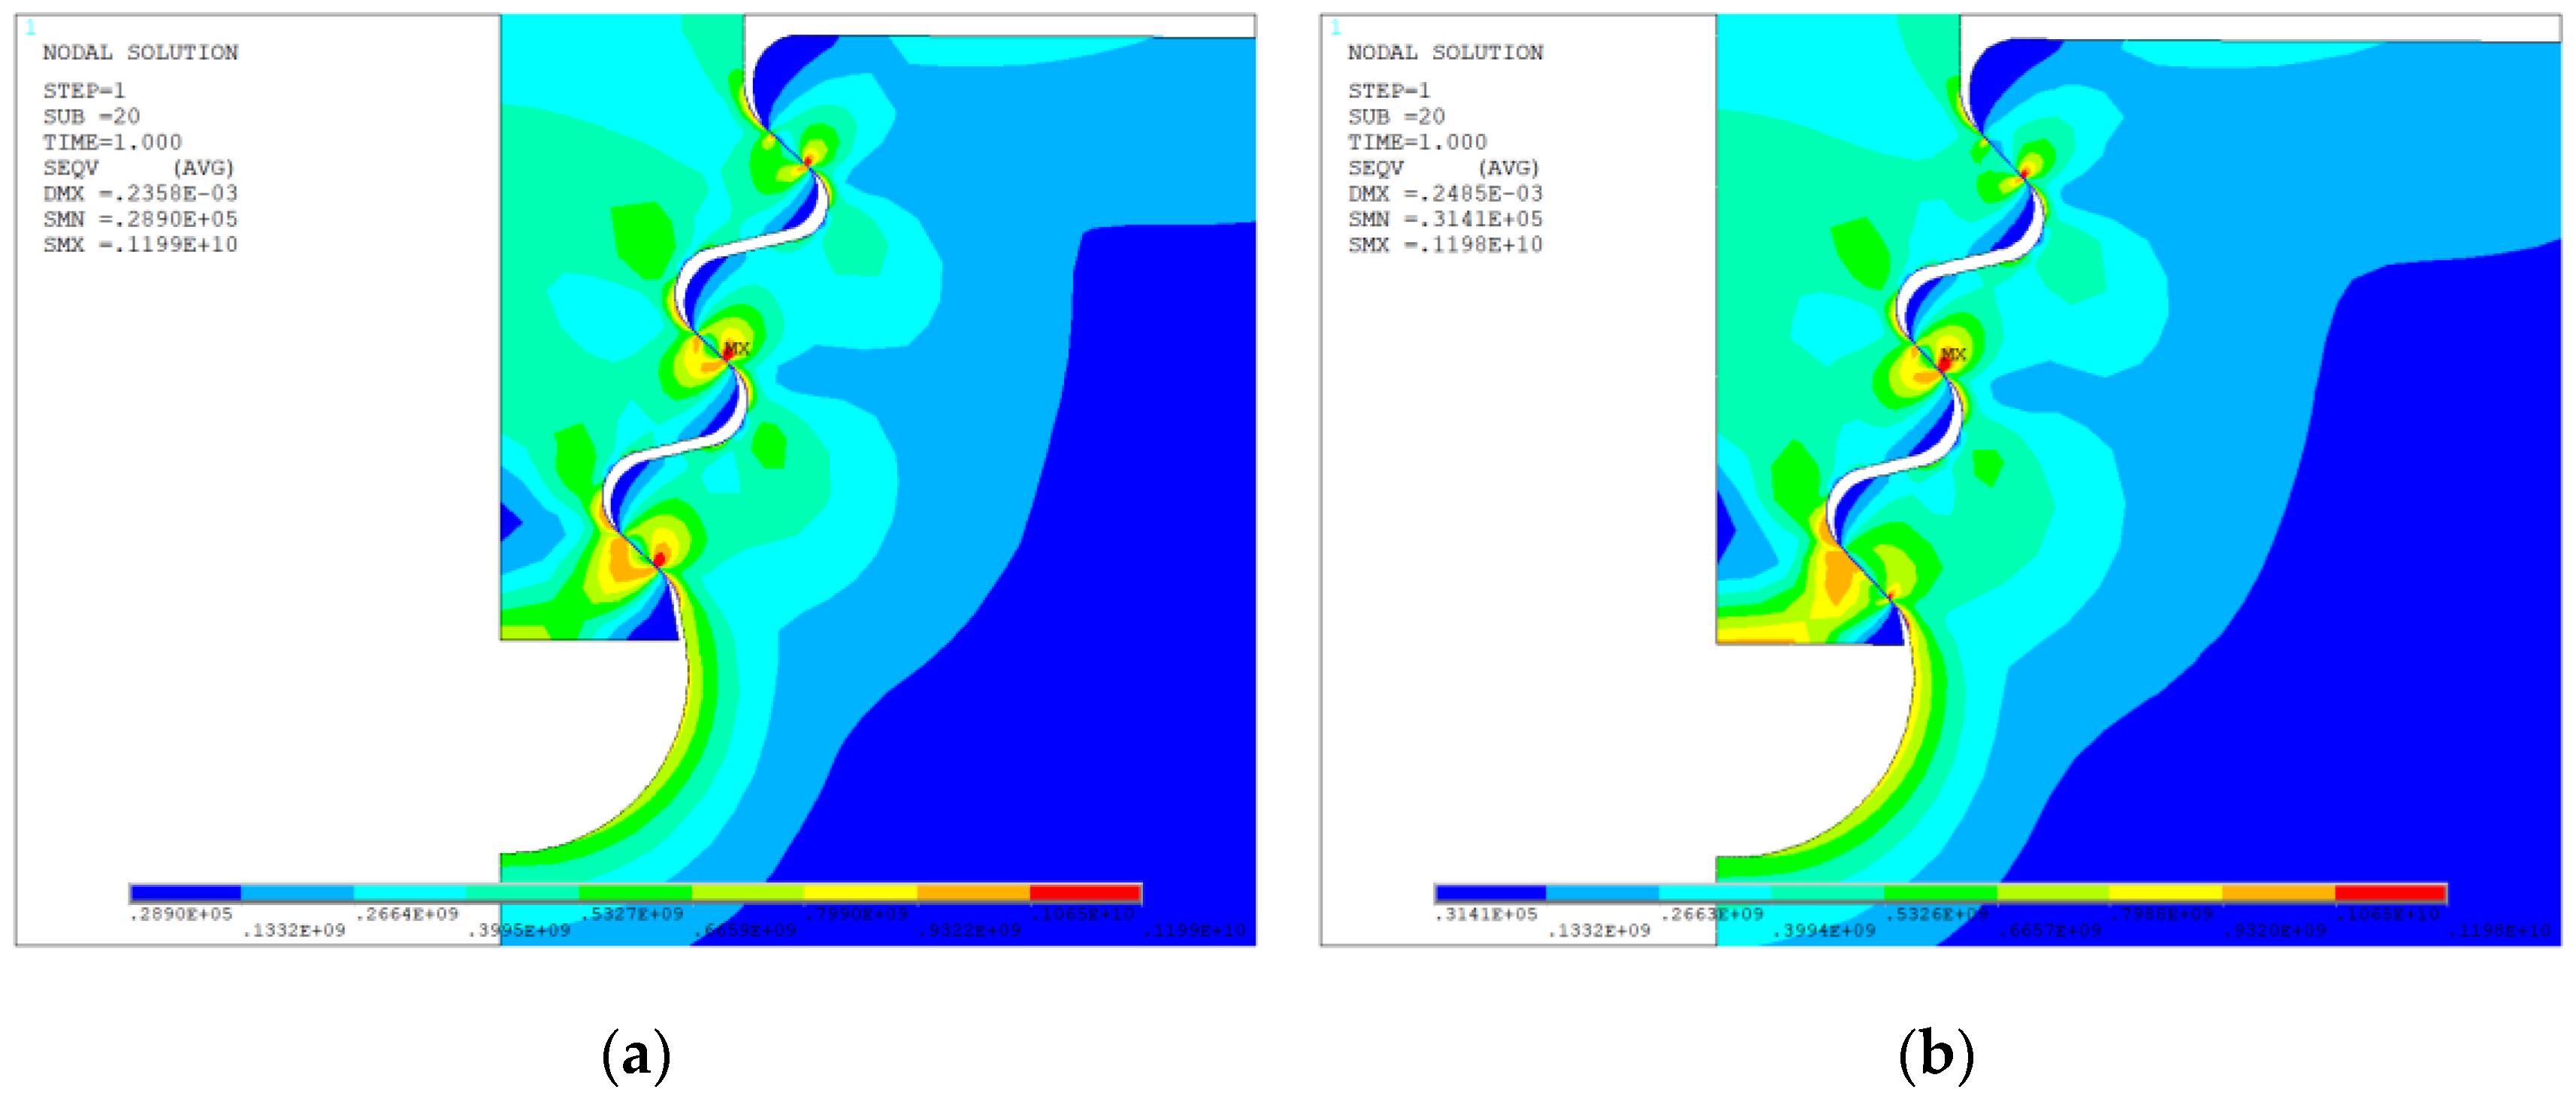
The equivalent stress cloud, contact pressure cloud, and slip amplitude cloud are presented in Figure 6, Figure 7 and Figure 8 for the structure’s finite element analysis before and after optimization. The resulting values are shown in Table 3.
As can be observed from Figure 6, Figure 7 and Figure 8 and Table 3, the maximum equivalent stress before and after optimization occurs at the second tooth. After optimization, the maximum equivalent stress was reduced from 1199 MPa to 1198 MPa, which was largely unchanged. The third tooth’s stress concentration has improved dramatically. The second tooth likewise has the highest contact pressure both before and after optimization. The second tooth’s contact pressure decreased from 2029 MPa to 2018 MPa. The initial tooth’s slip amplitude is always the largest, as observed in the slip amplitude cloud before and after optimization, and the maximum slip amplitude drastically decreased from 9.036 × 10⁻² μm to 7.859 × 10⁻² μm.
The bottom border of the contact zone of the second tooth of the tongue and groove continues to experience the highest equivalent stress and highest contact pressure of the structure after optimization. On the basis of this, it is possible that the fretting fatigue crack of the three-tooth mortise and tenon joint structure may have appeared at the bottom edge of the contact zone of the second mortise tooth.

5. Verification by Fretting Fatigue Test

A fretting fatigue test was performed on the three-tooth mortise and tenon joint structure simulation before and after optimization in order to confirm the viability of the aforementioned optimization results.
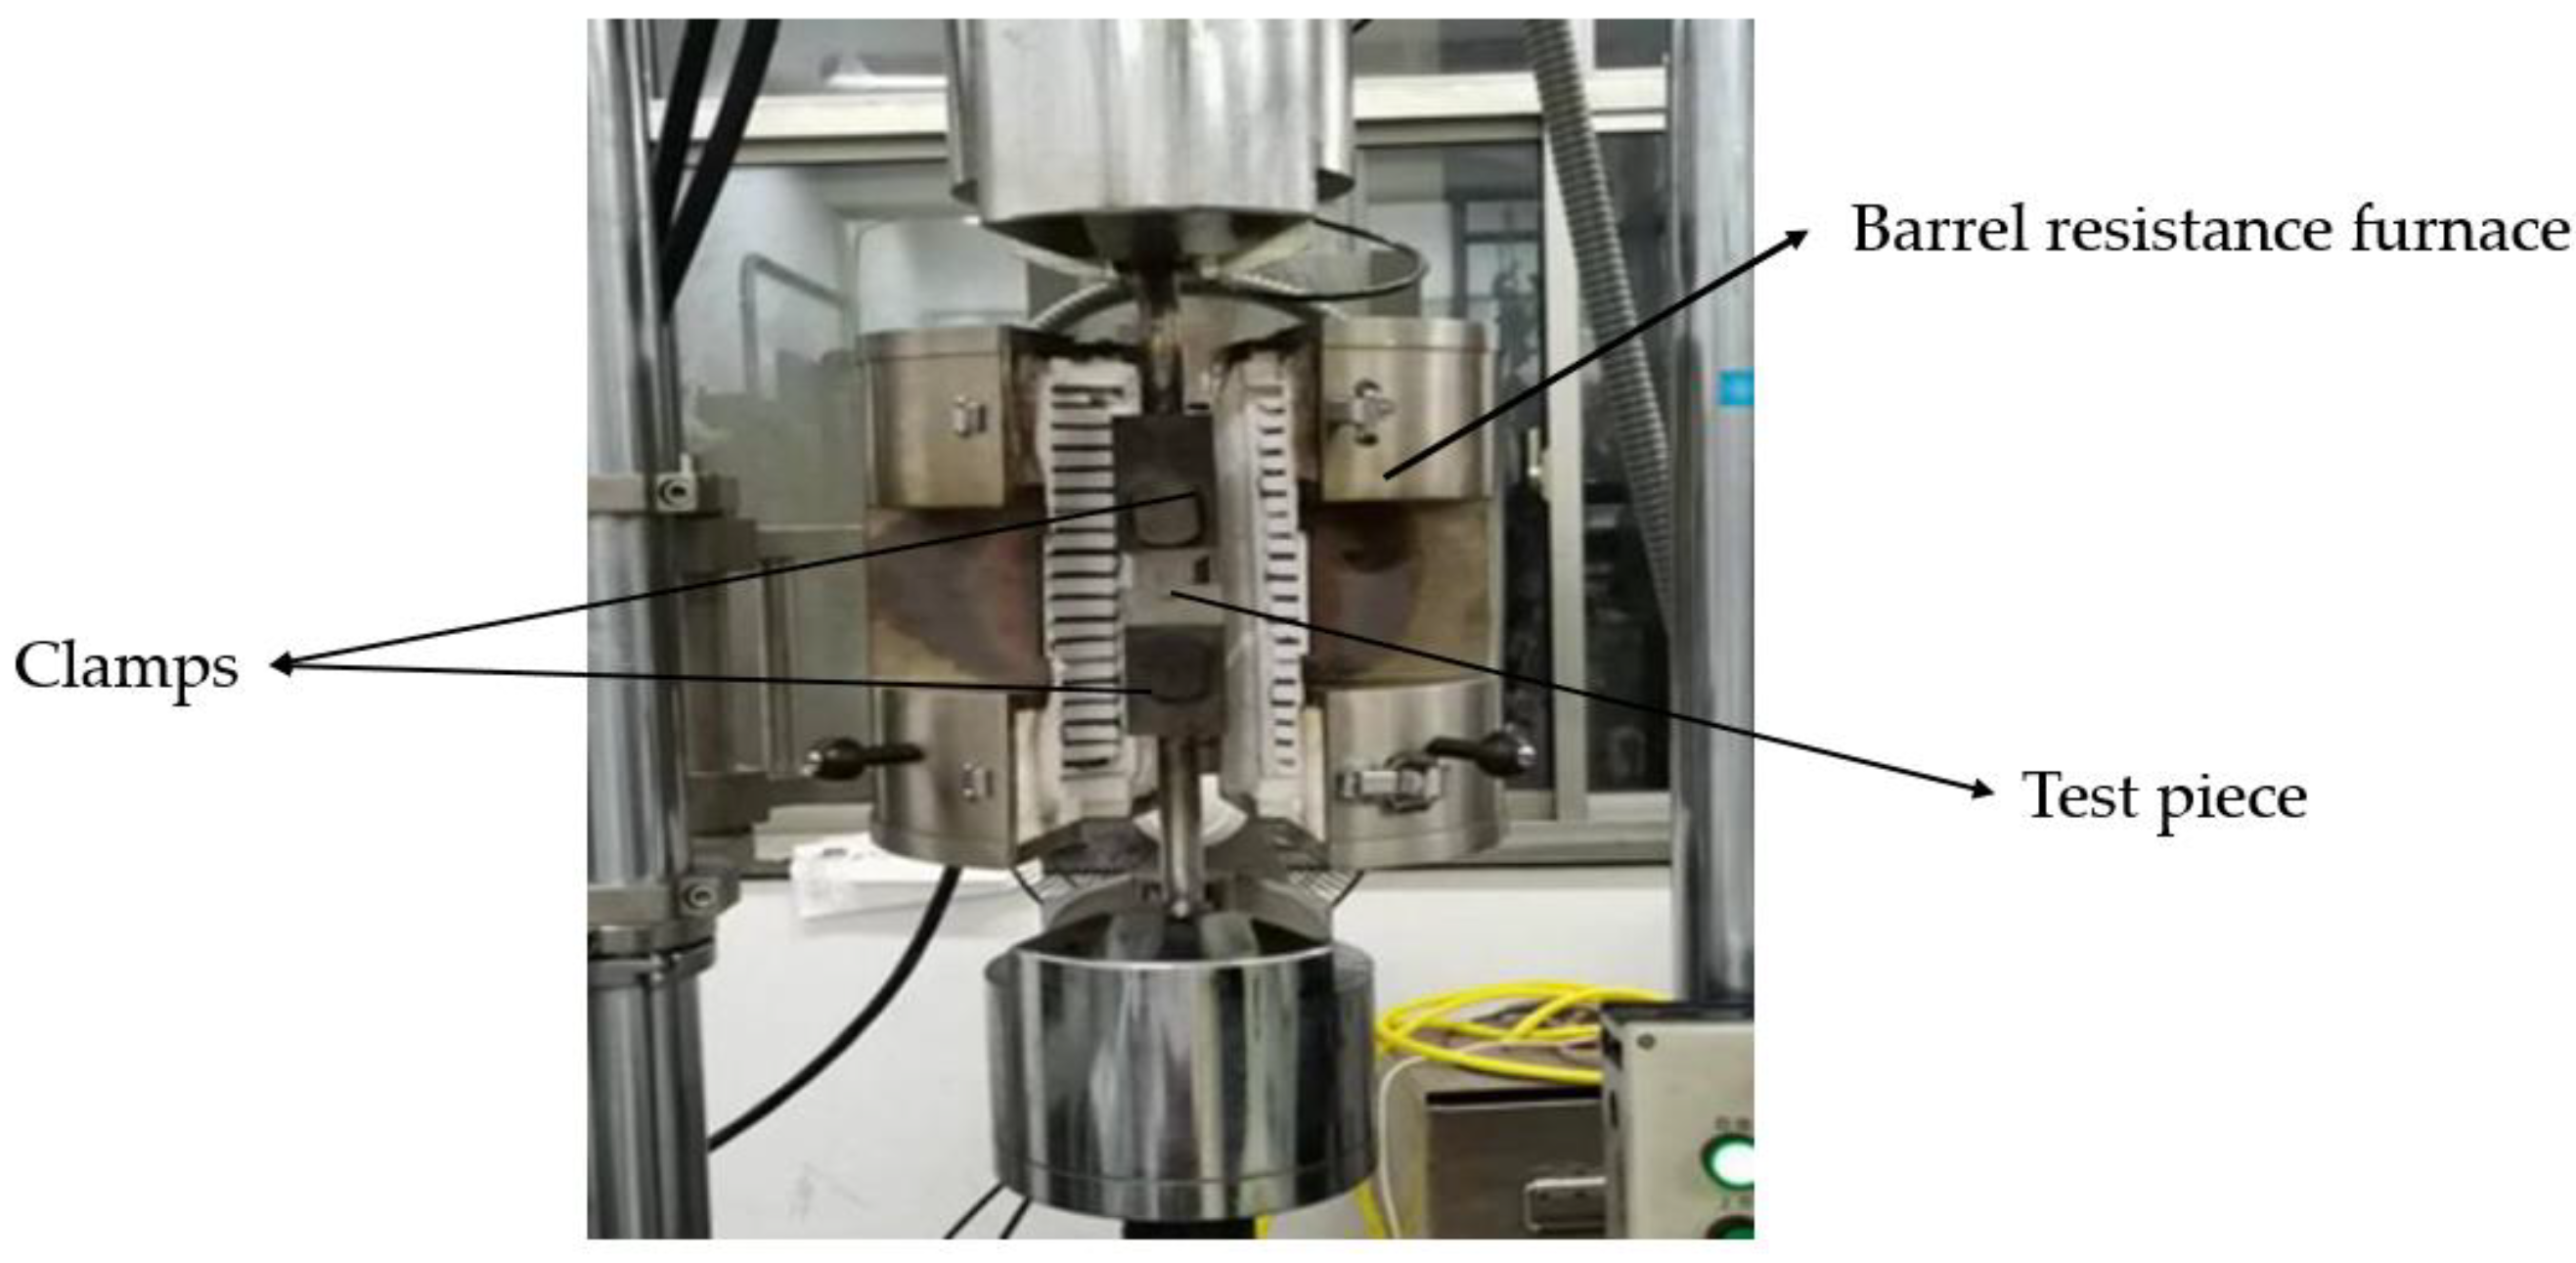
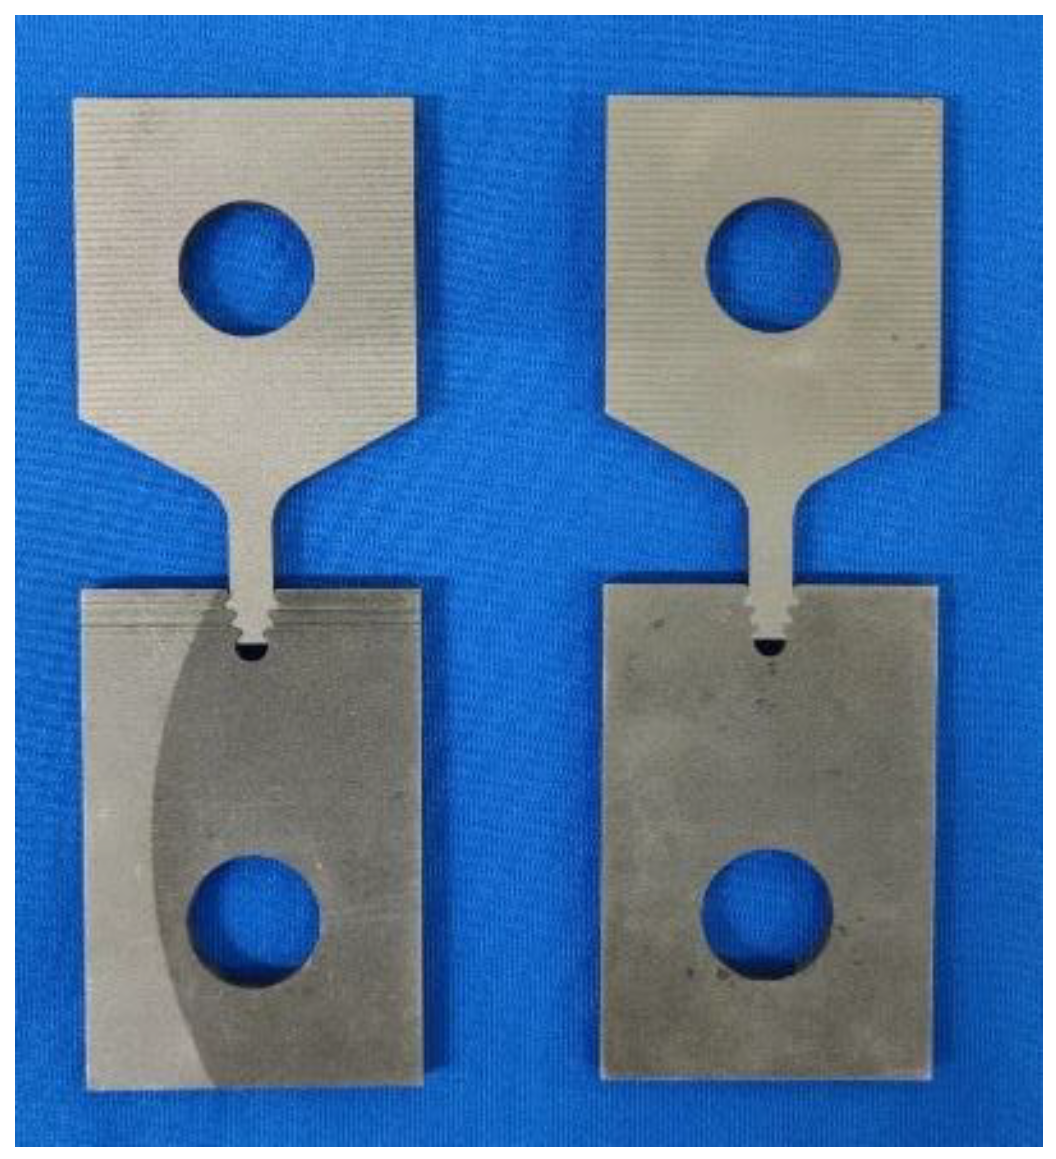
The SDS50 electro-hydraulic servo dynamic and static testing machine was used for the test. An electric heating furnace was used to heat the high-temperature environment needed for the test because it has an excellent insulating effect and a straightforward design. The corresponding barrel resistance furnace has a maximum temperature of 900 °C. The temperature in the furnace is regulated by a temperature controller, and thermocouples are used to measure temperature in order to achieve the different temperature control of the high-temperature resistance heating furnace. Figure 9 and Figure 10 illustrate the test apparatus and test items.
The test temperature is 650 °C because the mortise and tenon joint construction operates at a temperature of 650 °C. The test piece’s fatigue load loading strategy is pull–pull cyclic loading, with a peak axial force of 14 kN, which is used for the optimized design. The sine wave is the waveform. Ten hertz (Hz) is the fixed frequency. There is a 0.1 load ratio. Due to the small dispersion of the fretting fatigue test results, two separate sets of tests were conducted on the structure before and after optimization in order to save test costs. Table 4 displays the test results.
Small fatigue life dispersions exist for specimens of the three-tooth moreise and tenon joint construction.Following structural size optimization, the average life of fretting fatigue increases from 7613 cycles to 11,518 cycles, a rise of 51.3%, when the axial load is 14 kN. The test results demonstrate how sensible and efficient this optimization strategy is.
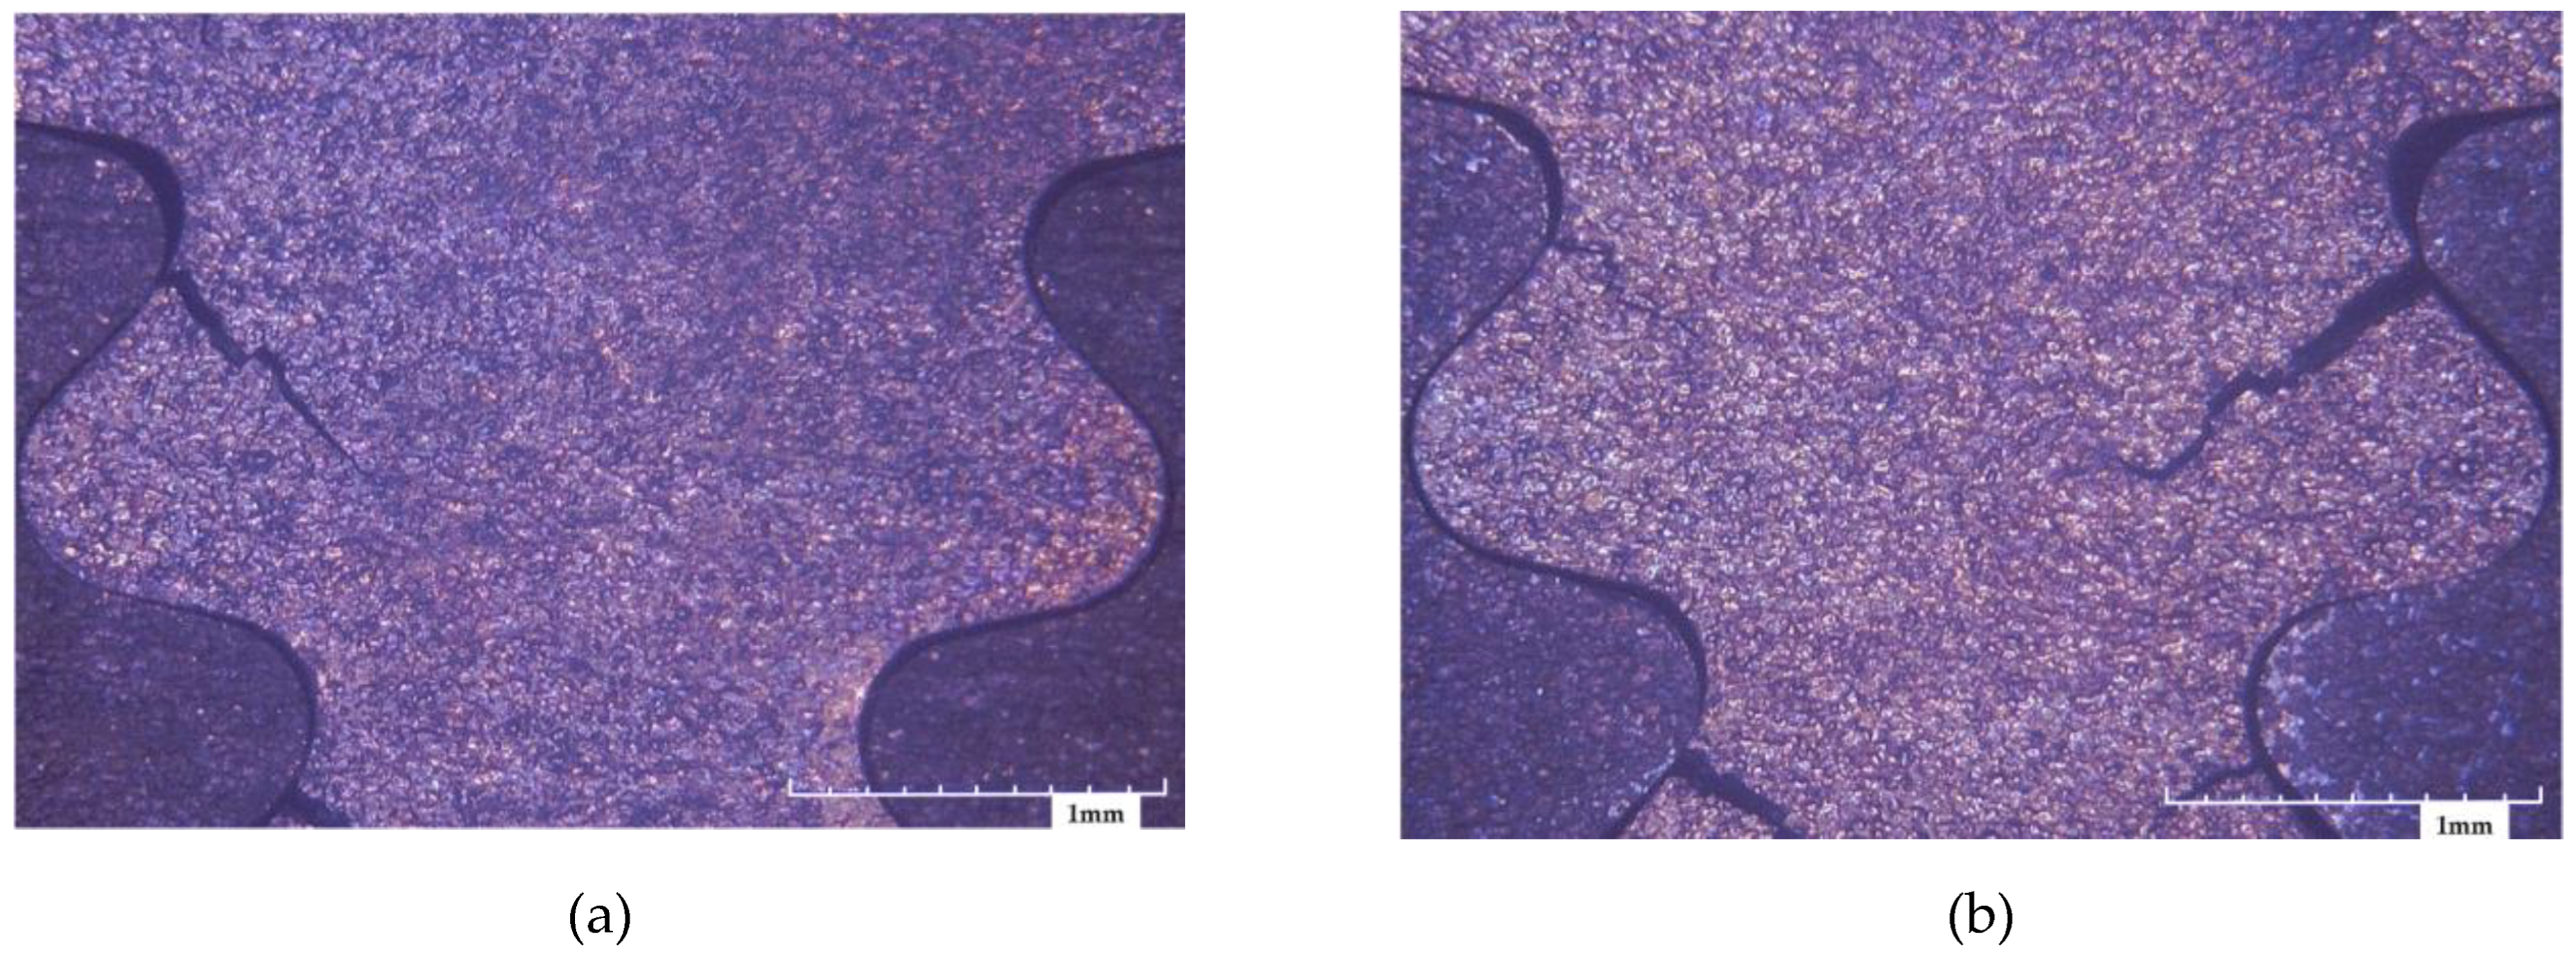
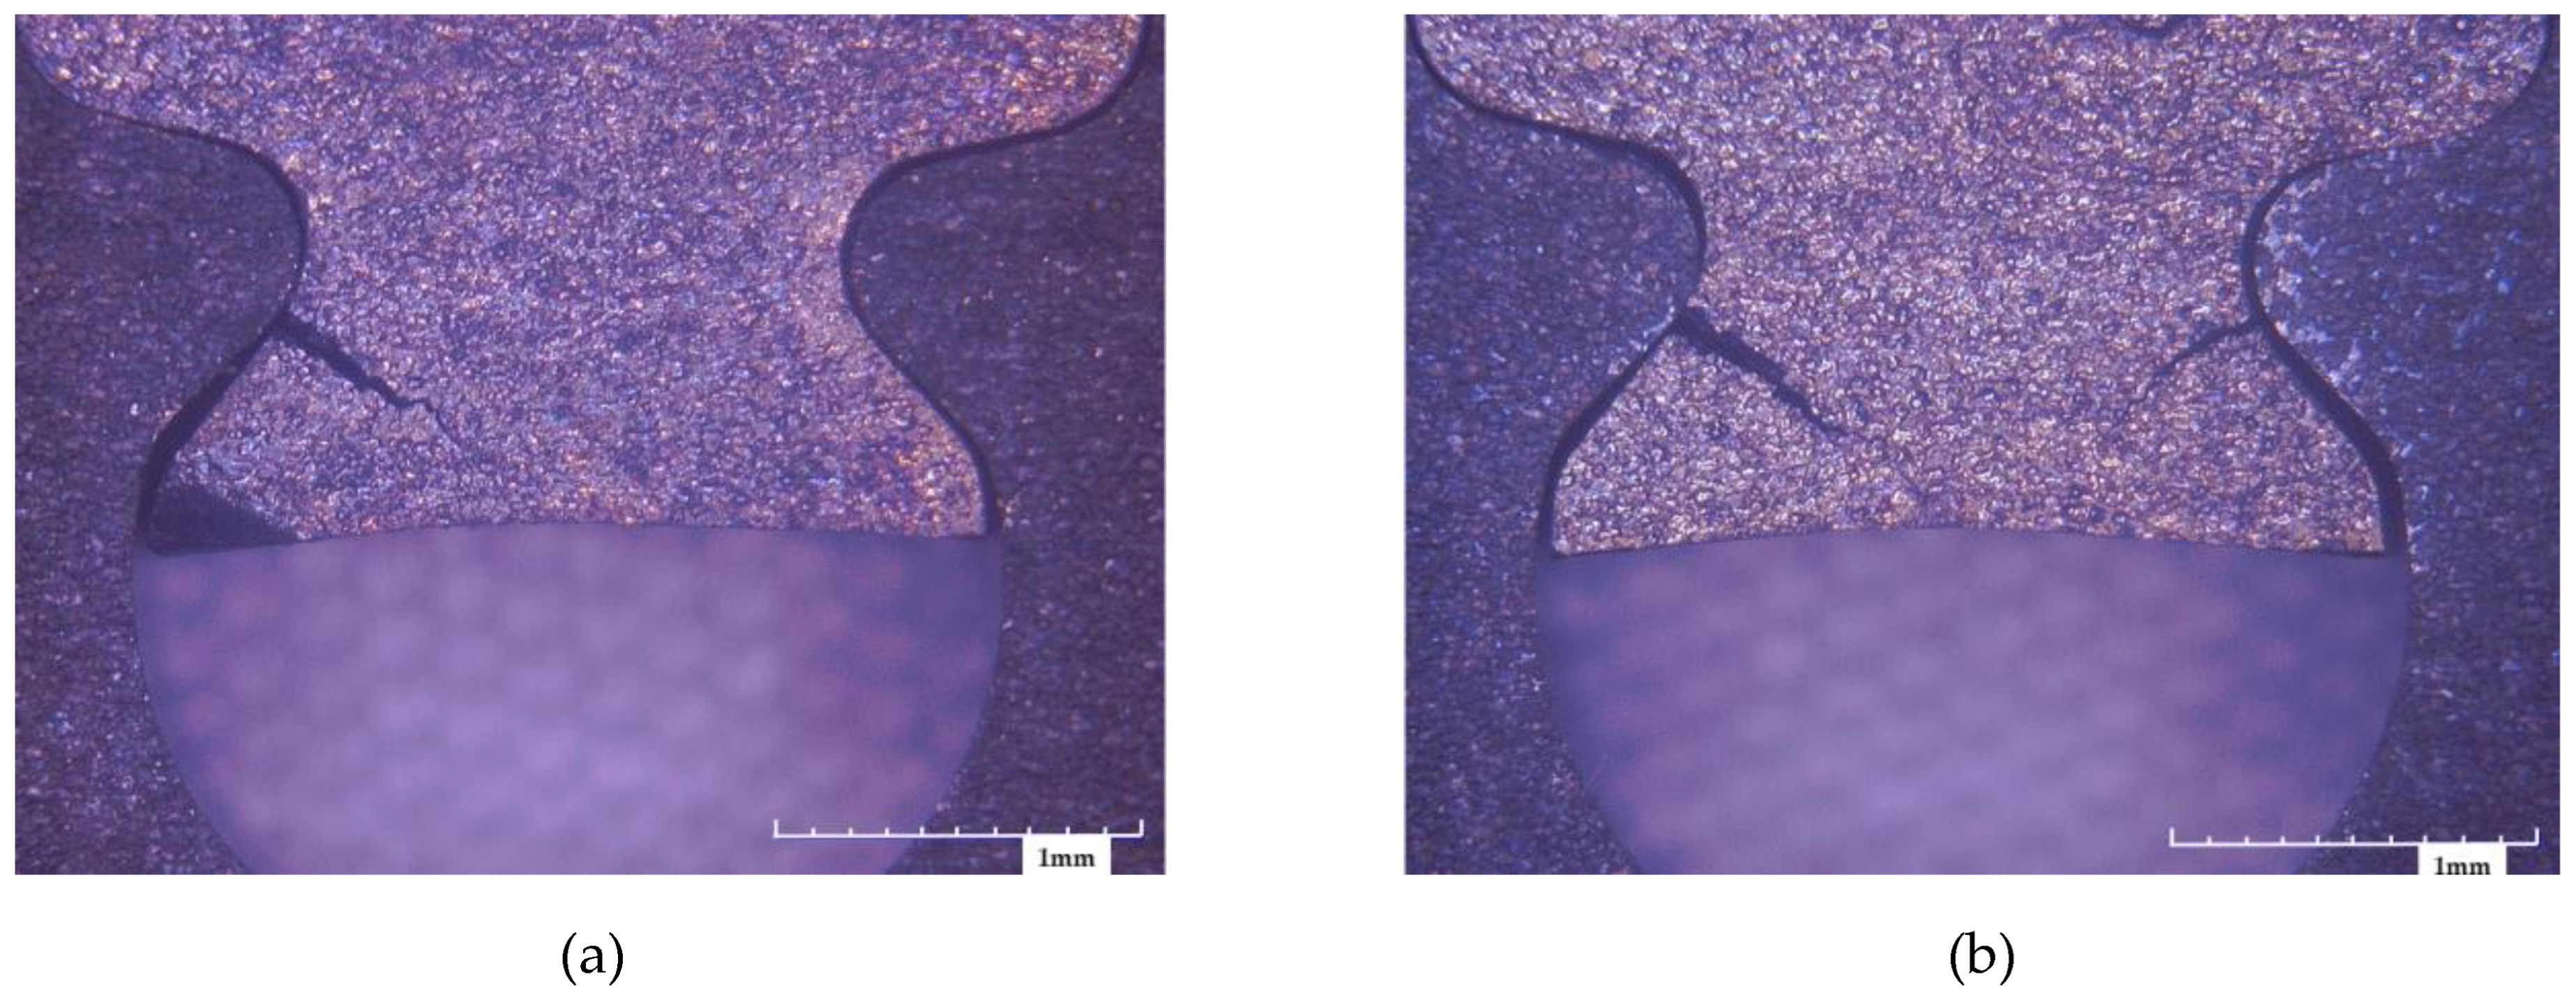
After the test, the contact area of the test piece was observed using the optical microscope. The shape of the test piece is shown in Figure 11, Figure 12 and Figure 13.
Structural fractures were used as the form of failure for the entire specimen. The first tooth of all the specimens fractured, and the fracture location was at the edge of the contact zone, which is typical of fretting fatigue failure. Longer cracks were produced at the edge of the contact zone of the second tooth both before and after optimization. The cracks all extended in the direction along the contact surface. They were mainly influenced by the stresses parallel to the contact surface.

6. Conclusions

The teeth shape of a certain type of engine turbine mortise and tenon in a specific cross-section is used in this paper to build a parametric model of a three-tooth mortise and tenon joint structure simulation. The sensitivity of the distinctive parameters of the structure was examined using the parameter test method. The primary characteristic factors that determine fretting tiredness life were examined. In order to complete the optimization design of the three-tooth mortise and tenon joint structure, the Multi-Island Genetic Algorithm is used, which is based on the multidisciplinary optimization platform ISIGHT, with the main characteristic parameters as the design variables and the fretting fatigue life as the objective function. The following conclusions are drawn from this:
  • The primary characteristic parameters for the three-tooth mortise and tenon joint structure are ALPHA, R2, R3, R4, R6, and FI.
  • With mostly constant maximum equivalent forces, optimization increases the fretting fatigue life of the mortise and tenon joint structure while lowering the maximum contact pressure and maximum slip amplitude and enhancing the stress distribution in the structure.
  • The effectiveness of the optimization method was verified by the fretting fatigue test. The optimization results have a certain reference value for the design of the three-tooth mortise and tenon joint structure of the turbine.
The research presented in this paper can serve as a methodological guide for the parametric modeling of various mortise and tenon joint structures. The necessity for the extended life of the aero-engine allows for the effective life extension of the mortise and tenon joint structure, offering a direction for the real-world optimization of the mortise and tenon joint structure. Future research must examine the precision and effectiveness of the mortise and tenon joint structure in simplified parametric modeling. It is also necessary to investigate the effectiveness of various optimization techniques in optimal design.

Author Contributions

Conceptualization, Z.Q., D.M. and B.C.; methodology, B.C. and L.D.; software, S.L.; formal analysis, Z.Q., H.Z. and H.C.; data curation, D.M., B.C., S.L., H.Z. and H.C.; writing—original draft preparation, Z.Q. and D.M.; writing—review and editing, Z.Q., B.C., L.D., S.L., H.Z. and H.C.; visualization, D.M. and L.D. All authors have read and agreed to the published version of the manuscript.

Funding

This research was funded by the National Natural Science Foundation of China, grant number 91860111.

Conflicts of Interest

The authors declare no conflict of interest.

References

  1. Zhou, Z.; Vincent, L. Fretting Wear, 1st ed.; Science Press: Beijing, China, 2002. [Google Scholar]
  2. Zhou, Z.; Zhu, M. Composite Fretting Wear, 1st ed.; Shanghai Jiao Tong University Press: Shagnhai, China, 2004. [Google Scholar]
  3. He, M. Fretting Fatigue of Mechanical Components, 1st ed.; National Defense Industry Press: Beijing, China, 1994. [Google Scholar]
  4. Zong, H.; Tao, H.; Gao, Q.; Tan, C. Structural Analysis and Optimization of Gas Turbine Fir-Tree Attachment with Various Tooth Profile Parameters. Aeroengine 2016, 42, 64–69. [Google Scholar] [CrossRef]
  5. Hao, Y.-H.; Huang, Z.-J. Optimization design of tenon connection structure based on coordinate correlation method. J. Aerosp. Power 2014, 29, 2716–2721. [Google Scholar] [CrossRef]
  6. Yu, D.; Zhang, X.; Yang, J.; Cheng, K.; Li, M. Structural Optimization of Fir-Tree Root and Groove for Turbine Blade With Superellipse and P-Norm Aggregation Function. In Proceedings of the ASME Turbo Expo 2019: Turbomachinery Technical Conference and Exposition, Phoenix, AZ, USA, 17–21 June 2019. [Google Scholar]
  7. Yu, D.; Li, F.; Yang, J.; Kai, C.; Weilin, S.; Lv, K.; Li, M. Structural Optimization of Fir-Tree Root and Groove for Turbine Blade With Splines and Genetic Algorithm. In Proceedings of the ASME Turbo Expo 2016: Turbomachinery Technical Conference and Exposition, Seoul, Republic of Korea, 13–17 June 2016. [Google Scholar]
  8. You, Y.; Lu, S. Optimization design method for twin-web turbine disk/tenon structure based on static strength and life reliability. J. Aerosp. Power 2017, 32, 1388–1393. [Google Scholar] [CrossRef]
  9. Chen, Z.-Y.; Wang, C.; Zhou, P. Research on Robust Optimization of Fatigue Life for Blade-Disk Considering Contact Gap between Tenon and Mortise. J. Propuls. Technol. 2018, 39, 857–864. [Google Scholar] [CrossRef]
  10. Sapronov, D.; Mezencev, M.; Karimbaev, T.; Reznik, S.; Prosuntsov, P. Complex Design Method of Ceramic Blades and Metal Disk Connection. In Proceedings of the ASME Turbo Expo 2019: Turbomachinery Technical Conference and Exposition, Phoenix, AZ, USA, 17–21 June 2019. [Google Scholar]
  11. Yang, M.-C.; Sun, S.-Y. Structural optimization of turbine tenon/mortise. J. Aerosp. Power 2010, 1876–1882. [Google Scholar] [CrossRef]
  12. Tao, Y.; Tian, L.; Zhang, Y.; Lu, S. Optimal design of turbine mortise and tenon structure based on ansys. Mech Eng. 2013, 51, 11–14. [Google Scholar]
  13. Niu, X.; Zhu, S.; Gao, J.; Liao, D.; He, J. Fatigue Reliability Analysis and Optimization Design of Turbine Blade Disks under Multi-Source Uncertainties. J. Propuls. Technol. 2022, 43, 228–236. [Google Scholar] [CrossRef]
  14. Yan, X.; Zhang, H.; Xing, Z.; Yu, Z.; Cui, H.; Wen, W. Optimization of turbine tenon structure against fretting fatigue damage. Gas Turbine Exp. Res. 2022, 35, 36–40. [Google Scholar]
  15. Du, Q.; Zhang, J.; Zhang, H.; Liang, Z.; Chen, Y.; Li, J.; Xu, S. Research on fatigue life optimization design and verification method for large size disk and tenon structural parts. J. Propuls. Technol. 2023, 1–8. Available online: http://kns.cnki.net/kcms/detail/11.1813.V.20230303.0938.005.html (accessed on 18 April 2023).
  16. Yu, M.; Wu, D.; Zhao, J.; Liu, S.; Gong, K.; Qu, Z. Vibration characteristics analysis of a type of turbine disk-blade assembly system in the civil aero-engine. Adv. Mech. Eng. 2022, 14, 1–11. [Google Scholar] [CrossRef]
  17. Tan, C.; Gao, H.; Li, L.; Sun, S.; Yang, W. Turbine blade arc tenon/mortise structure and optimization method based on parameterized mesh deformation. Struct. Multidiscip. Optim. 2022, 65, 239. [Google Scholar] [CrossRef]
  18. Xu, Y.; Cui, H.; Chen, W. Microdynamic fatigue life prediction of dovetail joint structures based on the critical surface method. J. Aerosp. Power 2013, 28(3), 489–493. [Google Scholar] [CrossRef]
  19. Shi, W.; Wen, W.; Cui, H. Research on fretting fatigue life of dovetail joints. J. Aerosp. Power 2014, 29, 104–110. [Google Scholar]
  20. Wang, N.; Cui, H.; Zhang, H. Low cycle fretting fatigue tests of dovetail structure at elevated temperature. J. Aerosp. Power 2018, 33, 3007–3012. [Google Scholar] [CrossRef]
  21. Yan, L.; Hu, D.; Tian, T.; Mao, J.; Wang, R. Design and experiment of simulated specimen for fretting fatigue of turbine attachment. J. Aerosp. Power 2022, 1–9. [Google Scholar] [CrossRef]
  22. Qu, Z.; Liu, K.; Wang, B.; Chen, Z. Fretting Fatigue Experiment and Finite Element Analysis for Dovetail Specimen at High Temperature. Appl. Sci. 2021, 11, 9913. [Google Scholar] [CrossRef]
  23. Hu, C.; Wei, D.; Wang, Y.; Shi, L. Experimental and numerical study of fretting fatigue in dovetail assembly using a total life prediction model. Eng. Fract. Mech. 2019, 205, 301–318. [Google Scholar] [CrossRef]
  24. Wu, B.; Zhang, H.; Cui, H.; Wang, N. High-temperature fretting fatigue life prediction model based on continuum damage mechanics. J. Aerosp. Power 2019, 34, 656–663. [Google Scholar]
  25. Zhang, H.; Yang, X.; Cui, H.; Wen, W. Study on the Effect of Laser Quenching on Fretting Fatigue Life. Metals 2019, 9, 566. [Google Scholar] [CrossRef] [Green Version]
  26. Yang, X.; Zhang, H.; Cui, H.; Wen, C. Effect of Laser Shock Peening on Fretting Fatigue Life of TC11 Titanium Alloy. Materials 2020, 13, 4711. [Google Scholar] [CrossRef]
  27. Xing, Z.; Zhang, H.; Yu, Z.; Cui, B.; Wen, W. Fretting fatigue test of ZSGH4169 dovetail structure. J. Aerosp. Power 2021, 36, 2410–2417. [Google Scholar]
  28. Xing, Z. Research on Fretting Fatigue Mechanism and Life Model of ZSGH4169/DZ125 Contact Pairs. Master Thesis, Nanjing University of Aeronautics and Astronautics, Nanjing, China, 2021. [Google Scholar]
  29. Xu, K.; Li, W.; Huang, Y.; Yu, Q.; Ma, G.; Hu, W. A fretting fatigue total life prediction method for dovetail attachment. J. Beijing Univ. Aeronaut. Astronaut. 2020, 1890–1898. [Google Scholar] [CrossRef]
  30. Jin, O.; Mall, S. Shear force effects on fretting fatigue behavior of Ti-6Al-4V. Metall. Mater. Trans. A 2004, 35, 131–138. [Google Scholar] [CrossRef]
  31. Jin, R.; Chen, W.; Sudjianto, A. An efficient algorithm for constructing optimal design of computer experiments. J. Stat. Plan. Inference. 2005, 134, 268–287. [Google Scholar] [CrossRef]
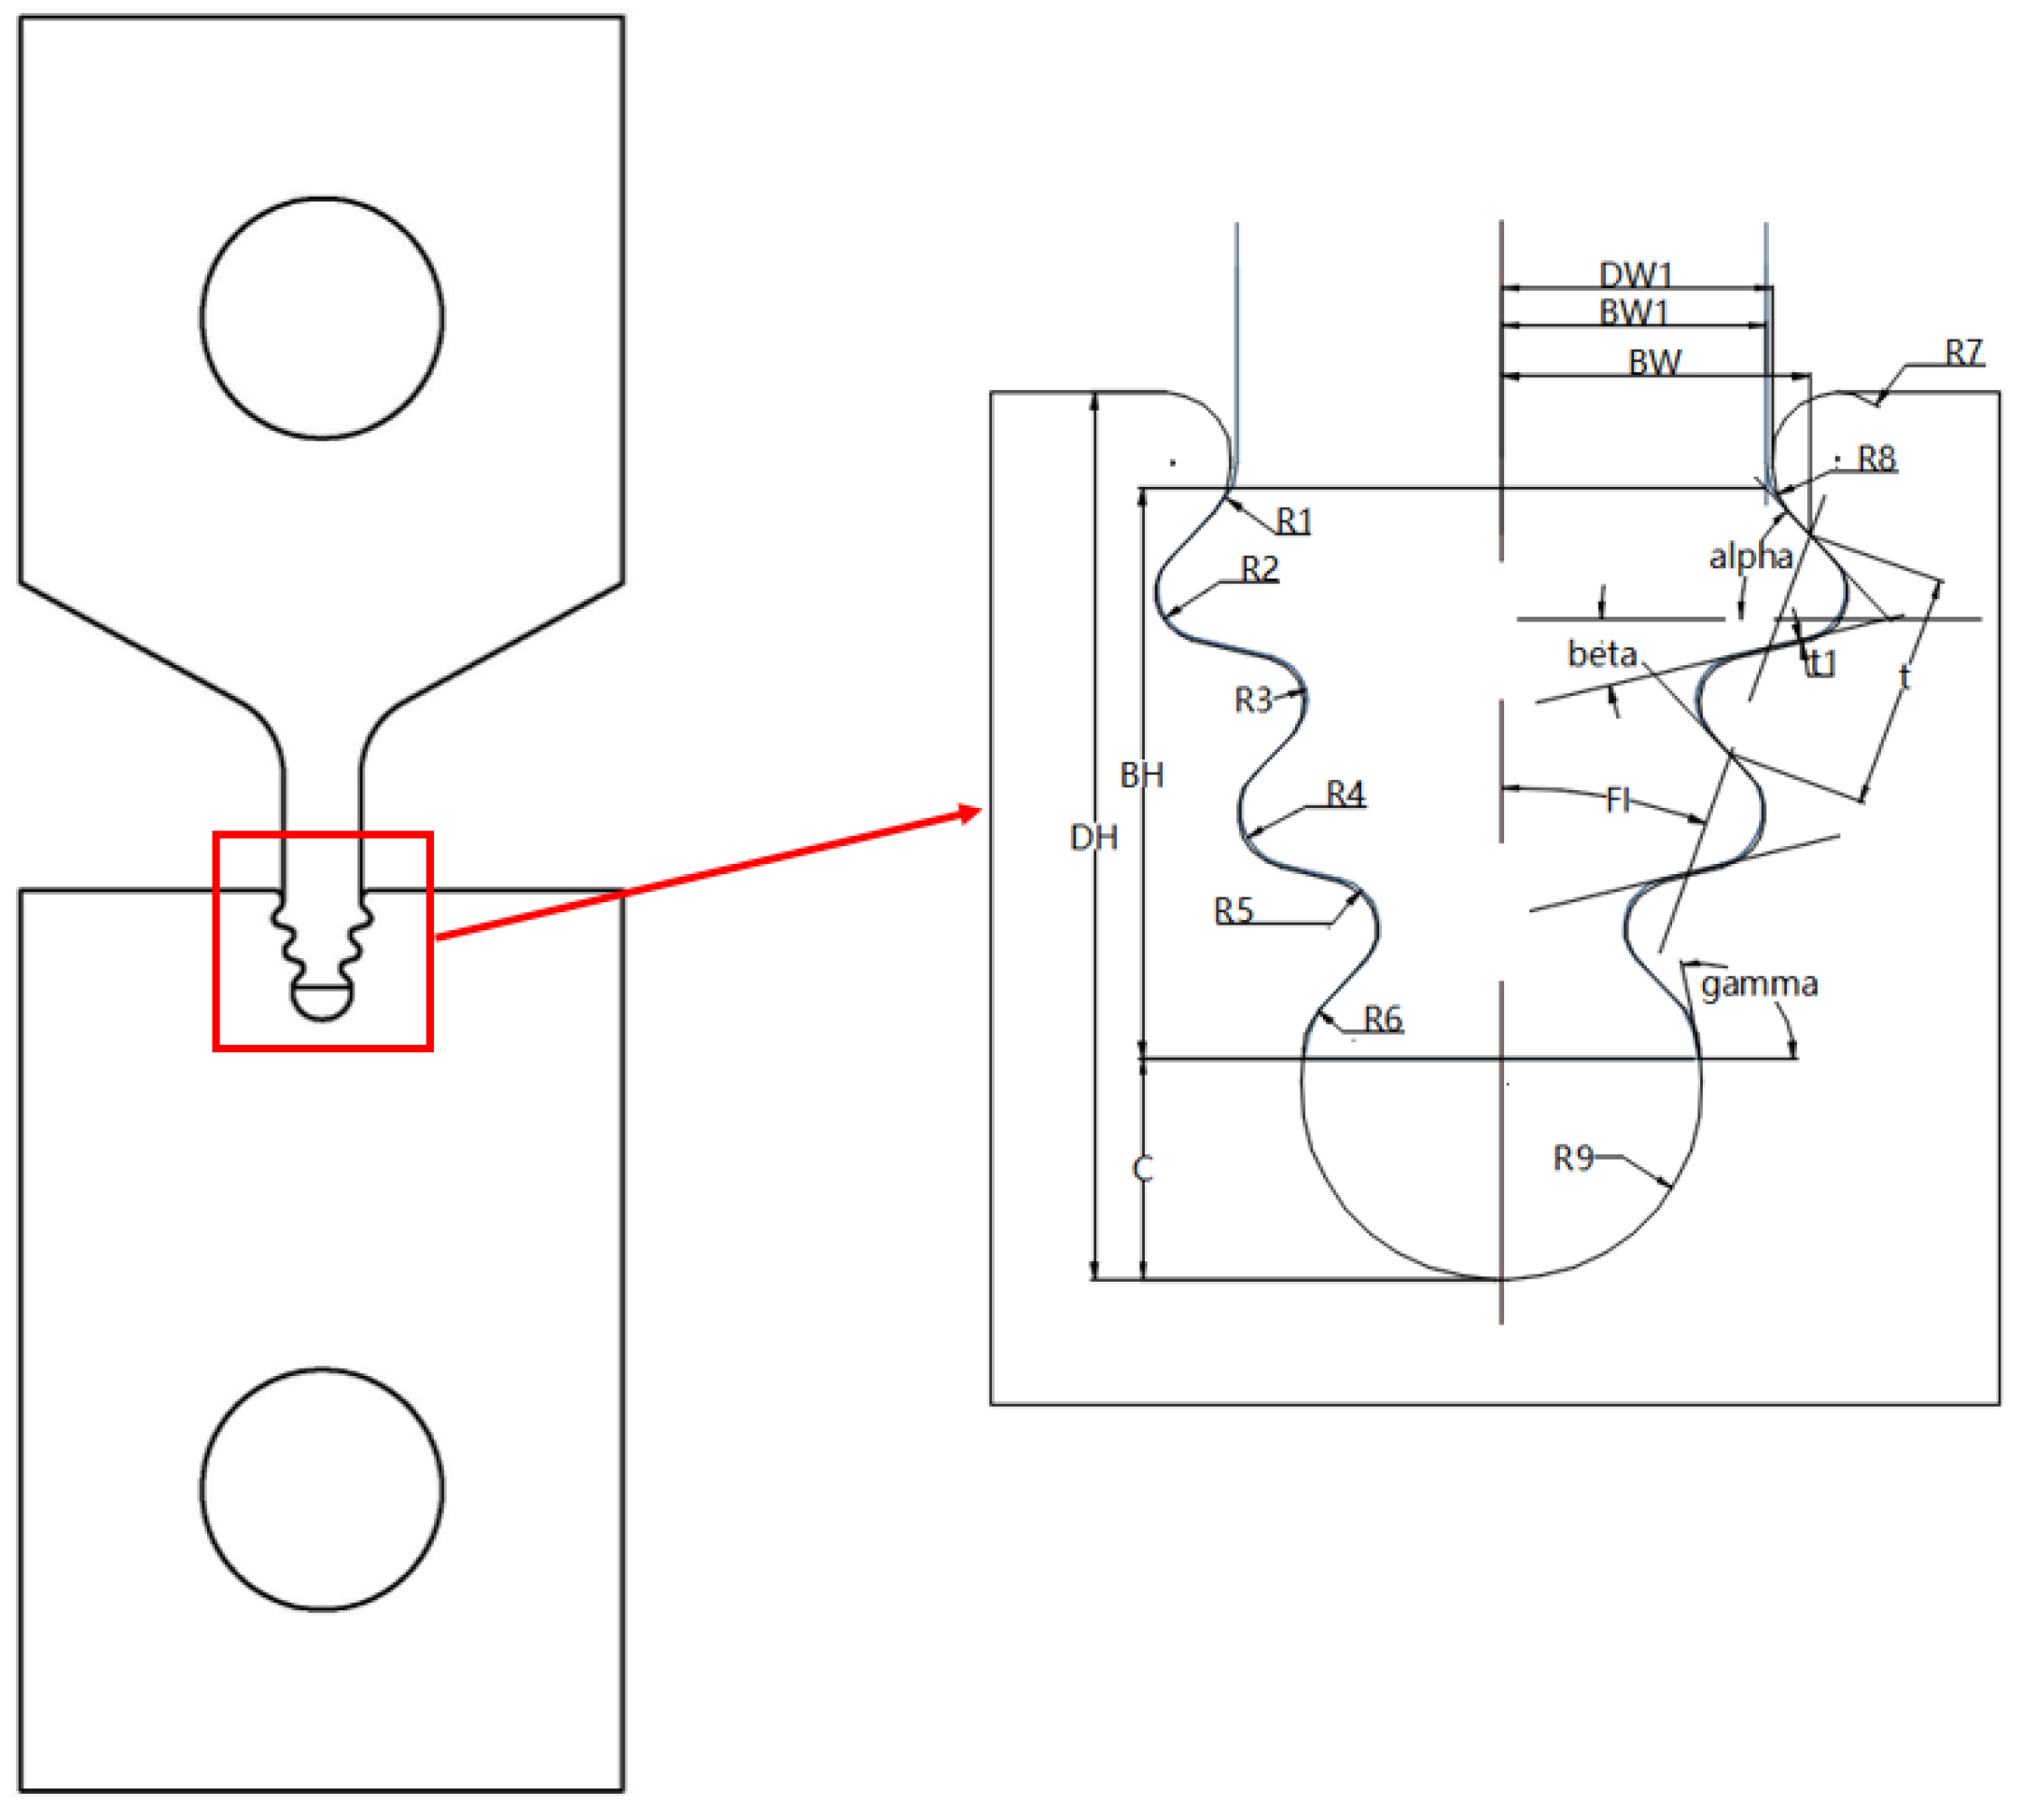
Figure 1. Three-tooth profile and independent parameters.
Metals 13 01116 g001
Figure 2. FE model of three-tooth mortise and tenon joint structure.
Metals 13 01116 g002
Figure 3. Pareto chart of three-tooth structural parameters.
Metals 13 01116 g003
Figure 4. Optimization design flowchart.
Metals 13 01116 g004
Figure 5. The iteration of the objective function.
Metals 13 01116 g005
Figure 6. Equivalent stress cloud before and after optimization: (a) before optimization; (b) after optimization.
Metals 13 01116 g006
Figure 7. Contact pressure cloud before and after optimization: (a) before optimization; (b) after optimization.
Metals 13 01116 g007
Figure 8. Slip amplitude cloud before and after optimization: (a) before optimization; (b) after optimization.
Metals 13 01116 g008
Figure 9. Test device.
Metals 13 01116 g009
Figure 10. Test piece.
Metals 13 01116 g010
Figure 11. Morphology of the first tooth under the optical microscope: (a) before optimization (b) after optimization.
Metals 13 01116 g011
Figure 12. Morphology of the second tooth under the optical microscope: (a) before optimization (b) after optimization.
Metals 13 01116 g012
Figure 13. Morphology of the third tooth under the optical microscope: (a) before optimization (b) after optimization.
Metals 13 01116 g013
Table 1. Characteristic parameters of three-tooth structure.
Parameter Description Parameter Description
BWShoulder width of the tenonBW1Neck width of the tenon
DW1Neck width of the mortiseBHHeight of the tenon
DHHeight of the mortiseCClearance at the bottom of the mortise
alphaUpward inclinationbetaDownward inclination
FIWedge anglegammaThe inclination of the bottom of the mortise
tPitcht1Clearance between teeth
R1Radius of the transition arc between tenon teeth 1R2The radius of the transition arc of tooth top 1
R3The transition arc radius of tooth root 1R4The radius of the transition arc of tooth top 2
R5The transition arc radius of tooth root 2R6The radius of the transition arc between the teeth of tenon 2
R7The arc radius of the transition arc on the top surface of mortiseR8The radius of the transition arc between the teeth of the mortise
R9The transition arc radius at the bottom of the mortise
Table 2. Values of parameters before and after optimization.
Parameters Before Minimum LimitMaximum Limit After
ALPHA (°)43.5404842.5
FI (°)20122219.5
R2 (mm)0.580.480.680.50
R3 (mm)0.550.450.650.614
R4 (mm)0.680.580.780.597
R6 (mm)0.60.50.70.676
Nf9347\\17,206
Table 3. Comparison of finite element results before and after optimization.
BeforeAfter
Maximum equivalent stress (MPa)11991198
Contact pressure (MPa)20292018
Maximum slip amplitude (μm)9.036 × 10−27.859 × 10−2
Table 4. Life results of fretting fatigue test.
Temperature
(°C)
Peak Load
(kN)
Life
(Cycle)
Average Life
(Cycle)
Before6501484227613
6804
After10,88911,518
12,146
Disclaimer/Publisher’s Note: The statements, opinions and data contained in all publications are solely those of the individual author(s) and contributor(s) and not of MDPI and/or the editor(s). MDPI and/or the editor(s) disclaim responsibility for any injury to people or property resulting from any ideas, methods, instructions or products referred to in the content.