Abstract
The magnitude and distribution of contact stress on the metal-to-metal seal interface of premium connection has been confirmed as a direct factor of the sealing integrity. In this study, the method of evaluating sealability by measuring contact stress on metal-to-metal seals with the ultrasonic phased array is investigated. A loading system and ultrasonic phased array measurement system of cone-cone contact samples were created. The recommended detection method is focusing -deflection, and the time compensation method is suggested to extract the reflected wave peak of the sealing surface. The experiments show that the reflected wave peak declines with the rise of the axial load, with the big end showing the most noticeable reduction. The shift in the reflected wave peak also reflects the axial movement of the contact interface. The contact stress is calculated according to the reflection coefficient and compared with the simulation results. The distribution trend of contact stress is consistent. The sealing index measurement error is less than 15%, and the measurement error is decreased with the decrease of the sealing surface angle. Then, the nephogram of contact stress distribution on the sealing surface is formed to visualize the contact stress, which takes on great significance in engineering.
1. Introduction
The increasingly severe oil and gas exploitation environment (e.g., high-temperature and high-pressure ultra-deep Wells) has raised more rigorous requirements for the sealing of tubing and casing [1]. Premium connection with prominent strength and sealing properties has been extensively employed in the above-mentioned harsh environments [2]. However, premium connection sealing failures remain [3]. Several accident cases have proved that the main reason for sealing failure is insufficient or discontinuous contact stress on the sealing surface, which develops into a leakage path [4,5]. Once the tubing leaks downhole, the repair operation will consume considerable manpower and property, such that a loss of production is triggered [6]. Accordingly, the sealing integrity of the tubing should be ensured [7]. The main reasons for the sealing failure of tubing premium connection are not only the structural design and material selection to meet the operating conditions, but also the processing and manufacturing of tubing, transportation, and the quality of tubing makeup [8,9,10,11,12]. In general, the combined effects of the above-described uncertainties constitute a potential leakage risk [13]. Researchers study the sealing performance of premium connections from three directions: analytical theory, finite element, and experiment [14,15]. To be specific, the most intuitive performance evaluation is reflected in the experiment process, and the helium leak detection technology is the most widely used method to examine the sealing of the premium connection [16], whether in the experiment or after the tubing is made up at the field. Helium leak detection technology can be considered the last barrier to ensure the seal quality of tubing. However, under the effect of the large volume of helium leak detection equipment and the complicated operation process, it is difficult to implement in narrow working spaces (e.g., offshore platforms) [17]. Furthermore, helium leakage detection is an indirect measurement method, such that the contact condition of the sealing surface cannot be indicated.
The method of ultrasonic stress measurement has been introduced in the sealing monitoring of tubing, and it is promising in applications [18]. From the perspective of the sealing principle, the premium connection adopts metal-to-metal contact sealing, and the size and distribution of contact stress between the seal surfaces directly determine the sealing reliability [19]. Therefore, ultrasonic measurement of contact stress on the sealing surface is the most direct measure of sealing property [20]. In 1973, Tattersall [21] investigated ultrasonic reflection on the adhesive interface using a quasi-static spring model, i.e., one of the basic models and theoretical basis for later research on the correlation between contact and ultrasound and has been cited in numerous studies [22,23,24]. Ultrasonic signals are very sensitive to small changes in the interface. Ultrasonic technology has been used to determine the characteristics exhibited by solid-solid contact interfaces and clarify the elastic-plastic deformation behaviour of the interface to predict contact properties [25]. Xiao et al. [26] have introduced surface roughness parameters and matrix material properties into the basic spring model to improve the measurement accuracy of contact stiffness. Qi et al. [27] quantitatively identified the interface stiffness and characterised the binding quality of the coating/substrate interface through the ultrasonic stress reflection coefficient amplitude spectrum. In the study of ultrasonic measurement of contact stress, Du [28] examined the contact stress distribution on spindle-holder taper interfaces using an immersion transducer and examined how angle error and load affected the contact stiffness and stress distribution. Wang [29] analysed the effect of rough interface parameters on the ultrasonic reflection coefficient by the finite element method, provided a relationship model between the ultrasonic reflection coefficient and the contact stress of the rough interface, and examined the contact stress of the rubber contact interface. However, it does not apply to metal-to-metal contact. The contact process between rubber and metal is elastic, while the contact between metal and metal is a complex elastic-plastic deformation process. At present, there is no unified relationship model between the metal-to-metal interface contact stress and the ultrasonic signal, only empirical fitting during the experimental process. Therefore, a calibration curve needs to be established to define the relationship between them.
Traditional ultrasound is limited by the measurement angle and probe size and is inefficient in the measurement of tubing contact stress, which has not been popularised and applied. Ultrasonic phased array offers the benefits of a flexible and controlled acoustic beam, high detection accuracy, and high detection efficiency. It has received a lot of attention recently in the non-destructive testing industry [30,31,32]. Cao [33,34] investigated the ultrasonic phased array detection of carbon fibre composites and proposed a method based on signal correlation to improve the detection accuracy of defects. Zhou et al. [35] monitored the contact between steel balls and slotted steel plates and nitrile balls and organic glass plates using an ultrasonic phased array and were able to visualise the contact stress distribution in two dimensions. The use of an ultrasonic phased array in contact stress measurement serves as a novel practical approach to assessing the sealing of tubing, and it is deserving of consideration. Using an ultrasonic phased array to measure the contact stress of the sealing surface in a full-size tubing test has been tried in a previous paper [36]. However, the ultrasonic phased array is more for the location and quantitative identification of defects [37,38]. In terms of the premium connection, the ultrasonic phased array signal distribution on the sealing surface and the ultrasonic characterisation of contact stress evolution have been reported on little thus far.
This ultrasonic phased array measurement method includes selecting the measurement mode, extracting the peak reflection wave of the sealing surface based on the time compensation method to further calculate the reflection coefficient, and a calibration experiment to determine the relationship between the ultrasonic reflection coefficient and the contact stress. On this basis, in conjunction with the sealability criterion, the effects of different axial loads and sealing surface angles on the contact stress distribution and sealing performance are investigated. The proposed method can be used for diagnosing the sealing performance of premium connections with different sealing structures, which is helpful for evaluating the make-up quality in on-site operations and analysing the evolution law of the sealing state in premium connection performance evaluation testing.
The remainder of this paper is organised as follows. The premium connection metal seal theory, the ultrasonic phased array signal propagation mode on the sealing surface, and the ultrasonic propagation mechanism on the rough interface are all introduced in Section 2 of this study. The cone-cone contact sample, loading apparatus, and measuring device are all provided in Section 3, together with a discussion of the measurement procedure and the calibration results. Section 4 provides the experimental findings and related discussions are presented. In Section 5, the paper’s conclusion is drawn.
2. Theoretical Part
2.1. Sealing Principle of Premium Connection
The respective machined surface has some degree of roughness [39], and the primary mechanism of metal-to-metal contact refers to the pressure-induced mutual extrusion deformation of two rough surfaces [40]. Figure 1 presents the premium connection seal interface’s microscopic alterations during the make-up process. The number of micro convex bodies on the metal surface is higher, and there is a greater surface gap when it is not made up. When the torque rises throughout the make-up process, the metal-to-metal seal surface starts to come into contact, and with the contact, stress steadily grows. Under the effect of contact pressure, the micro-convex body on the rough surface will deform elastoplastically and progressively flatten. The gap between the contact surfaces narrows as more of the surface starts to fit, progressively obstructing the gas leakage route. If the make-up is complete, the metal surfaces are intimately attached to one another and eventually come together to create a contact stress ring of a specific width, which boosts fluid leakage resistance and lowers leakage rates. The evaluation index of metal-to-metal seals sealability is written as [41]:
where denotes the sealing index, represents the effective contact length, and P expresses the contact stress. When the limit leakage speed is 0.025 cm3/15 min, the critical sealing index is [41]:
where denotes the critical sealing index, and is atmospheric pressure (MPa). Since the data collected in the experiment is discrete, represents the average value of the sealing index on the effective length, and expresses the product of the average sealing index and the effective contact length. Thus, the sealability can be analysed. In terms of the cone-to-cone sealing structure, a short contact length often necessitates a high contact stress distribution, whereas a long contact length allows the contact stress to be adequately lowered [42]. Accordingly, the contact stress on the contact length should be gauged.
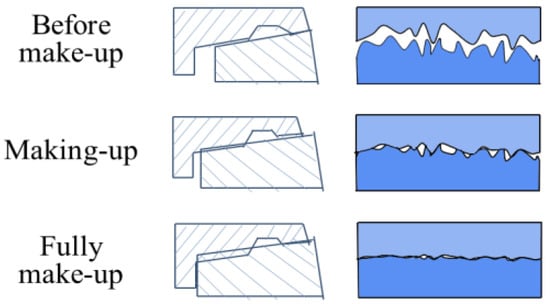
Figure 1.
Microscopic contact process of making-up premium connection.
2.2. Propagation of Ultrasonic Phased Array Signals at the Sealing Interface
The ultrasonic phased array linear probe is uniformly arranged by multiple independent piezoelectric wafer elements, and each array element can transmit and receive ultrasonic waves. Figure 2 illustrates the linear array probe layout. The respective piezoelectric wafer element that makes up the ultrasonic phased array linear array probe is evenly distributed and capable of both transmitting and receiving ultrasonic waves independently. The main parameters of the probe comprise the number of elements N, element spacing d, element width w, element length l, as well as activation aperture n. The activation aperture is the number of elements simultaneously excited during measurement. The scanning width is (N-n) d.
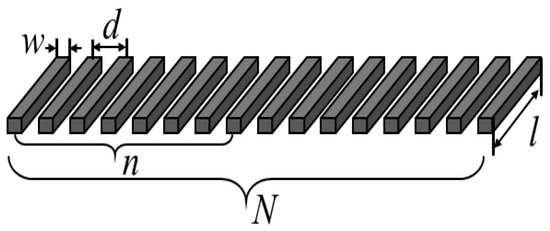
Figure 2.
Parameters of ultrasonic phased array linear probe.
When there is a phase difference between the ultrasonic beams emitted by different elements, they interfere with one another and superimpose the medium to create wavefronts with different forms, allowing for the measurement of specimens with different shapes. For the cone-to-cone metal sealing interface, the ultrasonic phased array probe can transmit the deflection wave through the linear delay rule [30], and the formed wavefront is parallel to the sealing interface, as shown in Figure 3a. The sound beams from the sealing interface will be vertically reflected and received. Another method refers to combining linear and symmetrical delays to the incident of the focusing-deflection waves vertically at the sealing interface. The concentrated sound beam produced by a group of elements is shown in Figure 3b. There are usually multiple sets of such focused acoustic beam scanning detection objects, and the reflected signals of these beams carry reflected waves from the sealing surface.
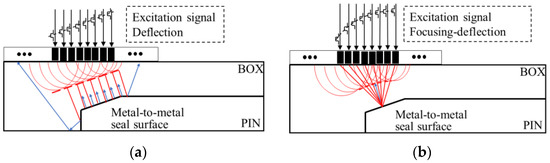
Figure 3.
Schematic diagram of ultrasonic phased array signal propagating on the sealing surface: (a) Incident wave deflection; (b) Incident wave focusing-deflection.
The ultrasonic phased array probe can be equivalent to the combination of traditional ultrasonic probes with the same number and size as the element. Ultrasonic propagation at the contact interface is affected by contact stress, surface roughness, clearance medium, and other factors [35]. The larger the contact stress is, the smaller the surface roughness is, the closer the sound velocity and density of the gap medium are to the contact body, and the more the ultrasonic wave is transmitted at the contact interface, the less the corresponding reflected wave is. The deformation of the micro-convex body on the rough surface at a particular contact surface leads to the growth of the true contact area with an increase in contact pressure [43]. In the contact part, as depicted in Figure 4, ultrasonic transmission is practically finished, and reflection takes place in the uncontacted part. As the interface contact stress increases, the reflected ultrasonic energy steadily declines. At present, the correlation between the contact stress and the reflection coefficient of the interface does not have a unified model, so it needs to be built by calibration experiments.
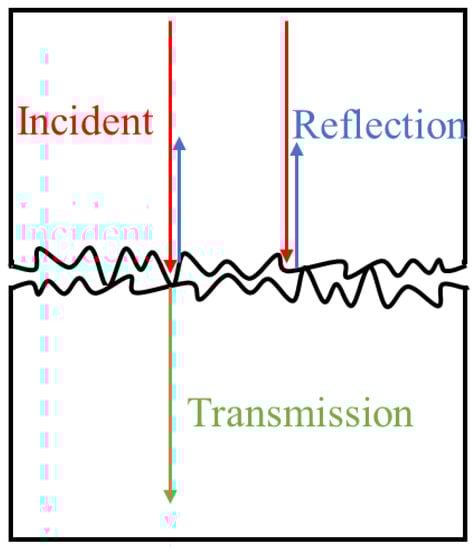
Figure 4.
Ultrasonic propagation at rough interfaces.
3. Experimental Part
3.1. Experimental Equipment and Materials
Design and fabricate the cone-cone contact specimen and loading device referencing the metal-to-metal seal structure of the premium connection. Figure 5 shows the schematic diagram of the loading device, and Figure 6 shows the experimental system. The axial loading force is applied by a 500 kN hydraulic jack (stroke is 10 mm), and the load is controlled by a 350 kN pressure sensor and displayed by a weighing instrument. The experimental measurement device is CTS-PA22A ultrasonic phased array instrument (GOWORLD, Guangzhou, China). The linear array probe contains 64 array elements, and the detailed parameters are shown in Table 1. The wedge of the probe was polished into an arc surface, which can closely fit with the upper sample. To ensure signal transmission, ultrasonic couplants are daubed between the probe wedge and the sample, amplitude calibration is required prior to the use of the probe.
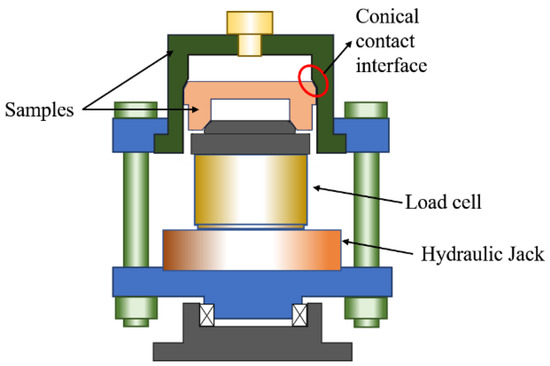
Figure 5.
Device diagram.
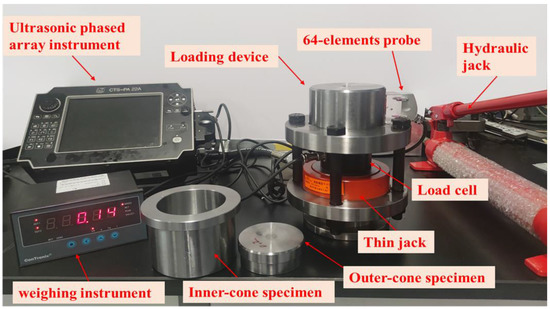
Figure 6.
Experimental system.

Table 1.
Parameters of ultrasonic phased array probe.
The lower sample in the contact sample exhibits an outer diameter of 85 mm and is made of 30 Mn5. In addition, the upper sample exhibits an outer diameter of 108 mm and is made of 28 MnTiB. The materials employed in the sample are typical for petroleum pipelines. Figure 7 illustrates the sample’s structure. Cone-cone contact specimens with sealing surface angles of 5°, 10°, 15°, 20°, and 30° are processed as the sealing surface angle of the premium connection generally ranges from 0° to 30°. The sealing contact length for the 30° specimen is 3 mm, whereas it reaches 5 mm for the others. A profile measuring instrument is adopted to scan the respective specimen, so as to examine the angle and roughness of the sealing surface. The angular error of the five sets of samples falls in the acceptable range as defined by the BT standard recommendation, suggesting that the permitted angular error reaches 20.5”. The five sets of samples’ equivalent roughness range from 1.4 to 1.6 um. Table 2 lists the specific parameters for the samples.
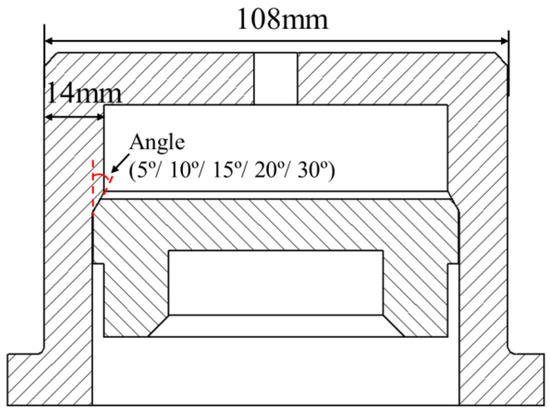
Figure 7.
Geometry of the contact specimen.
Table 2.
Seal surface angle and length of specimen.
3.2. The Selection of Activation Aperture and the Reflection Peak Extraction of Sealing Interface
Deflection and focusing-deflection have different detection effects and vary with the angle of the sealing surface. Prior to loading, ultrasonic phased array equipment is adopted to examine the echoes of the upper sample at the angle of 5°, 10°, 15°, 20°, and 30°. The excitation aperture is set at 1 for deflection and 16 for focusing-deflection. The deflection angle is regulated by the sealing surface’s angle. Figure 8 presents the ultrasonic signal from a 10° specimen acquired in focusing-deflection mode, i.e., the signal distribution after envelope processing. The estimation of the echo arrival time becomes more exact, which is recognized as a benefit. As depicted in the figure, the reflected signals originate from the sample’s inner wall and sealing surface.
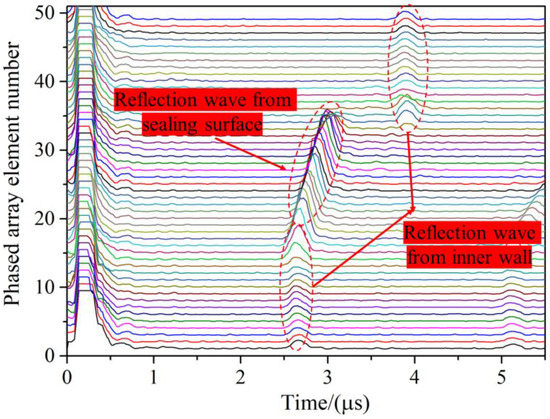
Figure 8.
Ultrasonic signal distribution of 10° specimen.
Figure 9 presents the time domain signals for the 5 sets of samples under the excitation aperture of 1. The X-axis is the element number, and the Y-axis is the time. The ultrasonic amplitude is greater the darker the hue. As can be observed, both the sample’s inner wall and the sealing surface’s reflected echo can be received. However, the phenomenon of sidelobe clutter and ultrasonic energy leaks develop as a result of the large number and size of ultrasonic phased array elements, interfering with the reflection field. When the sealing surface angle increases, the effect of the sidelobe clutter grows. Figure 10 displays the time domain signals for the 5 sets of samples under the excitation aperture of 16. The strength of the sidelobe clutter is substantially weaker, and the reflected echo energy of the inner wall is also significantly reduced in the sample with a larger angle, which makes it easier to identify the reflected signal from the sealing surface. However, when the angle of the sealing surface is small, echoes from other interfaces will still be received. Additionally, it can be shown that while retaining the same amplitude gain, the echo peak of the sealing surface falls overall with an increase in the angle. To ensure that the sealing surface’s echo may be successfully picked up when the angle of the sealing surface is larger, the amplitude gain must be increased. In conclusion, in ultrasonic phased array measurement of the sealing surface, activation aperture 16, deflection angle equal to the sealing surface angle, and appropriate gain are considered.
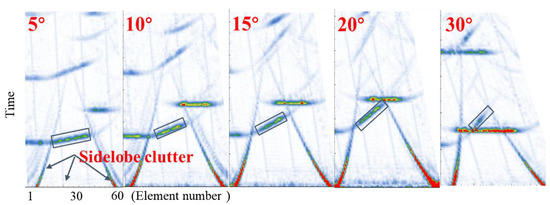
Figure 9.
Test results of different cone structures (excitation aperture is 1).
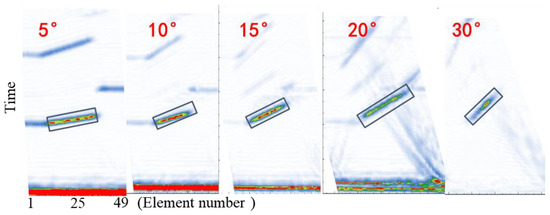
Figure 10.
Test results of different cone structures (excitation aperture is 16).
The reflected wave peak of the sealing surface is the main characteristic parameter to be extracted. To ensure that the echo from the sealing surface falls within the same time window, time compensation is applied to the time domain signal that the ultrasonic phased array receives. A peak profile of the sealing surface is further derived by extracting the wave peak of the time window. When each element’s signal incident time is constant, the time difference between adjacent elements receiving the sealing surface’s echo meets the following relationship:
where d is element spacing, c is medium acoustic velocity, and θ is the angle of the sealing surface. Therefore, when the time compensation of acoustic beam #49 is 0, the time compensation of each acoustic beam is:
The time-domain signal distribution following time compensation processing is seen in Figure 11 and Figure 12. The extraction is made easier by the fact that the reflected signals from the sealing surface fall into the same time window in this time domain. The figure indicates the sequence number of the array elements that are receiving the echo signal from the sealing surface, and the examined width is essentially consistent with the sealing surface’s length. The outcomes demonstrate the great precision of the ultrasonic phased array in determining the length of the sealing surface.
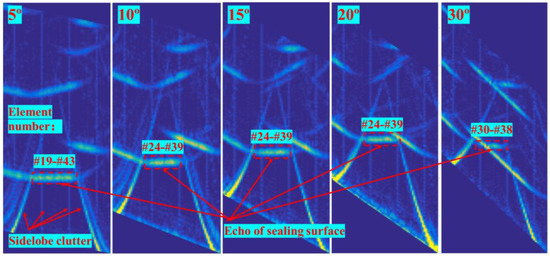
Figure 11.
Ultrasonic signal processing results (activation aperture 1).
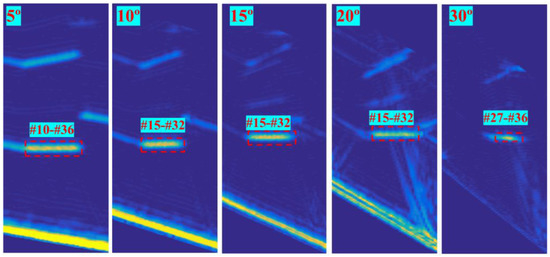
Figure 12.
Ultrasonic signal processing results (activation aperture 16).
The peaks obtained are normalised, and the peak profiles on the sealing surface are compared under the excitation aperture of 1 and 16. The result is shown in Figure 13. As depicted in the figure, the wave peak distribution trend is the same for the deflection and the focusing-deflection ways of extracting the reflected wave peaks of the sealing surface. Overall, it shows a convex distribution trend with initial increases and subsequent declines. A peak flat zone is formed when the number of sound beams with high peaks grows as the length of the sealing surface increases. The ultrasonic energy concentration was higher at activation aperture 16 compared with the findings of activation aperture 1, and the wave peaks on the sealing surface changed substantially less and were noticeably higher than those on other surfaces. It further exemplifies the high measurement quality achieved with the focusing-deflection mode.
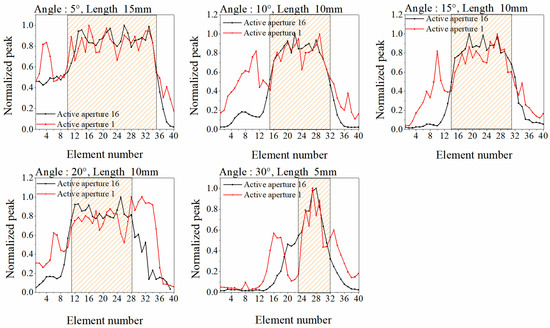
Figure 13.
Comparison of peak normalisation of seal surface between simulation and experiment.
3.3. Calibration Experiment
To obtain cone-cone interface contact stress, a calibration experiment is designed to determine the correlation between contact stress and ultrasonic phased array signal distribution. A thin cylinder with a diameter of 100 mm and a thickness of 20 mm and a cylinder with a diameter of 20 mm and a thickness of 20 mm are the specimens utilised in this experiment for contact. The specimens are made of the same materials as the cone-cone contact specimens. The contact interface exhibited the equivalent roughness of 1.5 um, i.e., the average roughness of the cone-cone contact specimens. The load was applied with a 10 KN axial pressure interval, and the contact interface’s ultrasonic signal was recorded. Figure 14 presents the signal distribution of 49 groups of acoustic beams prior to loading. Every element simultaneously obtains the reflected echo from the interface, and the echo amplitude fluctuates slightly. Although gain compensation can improve the differences between components, it is difficult to completely unify. Therefore, the ratio of the loaded echo amplitude to the non-loaded echo amplitude is used as the reflection coefficient to eliminate the difference of each element signal fluctuation.
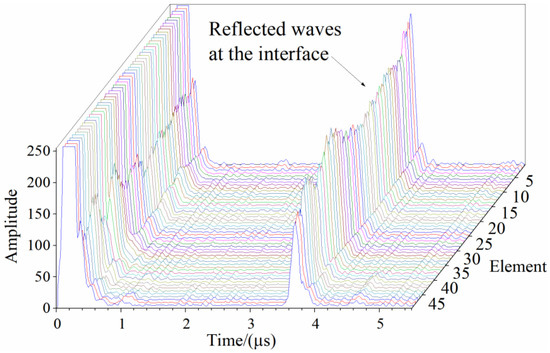
Figure 14.
Time domain signal distribution of ultrasonic phased array.
The echo peak at the contact interface under different loading forces is extracted, and the corresponding reflection coefficient is determined. Figure 15 illustrates the reflection coefficient profiles with loading force, and the transverse position was determined by the scanning width of the probe. The reflection coefficients of each acoustic beam do not vary evenly because of the roughness of the interface, suggesting that the real contact interface’s contact stress does not have an ideal uniform distribution. The average contact stress of the interface can be determined by the contact area and loading force. The correlation between average contact stress and average reflection coefficient can be fitted by exponential regression. The exponential fitting curve is shown in Figure 16. The correlation coefficient reaches 0.96, and the result of exponential regression is written as:
where, r is the reflection coefficient and P is the contact stress.
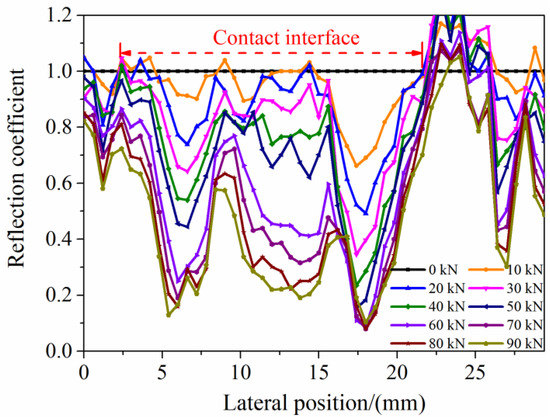
Figure 15.
Reflection coefficient profiles varying with load.
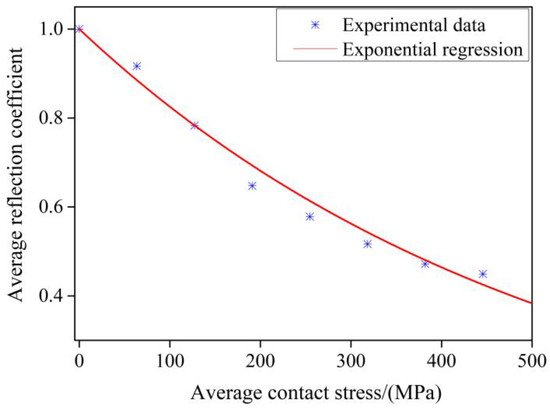
Figure 16.
Average reflection coefficient profiles varying with load.
4. Results and Discussion
4.1. Calculation of Contact Stress
The contact stress distribution of sealing interfaces at different angles should be calculated to verify the reliability of ultrasonic phased array measurement of contact stress. The finite element simulation software Abaqus is adopted to create 2D axisymmetric contact models of five groups of samples, as illustrated in Figure 17. The elastic modulus is 210 GPa, the Poisson’s ratio is 0.3, the elastic coefficient is 0.15, and the contact type is hard contact in the model. By getting the standard specimen ready for the tensile test, one may determine the material’s yield strength. The lower specimen’s yield strength is 400 MPa, whereas the upper specimen’s yield strength is 500 MPa. The angle and length of the sealing surface are consistent with the sample employed in the experiment. The symmetry axis employs a symmetric boundary, the upper end of the upper sample is fixed, the lower end of the lower sample pressure is applied, and the total loading force is the product of the pressure and area.
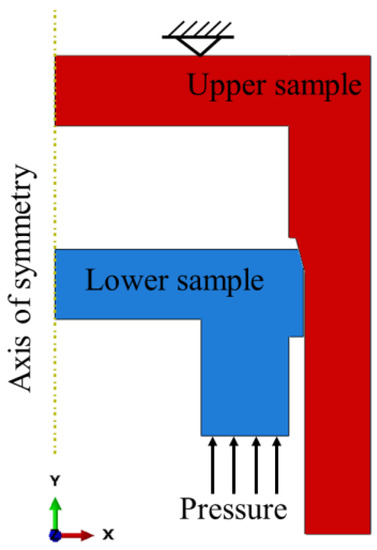
Figure 17.
Two-dimensional simulation model.
On the sealing surface of the upper sample, a path is drawn from the big end to the small end to pick up the contact stress. Figure 18a–e displays the results of the contact stress profiles for specimens with different conical surfaces. The contact stress at the conical sealing interface exhibits a U-shaped distribution. There is a clear area of high contact stress at both ends of the sealing interface, where it is not symmetrical. The contact stress at the big end of the conical interface is notably higher than in other parts. The contact stress tends to be increased with the increase of the axial load, and the contact end will first be subjected to plastic deformation. In the loading process, the interface interferes with contact, and the position of the contact surface moves to the small end. The correlation between the average sealing index and the load at the contact interface is depicted in Figure 18f. The average sealing index is elevated with loading force. The average sealing index is reduced with the increase of the sealing surface angle. In terms of the 30° sample, the contact length is only 3 mm. Under the same load, the average contact stress is high, but the sealing index is low.
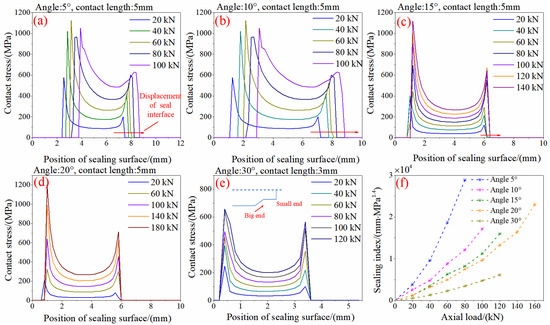
Figure 18.
The simulation results of five groups of samples (Contact stress profiles (a–e), sealing index (f)).
4.2. Ultrasonic Phased Array Signal of Cone-Cone Contact Surface during Loading
The axial load is applied to a 15° cone-cone contact sample. The ultrasonic phased array probe is fixed on the outer wall of the upper sample, in which the echo of the sealing surface can be received. Element #1 is on the large end of the conical contact, and element #64 is on the small end of the conical contact. The activation aperture of the ultrasonic phased array is set to 16, a total of 49 acoustic beams are emitted, the incident angle is set to −15°, and the deflection direction is perpendicular to the sealing surface. An ultrasonic phased array is utilised to gather signals following each loading, with a loading interval of 20 KN. The reflected wave peak of the sealing surface is derived following the time compensation of the collected signal. Figure 19 illustrates how the loading force alters the reflected wave peak profile. The upper sample’s 10 mm sealing surface length corresponds to 17 elements, which are represented in the figure as element #16–element #32. The sealing contact length is 5 mm, and the corresponding number of elements is about 9. The figure illustrates how the reflected wave peak’s change is not uniform. The most noticeable peak drop occurs in element #17, located at the contact’s big end. The reflected wave peaks of the small end tend to decline with the increase of the load. This is brought on by the effect of inevitable angle machining errors. The big end contacts first throughout the contact process, and as the interference increases, the small end touches. Another discovery is that as the loading force increases, the element where the peak drops the fastest moves to the small end, reflecting the relative axial displacement of the contact and being consistent with the displacement outcomes seen in the contact stress simulation.
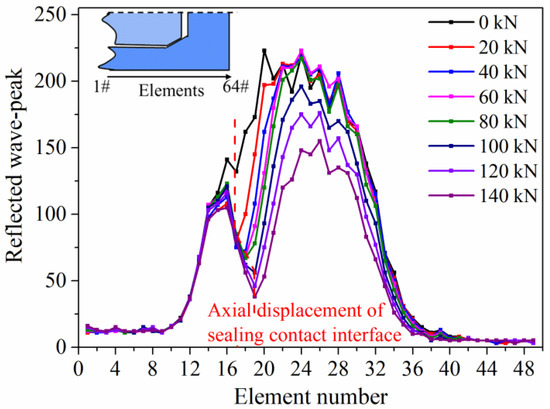
Figure 19.
The measurement results of reflected wave peaks of the sealing surface.
The reflection coefficient of each element is determined. The smaller the reflection coefficient, the greater the contact stress. Figure 20 shows the calculation results of reflection coefficients of element #14–element #30 under different loads. In the colour bar, red indicates values close to 1, with high reflected wave peaks and low or no contact stress. Light colours indicate values less than 1, corresponding to high contact stresses. When the axial load is loaded, the reflection coefficient of element #14–element #16 changes slightly, and the reflection coefficient of element #17–element #26 drops significantly to 0.2. The reflection coefficient of element #27–element #30 declines to around 0.7. In addition, the reflection coefficient is not changed synchronously. To analyse the echo change of the sealing surface, the reflection coefficient curve of element #17–element #26 changing with load is drawn, as shown in Figure 21. As the axial load increases, the reflection coefficients of element #19 and element #20 decrease continuously. After 20 KN, the reflection coefficient of element #17 is reduced from 1 to 0.6 and remains constant, while the reflection coefficient of element #21 begins to decrease. After 50 KN, the reflection coefficient of element #22–element #26 begins to decrease, and the reflection coefficient of element #18 flattens out. Thus, the signal of the ultrasonic phased array will respond to the change of contact pressure and relative position of the sealing surface during contact.
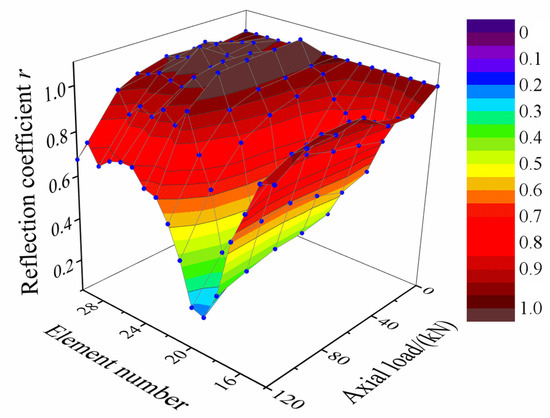
Figure 20.
Reflection coefficient distribution of sealing surface.
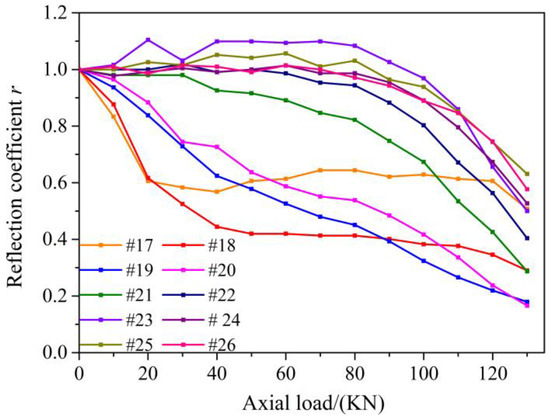
Figure 21.
Variation of reflection coefficient with axial load.
4.3. Contact Stress Measurement of Specimens at Different Angles
Likewise, the contact samples of 5°, 10°, 20°, and 30° are loaded and examined using an ultrasonic phased array. Figure 22 presents the reflected wave peak profiles. The horizontal axis is the element number, with element #1 in the direction of the big end. The reflected wave peaks, similar to those at the 15° sample, indicate the most pronounced drop at the large end of the contact. It can be distinguished even though the contact length only reaches 3 mm at the 30° sample. Under the same load, the reflected wave peak tends to be increased from the big end to the small end. With the increase of the axial load, the reflected wave peak of the seal interface at different angles declines gradually. The lowest point of the reflected wave peak moves towards the small end during the loading process, which is the result of the axial movement of the contact position. Moreover, with the increase of the sealing surface angle, the displacement declines in the same load range, consistent with the simulation results.
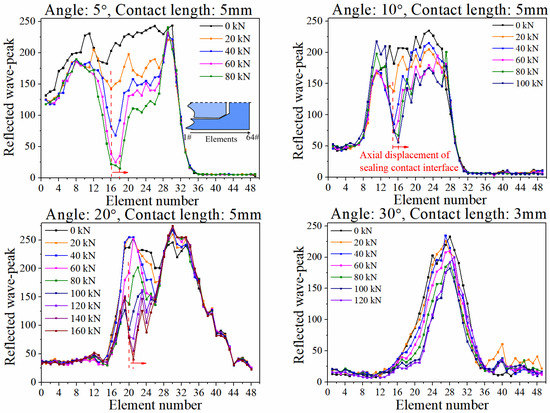
Figure 22.
Reflection coefficient of contact interface at different angles.
The reflection coefficient was determined according to the reflected wave peak and substituted into the fitting formula obtained in the calibration experiment to calculate the contact stress at the sealing interface. Figure 23 shows the contact stress profiles of the contact sample with an angle of 5°. This is the comparison of ultrasonic phased array measurement and simulation analysis results. The horizontal axis is the contact length, which is determined based on the scanning width of the ultrasonic phased array. As indicated by the result, the distribution trend of contact stress determined by the two methods is consistent. The contact stress is increased noticeably at the big end and then declines progressively. Figure 24 presents the comparison results of the contact stress of the other four groups of samples. The results are similar to those of the 5° sample, with high-stress values appearing at the big end. The difference is at the small end of the contact. Only the ultrasonic phased array measurement results of the 15° sample showed the contact stress increase at the small end, while the other angle samples did not produce a stress concentration phenomenon at the small end of the contact. Especially when the angle is 20°, the contact stress near the small end drops sharply to 0. The main reason for this phenomenon is the angle error of the sealing surface. Although the error is within the allowable range, it significantly affects the distribution of contact stress. The angle difference of the five groups of samples is 0.16, 0.2, 0.1, 0.23, and 0.19. To be specific, the error of the 20° sample is the largest, and the difference in contact stress at the small end is the largest. Since the angle is significantly accurate in the finite element analysis, such that the contact stress distribution is also very ideal. In practice, the difference in contact stress distribution caused by machining errors is reflected in ultrasonic phased array measurement. It takes on great significance in practice for measuring and imaging the real contact stress distribution of the sealing surface.
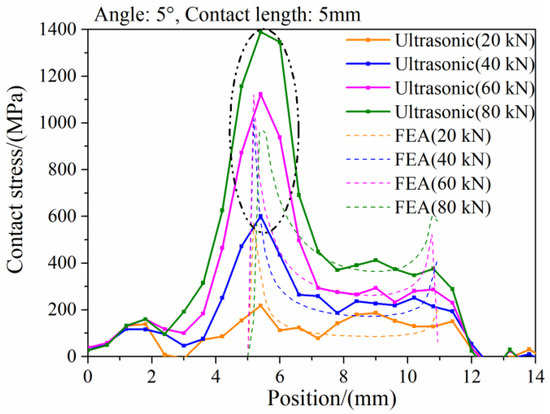
Figure 23.
Comparison of contact stress between simulation and ultrasonic phased array measurement (5° specimen).
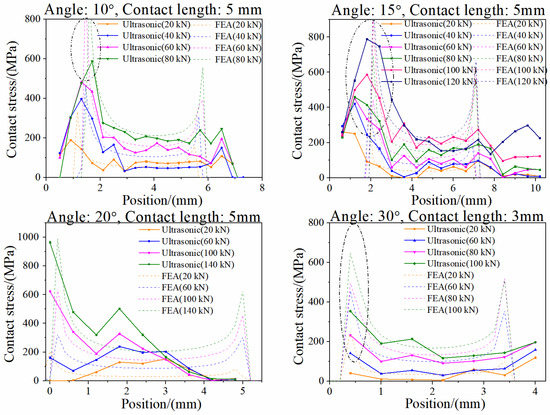
Figure 24.
Comparison of contact stress between simulation and ultrasonic phased array measurement (10°/15°/20°/30° specimens).
4.4. Evaluation of Sealability
The sealing index is determined and compared with the simulation results (Figure 25) in accordance with the ultrasonic phased array measurement results of contact stress. The relative errors are 1%, 5%, 10%, 13%, and 14%, respectively, all within the allowable error range.
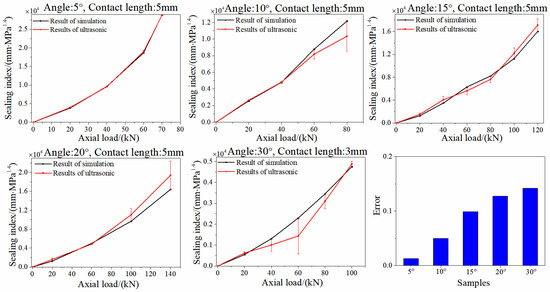
Figure 25.
Correlation between contact stress and normalised reflection wave peak.
It reflects that the smaller the angle, the closer the measurement result of the ultrasonic phased array is to the theoretical value, the more accurate the detection result, and the better the evaluation effect of the ultrasonic phased array on sealing performance. There are several possible reasons. To be specific, the measurement result of a smaller angle may be closer to the plane contact in the calibration experiment. The larger the angle, the steeper the sealing surface will be, and the larger the difference between the actual contact length and the designed length will be. It may also be because, as mentioned in the above test, the signal energy received by the ultrasonic phased array on the sealing surface with a large angle declines, thus affecting the detection accuracy. In general, the reflection coefficient examined by an ultrasonic phased array can indicate the real contact stress distribution of the cone-to-cone interface, so as to evaluate the seal performance. For a specific example, as seen in the 5° sample shown in Figure 26, when the loading force is 20 KN, the critical seal index examined in the indoor environment is 3968.5 mm·MPa1.4, which can meet the static seal of 7.8 MPa internal pressure. In sequence, when the loading force is 70 KN, the critical seal index examined is 28784 mm·MPa1.4, which can meet the static seal with an internal pressure of 83.5 MPa.
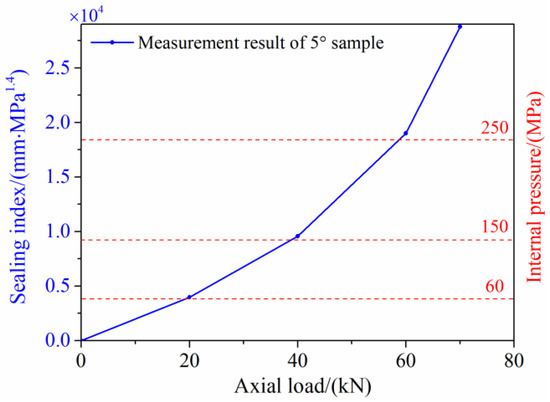
Figure 26.
Loading force and sealing gas pressure.
Lastly, the contact stress of the 5° sample is expressed by means of a nephogram. Figure 27 presents the distribution of circumferential contact stress under both low and high loads. At low load, the whole sealing torus is in a state of low contact stress, forming a continuous narrow contact band at the big end of the sealing surface, and the contact stress at the small end is small or even discontinuous. At high loads, the contact stress of the big end of the sealing surface exceeds the yield strength, and the contact stress on the whole sealing surface is continuously and uniformly distributed. The overall contact stress is at a high level. The contact stress distribution visualisation of the sealing surface is achieved through the representation of the cloud image, which takes on critical significance to engineering applications.
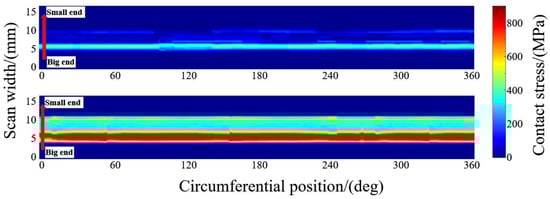
Figure 27.
Nephogram of contact stress distribution on sealing surface.
5. Conclusions
In this study, the ultrasonic phased array is investigated to determine the contact stress of premium connection metal-to-metal seals.
- The measurement effects of deflection and focusing-deflection modes on the sealing surface with different lengths and angles are investigated. The findings demonstrate that the sealing surface’s reflected wave peak exhibits a convex distribution and that the echo energy received declines with the rise of the sealing surface angle. In the focusing-deflection mode, the number of acoustic beams with a high peak of the sealing interface is increased, sidelobe clutter is reduced, the interference of other interface-reflected waves is reduced, and the energy of the acoustic beam is concentrated in contrast, so the measurement effect is better. The reflected wave peak of the sealing surface is extracted using the time compensation method.
- The reflected wave peak distribution on the sealing surface under different axial loads was investigated experimentally. The results show that with the increase of the axial load, the reflected wave peak of samples at different angles all show a decreasing trend, but not uniform. The reflection of the large end of the contact declines most sharply. The axial displacement of the contact interface can be seen from the distribution of the reflected wave peak and the reflection coefficient change trend.
- The reflection coefficient of the sealing interface is yielded using the ultrasonic phased array measurement method, and the contact stress distribution of the sealing interface is determined in accordance with the calibration results of the contact stress-reflection coefficient. The finite element 2D model of the contact specimen is built to calculate the contact stress of the cone surface, and the two are compared. As indicated by the results, the contact stress distribution trends obtained using the two methods are consistent, and the ultrasonic phased array measurement method is capable of sensitively calculating the effect of the reasonable angle machining error of the sealing surface on the contact distribution.
- The sealing index can be adopted to quantify sealability. The sealing index increases with the increase of axial load, which means that the sealing requirements of higher gas pressure can be met. Compared with the calculated results of finite elements, the measurement error of the ultrasonic phased array is less than 15% in the allowable error range. Moreover, the measurement error will be reduced with the decrease in the angle of the sealing surface.
- Lastly, the contact stress distribution nephogram of the sealing interface under low and high loads is formed to visualise the contact stress distribution of the sealing surface, which is promising in engineering applications.
Author Contributions
T.H.: conceptualisation, methodology, investigation, validation, data curation, formal analysis, writing—original draft preparation. J.F.: funding acquisition, project administration, conceptualisation, methodology, investigation, writing—review & editing, supervision. All authors have read and agreed to the published version of the manuscript.
Funding
The Foundation of China National Offshore Oil Corporation (CNOOC) under Grant no. CCL2O17RCPSO153RNN is acknowledged for the financial support of the project.
Data Availability Statement
All data generated or analysed during this study are included in this published article.
Conflicts of Interest
The authors declare no conflict of interest.
References
- Cui, F.; Li, W.J.; Wang, G.Z.; Gu, Z.L.; Wang, Z.S. Design and study of gas-tight premium threads for tubing and casing. J. Pet. Sci. Eng. 2015, 133, 208–217. [Google Scholar] [CrossRef]
- Egbert, V.R.; Jeroen, V.W.; Dennis, V.H.; Roel, R.; Vanderschueren, M.; Thibaux, P. On the suitability of premium OCTG tubing connections for CCS CO2 injection wells–a full scale physical evaluation. Int. J. Greenh. Gas Control 2023, 123, 103834. [Google Scholar] [CrossRef]
- Li, Y.F.; Cao, Y.P.; Dou, Y.H.; Yu, Y.; Zhang, J.T.; Zhang, L. Simulation of Sealing Ability for Premium Connection Based on ISO 13679 CAL IV Tests. Procedia Struct. Integr. 2019, 22, 43–50. [Google Scholar] [CrossRef]
- Chen, W.; Di, Q.F.; Zhang, H.; Chen, F.; Wang, W. The sealing mechanism of tubing and casing premium threaded connections under complex loads. J. Pet. Sci. Eng. 2018, 171, 724–730. [Google Scholar] [CrossRef]
- Degeare, J. Chapter 18—Repair of Casing Failures and Leaks. In The Guide to Oilwell Fishing Operations, 2nd ed.; Elsevier: New York, NY, USA, 2015; pp. 133–140. [Google Scholar] [CrossRef]
- Harshkumar, P.; Saeed, S.; Ramadan, A.; Catalin, T. Review of elastomer seal assemblies in oil & gas wells: Performance evaluation, failure mechanisms, and gaps in industry standards. J. Pet. Sci. Eng. 2019, 179, 1046–1062. [Google Scholar] [CrossRef]
- Zhu, S.D.; Wei, J.F.; Cai, R.; Bai, Z.Q.; Zhou, G.S. Corrosion failure analysis of high strength grade super 13Cr-110 tubing string. Eng. Fail. Anal. 2011, 18, 2222–2231. [Google Scholar] [CrossRef]
- Cirimello, P.G.; Otegui, J.L.; Guillermo, C.; Walter, M. Failure and integrity analysis of casings used for oil well drilling. Eng. Fail. Anal. 2017, 75, 1–14. [Google Scholar] [CrossRef]
- Guo, X.Q.; Liu, J.; Dai, L.M.; Liu, Q.Y.; Fang, D.K.; Wei, A.C.; Wang, J.X. Friction-wear failure mechanism of tubing strings used in high-pressure, high-temperature and high-yield gas wells. Wear 2021, 468–469, 203576. [Google Scholar] [CrossRef]
- Xu, J.W.; Mou, Y.S.; Xue, C.G.; Ding, L.L.; Wang, R.Y.; Ma, D.D. The study on erosion of buckling tubing string in HTHP ultra-deep wells considering fluid–solid coupling. Energy Rep. 2021, 7, 3011–3022. [Google Scholar] [CrossRef]
- Chen, S.S.; Wang, H.X.; Liu, Y.X.; Lan, W.; Lv, X.X.; Sun, B.Y.; Yuan, D.X. Root cause analysis of tubing and casing failures in low-temperature carbon dioxide injection well. Eng. Fail. Anal. 2019, 104, 873–886. [Google Scholar] [CrossRef]
- Jonathan, B. Chapter 8 Material Selection. In Developments in Petroleum Science; Elsevier: New York, NY, USA, 2009; Volume 56, pp. 433–472. [Google Scholar] [CrossRef]
- Hamilton, K.; Wagg, B.; Tim, R. Using Ultrasonic Techniques to Accurately Examine Seal Surface Contact Stress in Premium Connections. In Proceedings of the SPE Annual Technical Conference and Exhibition, Anaheim, CA, USA, 11–14 November 2007. [Google Scholar] [CrossRef]
- Xu, H.L.; Yang, B.; Zhang, Z.; Shi, T.H. Special considerations to calculate joint strength of premium connections. J. Pet. Sci. Eng. 2019, 182, 106295. [Google Scholar] [CrossRef]
- Chen, F.; Di, Q.F.; Li, N.; Wang, C.S.; Wang, W.C.; Wang, M.J. Determination of operating load limits for rotary shouldered connections with three-dimensional finite element analysis. J. Pet. Sci. Eng. 2015, 133, 622–632. [Google Scholar] [CrossRef]
- ISO 13679; Petroleum and Natural Gas Industries—Procedures for Testing Casing and Tubing Connections. ISO: Geneva, Switzerland, 2019.
- Muth, R.B.; Bartrud, T.F. Leak Detection—“A Necessity In Today’s Industry”. J. Can. Pet. Technol. 1983, 22. [Google Scholar] [CrossRef]
- Slack, M.W.; Salkin, H.; Langer, F.H. Technique to Assess Directly Make-Up Contact Stress Inside Tubular Connections. In Proceedings of the IADC/SPE Drilling Conference, Houston, TX, USA, 27 February–2 March 1990. [Google Scholar] [CrossRef]
- Dennis, E.; Francesc, P.R.; Egbert, J.R.; John, V.V. On the Sealability of Metal-to-Metal Seals with Application to Premium Casing and Tubing Connections. SPE Drill. Complet. 2019, 34, 382–396. [Google Scholar] [CrossRef]
- Pau, M.; Aymerich, F.; Ginesu, F. Distribution of contact pressure in wheel–rail contact area. Wear 2002, 253, 265–274. [Google Scholar] [CrossRef]
- Tattersall, H.G. The ultrasonic pulse-echo technique as applied to adhesion testing. J. Phys. D Appl. Phys. 1973, 6, 819–823. [Google Scholar] [CrossRef]
- Dwyer-joyce, R.S.; Drinkwater, B.W.; Quinn, A.M. The Use of Ultrasound in the Investigation of Rough Surface Interfaces. J. Tribol. 2000, 123, 8–16. [Google Scholar] [CrossRef]
- Gonzalez-valadez, M.; Baltazar, A.; Dwyer-joyce, R.S. Study of interfacial stiffness ratio of a rough surface in contact using a spring model. Wear 2010, 268, 373–379. [Google Scholar] [CrossRef]
- Mulvihill, D.M.; Brunskill, H.; Kartal, M.E.; Dwyer-Joyce, R.S.; Nowell, D. A Comparison of Contact Stiffness Measurements Obtained by the Digital Image Correlation and Ultrasound Techniques. Exp. Mech. 2013, 53, 1245–1263. [Google Scholar] [CrossRef]
- Jamil, A.; Kambiz, F. Elastic–plastic contact model for rough surfaces based on plastic asperity concept. Int. J. Non-linear Mech. 2005, 40, 495–506. [Google Scholar] [CrossRef]
- Xiao, H.F.; Sun, Y.Y. An improved virtual material based acoustic model for contact stiffness measurement of rough interface using ultrasound technique. Int. J. Solids Struct. 2018, 155, 240–247. [Google Scholar] [CrossRef]
- Qi, T.Z.; Lin, L.; Zhang, S.N.; Ma, Z.Y. Identification interface stiffness of coating/substrate structure based on ultrasonic pressure reflection coefficient amplitude spectrum. Appl. Acoust. 2022, 201, 109094. [Google Scholar] [CrossRef]
- Du, F.; Li, B.T.; Zhang, J.; Zhu, Q.M.; Hong, J. Ultrasonic measurement of contact stiffness and pressure distribution on spindle–holder taper interfaces. Int. J. Mach. Tools Manuf. 2015, 97, 18–28. [Google Scholar] [CrossRef]
- Wang, S.; Yao, X.; Yang, H.; Huang, S. Measurement and evaluation on contact stress at the rubber contact interface. Measurement 2019, 146, 856–867. [Google Scholar] [CrossRef]
- Xu, N.; Zhou, Z.G. Numerical simulation and experiment for inspection of corner-shaped components using ultrasonic phased array. NDT E Int. 2014, 63, 28–34. [Google Scholar] [CrossRef]
- Johannes, R.; Chen, C.; Reza, V.; Anoush, P. Combining digital image correlation and phased-array ultrasonics for non-destructive testing of translaminar fracture in composite laminates. Compos. Part A Appl. Sci. Manuf. 2022, 161, 107060. [Google Scholar] [CrossRef]
- Zhang, H.Y.; Peng, L.; Zhang, H.; Zhang, T.; Zhu, Q. Phased array ultrasonic inspection and automated identification of wrinkles in laminated composites. Compos. Struct. 2022, 300, 116170. [Google Scholar] [CrossRef]
- Ma, M.; Cao, H.; Jiang, M.; Sun, L.; Zhang, L.; Zhang, F.; Sui, Q.; Tian, A.; Liang, J.; Jia, L. High Precision Detection Method for Delamination Defects in Carbon Fiber Composite Laminates Based on Ultrasonic Technique and Signal Correlation Algorithm. Materials 2020, 13, 3840. [Google Scholar] [CrossRef]
- Cao, H.Y.; Jiang, M.S.; Jia, L.; Ma, M.Y.; Sun, L.; Zhang, L.; Tian, A.Q.; Liang, J.Y. An ultrasonic signal processing method to improve defect depth estimation in composites based on empirical mode decomposition. Meas. Sci. Technol. 2021, 32, 135112. [Google Scholar] [CrossRef]
- Zhou, L.; Henry, B.; Roger, L. Experimental investigation on ball plate contact using ultrasonic reflectometry: From static to dynamic. Ultrasonics 2022, 124, 106733. [Google Scholar] [CrossRef]
- Han, T.; Fan, J.C. Assessment of stress distribution in premium connections with ultrasonic phased array and metal magnetic memory. J. Physic Conf. Ser. 2021, 2045, 012012. [Google Scholar] [CrossRef]
- Fayazbakhsh, K.; Honarvar, F.; Amini, H.; Varvani-Farahani, A. High frequency phased array ultrasonic testing of thermoplastic tensile specimens manufactured by fused filament fabrication with embedded defects. Addit. Manuf. 2021, 47, 102335. [Google Scholar] [CrossRef]
- Filho, J.C.P.; Maia, V.P.; Passos, E.K.D.; Gonzaga, R.S.; Juliano, D.R. Probability of detection of discontinuities by ultrasonic phased array inspection of 9% Ni steel joints welded with alloy 625 as the filler metal. Ultrasonics 2022, 119, 106582. [Google Scholar] [CrossRef]
- Zhang, M.; Suo, S.; Jiang, Y.; Meng, G. Experimental Measurement Method for Contact Stress of Elastic Metal Sealing Ring Based on Pressure Sensitive Paper. Metals 2018, 8, 942. [Google Scholar] [CrossRef]
- Ye, F.; Chen, F.; Wang, W.V.; Zhang, R.L.; Zhou, X.; Qin, K.; Di, Q.F. Flow in Microchannels between Sealing Surfaces of Casing Connections: LBM Simulation. Geofluids 2023, 2023, 5293830. [Google Scholar] [CrossRef]
- Murtagian, G.R.; Fanelli, V.; Villasante, J.A.; Johnson, D.H.; Ernst, H.A. Sealability of Stationary Metal-to-Metal Seals. J. Tribol. 2004, 126, 591–596. [Google Scholar] [CrossRef]
- Yang, B.; Xu, H.L.; Xiang, S.L.; Zhang, Z.; Su, K.H.; Yang, Y. Effects of Make-Up Torque on the Sealability of Sphere-Type Premium Connection for Tubing and Casing Strings. Processes 2023, 11, 256. [Google Scholar] [CrossRef]
- Gonzalez-Valadez, M.; Dwyer-Joyce, R.S.; Lewis, R. Ultrasonic Reflection from Mixed Liquid-Solid Contacts and the Determination of Interface Stiffness. Tribol. Interface Eng. Ser. 2005, 48, 313–320. [Google Scholar] [CrossRef]


Disclaimer/Publisher’s Note: The statements, opinions and data contained in all publications are solely those of the individual author(s) and contributor(s) and not of MDPI and/or the editor(s). MDPI and/or the editor(s) disclaim responsibility for any injury to people or property resulting from any ideas, methods, instructions or products referred to in the content. |
© 2023 by the authors. Licensee MDPI, Basel, Switzerland. This article is an open access article distributed under the terms and conditions of the Creative Commons Attribution (CC BY) license (https://creativecommons.org/licenses/by/4.0/).