Article

A Predictive Damage-Tolerant Approach for Fatigue Life Estimation of Additive Manufactured Metal Materials

by
Harry O. Psihoyos
* and
George N. Lampeas
Laboratory of Technology and Strength of Materials, Department of Mechanical Engineering & Aeronautics, University of Patras, 26504 Rion, Greece
*
Author to whom correspondence should be addressed.
Metals 2023, 13(6), 1005; https://doi.org/10.3390/met13061005
Submission received: 30 April 2023 / Revised: 19 May 2023 / Accepted: 20 May 2023 / Published: 23 May 2023
(This article belongs to the Special Issue Fatigue, Fracture and Damage of Steels)

Abstract

:
Metal Additive Manufacturing (AM) allows the fabrication of intricate shaped parts that cannot be produced with conventional manufacturing techniques. Despite the advantages of this novel manufacturing technology, the main drawback is the inferior fatigue performance of AM metal materials and parts due to the presence of process-induced defects that act as initial cracks. Reliable fatigue modeling methods that can assist the design and characterization of AM components must be developed. In this work, a computational damage-tolerance framework for the fatigue analysis of the AM metals and parts is presented. First, thermal modeling of the AM process for the part fabrication is performed to predict the susceptible areas for defect formation in the parts. From the processing of results, the characteristics of the critical defect are determined and used as input in a fracture mechanics-based model for the prediction of fatigue life of AM metals and parts. For validation purposes, the framework is utilized for the fatigue modeling and analysis of AM Ti-6Al-4V and 316L SS metals of relative experimental test cases found in the literature. The predicted results exhibit good correlation with the available experimental data, demonstrating the predictive capability of the modeling procedure.

1. Introduction

Metal Additive Manufacturing (AM) technology enables the production of metallic parts with complex shapes—often resulted from topology optimization analysis—in conjunction with lower waste of materials and reduced production times [1,2]. This is achieved by the utilization of a layer-by-layer processing of powder or wire material feedstock that is melted or fused by a heat source and solidifies to produce the final geometry based on a digitally defined heat source trajectory [3,4]. The Laser-based Powder Bed Fusion (L-PBF) process, which uses a high-power focused laser heat source for powder melting, poses as the most mature among the AM technologies and nowadays is widely adapted in the aerospace, medical and other industrial sectors [5].
One of the main challenges toward the ongoing widespread integration of the L-PBF process into the industry is the fatigue characterization of its metal products, as the prominent use of many L-PBF components is meant for cyclic loading applications [6,7]. The fatigue resistance of AM metals is very sensitive to the presence of process-induced defects, which severely degrade their cyclic performance [8,9]. Compared to defects, the microstructure of the AM metals plays a secondary role in their fatigue properties [10,11,12,13].
Defects are inherent in the products of AM processes and can result either from the improper selection of process parameters or from process instabilities. Thus, defects cannot be completely eliminated from the AM parts [14]. Typical internal defects formed during the L-PBF process are the Lack-of-Fusion (LOF), keyhole and gas pores defects [15]. LOF defects are usually characterized by irregular shapes with pronounced sharpness and interconnected forms, while keyhole and gas pores usually have a spherical shape. Moreover, surface roughness, which has been also acknowledged as a significant imperfection in the L-PBF parts, is one of the main sources of fatigue damage initiation [16,17]. The variability of the defects characteristics has also been denoted as the main source of scatter and uncertainty of the fatigue properties of L-PBF metals and parts [18,19,20]. It should be noted here that to a certain degree, the effect of defects on fatigue failure depends on the synergy with the local microstructure, as materials with different microstructures and similar defect characteristics present different cyclic behavior [21].
To minimize the presence of defects in AM parts, several approaches have been proposed in the literature. Density-based optimization methods have been developed to identify the region of process parameters that lead to the minimum amount of internal defects [22,23,24]. Despite the minimum amount of porosity achieved with those methods, their results are limited to the fabrication of small samples, and they do not necessary lead to defect-free AM parts [24]. Post-processes such as Hot Isostatic Pressure (HIP) and surface finish are aimed at the elimination of internal and surface defects, respectively [25,26,27]. These processes have been proved beneficial for the improvement of fatigue properties of L-PBF materials. However, surface machining may not be always applicable due to the intricate shape of the built parts, and HIP increases the cost of the components, altering simultaneously their microstructure. For this reason, the current research efforts aim at the assessment and improvement of fatigue behavior with the least possible post-processing. To fully support this scope, reliable fatigue modeling and life prediction methods have to be developed.
For the fatigue modeling of AM metals, several approaches have been proposed [28]. Empirical and semi-empirical models are obtained by fitting a large amount of fatigue data and utilized a stress–strain method (Basquin and Coffin–Mason models) for fatigue life estimation [29,30]. Damage mechanics models predict the fatigue life by describing the damage evolution process of the AM metals [31]. The determination of damage variable that characterizes the deterioration of materials is the main feature of those models. These approaches are usually combined with probabilistic methods for fatigue modeling [32]. However, these methods require a significant amount of experimental data for fatigue life modeling and require a complex formulation that usually ignore the main fatigue failure process.
Damage-tolerant approach is one of the most popular methods for the modeling of fatigue behavior of metallic materials and the estimation of fatigue life from the perspective of the fracture mechanics description of crack growth [20,33]. According to this approach, materials and structures are seized to be considered as defect-free, and defects are considered as initial cracks from which failure can be initiated and propagated [33,34,35]. The main input to these modeling approaches are the defect characteristics (size, shape and location), the applied loading and the fatigue crack growth properties of AM materials.
Non-Destructive Testing (NDT) methods have been widely utilized for the determination of defect characteristics in materials and parts [25,36]. X-ray computer tomography has been popular in AM applications [36,37]. This technique reconstructs defects from many radiation projections, providing sufficient information of the commonest defects found in AM products. Further combined with statistical methods for the description of defects characteristics throughout the part, they can provide quantitative properties for the fracture-based models [38,39,40]. However, NDT is rather an expensive means to accurately characterize the defects in AM products. More recently, analytical and numerical models have been developed to identify the susceptibility of defect formation in AM materials, introducing a novel trajectory in defect characterization [41,42]. In particular, Moran et al. [41] developed a thermal modeling method that identifies the susceptibility of the areas of an AM part for defect formation.
Fatigue crack growth (FCG) rates are also utilized as input to fracture mechanics-based approaches. The FCG properties of AM metals have been studied in relation to processing and post-processing conditions [43,44,45]. The most examined AM metal alloy is Ti-6Al-4V, for which many literature studies provide its FCG rate properties. However, most of the experimental data concern conventional experimental tests conducted based on typical long FCG procedures, which may not be the case for AM metals. Due to the size of defects in AM metals (usually in the scale of 100 μm), small FCG properties are more suitable for the analysis of AM metals compared to the long FCG properties [46]. The standard methods for FCG rate representation are the Hartman–Schijve and the NASGRO equations [46,47,48]. These are phenomenological methods that incorporate information about the R-loading ratio, the crack closure and the material properties, that have been successfully implemented for fatigue life prediction. The main downside of these methods is that they require big experimental datasets under various loading conditions to successfully describe the behavior of the examined metals [19,48].
The aim of this work is to present a holistic computational framework for the fatigue life estimation of L-PBF products that consists of two parts: the thermal simulation of part fabrication and the fatigue life model. The thermal history simulation is performed to identify the defect-susceptible regions in L-PBF coupons and parts. This is achieved from the processing of the predicted melt pool results according to relative melt pool criteria for defect formation. After the identification of defect-susceptible regions of the part, the location of the critical defect is determined, and this defect is used as input in the subsequent fracture mechanics-based model for fatigue life estimation. The fracture mechanics-based model considers the critical defect as an initial crack from which the catastrophic failure propagates. In addition, small FCG data are utilized for the modeling of fatigue behavior. The presented methodology can circumvent or minimize the costly non-destructive experimental procedures for defect characterization, which are prevalent in the literature and also provides a reliable method for the fatigue life estimation assisting the damage-tolerant assessment of AM metals. Moreover, the framework can facilitate the establishment of process–property–performance relationships, which is currently an important issue for AM applications [49]. For validation purposes, the present modeling framework is used for the modeling of AM Ti-6Al-4V and 316L SS metals of experimental test cases found in the literature, and the results are presented in the present work.

2. Materials and Methods

The outline of the modeling methodology is presented in Figure 1. The methodology consists of two modules. In first module, the thermal history simulation of the L-PBF process is performed to predict the susceptible zones for defect formation of the built specimens. After the processing of results, the location of the most critical defect is identified. It is assumed that the catastrophic failure will most likely initiate from this site. In the second module, the defect is modeled as an initial crack based on the fracture mechanics approach, and fatigue life estimations are performed. The presented modeling approach is applied for the fatigue life prediction of Ti-6Al-4V and 316L SS AM materials based on experimental cases found in the literature. Nonetheless, it can be extended for the fatigue modeling of all AM metals as long as the thermal and mechanical properties required as input in the framework are known. The details of the experimental data used for validation purposes are also presented. It should be mentioned that the effect of residual stresses has not been considered in the present study, as the focus is placed solely on the effect of internal defects. The considered experimental data from the literature also fit this purpose, as post-processing methods have been implemented to minimize the level of residual stresses on the examined metals.

2.1. Experimental Data

Correlations with experimental fatigue data of L-PBF Ti-6Al-4V and 316L SS metals from the available literature are performed to investigate the predictive capability and the limitations of the proposed method. The experimental datasets presented below fit the scope of the current work for the preliminary assessment of the effect of internal defects on the fatigue of AM metals with the proposed framework.
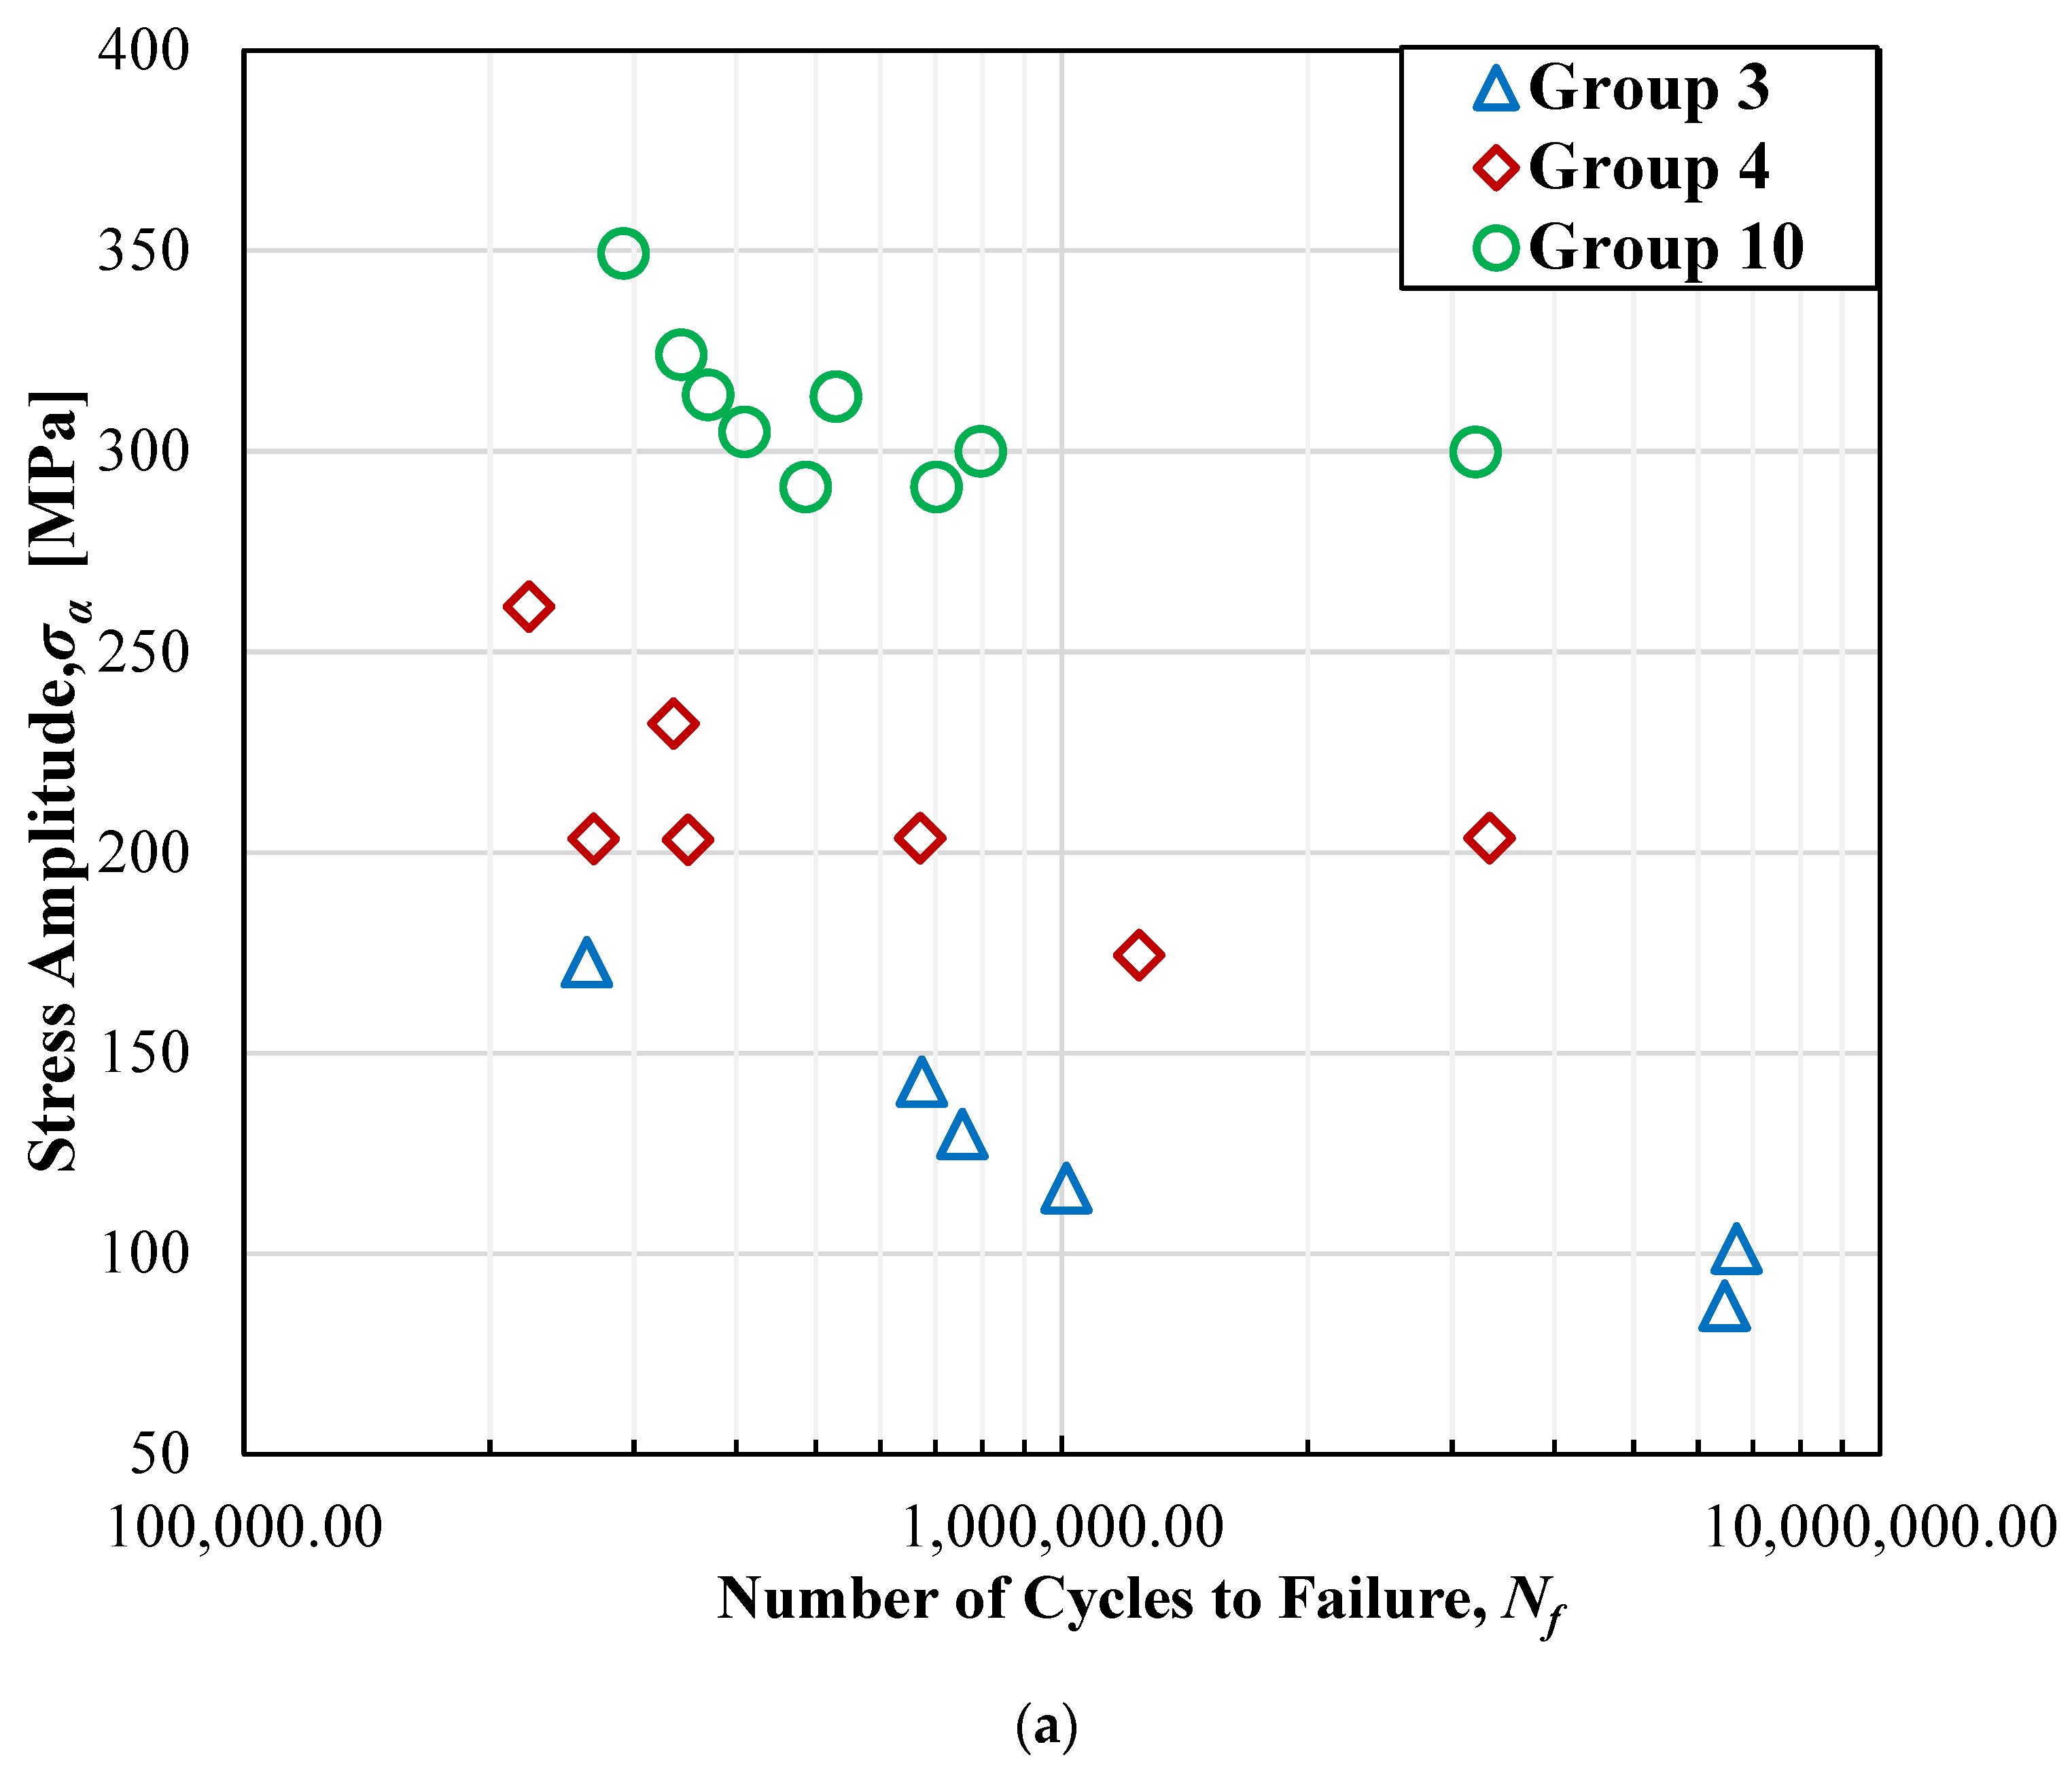
In the case of L-PBF Ti-6Al-4V, the results of the work of Du et al. [50] are considered. Du et al. investigated the influence of various process parameters on the fatigue properties of L-PBF Ti-6Al-4V in High Cycle Fatigue (HCF). In particular, they examined the effect of fourteen different groups of process parameters on the total porosity and its effect on the fatigue strength of Ti-6Al-4V metal alloy. The representative groups of process parameters, the resulting relative density (RD), yield (σy), and ultimate (σu) strength considered in this work are presented in Table 1. Groups 3, 4 and 10 presented the worst, the medium and the optimum cases of porosity, respectively, as indicated by their respective relative density. As expected, the specimens fabricated with process parameters indicating the minimum amount of porosity (Group 10) presented the highest fatigue strength, while specimens with process parameters indicating the maximum amount of porosity (Group 3) presented the lowest fatigue strength. To examine only the influence of internal porosity on the fatigue properties, the specimens have been polished to avoid the effect of surface roughness and heat annealed at 600 °C and then cooled in a vacuum furnace to relieve the residual stresses. The specimens were built in the vertical orientation with an inner 60° rotating laser scan pattern with a contour hatching. The loading ratio R = σmin/σmax has been equal with R = −1 for all fatigue tests.
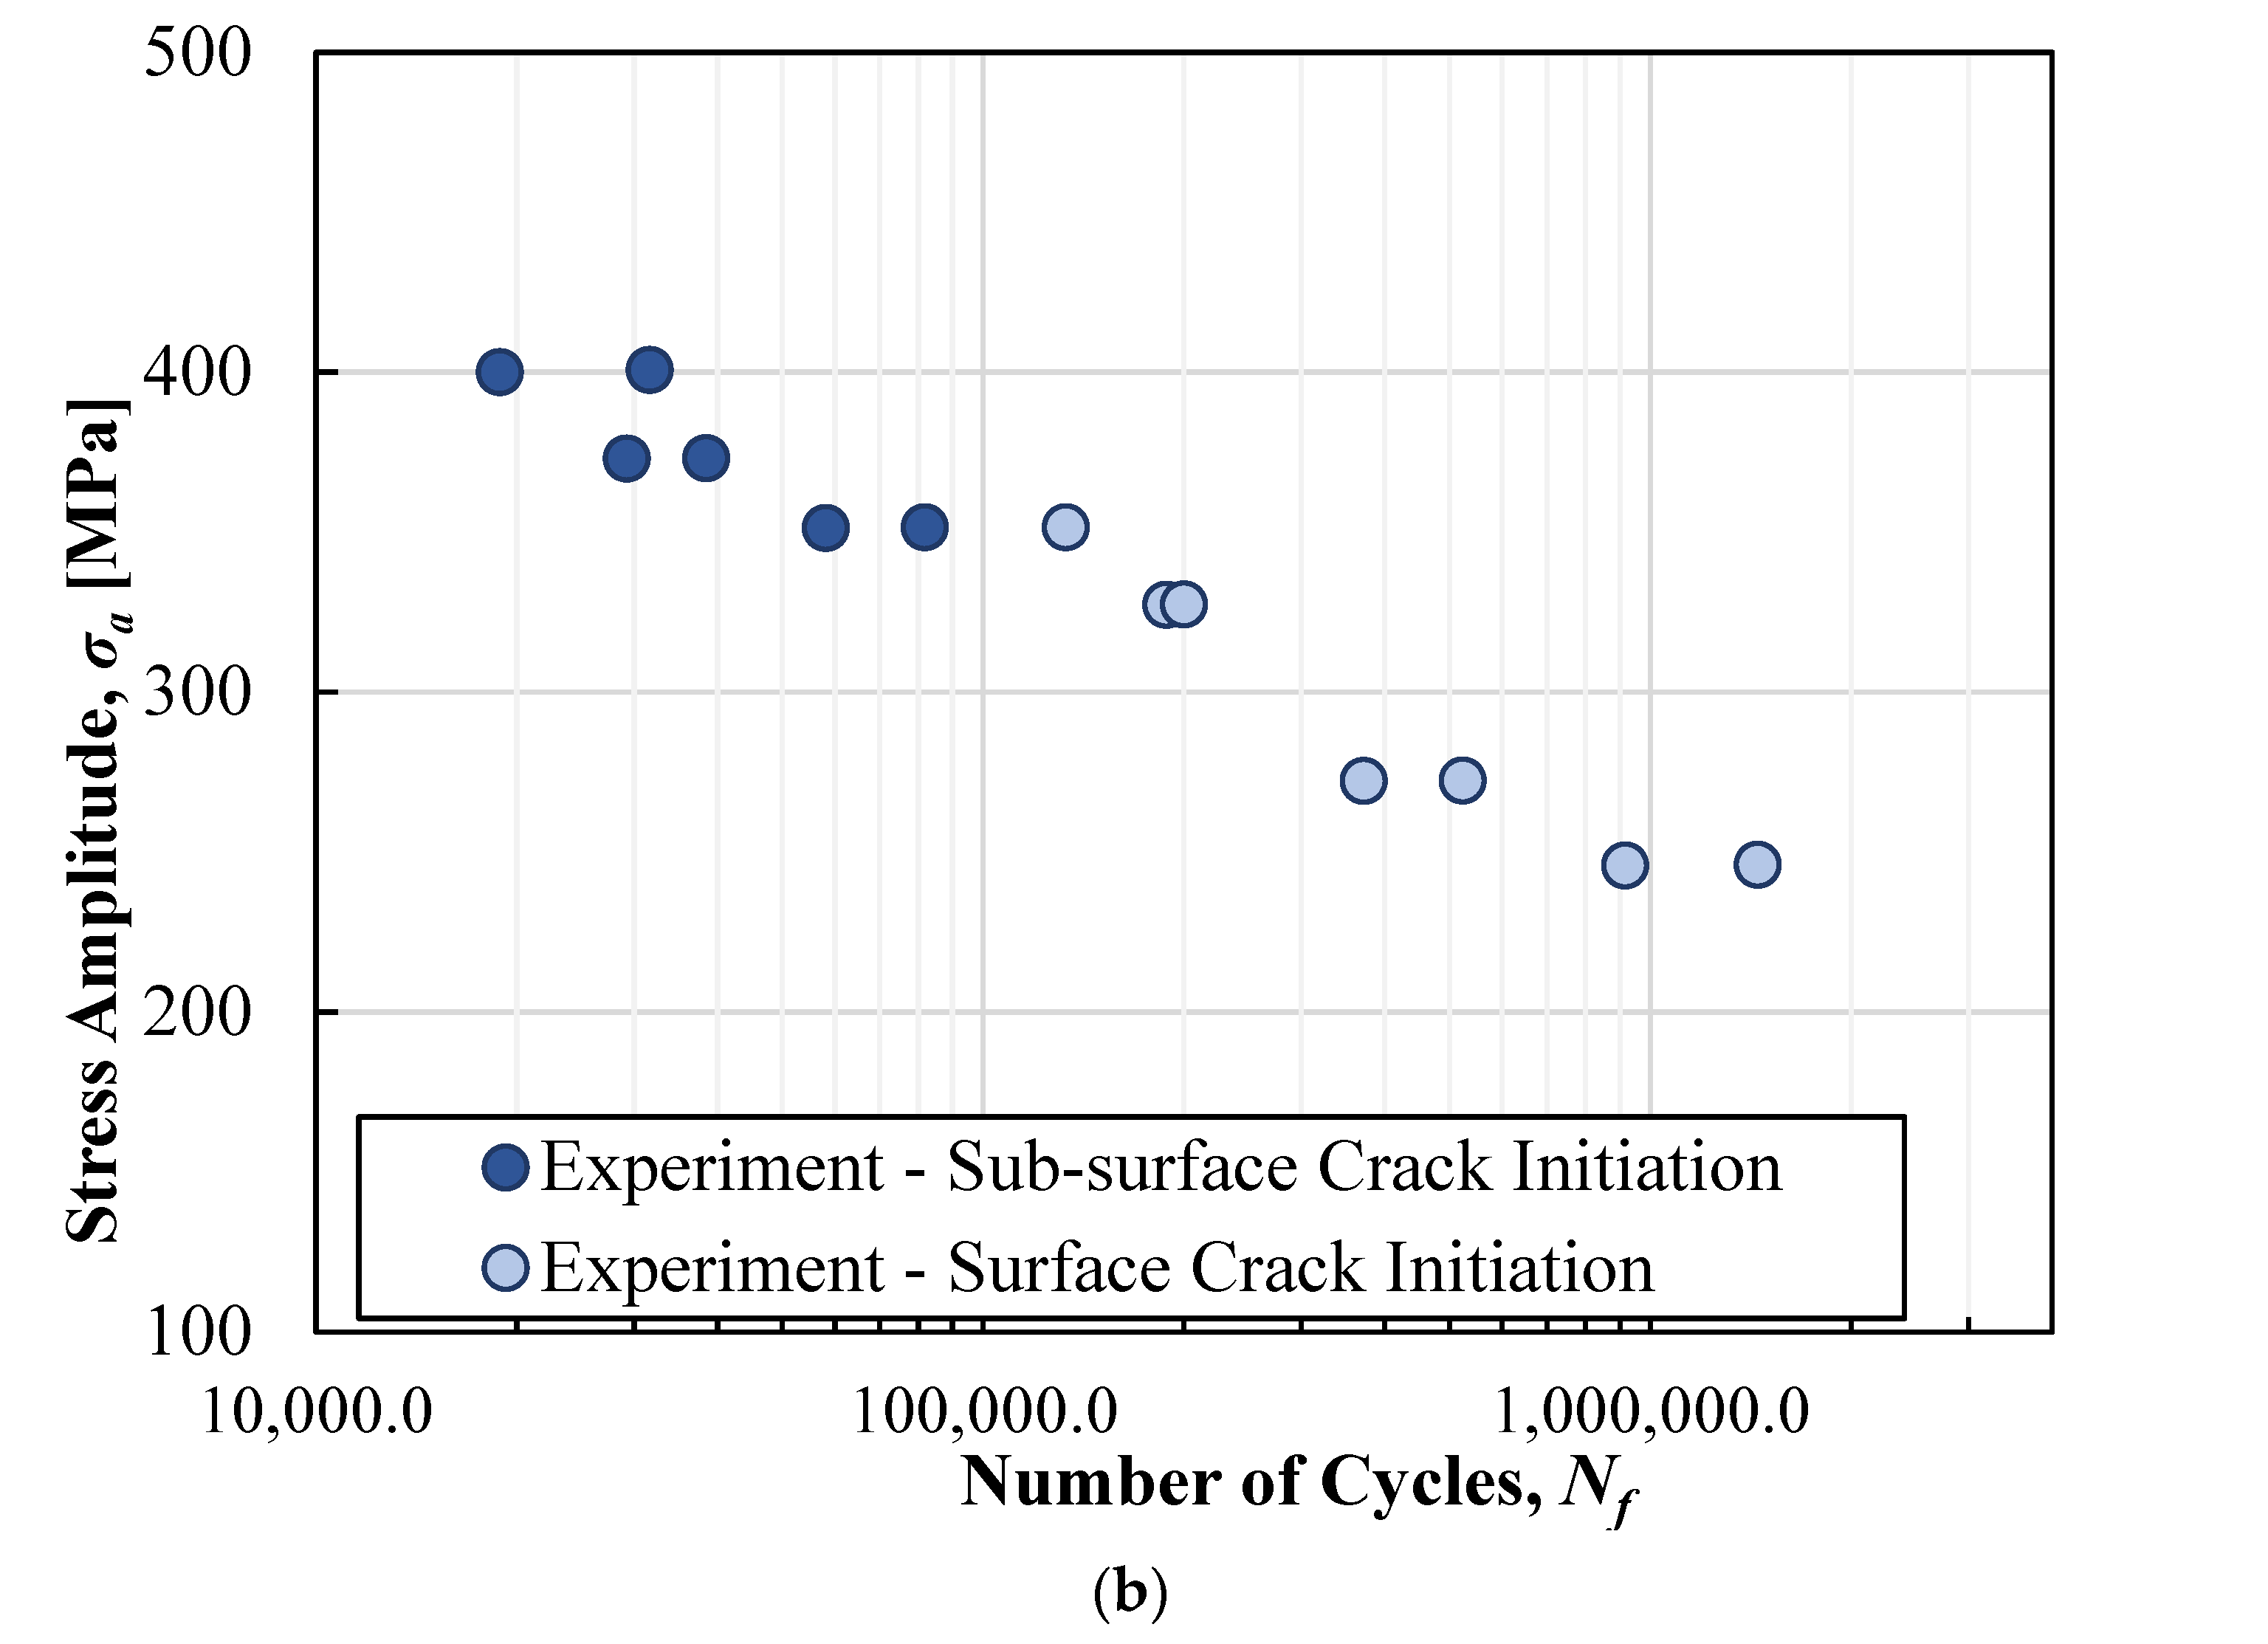
Experimental fatigue results of the work of Solberg et al. [51] have been used for validation purposes of fatigue life prediction of 316L SS. Solberg et al. examined the influence of the porosity and surface roughness on the fatigue properties of L-PBF 316L SS. They have observed a transition of failure initiation from defects in the surface region at low load levels and failure initiation in the near-surface defects at higher load levels. The specimens have been built in the vertical orientation with an inner 60° rotating laser scan pattern with a double contour hatching. The loading ratio R has been equal with R = 0.1 for the fatigue tests. The residual stresses have been considered negligible in this case. The process parameters and the tensile properties are presented in Table 2.
The experimental fatigue data of L-PBF Ti-6Al-4V and 316L SS are concisely presented in Figure 2a,b, respectively.
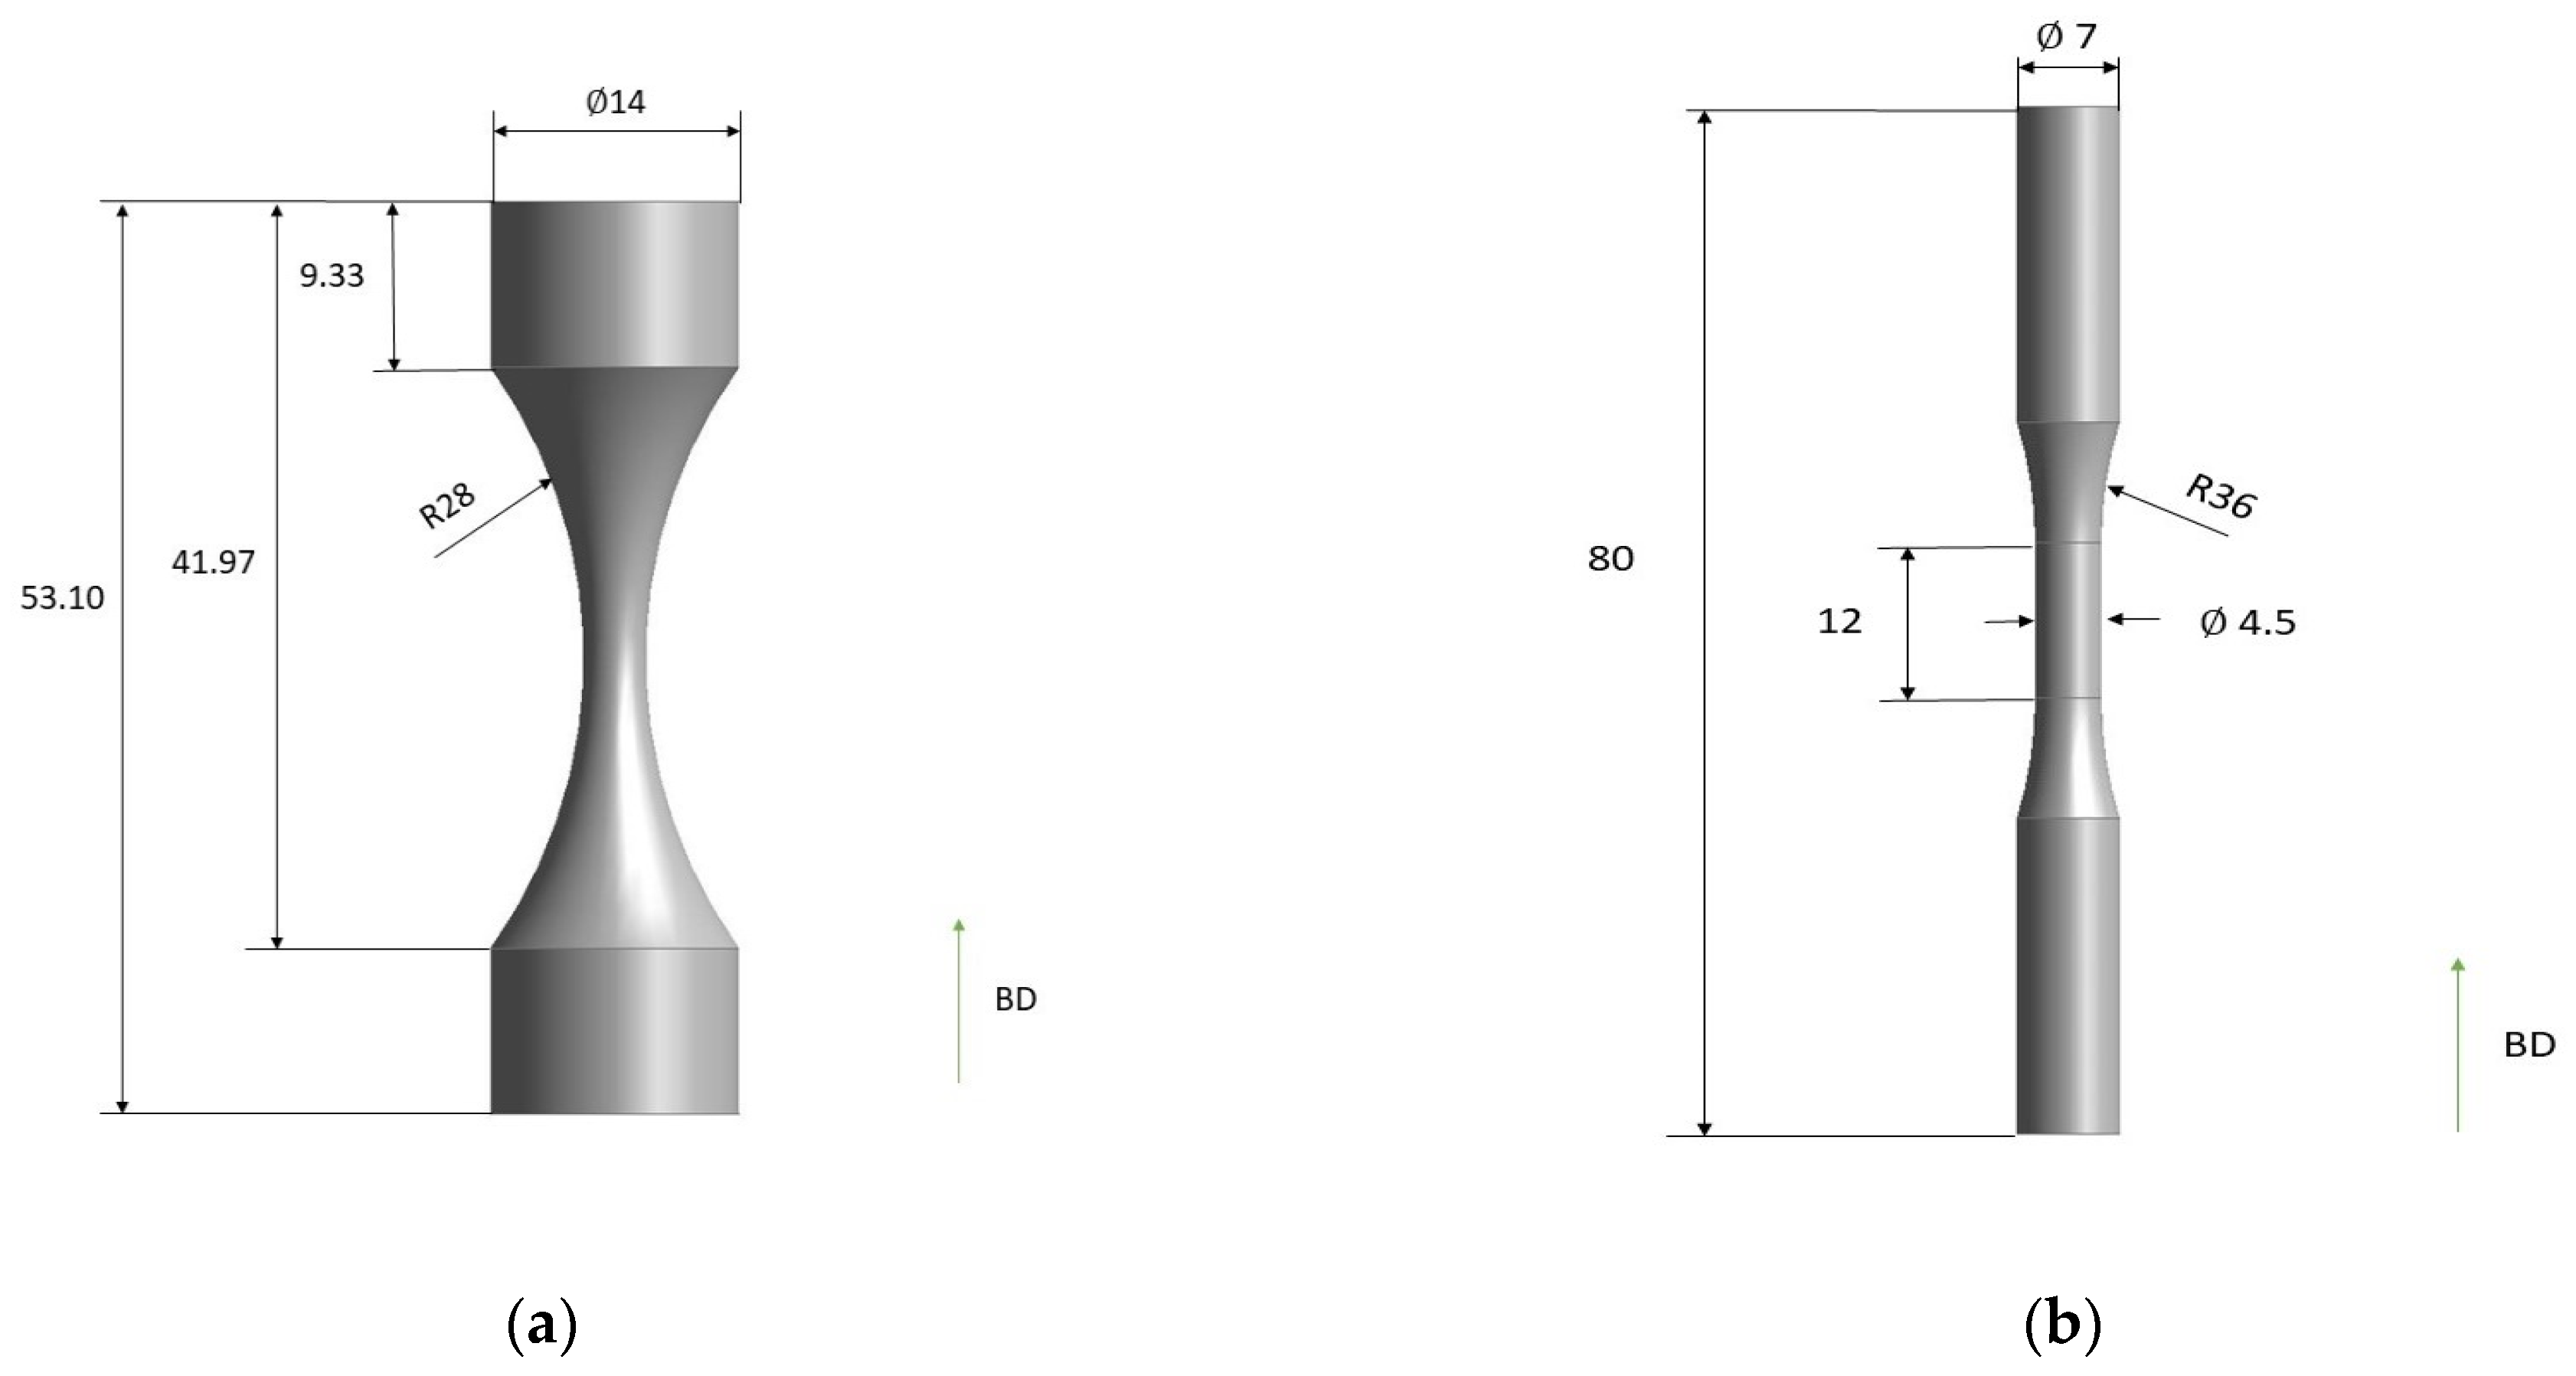
The hourglass geometry and the dimensions of the Ti-6Al-4V and 316L SS specimens are shown in Figure 3a,b. Based on fractography analyses, the failure in both experimental cases has been defect-driven. The fractography results have also identified the locations of failure initiation and the size of the defect in these locations. The size of the critical defects from which catastrophic failure initiated has been used as an input in the fatigue models.

2.2. Modeling Methodology

2.2.1. Prediction of Defect Susceptible Zones in the L-PBF Materials

Thermal modeling and simulation of the L-PBF process for the fabrication of specimens has been performed to evaluate the effect of process parameters on defect formation and distribution. ANSYS Additive Suite commercial software (ANSYS 2020R2, ANSYS Inc., Canonsburg, PA, USA) has been used for the thermal history process simulation [52]. The main inputs of the thermal model developed are the temperature-dependent material properties, the part geometry, and the laser scan strategy-related process parameters: baseplate temperature, layer thickness, hatch spacing, laser beam diameter, laser power, scanning speed and scan pattern. The main outputs of the models are the temperature fields and melt pool geometric characteristics of the built part in a layer-by-layer manner.
Melt pool characteristics have been considered as the most important quality feature of the L-PBF materials and parts [7,53]. Especially, melt pool dimensions—width (W), depth (D), length (L)—have been regarded as an index for the formation of the typical defects found in the L-PBF process [52,53,54,55]. If melt pool dimensions do not match certain physical features related to the continuity of material, porosity is about to be generated. To describe the tendency of the melt pool size for defect formation, criteria have been developed in the literature [54,55,56]. Although most of these criteria are semi-empirical based on experimental observations and physical principles, they can describe the thresholds over which the molten pools are susceptible for defect formation. Next, the criteria used for the examination of the predicted melt pools to identify their tendency to the formation of the main defects usually found in L-PBF parts are described.
Thermal simulation of the L-PBF process has as a goal to identify LOF and keyhole defects. LOF porosity results from incomplete fusion between successive layers or insufficient overlap between adjacent melting tracks [42]. Tang et al. [42] developed a criterion based on the melt pool overlap for the prediction of LOF defects:
h W 2 + t D 2 1
where h, t are the known values of the hatch spacing and layer thickness process parameters and W, D are the predicted values of the melt pool width and depth, respectively. This criterion assumes that the melt pool has a dual-half ellipse shape, but it can be applied for melt pools of any shape [42].
Keyhole porosity in the L-PBF process comes as the result of the high-intensity laser energy density that melts the powder layer material and the subsequent rapid reach of the vaporization temperature that generates a vapor flux on the vapor/liquid interface. Keyhole porosity is closely related with the transition of the melt pool from the conduction to the keyhole mode, which is characterized by a large melt pool depth and high depth-to-width ratio associated with the fluctuations of the melt pool front wall. For this reason, the melt pool criterion of the keyhole defect formation is described by the following relationship [23,57]:
D W 0.5
This criterion accounts for the melt pool transition and may not be conservative for keyhole defect prediction, but it can serve as an initial indicator of keyhole defects [58].
The prediction of susceptible zones for defect formation and defect distribution throughout the build part can be achieved by assessing the predicted melt pool geometric characteristics based on the aforementioned criteria. Then, the most critical location for failure initiation is identified. The defect in this location is referred hereafter either as the critical or “killer” defect, as commonly referred in the literature [59].

2.2.2. Determination of the Critical or “Killer” Defect

The assumption of the catastrophic fatigue failure initiation from only one site is one of the main assumptions in the defect-based fatigue modeling in this work. This assumption is based on the observations of experimental studies of fatigue failure of AM metal materials [18,20,46,60]. The crack initiates and propagates from only one defect despite the amount of defect population. This defect dictates the fatigue life especially in the HCF region [61]. Secondary short cracks may be initiated and grow over some distance, but finally, almost all of them are arrested at microstructural barriers [22,59,60,61,62]. However, the contribution of these secondary cracks to the total decrease in fatigue strength of AM metals and on the scatter of fatigue results is very significant, especially for certain metallic materials depending on their microstructure [60].
The criticality of a defect is determined by multiple factors, such as the defect size, the location, the aspect ratio, the proximity to other pores and the free surface of the built part, the stress state around the defect and the orientation of defect to the loading direction. Considering the defect as an initial short crack, an index for the killer defect that can integrate all the previous information is the Stress Intensity Factor (SIF). The SIF describes the stress state at the tip of the short crack and can be considered as the crack driving force that makes the crack propagate under the applied loading. According to the Linear Elastic Fracture Mechanics (LEFM) formulation, the SIF can be described as:
Δ Κ = Υ · Δ σ π A e f f
where Y is a geometry parameter, Δσ is the cyclic stress range at the tip of the crack and Aeff is the effective size of the defect. The SIF has been proved as the most reliable index for the ranking of defects in order to foresee which defect causes the fatigue failure [60]. In cases of coupons with small size, it is a relatively simple procedure to identify the killer defect with this method. However, in the cases of structural components with larger dimensions and more complex shape, the determination of the killer defect(s) becomes a challenging task.

2.2.3. Defect-Based Modeling of AM Materials

AM metals present a lot of complexities and variations in their resulting microstructure and defect characteristics (shape, size and location). However, the presence of defects that act as initial cracks facilitates the application of a fracture mechanics-based approach for fatigue life prediction. The sharp defects in AM metals act as small cracks and have as a result the incubation stage of fatigue life of AM metals to be considered as negligible. Therefore, the fatigue life prediction based on the crack growth concept is suitable for AM metals, considering that the presence of process-induced defects with large size, compared to their local grain structure, and irregular shape is inevitable in the current state of the AM technique. LOF pores facilitate that assumption, as they present acute complex shape.
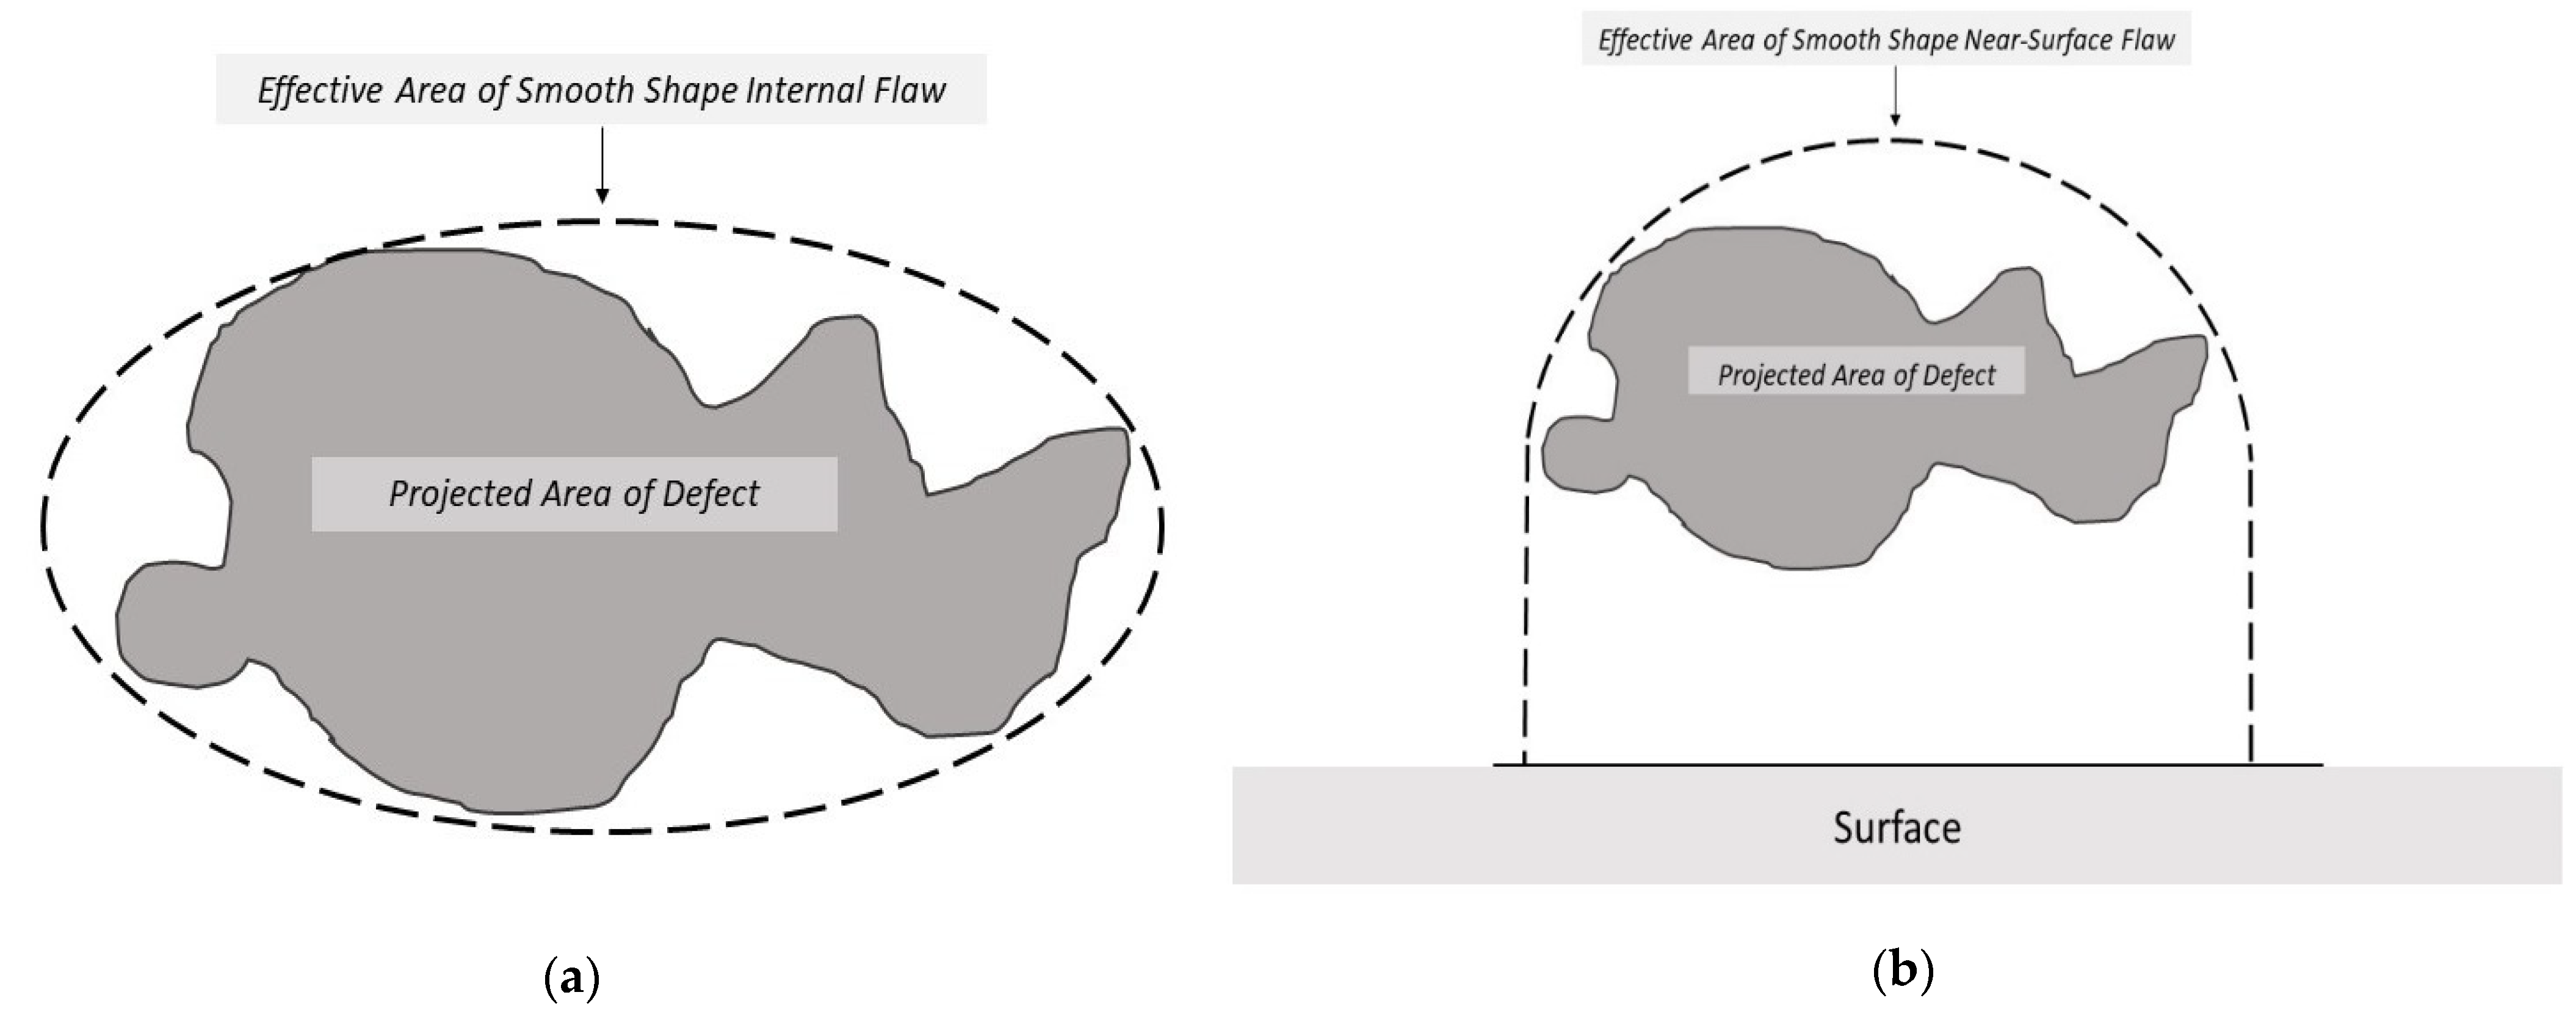
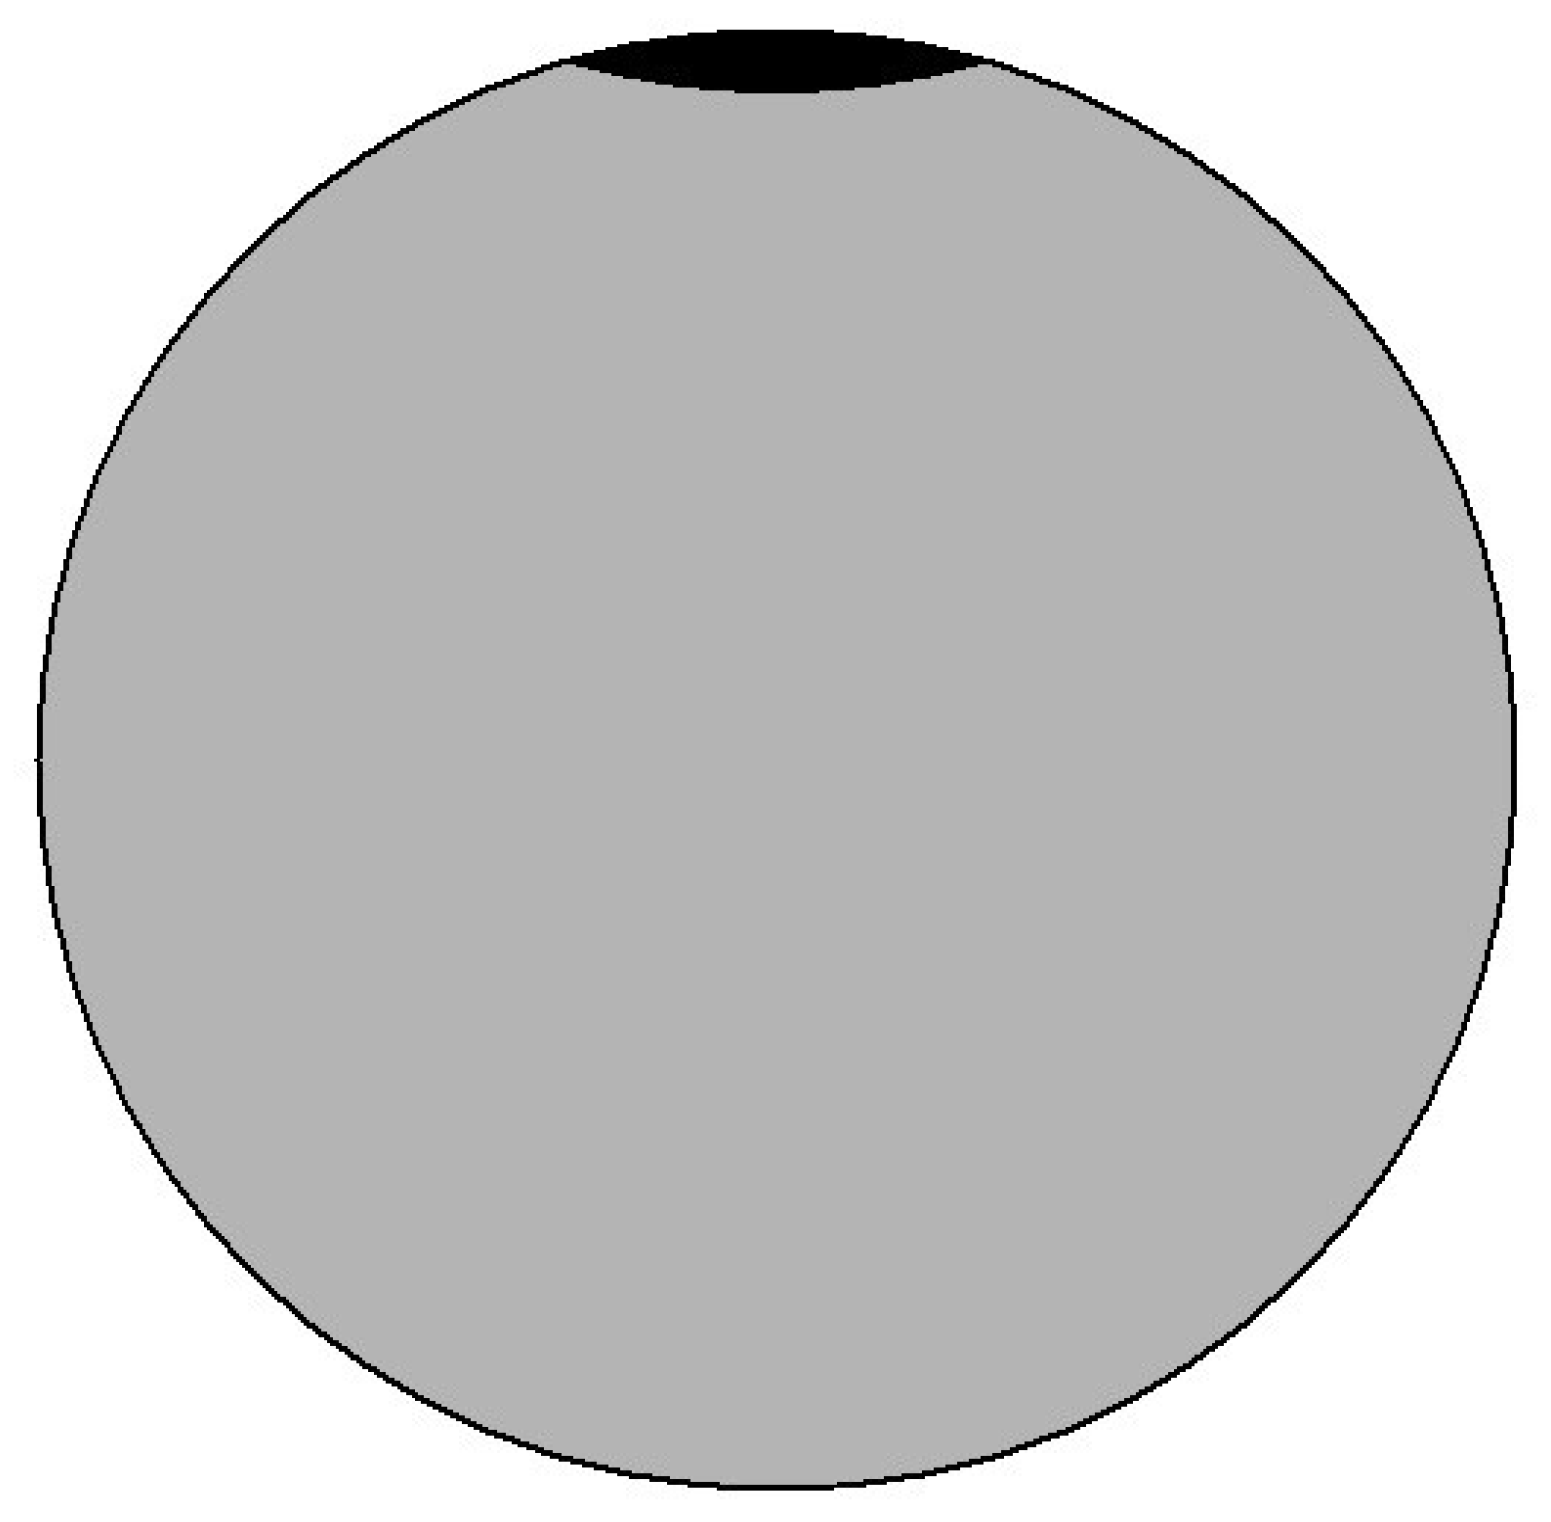
In the context of fracture mechanics, the projected irregular shape of real flaws can be replaced with an equivalent smooth shaped crack, as presented in Figure 3. The needed defect characteristic to represent a complex defect shape with a smooth one is its size. Defect size may be represented by either the effective defect length or area. The effective area (√Aeff) is determined by a smooth contour that circumscribes the original sub- or near-surface pore, as shown in Figure 4a,b. The SIF should be greater at the steep cavities of the defect. However, after a few cycles of crack propagation from these points, the defect is expected to acquire an elliptical shape [63].

2.2.4. Fatigue Crack Growth Properties

The size of defects is an important factor when they are considered as initial cracks which propagate until their final failure. Due to their small size, the defects in AM metals can be regarded as physically short cracks. Physically short cracks can be defined as cracks whose length is within the range of 20 μm and 1 mm [45]. For this type of crack, the crack closure concept may not be applicable. In the crack closure phenomenon, the crack is only open at a stress level higher than zero (depending on the R ratio and the applied stress range sometimes also below) within a loading cycle. Only that part of the K factor range over which the crack is open is thought to contribute to crack propagation. Crack closure is mainly related to the plastic-induced mechanism developed in the tip of the crack, and it Is inherent in the long cracks. However, it has been deduced that the effect of crack closure is not considerable in the growth of small cracks. Consequently, the effective stress ranges for small cracks are greater than those for long cracks under the same applied nominal loading, and the crack growth rates of small cracks can be significantly greater than the corresponding rate of the long cracks when characterized in terms of the same driving force.
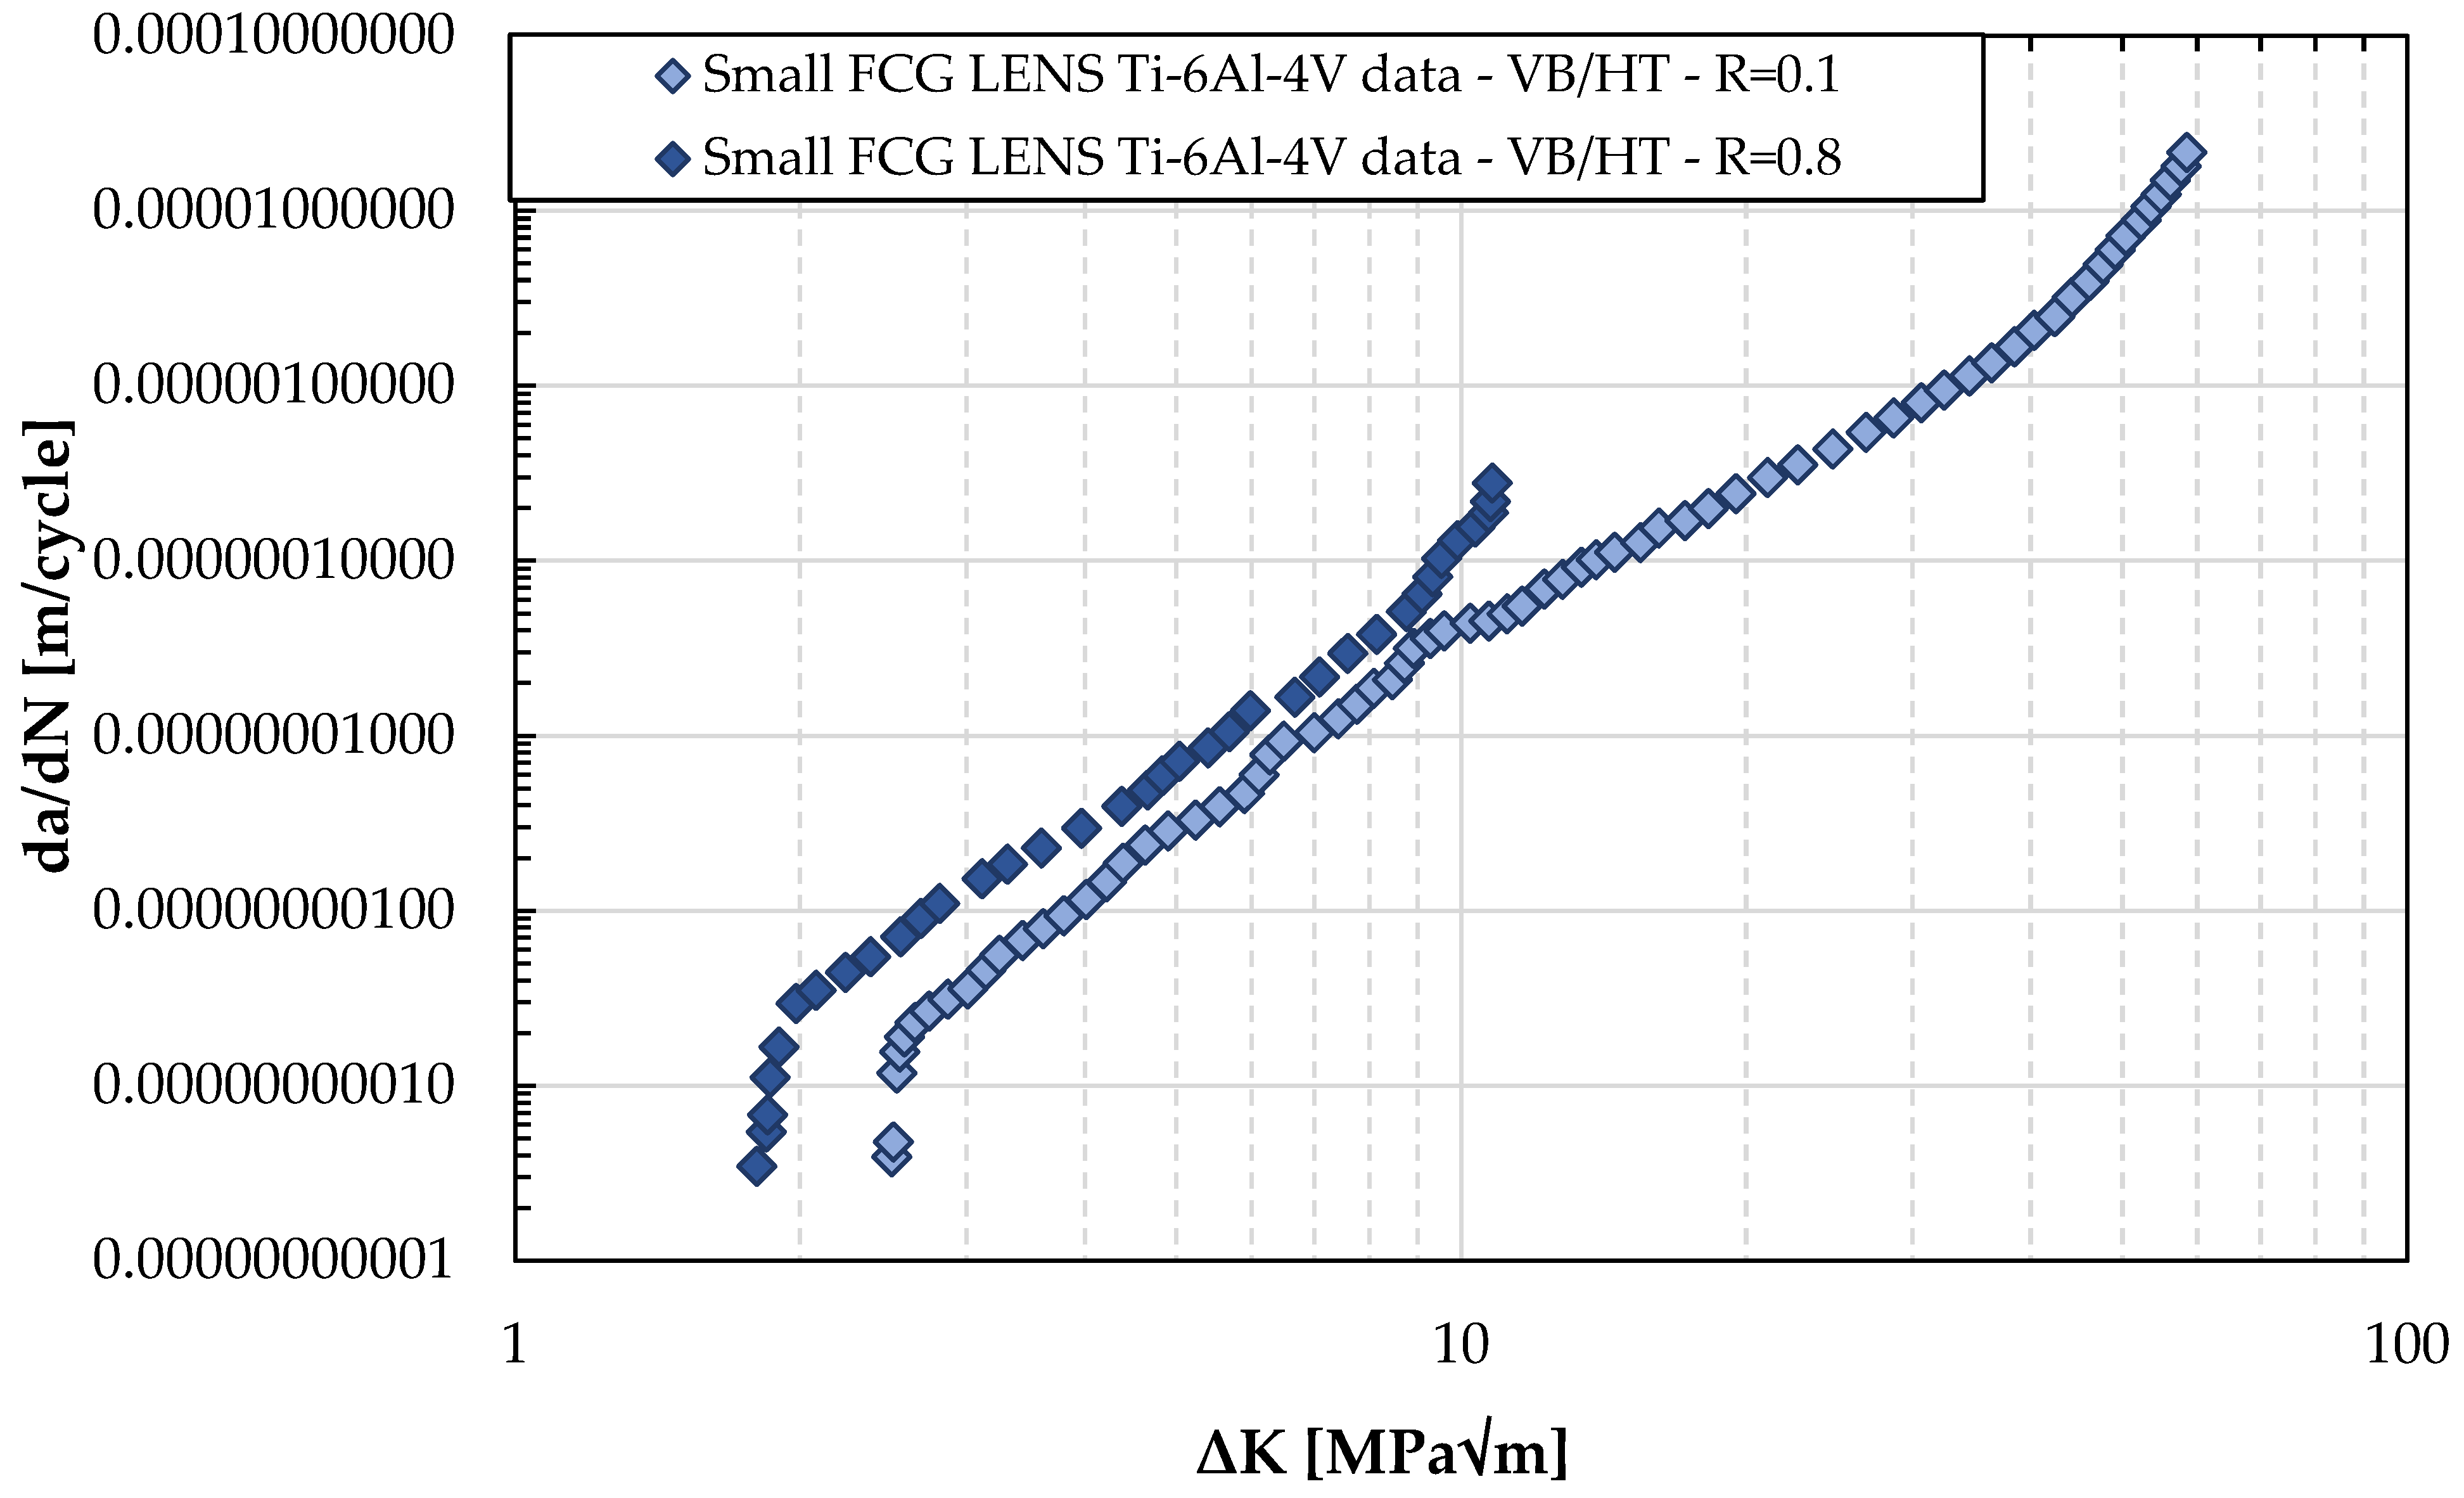
In the present study, long and small FCG properties have been implemented for the modeling of fatigue behavior of AM materials. For AM metal alloy Ti-6Al-4V, small FCG data of the literature work of Zhai et al. [45] have been used. Zhai et al. have determined the long and small FCG properties of Laser Engineering Net Shaping (LENS) Ti-6Al-4V for combinations of as-built/heat treated condition and vertically/horizontally orientation. A martensitic microstructure has been observed for Ti-6Al-4V in this work [42,51]. For the present analysis, only the data for vertically built and heat-treated specimens have been considered. The FCG properties have been determined for ratios R = 0.1 and R = 0.8. Small FCG properties have been determined with the crack closure correction of the respective long FCG data with Adjusted Compliance Ratio (ACR) method. Despite the differences between the LENS and the L-PBF process, due to the similarities in the resulting microstructure and defect distribution of Ti-6Al-4V between the two processes, the data can reliably be considered for the scope of the present work [45]. The FCG data of LENS Ti-6Al-4V are presented in Figure 5.
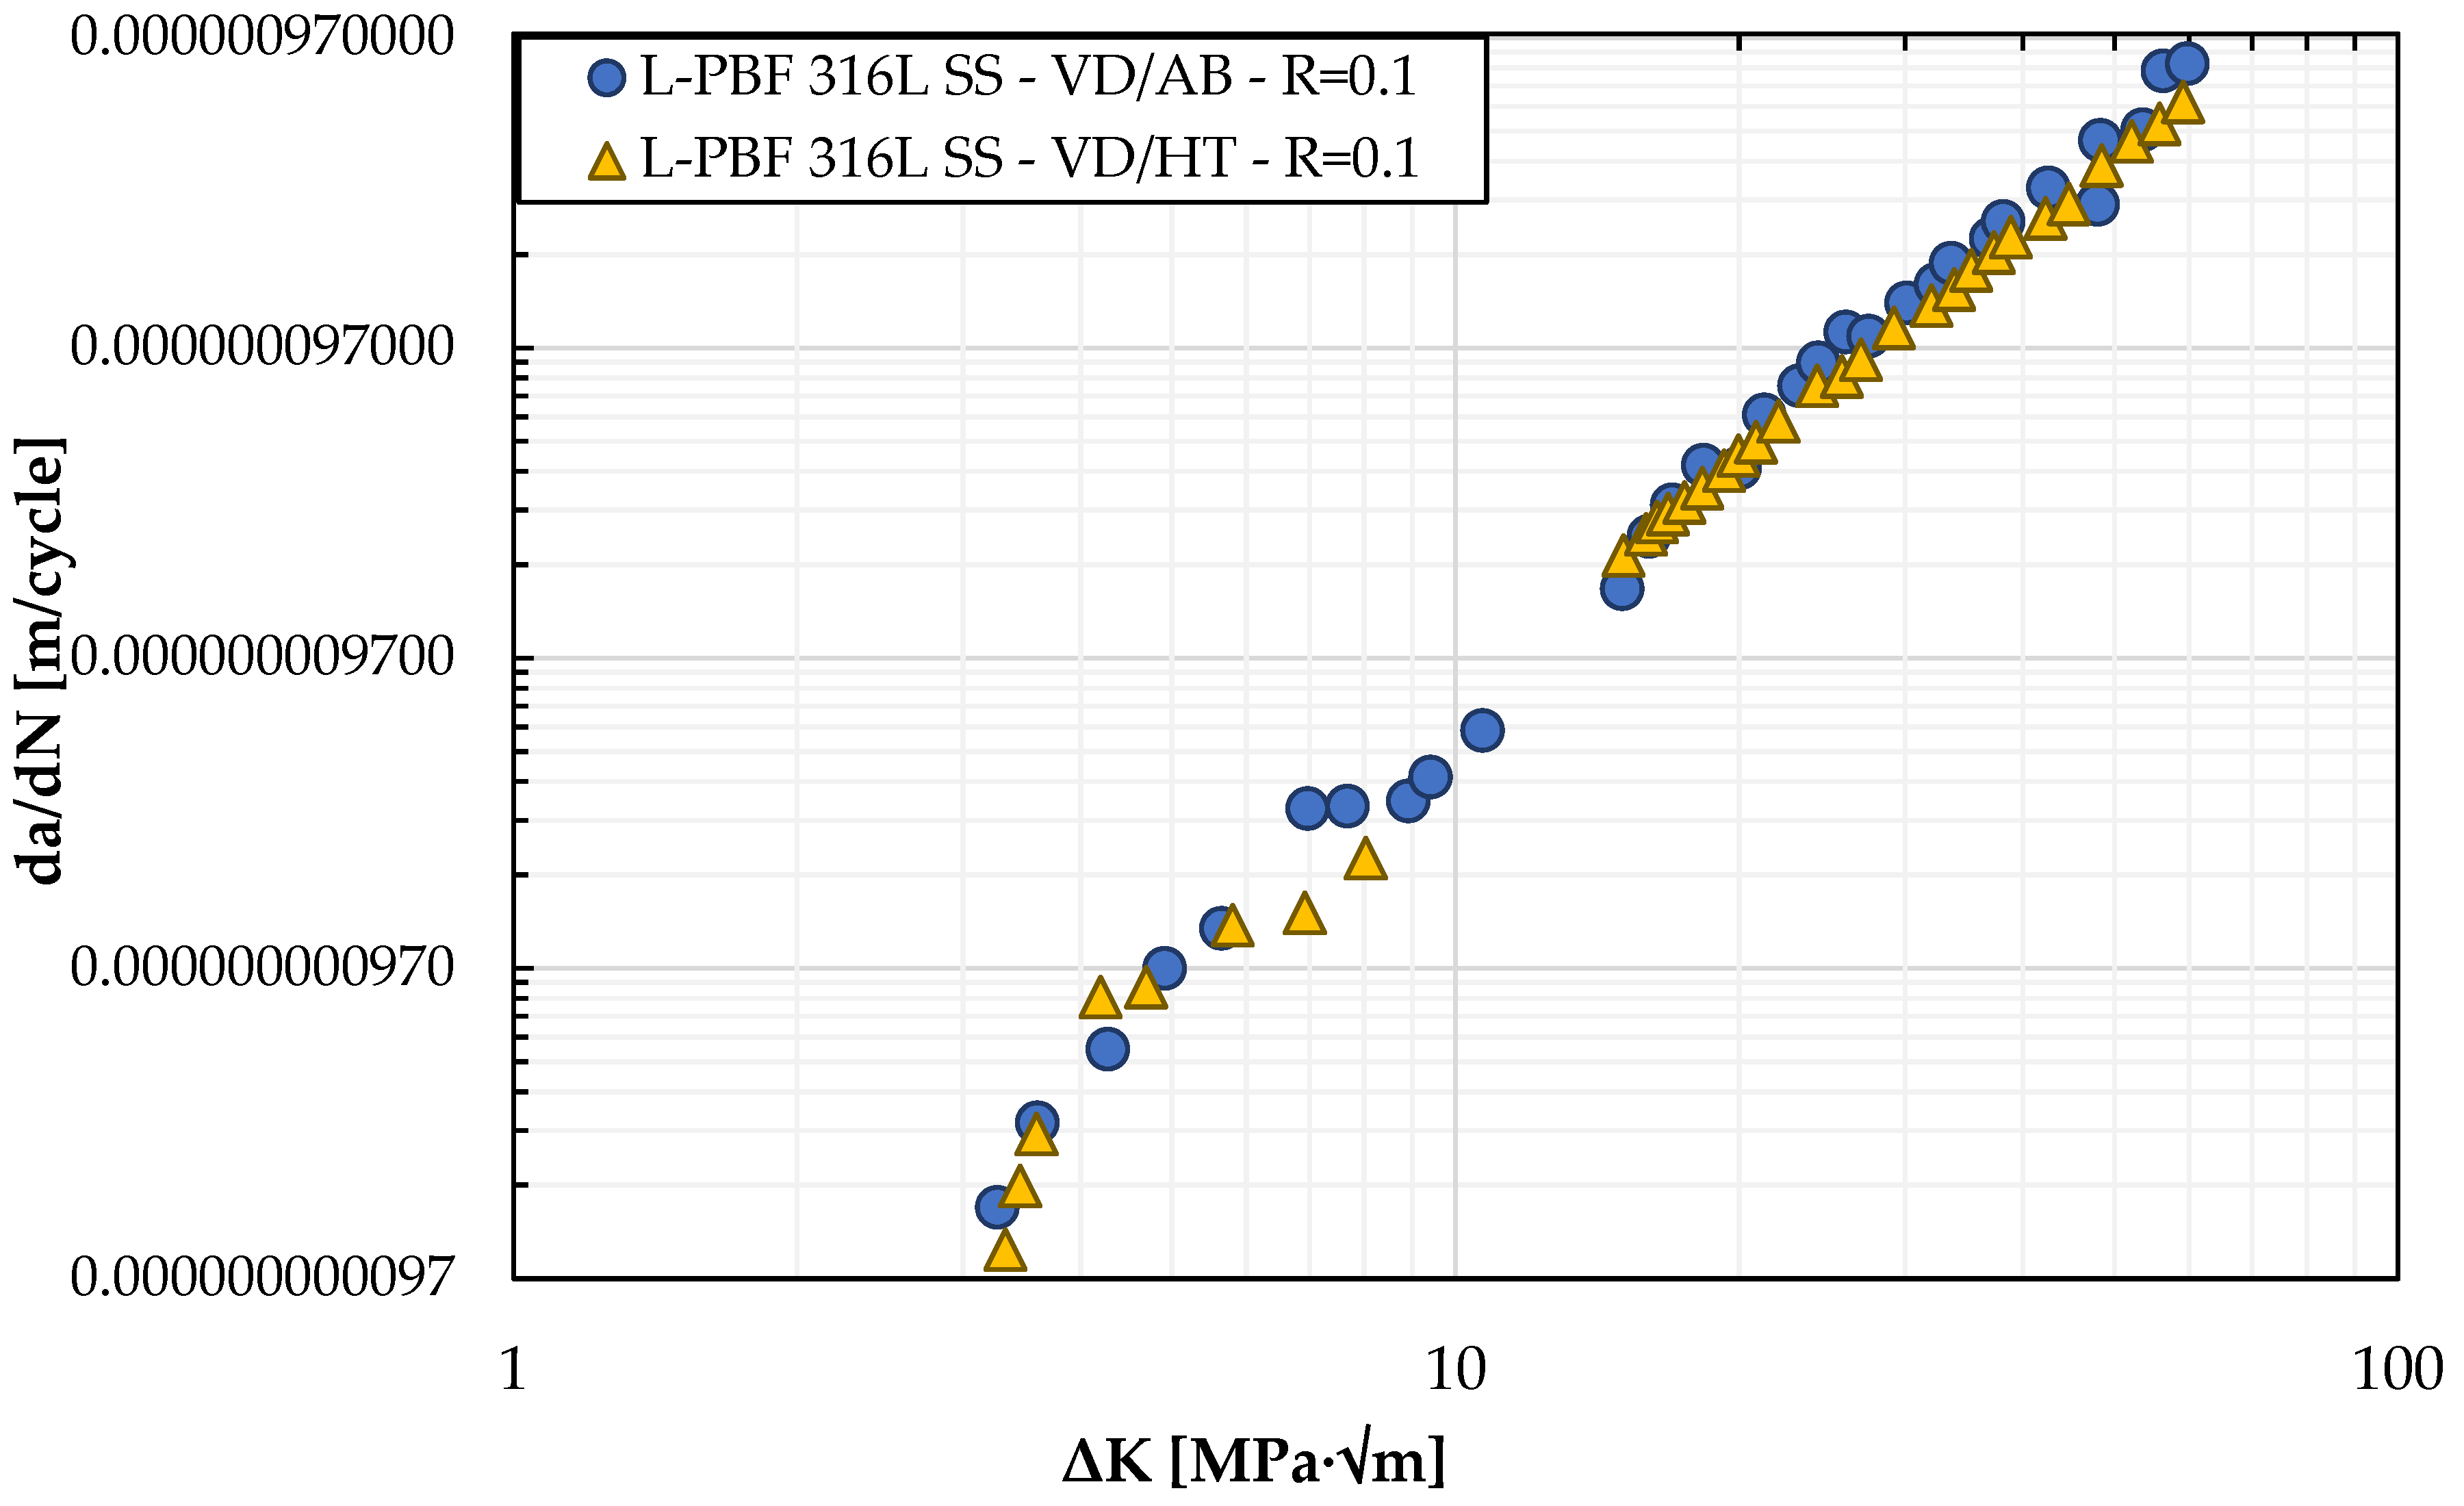
For the AM 316L SS, the long FCG properties of Fergani et al. [25] are used. To the knowledge of the authors, there is no study on the small FCG properties of L-PBF 316L SS. Thus, the long FCG data available in the literature have been considered. The FCG data accounted for near-threshold, stable and unstable crack growth regimes of FCG behavior. An austenitic microstructure has been observed in this case [25,51]. The FCG properties have been determined for the ratio R = 0.1. FCG data of L-PBF 316L SS are presented in the diagram of Figure 6. The data of the vertically built and heat-treated specimens have been considered to match the built conditions of the fatigue specimens.
Table 3 presents in brief the rest of the mechanical material properties used in the current methodology. Overall, these properties have been selected with the main concern to have a consistent set of material data, i.e., properties of metals processed under similar conditions. Thus, the effect of microstructure on these properties has not been examined.

2.2.5. Fatigue Crack Growth Rate Model

Fatigue life estimations have been performed in AFROW software (version 5.3.5.24, LexTech, Inc., Centerville, OH, USA) [64]. AFGROW software facilitates the use crack growth rate data models that are widely available in the open literature [64,65]. The tabular input of FCG data has been used in the software. The followed FCG model utilizes the Walker equation on a point-by-point basis (Harter T-Method) to extrapolate/interpolate data for any two adjacent R-values. According to this approach, the proper shifting in FCG rate is maintained. This method is a simple way to interpolate/extrapolate data and has given very good results over the years [64,65]. Contrary to the other methods of FCG rate representation (NASGRO, Hartman–Schijve) that need a big amount of FCG rate data over a sufficient range of R-values, the Harter T-Method uses simple interpolation methods to accurately model material behavior based on an available group of crack growth data of the examined material. This method is suited for the present case of Ti-6Al-4V because the available fatigue crack growth data are given for two positive ratios. Therefore, reliable prediction can be performed for any R-ratio. Crack growth data for a single R-value can be also used, as in the case of 316L SS. However, due to data of a single R value, the prediction is limited to the given constant ratio R = 0.1 of the crack growth data, which fits the ratio of experimental fatigue results used for validation in the present analysis. To properly predict the fatigue life of 316L SS for other R-ratios, more FCG should be determined.

3. Results—Discussion

3.1. Prediction of Susceptible Areas for Defect Formation

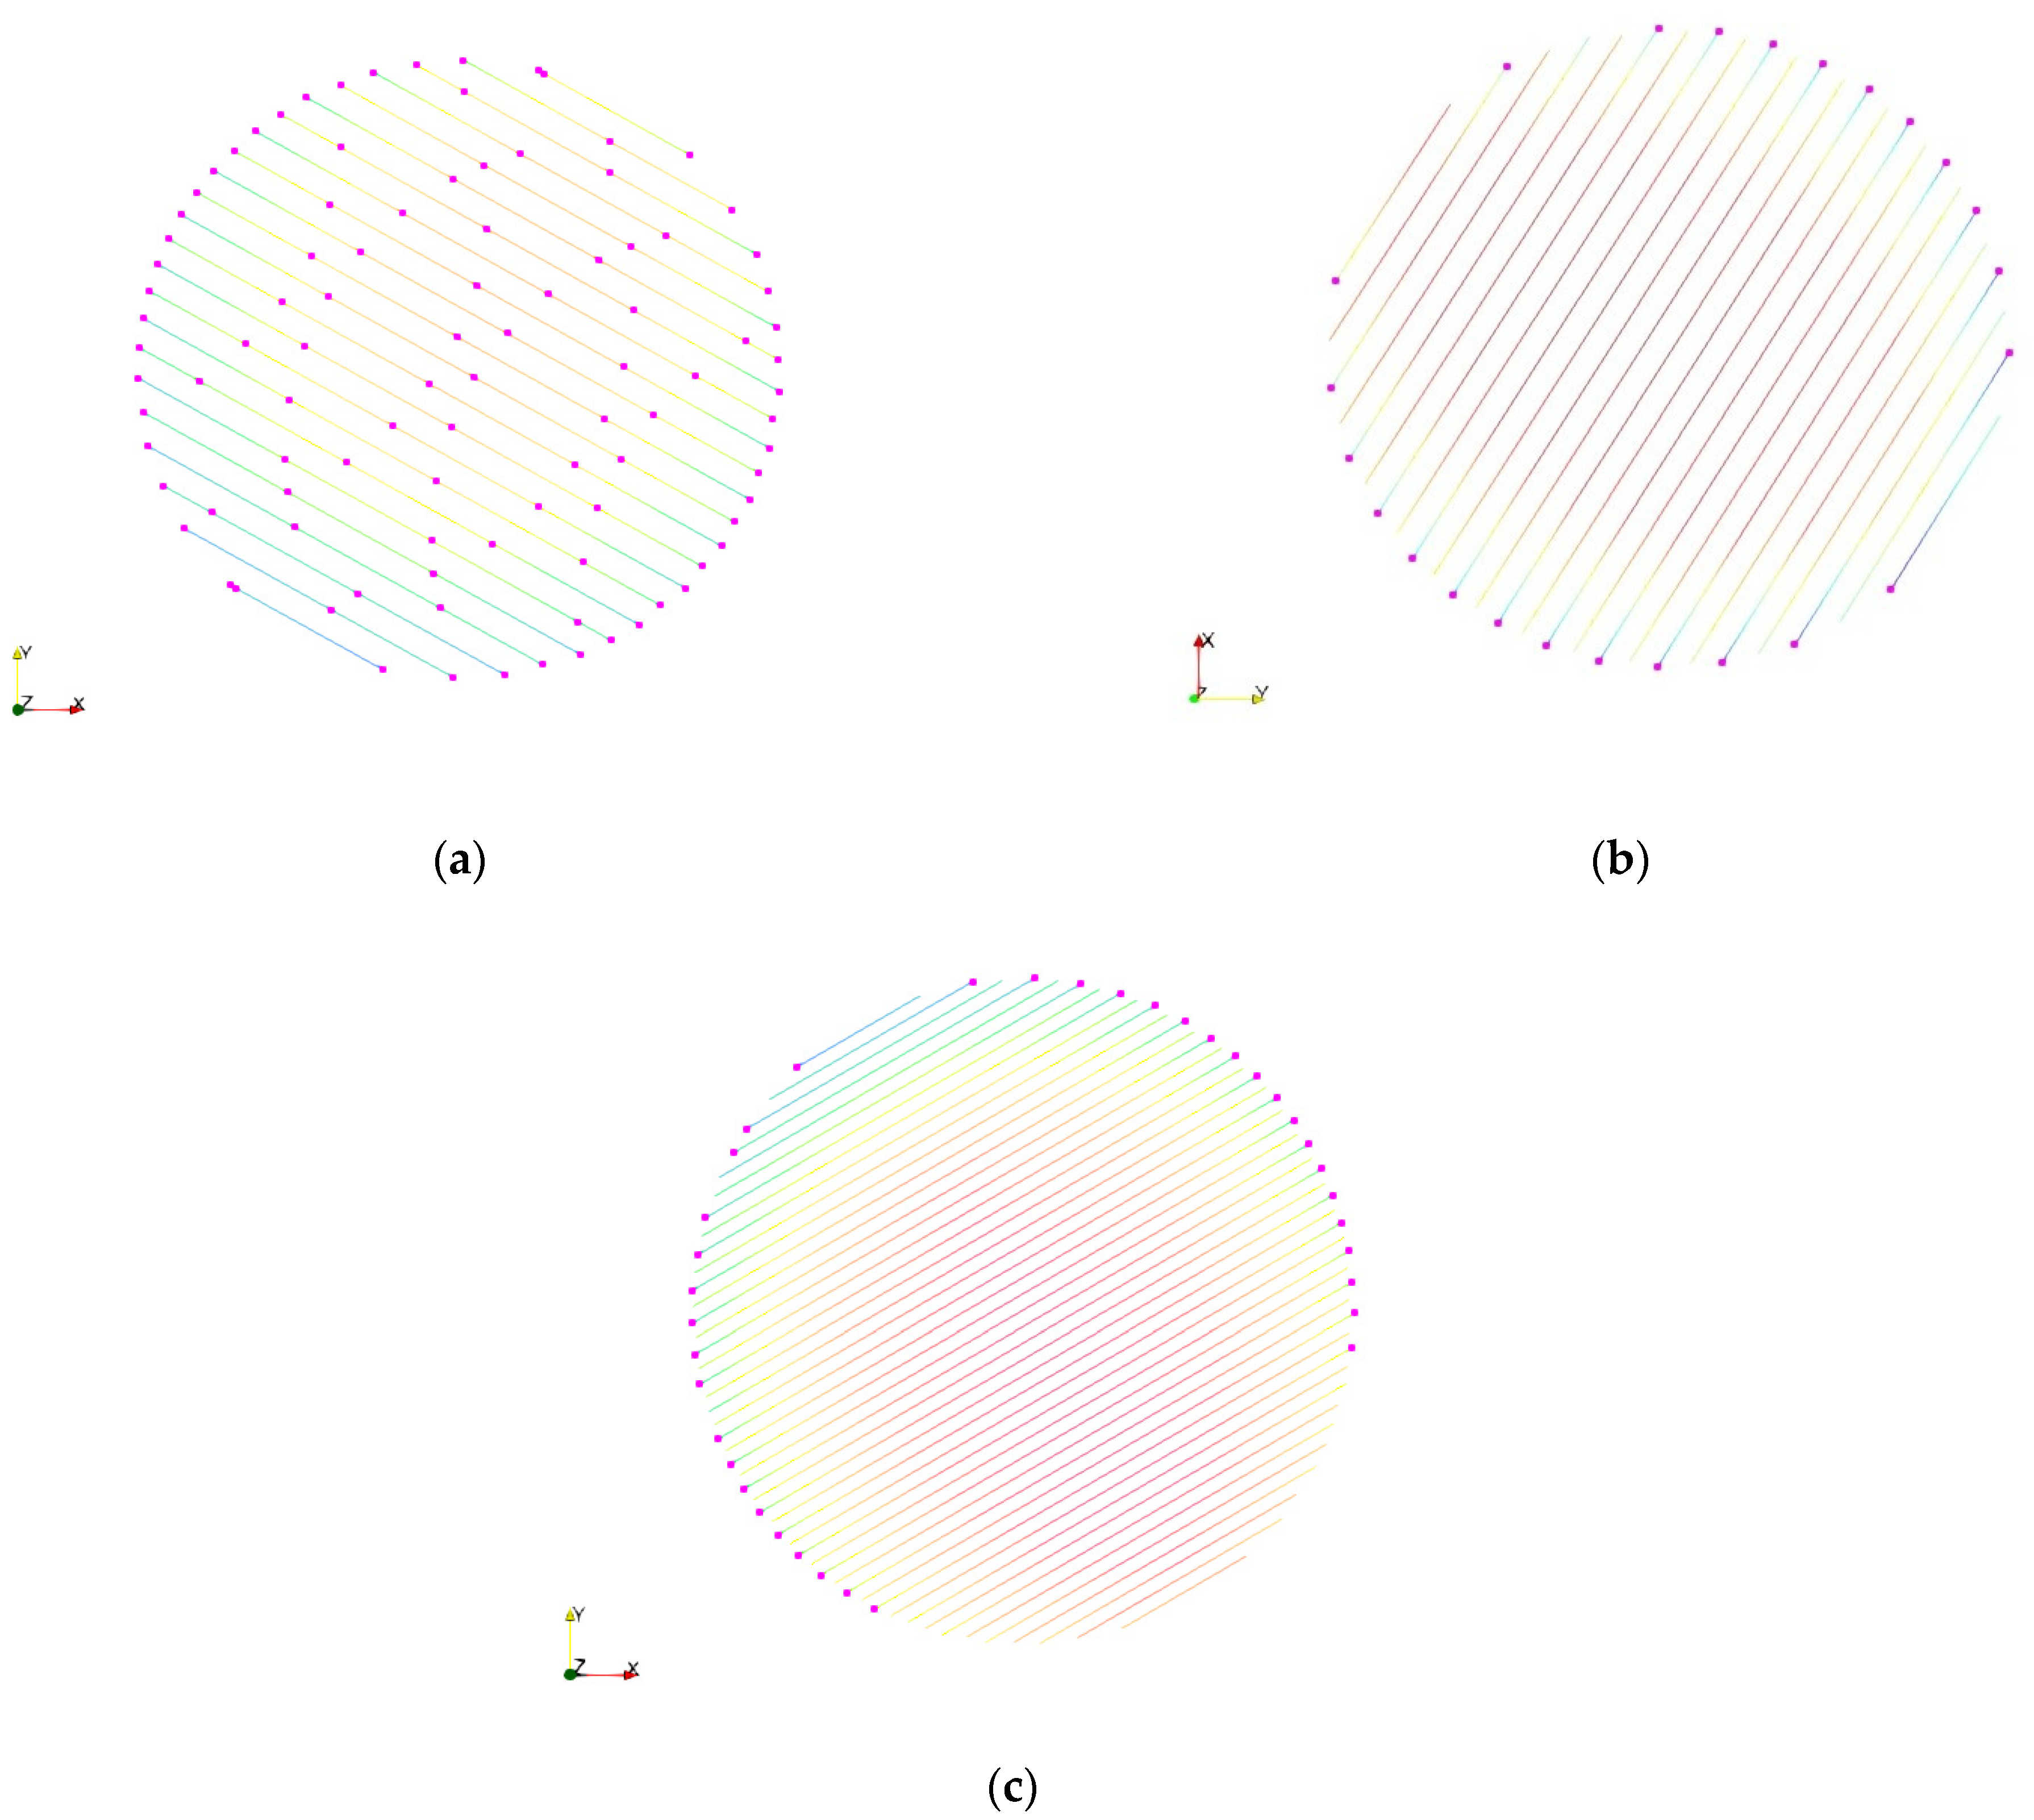
The examination of thermal history simulation results has been performed in the gauge length region for both Ti-6Al-4V and 316L SS specimens. In the case study of Ti-6Al-4V, for every group of process parameters, the distribution of defects has presented the same trend in every layer. Figure 7a–c show the representative distribution of defect susceptible regions in the layer at the middle of Ti-6Al-4V fatigue specimens fabricated with the process parameters of the Groups 3, 4 and 10, respectively. The pink dots indicate the melt pools which are susceptible for defect formation.
Group 3 presents the greatest amount of defects compared to Groups 4 and 10, which are distributed in both inner and outer regions of the displayed layer. The defects in Groups 4 and 10 are distributed only in the outer region of the layer. The defect density in Group 4 is larger compared to that of Group 10. LOF defects only have been identified in all cases. The predicted melt pool characteristics have not shown a tendency for keyhole formation. However, it should be mentioned that the ratio of D/W has been very close to the keyhole threshold in many points. This trending of the results agrees with the characterization of the groups according to their percentage of porosity measured in the experiment (Table 1) [50]. Moreover, according to the printability maps designed by the authors in a previous work [24], the combination of process parameters of Groups 3, 4 and 5 lies in the LOF region, in the boundary between LOF and optimum-dense region 4 and the optimum-dense region, respectively. The fractography examination of the fractures specimens has indicated many LOF subsurface pores as they have been proved more prone to be formed in the subsurface area due to imperfect connection between contour and inner scanning.
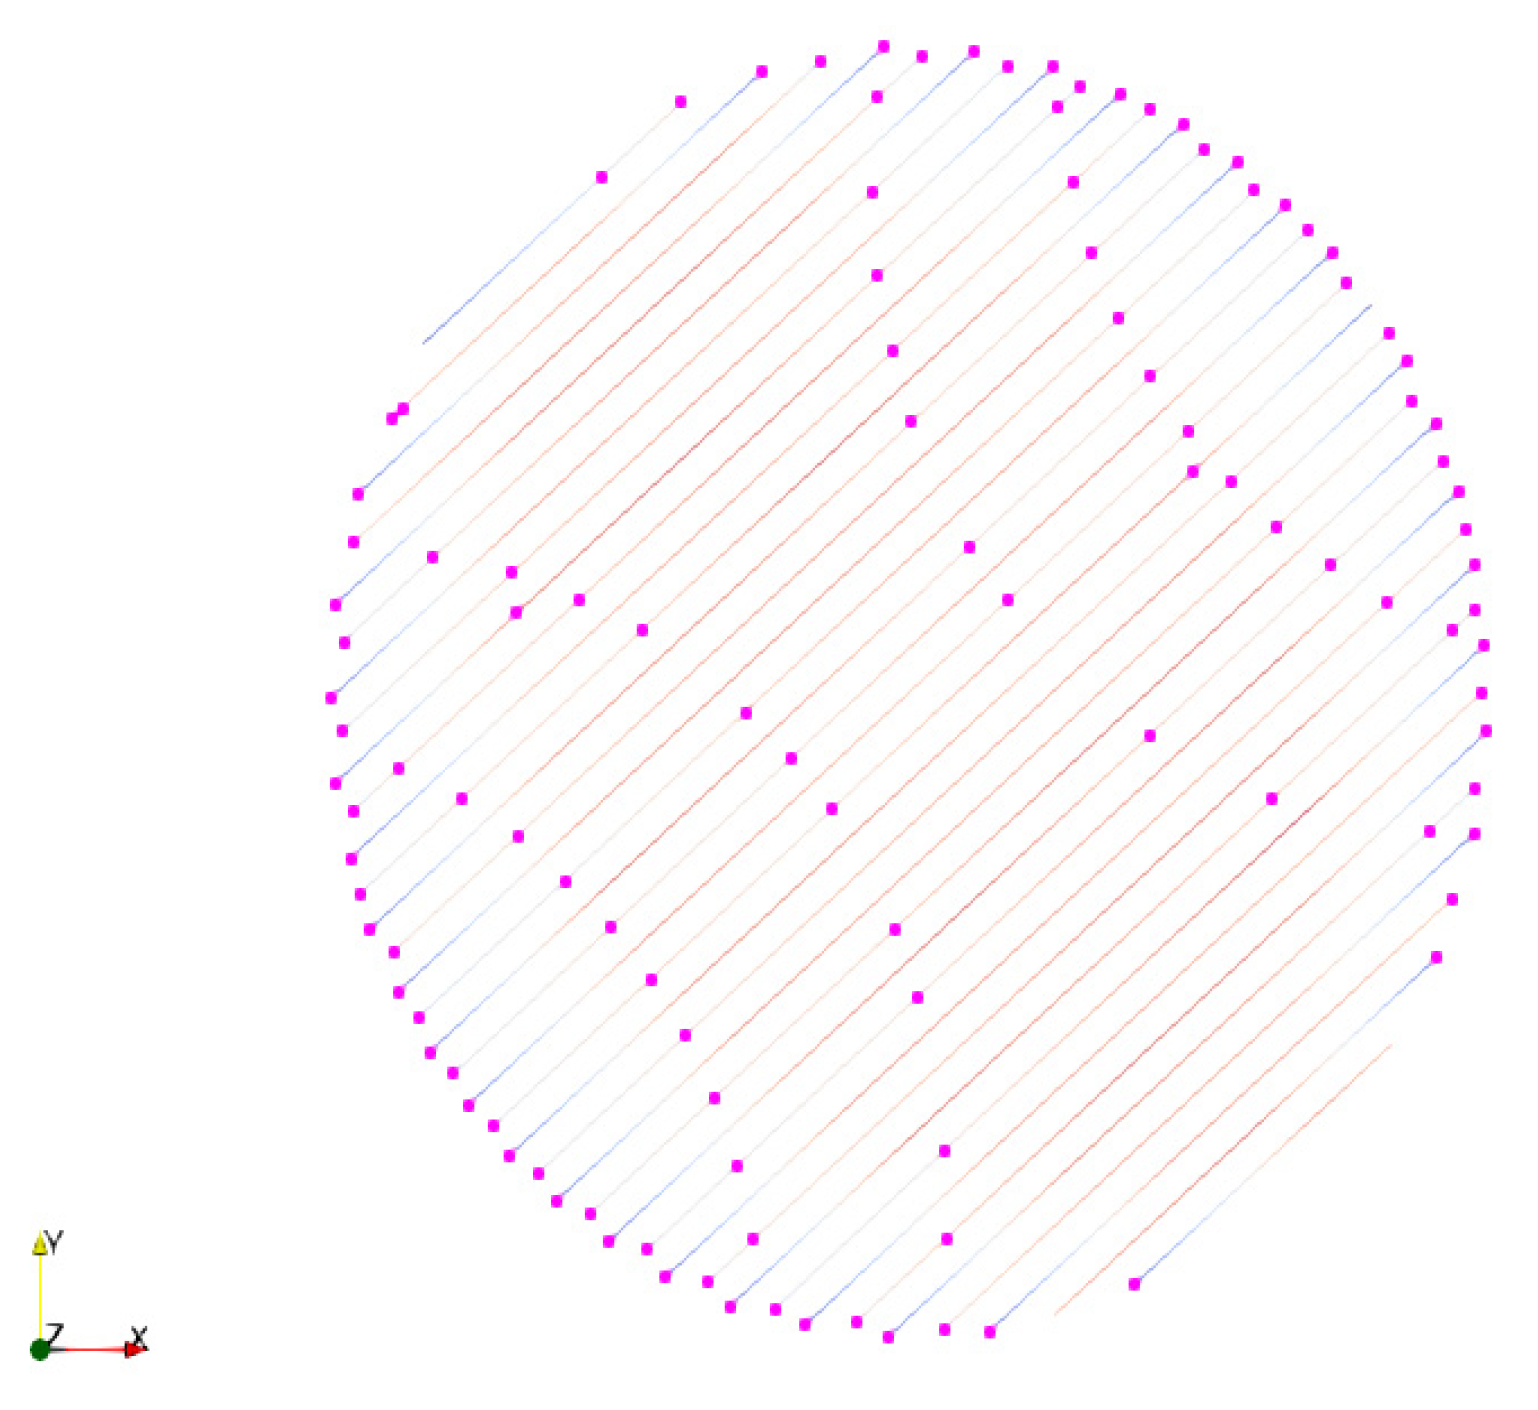
Figure 8 presents the distribution of predicted defects in the layer at the middle of the 316L SS fatigue specimen. Like Ti-6Al-4V, the distribution of defects has presented the same pattern in all the layers of the gauge length region. Only LOF defects have been identified in the layers without any tendency for keyhole formation. This outcome agrees with the characterization of the process parameters as LOF prone in the printability map developed by the authors [24]. The fractography results have also revealed a large number of LOF pores in the inner and near-surface regions of the fractured surfaces of the fatigue specimen [51].

3.2. Killer Defect—K-Solution

The predicted distribution of defects now assists in the determination of the critical areas of fatigue crack initiation. Considering the predicted defects as initial cracks, the defects with the higher SIF are the most dangerous for crack initiation and propagation. Assuming initial cracks of the same effective size, their criticality depends mainly on the stress state and the location of the cracks on the examined cross-section. In the present cases, the most critical defects are in the surface of the thinnest cross-section of fatigue specimens, because in these cross-sections, the stresses at the edge of the cracks are the largest, and the surface cracks have the greatest geometrical factor compared to the internal cracks of the same size. This assumption matches with the fractography observations in the experimental data as the catastrophic failure initiated from defects near the surface of the specimens [50,51]. In the case of Ti-6Al-4V, secondary cracks have been developed from the surface of the specimens, but their propagation has been limited, as they have stopped possibly after a few cycles [50]. However, the modeling of multiple crack initiation and propagation is out of the scope of this work.
Due to the location of the critical defects, the K-solution for the surface crack growth in cylinders can be considered as the most suitable SIF from the list of K-solutions provided by AFGROW [64]. This K-factor has been considered for both experimental test cases. The schematic description of cracked geometry in the plane perpendicular to the loading direction is presented in Figure 9. Figure 9 does not include the any information about the granular structure, as the effective defect size is larger than the size of microstructural characteristics. As previously referred, the synergy between the defect(s) and microstructure is not accounted for in the present study, because the crack initiation mechanism in the form of micro-defects coalescence and the formation of a larger defect metal is not profound in the fatigue failure of AM metals. This interaction could be considered as an issue for future research.

3.3. Fatigue Life Estimation of L-PBF Ti-6Al-4V

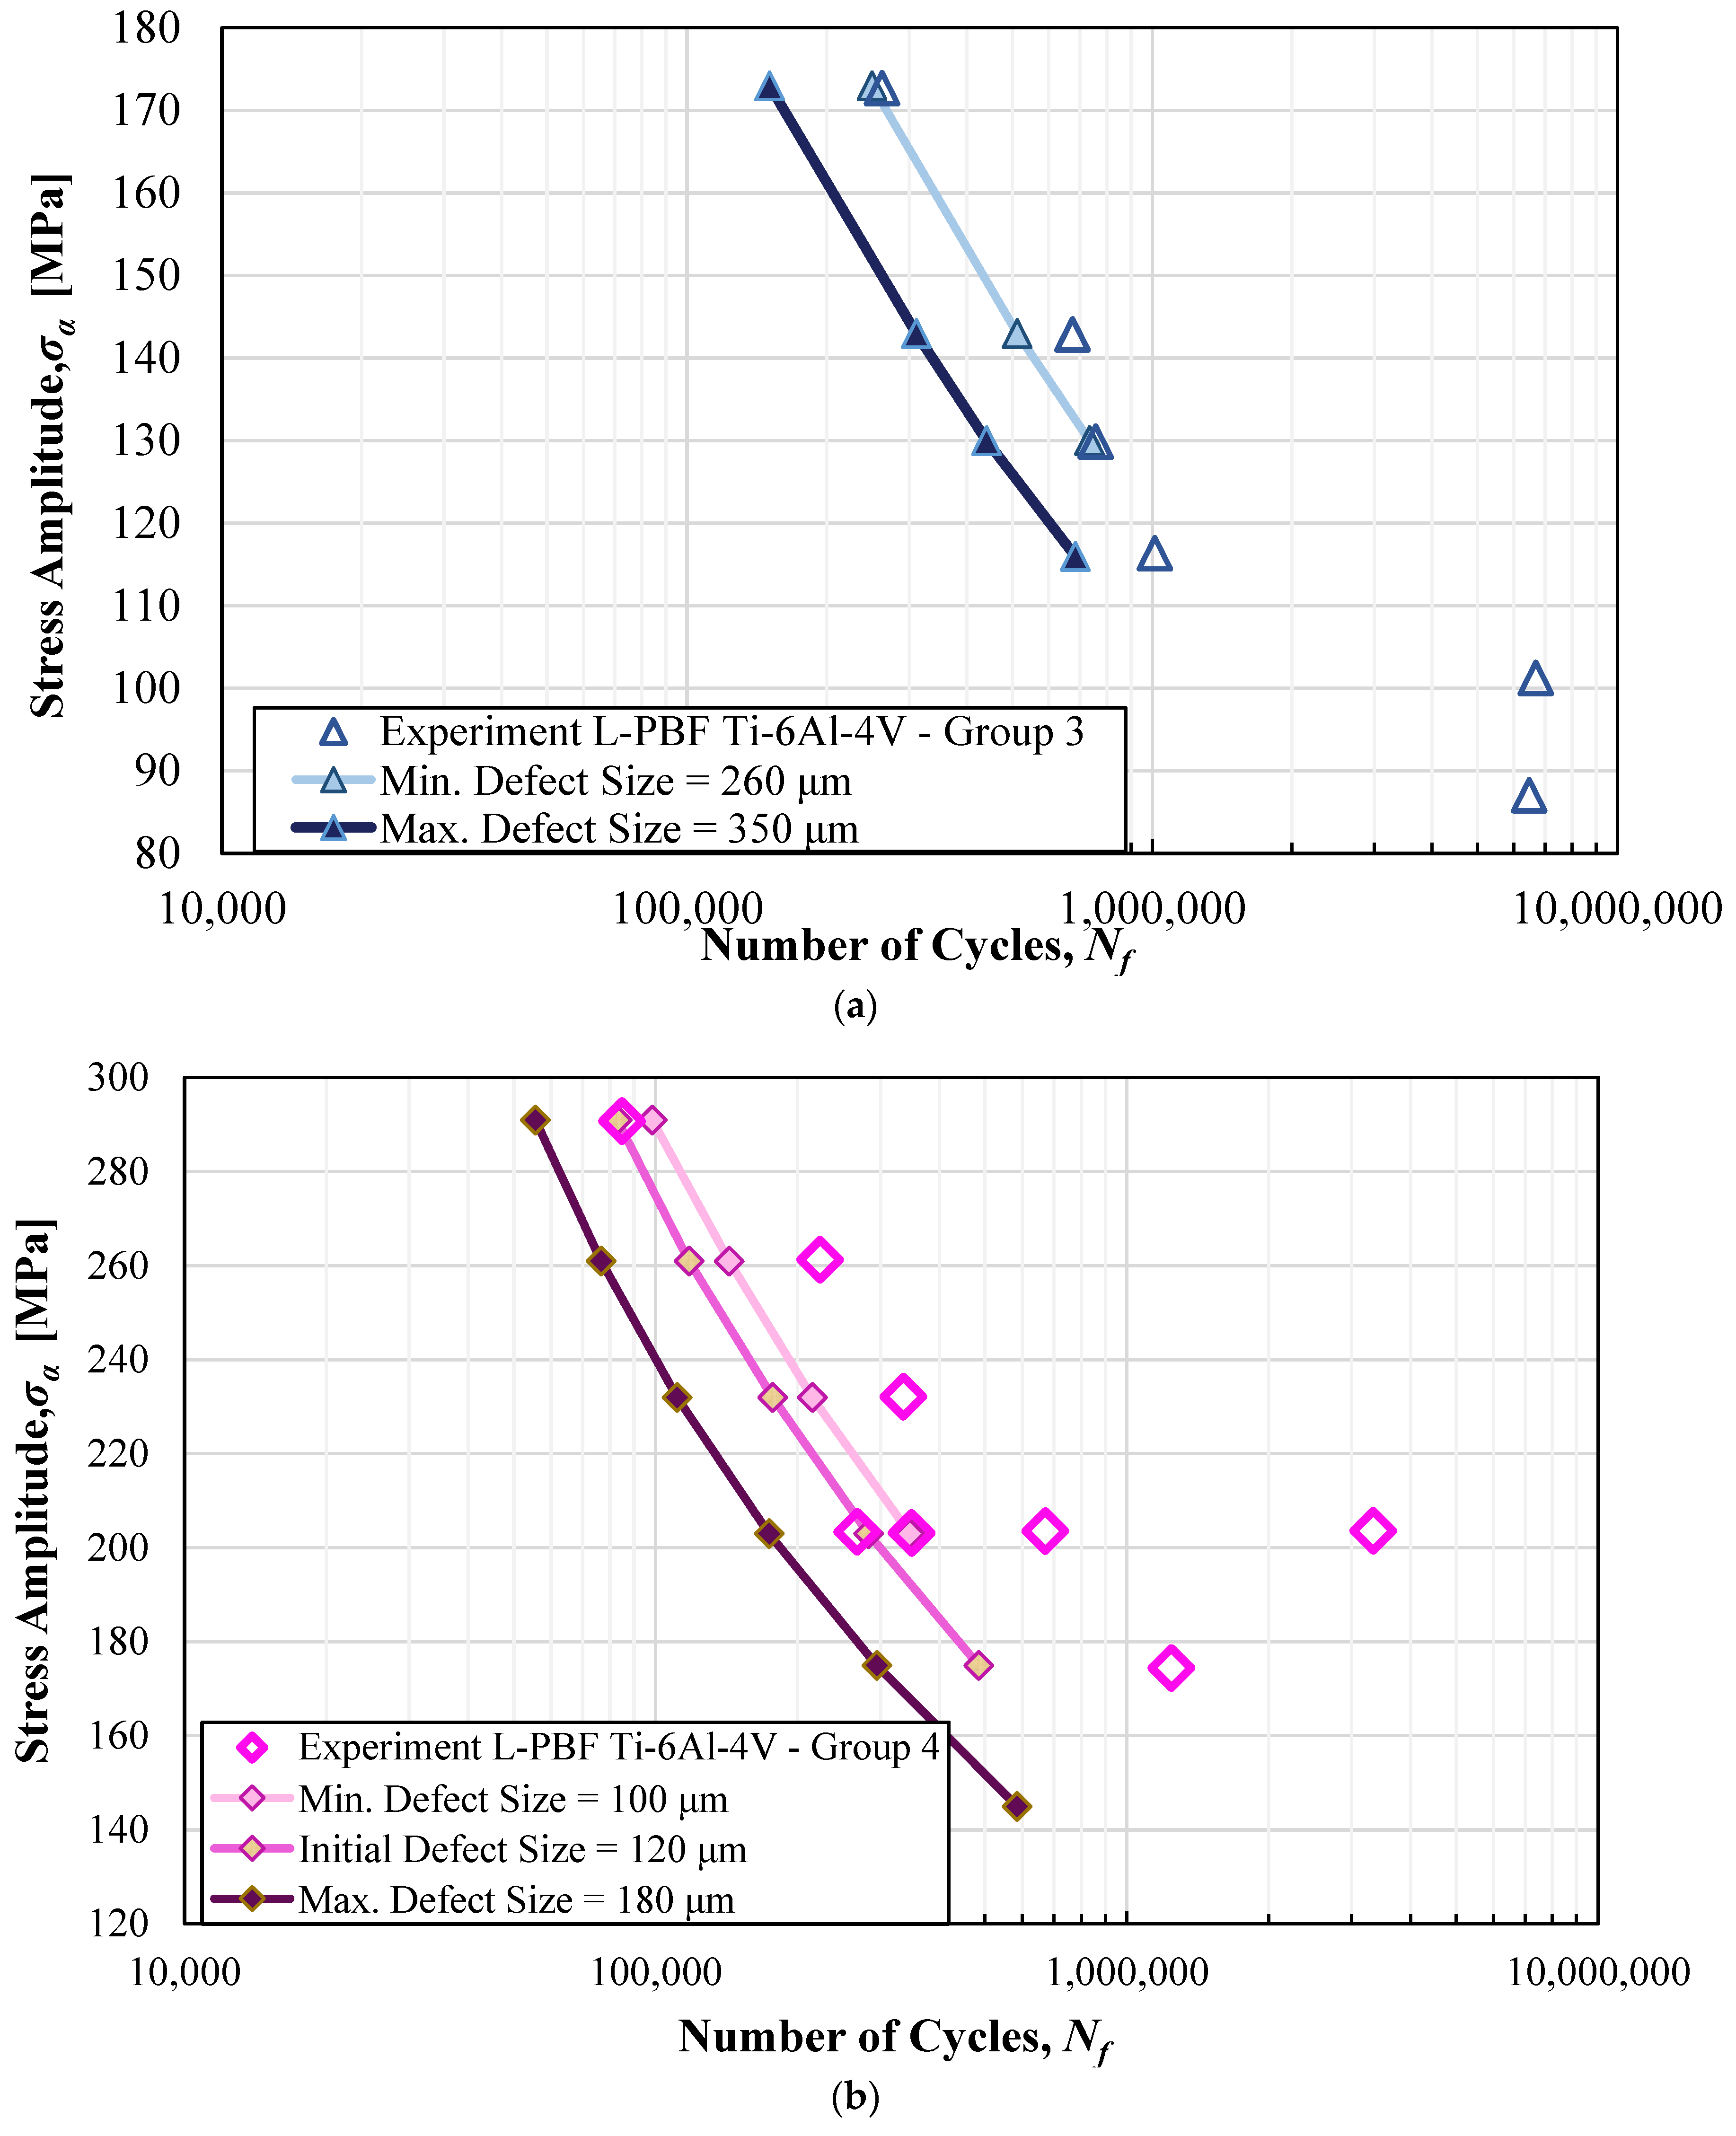
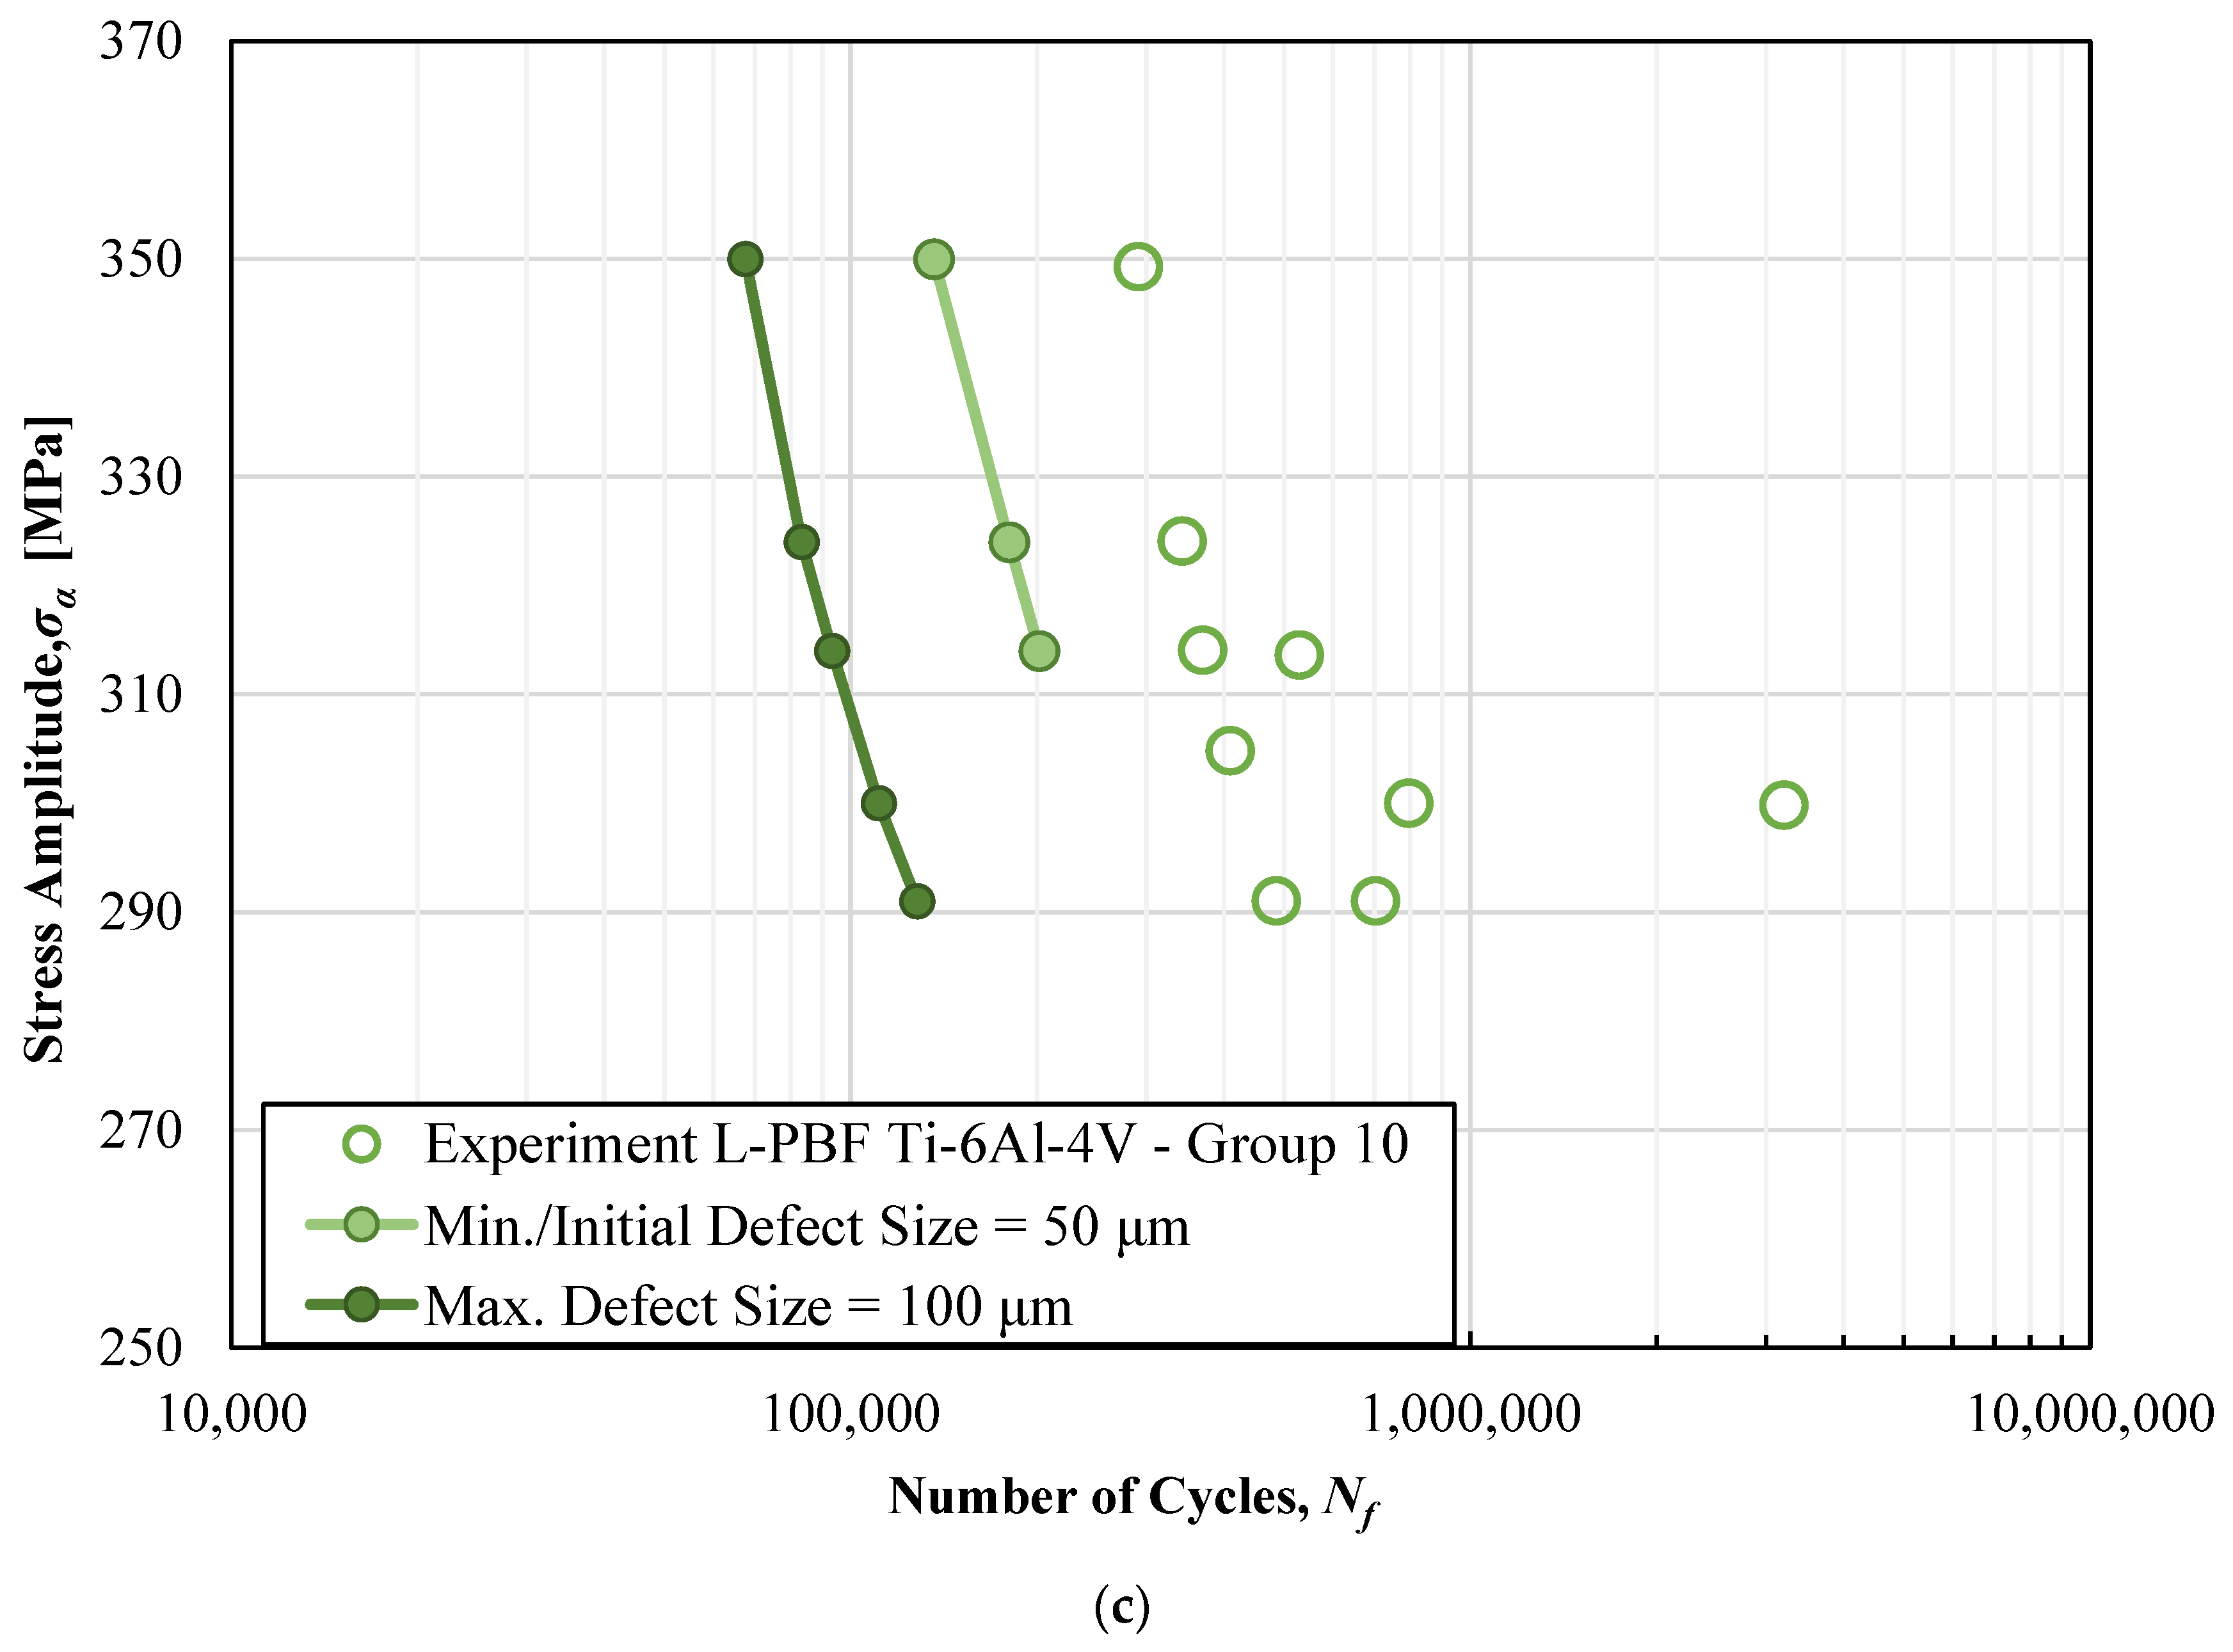
Figure 10a–c present the correlation between the experimental fatigue data and the predicted fatigue life estimation results of L-PBF Ti-6Al-4V fabricated for Groups 3, 4 and 10, respectively. In each diagram, the fatigue life prediction curves for the expected maximum/minimum and measured (initial) defect size are illustrated. The simulations for the maximum/minimum defect sizes have been performed to showcase the capability of the methodology to predict the fatigue lives of the specimens when there are no available data of defect sizes. For every group of process parameters, a different range of minimum–maximum defect size has been chosen, as presented in Table 4. The range of defect sizes is different because the possibility of defects with large size is greater for the process parameters that lead to parts with excessive porosity. Thus, Group 3 (maximum percentage of porosity) presents the biggest range of defect sizes compared to Group 10 (minimum percentage of porosity). The minimum/maximum values of each range have been chosen according to available data of defects in AM Ti-6Al-4V [11].
For Groups 3 and 4, where the fatigue failure is mainly defect-driven, the predicted results correlate quite well with experimental results, as the error between experimental and predicted results is within 3% for the identified nominal defect size. In these cases, most of the experimental data are enclosed between the curves of the max/min defects. In the case of Group 4, the prediction for the measured initial defect size of 120 μm yields results very close to the respective experimental ones. The accuracy of these results is comparable with the respective of literature works that model the defect-driven fatigue failure of AM Ti-6Al-4V [19,20]. For Group 10, the predicted region of results presents a significant discrepancy with experimental ones, as the error is about 5% for the nominal defect size. This is mainly attributed to the small defect sizes detected in the specimens of this group. For the cracks initiating from defects whose size is comparable with the microstructural characteristics, the fatigue life initiation stage is considerably dependent from the microstructure. In the utilized LEFM approach, this stage cannot be considered effectively. Thus, the predicted fatigue life is underestimated in the case of Group 10.
For every group, crack growth mainly in the models of initial minimum defect size has not taken place for stress amplitudes less than a stress level (Group 3—120 MPa, Group 4—200 MPa, Group 10—300 MPa). In these cases, the defect size has not been adequate enough to cause any crack growth. This limitation can be resolved with a refined determination of ΔΚthr in the experiments of fatigue crack growth of metallic materials.

3.4. Fatigue Life Estimation of L-PBF 316L SS

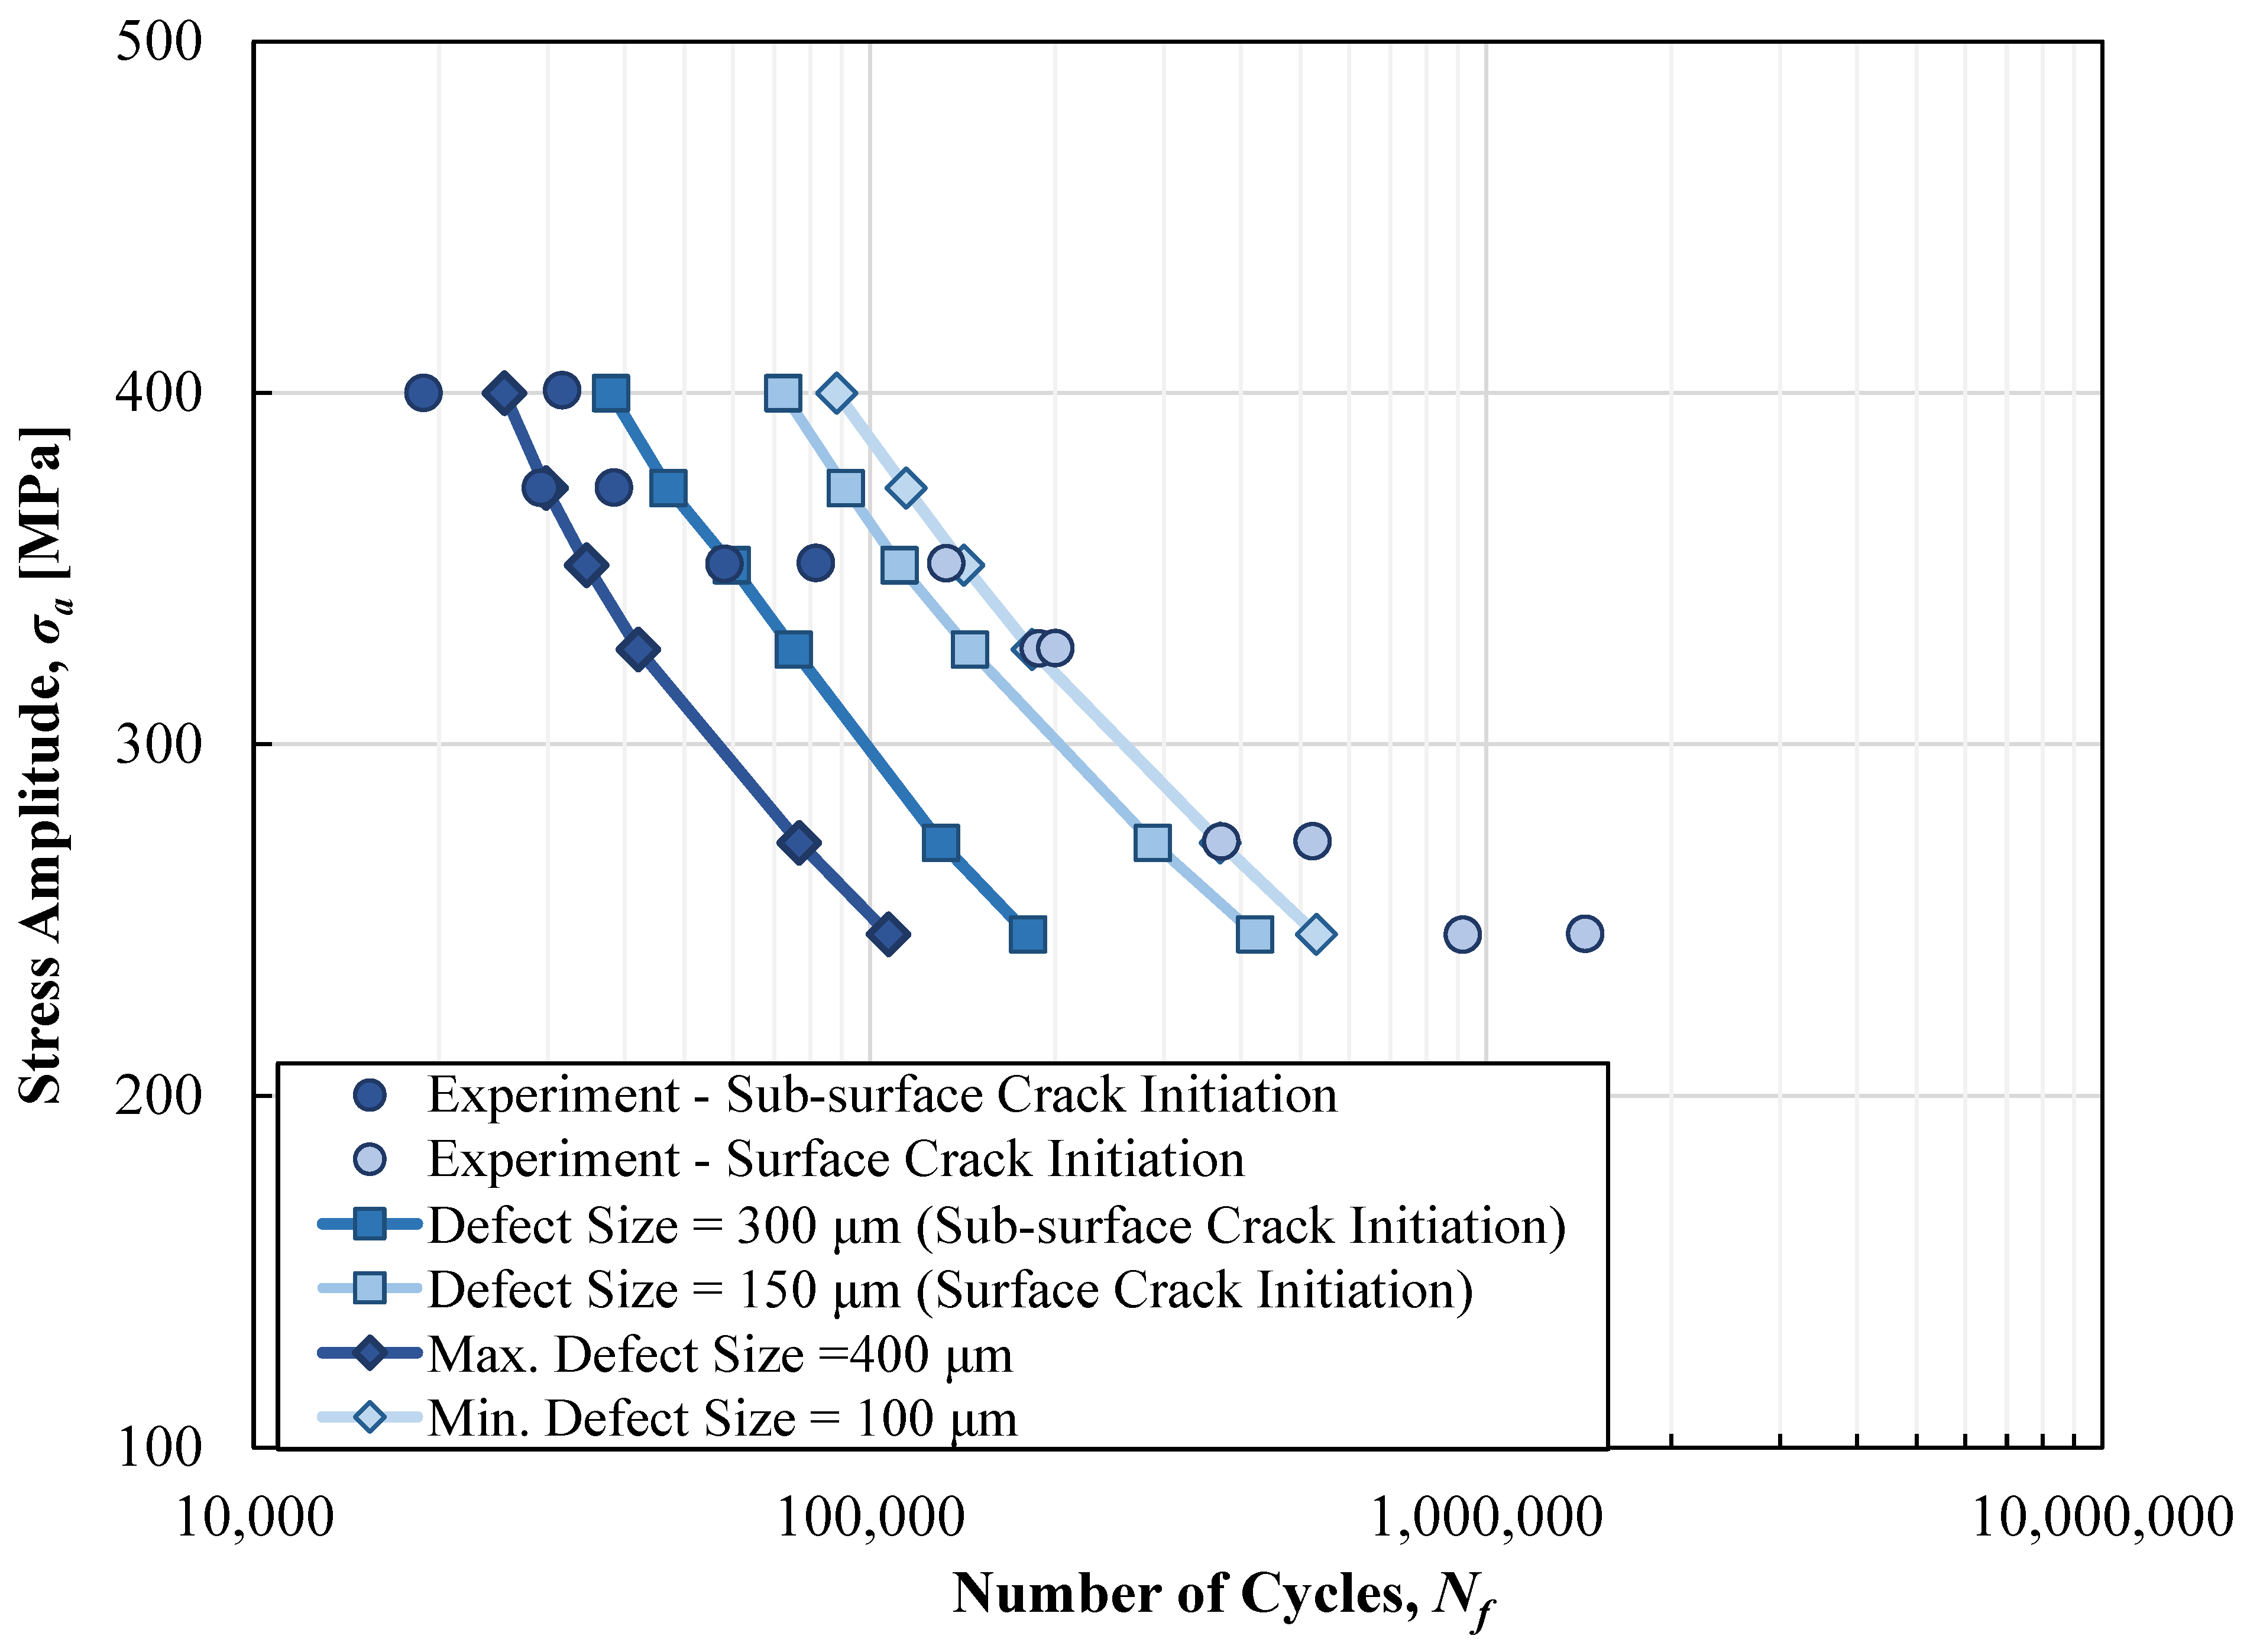
Figure 11 presents the correlation between the experimental fatigue data and the predicted fatigue life estimation results of L-PBF 316L SS. The simulation results for the maximum and minimum defect size are presented. The range of maximum and minimum defect is relatively large (100–400 μm) due to the LOF tendency of the utilized process parameters. Despite that, there is quite good correlation between experimental and predicted results for the nominal defect size and the correlated stress range, as the error is within 3%. The experimental data are categorized into subsurface and surface according to the location of crack initiation. In the work of Solberg et al. [52], an apparent difference in the crack initiation location has been observed. Cracks have been initiated from the surface in higher stress amplitude, while cracks initiated from the subsurface in lower stress amplitude. The stress level on which the transition has been observed is at 350 MPa. This has been attributed to the difference in the crack driving force mechanism in the two occasions. The stress concentration has been deemed larger for the surface defects compared to the subsurface cracks for the stress levels lower than 350 MPa. Conversely, the stress concentration was lower for the subsurface-initiated cracks for stress levels higher than 350 MPa. Accordingly, the simulation results show that the K-solution with the maximum defect size is more suitable for the modeling of the sub-surface defects compared to the K-solution with the minimum defect size, which predicts with good accuracy the fatigue life of the surface-initiated cracks. This is expected, as the effective defect size of the subsurface defects is larger compared to that of the surface defects. The best fit with experimental data for subsurface and surface initiation has been observed for effective defect sizes of 300 μm and 150 μm, respectively.
These results indicate the importance of the defect characterization in terms of location, distribution and size. The characteristics of defects can shed light into the fatigue failure mechanism. This accounts for the proper determination of the critical defect; the critical defect can be varied with the applied loading. In addition, in the present case of L-PBF 316L SS, due to the large LOF defects, the role of the microstructure is minor; it is a pure defect governed fatigue failure.

4. Conclusions

In the present work, a modeling methodology for the fatigue life prediction of L-PBF AM metals and parts is presented. The methodology consists of two modules: the prediction of the areas of defect formation in L-PBF fabricated materials and the fatigue modeling. The first module aims to identify the most critical defect from which the catastrophic failure is going to initiate, and the second module aims to develop a model based on fracture mechanics principles for fatigue life prediction. The methodology has been applied for the fatigue modeling of L-PBF Ti-6Al-4V and 316L SS metal alloys based on cases found in the literature. The following conclusions can be drawn based on the present analysis and results:
  • The prediction of susceptible areas of defect formation has been satisfactory in the present cases based on correlations with the relative experimental literature works.
  • Small fatigue crack growth properties are necessary due to the small size of defects that act as initial cracks. Due to their size, the crack closure concept in the crack front of these defects may not be applicable. Thus, the effective stress range is larger.
  • For defect-based modeling, the initial defect/crack size is the most important parameter and must be determined with accuracy. For this reason, a detailed characterization of the porosity in AM materials is very important to be used as an input in fatigue models.
The correlation between experimental fatigue data and predicted results is very good for most of the cases. The accuracy of the predicted results is comparable with those of relative research works for defect-driven fatigue failure [19,20]. In the cases of very small defect sizes, which have the size of grain structures, the modeling approach presents the greater discrepancy with experimental data.
As next steps, the present modeling method combined with a probabilistic framework could be used for the fatigue life assessment of L-PBF parts. In this case, the determination of critical defect(s) is not straightforward, and the probability assessment would be essential to predict the fatigue failure initiated from the most critical zones. In real parts, the crack may not propagate under Mode-I as presented in this study but under Mode-II or Mixed Mode. Thus, the determination of the fatigue crack growth of AM metals under those modes is crucial for their fatigue modeling. The extension of the present methodology for the analysis of lattice materials or lattice optimized parts—where the stress–strain approaches prevail [66,67]—is also a considerable challenge due to their developed micro-crack initiation and propagation. Moreover, a multi-scale modeling approach [68] or a unified approach [69] that incorporates information of defect(s) and microstructural characteristics for fatigue life prediction can be developed. Thus, the synergistic effect between microstructure and anomalies which prevails in the Low Cycle Fatigue (LCF) regime can be sufficiently modeled, and the framework can cover fatigue mechanisms for both HCF and LCF regimes. These approaches would help to model the fatigue in all stages of crack initiation and propagation, providing an insight of the failure mechanisms in the material. Multiple crack growth can be also modeled to address the effect of secondary crack propagation on the effect of fatigue strength [19].

Author Contributions

Conceptualization, H.O.P. and G.N.L.; methodology, H.O.P. and G.N.L.; software, H.O.P. and G.N.L.; validation, H.O.P. and G.N.L.; formal analysis, H.O.P. and G.N.L.; investigation, H.O.P. and G.N.L.; writing—original draft preparation, H.O.P.; writing—review and editing, H.O.P. and G.N.L.; visualization, H.O.P.; supervision, H.O.P. and G.N.L. All authors have read and agreed to the published version of the manuscript.

Funding

This research received no external funding.

Data Availability Statement

All data generated or analyzed during this study are included in this published article.

Conflicts of Interest

The authors declare no conflict of interest.

References

  1. Seifi, M.; Gorelik, M.; Waller, J.; Hrabe, N.; Shamsaei, N.; Daniewicz, S.; Lewandowski, J.J. Progress Towards Metal Additive Manufacturing Standardization to Support Qualification and Certification. JOM 2017, 69, 439–455. [Google Scholar] [CrossRef]
  2. Yadollahi, A.; Shamsaei, N. Additive manufacturing of fatigue resistant materials: Challenges and opportunities. Int. J. Fatigue 2017, 98, 14–31. [Google Scholar] [CrossRef]
  3. Blakey-Milner, B.; Gradl, P.; Snedden, G.; Brooks, M.; Pitot, J.; Lopez, E.; Leary, M.; Berto, F.; du Plessis, A. Metal additive manufacturing in aerospace: A review. Mater. Des. 2021, 209, 110008. [Google Scholar] [CrossRef]
  4. Herzog, D.; Seyda, V.; Wycisk, E.; Emmelmann, C. Additive manufacturing of metals. Acta Mater. 2016, 117, 371–392. [Google Scholar] [CrossRef]
  5. Du Plessis, A.; Razavi, S.M.J.; Benedetti, M.; Murchio, S.; Leary, M.; Watson, M.; Bhate, D.; Berto, F. Properties and applications of additively manufactured metallic cellular materials: A review. Prog. Mater. Sci. 2022, 125, 100918. [Google Scholar] [CrossRef]
  6. Lewandowski, J.J.; Seifi, M. Metal Additive Manufacturing: A Review of Mechanical Properties. Annu. Rev. Mater. Res. 2016, 46, 151–186. [Google Scholar] [CrossRef]
  7. Seifi, M.; Salem, A.; Beuth, J.; Harrysson, O.; Lewandowski, J.J. Overview of Materials Qualification Needs for Metal Additive Manufacturing. JOM 2016, 68, 747–764. [Google Scholar] [CrossRef]
  8. Gong, H.; Rafi, K.; Gu, H.; Janaki Ram, G.D.; Starr, T.; Stucker, B. Influence of defects on mechanical properties of Ti-6Al-4V components produced by selective laser melting and electron beam melting. Mater. Des. 2015, 86, 545–554. [Google Scholar] [CrossRef]
  9. Teng, C.; Pal, D.; Gong, H.; Zeng, K.; Briggs, K.; Patil, N.; Stucker, B. A review of defect modeling in laser material processing. Addit. Manuf. 2017, 14, 137–147. [Google Scholar] [CrossRef]
  10. Leuders, S.; Thöne, M.; Riemer, A.; Niendorf, T.; Tröster, T.; Richard, H.A.; Maier, H.J. On the mechanical behaviour of titanium alloy TiAl6V4 manufactured by selective laser melting: Fatigue resistance and crack growth performance. Int. J. Fatigue 2013, 48, 300–307. [Google Scholar] [CrossRef]
  11. Sanaei, N.; Fatemi, A. Analysis of the effect of internal defects on fatigue performance of additive manufactured metals. Mater. Sci. Eng. A 2020, 785, 139385. [Google Scholar] [CrossRef]
  12. Voisin, T.; Calta, N.P.; Khairallah, S.A.; Forien, J.B.; Balogh, L.; Cunningham, R.W.; Rollett, A.D.; Wang, Y.M. Defects-dictated tensile properties of selective laser melted Ti-6Al-4V. Mater. Des. 2018, 158, 113–126. [Google Scholar] [CrossRef]
  13. Becker, T.H.; Dhansay, N.M. Influence of porosity on the fatigue life of laser powder bed fusion–produced Ti6Al4V. Mater. Des. Process. Commun. 2021, 3, 141. [Google Scholar] [CrossRef]
  14. Snow, Z.; Nassar, A.R.; Reutzel, E.W. Invited Review Article: Review of the formation and impact of flaws in powder bed fusion additive manufacturing. Addit. Manuf. 2020, 36, 101457. [Google Scholar] [CrossRef]
  15. Sanaei, N.; Fatemi, A.; Phan, N. Defect characteristics and analysis of their variability in metal L-PBF additive manufacturing. Mater. Des. 2019, 182, 108091. [Google Scholar] [CrossRef]
  16. Molaei, R.; Fatemi, A. Fatigue Design with Additive Manufactured Metals: Issues to Consider and Perspective for Future Research. Procedia Eng. 2018, 213, 5–16. [Google Scholar] [CrossRef]
  17. Mower, T.M.; Long, M.J. Mechanical behavior of additive manufactured, powder-bed laser-fused materials. Mater. Sci. Eng. A 2016, 651, 198–213. [Google Scholar] [CrossRef]
  18. Andreau, O.; Pessard, E.; Koutiri, I.; Penot, J.D.; Dupuy, C.; Saintier, N.; Peyre, P. A competition between the contour and hatching zones on the high cycle fatigue behaviour of a 316L stainless steel: Analyzed using X-ray computed tomography. Mater. Sci. Eng. A 2019, 757, 146–159. [Google Scholar] [CrossRef]
  19. Macallister, N.; Becker, T.H. Fatigue life estimation of additively manufactured Ti-6Al-4V: Sensitivity, scatter and defect description in Damage-tolerant models. Acta Mater. 2022, 237, 118189. [Google Scholar] [CrossRef]
  20. Sanaei, N.; Fatemi, A. Defect-based fatigue life prediction of L-PBF additive manufactured metals. Eng. Fract. Mech. 2021, 244, 107541. [Google Scholar] [CrossRef]
  21. Du Plessis, A.; Yadroitsava, I.; Yadroitsev, I. Effects of defects on mechanical properties in metal additive manufacturing: A review focusing on X-ray tomography insights. Mater. Des. 2020, 187, 108385. [Google Scholar] [CrossRef]
  22. Letenneur, M.; Kreitcberg, A.; Brailovski, V. Optimization of Laser Powder Bed Fusion Processing Using a Combination of Melt Pool Modeling and Design of Experiment Approaches: Density Control. J. Manuf. Mater. Process. 2019, 3, 21. [Google Scholar] [CrossRef]
  23. Zhang, B.; Seede, R.; Xue, L.; Atli, K.C.; Zhang, C.; Whitt, A.; Karaman, I.; Arroyave, R.; Elwany, A. An efficient framework for printability assessment in Laser Powder Bed Fusion metal additive manufacturing. Addit. Manuf. 2021, 46, 102018. [Google Scholar] [CrossRef]
  24. Psihoyos, H.O.; Lampeas, G.N. Density-Based Optimization of the Laser Powder Bed Fusion Process Based on a Modelling Framework. Alloys 2023, 2, 4. [Google Scholar] [CrossRef]
  25. Fergani, O.; Bratli Wold, A.; Berto, F.; Brotan, V.; Bambach, M. Study of the effect of heat treatment on fatigue crack growth behaviour of 316L stainless steel produced by selective laser melting. Fatigue Fract. Eng. Mater. Struct. 2018, 41, 1102–1119. [Google Scholar] [CrossRef]
  26. Masuo, H.; Tanaka, Y.; Morokoshi, S.; Yagura, H.; Uchida, T.; Yamamoto, Y.; Murakami, Y. Effects of Defects, Surface Roughness and HIP on Fatigue Strength of Ti-6Al-4V manufactured by Additive Manufacturing. Proc. Str. Int. 2017, 7, 19–26. [Google Scholar] [CrossRef]
  27. Moran, T.P.; Carrion, P.E.; Lee, S.; Shamsaei, N.; Phan, N.; Warner, D.H. Hot Isostatic Pressing for Fatigue Critical Additively Manufactured Ti-6Al-4V. Materials 2022, 15, 2051. [Google Scholar] [CrossRef]
  28. Tang, W.; Tang, Z.; Lu, W.; Wang, S.; Yi, M. Modeling and Prediction of Fatigue Properties of Additively Manufactured Metals. Acta Mech. Solida Sin. 2023, 36, 181–213. [Google Scholar] [CrossRef]
  29. Le, V.D.; Pessard, E.; Morel, F.; Edy, F. Interpretation of the fatigue anisotropy of additively manufactured TA6V alloys via a fracture mechanics approach. Eng. Fract. Mech. 2019, 214, 410–426. [Google Scholar] [CrossRef]
  30. Long, X.; Guo, Y.; Su, Y.; Siow, K.S.; Chen, C. Unveiling the damage evolution of SAC305 during fatigue by entropy generation. Int. J. Mech. Sci. 2023, 244, 108087. [Google Scholar] [CrossRef]
  31. Wan, H.; Wang, Q.; Jia, C.; Zhang, Z. Multi-scale damage mechanics method for fatigue life prediction of additive manufacture structures of Ti-6Al-4V. Mater. Sci. Eng. A 2016, 669, 269–278. [Google Scholar] [CrossRef]
  32. Li, X.K.; Zhu, S.P.; Liao, D.; Correia, J.A.F.O.; Berto, F.; Wang, Q. Probabilistic fatigue modelling of metallic materials under notch and size effect using the weakest link theory. Int. J. Fatigue 2022, 159, 106788. [Google Scholar] [CrossRef]
  33. Niu, X.; Zhu, S.P.; He, J.C.; Liao, D.; Correia, J.A.F.O.; Berto, F.; Wang, Q. Defect tolerant fatigue assessment of AM materials: Size effect and probabilistic prospects. Int. J. Fatigue 2022, 160, 106884. [Google Scholar] [CrossRef]
  34. Bergant, M.; Werner, T.; Madia, M.; Yawny, A.; Zerbst, U. Short crack propagation analysis and fatigue strength assessment of additively manufactured materials: An application to AISI 316L. Int. J. Fatigue 2021, 151, 106396. [Google Scholar] [CrossRef]
  35. Zerbst, U.; Madia, M.; Vormwald, M. Applying fracture mechanics to fatigue strength determination–Some basic considerations. Int. J. Fatigue 2019, 126, 188–201. [Google Scholar] [CrossRef]
  36. Du Plessis, A.; Le Roux, S.G.; Booysen, G.; Els, J. Quality Control of a Laser Additive Manufactured Medical Implant by X-Ray Tomography. 3D Print. Addit. Manuf. 2016, 3, 175–182. [Google Scholar] [CrossRef]
  37. Du Plessis, A.; Yadroitsev, I.; Yadroitsava, I.; Le Roux, S.G. X-ray Microcomputed Tomography in Additive Manufacturing: A Review of the Current Technology and Applications. 3D Print. Addit. Manuf. 2018, 5, 227–247. [Google Scholar] [CrossRef]
  38. Moran, T.P.; Warner, D.H.; Soltani-Tehrani, A.; Shamsaei, N.; Phan, N. Spatial inhomogeneity of build defects across the build plate in laser powder bed fusion. Addit. Manuf. 2021, 47, 102333. [Google Scholar] [CrossRef]
  39. Romano, S.; Abel, A.; Gumpinger, J.; Brandão, A.D.; Beretta, S. Quality control of AlSi10Mg produced by SLM: Metallography versus CT scans for critical defect size assessment. Addit. Manuf. 2019, 28, 394–405. [Google Scholar] [CrossRef]
  40. Romano, S.; Brandão, A.; Gumpinger, J.; Gschweitl, M.; Beretta, S. Qualification of AM parts: Extreme value statistics applied to tomographic measurements. Mater. Des. 2017, 131, 32–48. [Google Scholar] [CrossRef]
  41. Moran, T.P.; Warner, D.H.; Phan, N. Scan-by-scan part-scale thermal modelling for defect prediction in metal additive manufacturing. Addit. Manuf. 2021, 37, 101667. [Google Scholar] [CrossRef]
  42. Tang, M.; Pistorius, P.C.; Beuth, J.L. Prediction of lack-of-fusion porosity for powder bed fusion. Addit. Manuf. 2017, 14, 39–48. [Google Scholar] [CrossRef]
  43. Riemer, A.; Leuders, S.; Thöne, M.; Richard, H.A.; Tröster, T.; Niendorf, T. On the fatigue crack growth behavior in 316L stainless steel manufactured by selective laser melting. Eng. Fract. Mech. 2014, 120, 15–25. [Google Scholar] [CrossRef]
  44. Sandgren, H.R.; Zhai, Y.; Lados, D.A.; Shade, P.A.; Schuren, J.C.; Groeber, M.A.; Kenesei, P.; Gavras, A.G. Characterization of fatigue crack growth behavior in LENS fabricated Ti-6Al-4V using high-energy synchrotron x-ray microtomography. Addit. Manuf. 2016, 12, 132–141. [Google Scholar] [CrossRef]
  45. Zhai, Y.; Lados, D.A.; Brown, E.J.; Vigilante, G.N. Fatigue crack growth behavior and microstructural mechanisms in Ti-6Al-4V manufactured by laser engineered net shaping. Int. J. Fatigue 2016, 93, 51–63. [Google Scholar] [CrossRef]
  46. Gupta, A.; Sun, W.; Bennett, C.J. Simulation of fatigue small crack growth in additive manufactured Ti–6Al–4V material. Contin. Mech. Thermodyn. 2020, 32, 1745–1761. [Google Scholar] [CrossRef]
  47. Iliopoulos, A.; Jones, R.; Michopoulos, J.; Phan, N.; Singh Raman, R. Crack Growth in a Range of Additively Manufactured Aerospace Structural Materials. Aerospace 2018, 5, 118. [Google Scholar] [CrossRef]
  48. Jones, R.; Michopoulos, J.G.; Iliopoulos, A.P.; Singh Raman, R.K.; Phan, N.; Nguyen, T. Representing crack growth in additively manufactured Ti-6Al-4V. Int. J. Fatigue 2018, 116, 610–622. [Google Scholar] [CrossRef]
  49. Lammens, N.; Gallego-Bordallo, F.; Ni, J.; Zinoviev, A.; de Weer, T.; Erdelyi, H. The role of simulation in the industrialization of Additive Manufacturing. Procedia Struct. Integr. 2021, 34, 247–252. [Google Scholar] [CrossRef]
  50. Du, L.; Qian, G.; Zheng, L.; Hong, Y. Influence of processing parameters of selective laser melting on high-cycle and very-high-cycle fatigue behaviour of Ti-6Al-4V. Fatigue Fract. Eng. Mater. Struct. 2021, 44, 240–256. [Google Scholar] [CrossRef]
  51. Solberg, K.; Guan, S.; Razavi, S.M.J.; Welo, T.; Chan, K.C.; Berto, F. Fatigue of additively manufactured 316L stainless steel: The influence of porosity and surface roughness. Fatigue Fract. Eng. Mater. Struct. 2019, 42, 2043–2052. [Google Scholar] [CrossRef]
  52. Ansys Additive User’s Guide (Print and Science) 2020 R2; Ansys Inc.: Canonsburg, PA, USA, 2020.
  53. Yang, J.; Han, J.; Yu, H.; Yin, J.; Gao, M.; Wang, Z.; Zeng, X. Role of molten pool mode on formability, microstructure and mechanical properties of selective laser melted Ti-6Al-4V alloy. Mater. Des. 2016, 110, 558–570. [Google Scholar] [CrossRef]
  54. Dilip, J.J.S.; Zhang, S.; Teng, C.; Zeng, K.; Robinson, C.; Pal, D.; Stucker, B. Influence of processing parameters on the evolution of melt pool, porosity, and microstructures in Ti-6Al-4V alloy parts fabricated by selective laser melting. Prog. Addit. Manuf. 2017, 2, 157–167. [Google Scholar] [CrossRef]
  55. Sabzi, H.E.; Rivera-Díaz-del-Castillo, P.E.J. Defect Prevention in Selective Laser Melting Components: Compositional and Process Effects. Material 2019, 12, 3791. [Google Scholar] [CrossRef]
  56. Sanaei, N.; Fatemi, A. Defects in Additive Manufactured Metals and Their Effect on Fatigue Performance: A State-of-the-Art Review. Prog. Mater. Sci. 2020, 117, 100724. [Google Scholar] [CrossRef]
  57. Cunningham, R.; Zhao, C.; Parab, N.; Kantzos, C.; Pauza, J.; Fezzaa, K.; Sun, T.; Rollett, A.D. Keyhole threshold and morphology in laser melting revealed by ultrahigh-speed x-ray imaging. Science 2019, 363, 849–852. [Google Scholar] [CrossRef]
  58. Gordon, J.V.; Narra, S.P.; Cunningham, R.W.; Liu, H.; Chen, H.; Suter, R.M.; Beuth, J.L.; Rollett, A.D. Defect structure process maps for laser powder bed fusion additive manufacturing. Addit. Manuf. 2020, 36, 101552. [Google Scholar] [CrossRef]
  59. Romano, S.; Brückner-Foit, A.; Brandão, A.; Gumpinger, J.; Ghidini, T.; Beretta, S. Fatigue properties of AlSi10Mg obtained by additive manufacturing: Defect-based modelling and prediction of fatigue strength. Eng. Fract. Mech. 2018, 187, 165–189. [Google Scholar] [CrossRef]
  60. Tammas-Williams, S.; Withers, P.J.; Todd, I.; Prangnell, P.B. The Influence of Porosity on Fatigue Crack Initiation in Additively Manufactured Titanium Components. Sci. Rep. 2017, 7, 7308. [Google Scholar] [CrossRef]
  61. Yadollahi, A.; Mahtabi, M.J.; Khalili, A.; Doude, H.R.; Newman, J.C. Fatigue life prediction of additively manufactured material: Effects of surface roughness, defect size, and shape. Fatigue Fract. Eng. Mater. Struct. 2018, 41, 1602–1614. [Google Scholar] [CrossRef]
  62. Zerbst, U.; Bruno, G.; Buffière, J.Y.; Wegener, T.; Niendorf, T.; Wu, T.; Zhang, X.; Kashaev, N.; Meneghetti, G.; Hrabe, N.; et al. Damage tolerant design of additively manufactured metallic components subjected to cyclic loading: State of the art and challenges. Prog. Mater. Sci. 2021, 121, 100786. [Google Scholar] [CrossRef] [PubMed]
  63. Nudelis, N.; Mayr, P. A Novel Classification Method for Pores in Laser Powder Bed Fusion. Metals 2021, 11, 1912. [Google Scholar] [CrossRef]
  64. Harter, J.A. AFGROW Users Guide and Technical Manual Version 5.03.05.24; LexTech: Centerville, OH, USA, 2020. [Google Scholar]
  65. Harter, J.A. Comparison of contemporary FCG life prediction tools. Int. J. Fatigue 1999, 21, S181–S185. [Google Scholar] [CrossRef]
  66. Yang, L.; Yan, C.; Cao, W.; Liu, Z.; Song, B.; Wen, S.; Zhang, C.; Shi, Y.; Yang, S. Compression–compression fatigue behaviour of gyroid-type triply periodic minimal surface porous structures fabricated by selective laser melting. Acta Mater. 2019, 181, 49–66. [Google Scholar] [CrossRef]
  67. Zargarian, A.; Esfahanian, M.; Kadkhodapour, J.; Ziaei-Rad, S. Numerical simulation of the fatigue behavior of additive manufactured titanium porous lattice structures. Mater. Sci. Eng. C 2016, 60, 339–347. [Google Scholar] [CrossRef] [PubMed]
  68. Zhou, H.; Liu, Z.; Kinefuchi, M.; Shibanuma, K. Multiscale modelling strategy for predicting fatigue lives and limits of steels based on a generalised evaluation method of grain boundaries effects. Int. J. Fatigue 2022, 158, 106749. [Google Scholar] [CrossRef]
  69. Li, K.S.; Gu, L.H.; Wang, X.R.; Wang, J.; Wang, R.Z.; Gu, H.H.; Zhang, X.C.; Tu, S.T. A unified rule for high-cycle and low-cycle fatigue life prediction in multi-scale framework. Int. J. Fatigue 2023, 170, 107512. [Google Scholar] [CrossRef]
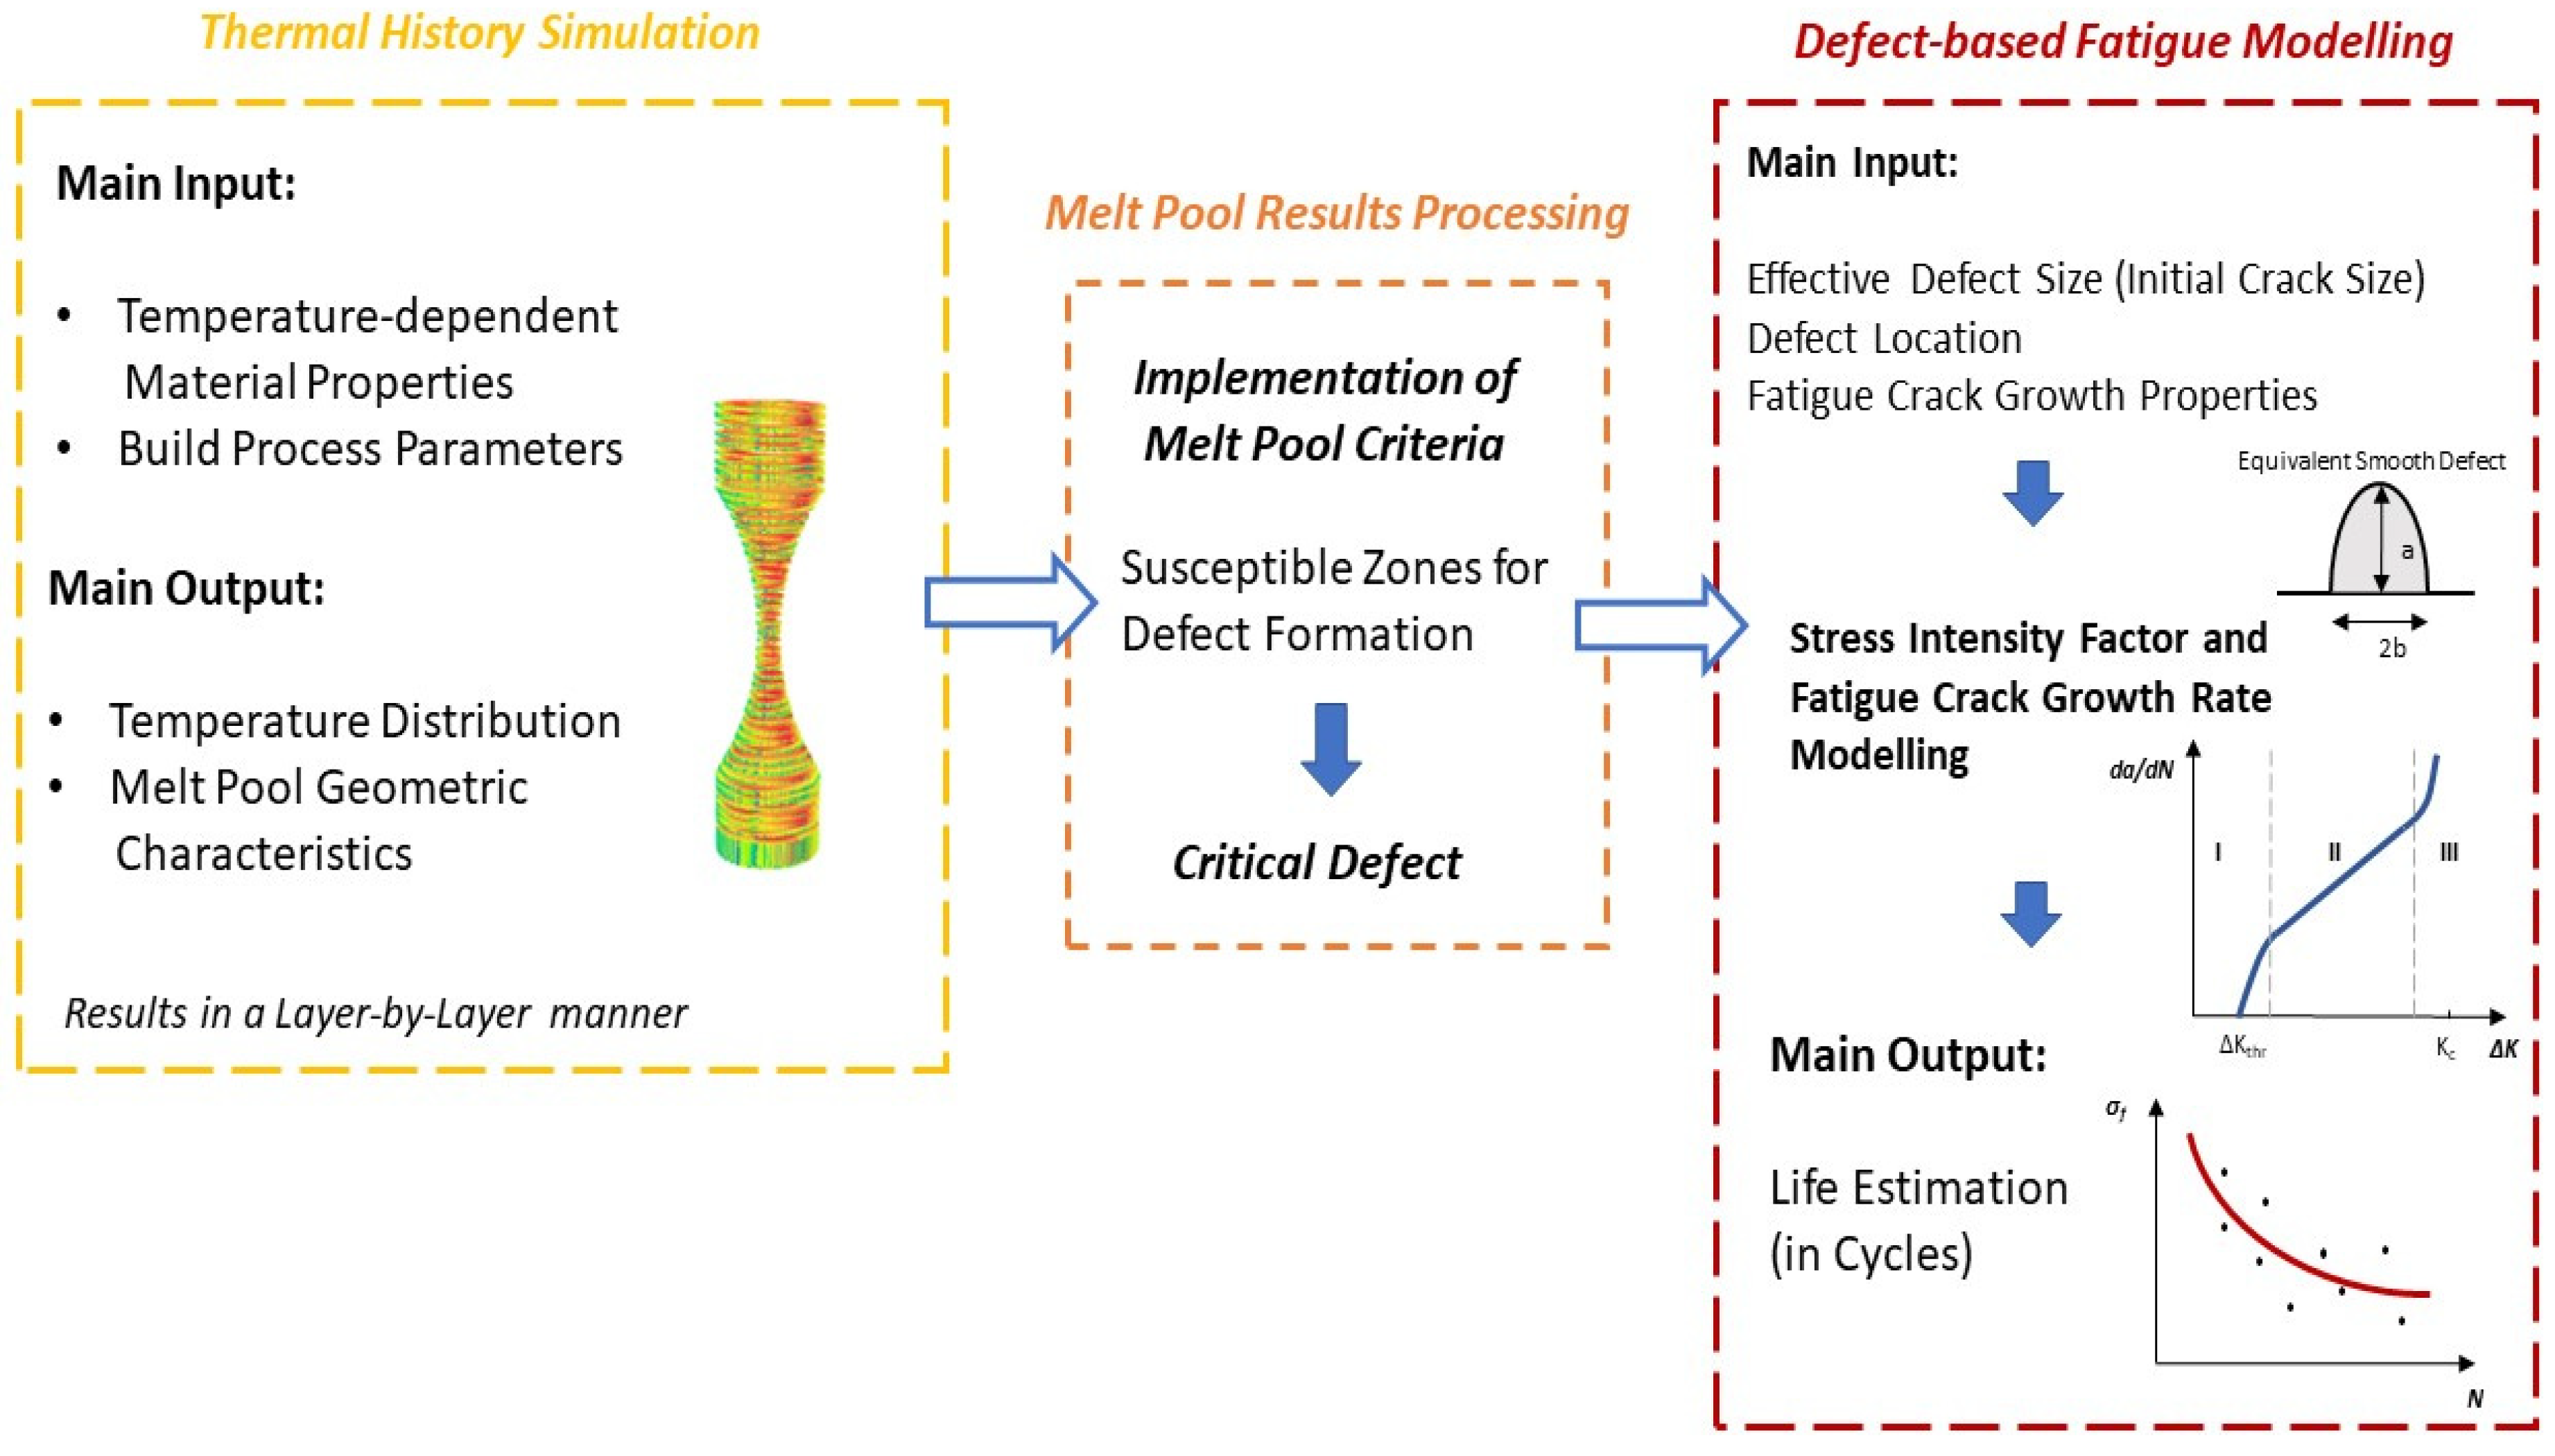
Figure 1. Outline of the damage-tolerant framework for fatigue analysis.
Metals 13 01005 g001
Figure 2. Experimental fatigue measurements of L-PBF (a) Ti-6Al-4V and (b) 316L SS metals (data from Refs. [50,51]).
Metals 13 01005 g002aMetals 13 01005 g002b
Figure 3. Geometry and dimensions of L-PBF (a) Ti-6Al-4V and (b) 316L SS fatigue specimens.
Metals 13 01005 g003
Figure 4. Definition of the effective area of an irregular shape (a) internal and (b) near-surface defect.
Metals 13 01005 g004
Figure 5. Small FCG properties of specimens built in vertical direction (VD) and heat-treated (HT) LENS Ti-6Al-4V for R = 0.1 and 0.8 (data from Ref. [45]).
Metals 13 01005 g005
Figure 6. FCG properties of specimens built in the vertical direction (VD) and heat-treated (HT)/as-built (AB) L-PBF 316L SS for R = 0.1 (data from Ref. [25]).
Metals 13 01005 g006
Figure 7. The distribution of the predicted defect locations in the layer at the middle of Ti-6Al-4V fatigue specimens fabricated with process parameters of: (a) Group 3, (b) Group 4 and (c) Group 10.
Metals 13 01005 g007
Figure 8. The distribution of the predicted defect locations in the layer at the middle of the 316L SS fatigue specimen.
Metals 13 01005 g008
Figure 9. Crack geometry considered for the defect-based fatigue modeling.
Metals 13 01005 g009
Figure 10. Comparison between experimental data (data from Ref. [50]) and fatigue life prediction results of L-PBF Ti-6Al-4V fabricated for (a) Group 3, (b) Group 4 and (c) Group 10 of process parameters.
Metals 13 01005 g010aMetals 13 01005 g010b
Figure 11. Comparison between experimental data (data from Ref. [51]) and fatigue life prediction results of L-PBF 316L SS.
Metals 13 01005 g011
Table 1. Process parameters, relative densities and tensile properties of the specimen groups of Ti-6Al-4V (data from Ref. [50]).
GroupP (W)t (μm)v (mm⋅s−1)h (mm)RD (%)σy (MPa)σu (MPa)
3120608000.138.03 ± 1.29514 ± 30514 ± 30
41603010000.131.20 ± 0.101135 ± 25198 ± 5
101603010000.070.20 ± 0.051045 ± 51200 ± 10
Note: P: laser power, t: layer thickness, v: scanning speed, h: hatching distance, RD: relative density, σy: yield strength, σu: ultimate strength.
Table 2. Process parameters and tensile properties of the specimen of 316L SS (data from Ref. [51]).
P (W)t (μm)v (mm⋅s−1)h (mm)σy (MPa)σu (MPa)
3205024000.10405437
Note: P: laser power, t: layer thickness, v: scanning speed, h: hatching distance, σy: yield strength, σu: ultimate strength.
Table 3. Mechanical properties of L-PBF Ti-6Al-4V and 316L SS metals used in the analysis.
Mechanical Properties Values
Ti-6Al-4V (Data From Refs. [45,50])316L SS (Data From Refs. [25,51])
ΔKthrKth (MPa√m)2.52.9
KIc (MPa√m)42202
σu (MPa)1198437
σy (MPa)1135409
E (GPa)110160
Table 4. Range of initial defect sizes considered for the fatigue modeling.
Group RD, Porosity (%)Initial Defect Size (μm)
Exp. DeterminedMin. Max.
38.03 ± 1.29-260350
41.20 ± 0.10120100180
100.20 ± 0.055050100
Disclaimer/Publisher’s Note: The statements, opinions and data contained in all publications are solely those of the individual author(s) and contributor(s) and not of MDPI and/or the editor(s). MDPI and/or the editor(s) disclaim responsibility for any injury to people or property resulting from any ideas, methods, instructions or products referred to in the content.