Abstract
Laser powder–bed fusion (L-PBF) metal additive manufacturing has been widely utilized in various industries. However, large variability and inconsistent quality of the built parts still hinder the full potential of this manufacturing technology. Regarding part quality, the poor surface finish of sloping features remains one of the major shortcomings of L-PBF. The process parameters and contouring strategies have been identified as the primary factors dictating the surface roughness of the inclined surfaces, both up-skin and down-skin. Experimental approaches to modify the surface roughness by tuning contouring parameters could be costly and time-consuming. In addition, such methods cannot provide adequate physical insights into the phenomenon. Therefore, this study presents a multi-physics modeling framework to simulate a multi-track multi-layer L-PBF process in fabricating an inclined sample. The established simulation provides a valuable physical understanding of the driving forces exacerbating the formation and roughness of the inclined surfaces. The simulation results imply that the voids, formed due to insufficient melting in the low-energy contouring scan, are the leading cause of higher surface roughness for up-skin regions. On the other hand, though the visualization of attached particles is challenging regarding the down-skin surface, the simulated results show a lower and abnormal thermal gradient at the melt boundary due to the poorly supported melt region. The presence of thermal gradient irregularities suggests an overabundance of powder particles adhering to the melt boundary, resulting in increased surface roughness on the down-skin.
1. Introduction
Metal Additive Manufacturing (AM) technology is transforming the way functional components are made with its ability to fabricate highly complex geometries that are impossible to achieve with conventional manufacturing techniques [1]. The Laser Powder–Bed Fusion (L-PBF) process is widely considered the most promising AM technique in many areas, such as the automobile, aerospace, and biomedical industries [2]. In addition, due to the selective manner of melting and solidifying materials, the microstructural and mechanical properties of fabricated components significantly differ from those of parts produced by conventional methods [3]. Hence, microstructural and mechanical properties can be tailored by optimizing the process parameters such as the laser power, the scanning speed, the powder layer thickness, etc. [4]. Despite the substantial advantages of the technology, poor repeatability, high instability, and low consistency of the built parts’ quality still prevent the implementation of L-PBF in producing mission-critical components [5]. Unlike part density, which currently can be achieved up to 99.95% via adjusting the process parameters such as the laser power and scanning speed [6], the surface quality of the built parts, especially inclined parts, remains one of the biggest obstacles in the L-PBF process [7]. Low surface quality is the primary contributor to the undesirable fatigue performance of the fabricated components [8].
The inclined sample is one of the best examples to demonstrate the complexity of the surface quality issue in the L-PBF process. Both up-facing (up-skin) surfaces and down-facing (down-skin) surfaces suffer from a much lower surface finish compared to the in-skin surface [9]. Different factors contribute to the poor surface finish for up- and down-skin surfaces and have distinctive mechanisms [9]. For an up-facing surface, the shape of the step edges and the number of attached powder particles on those edges dictate the surface quality [10]. Meanwhile, in the case of the down-skin surface, since powder particles mainly support the scanning area, adhered particles at the melt pool boundary play a vital role in determining the surface finish. In addition, the low thermal conductivity of the surrounding powders leads to an inadequate thermal dissipation of the melt pool, resulting in an enlarged melt pool size. The larger melt pool attaches more powder particles to its boundary while solidifying, exacerbating the surface roughness [11].
Both built parts’ geometry and scanning variables have been identified as playing a vital role in determining the surface quality of inclined surfaces. Reported empirical data suggests that the inclination angle significantly influences the inclined surface quality [12]. Regarding the process variables, contouring scan process parameters such as laser power, scanning speeds, and contouring offsets have been identified as playing an essential role in the surface roughness of the inclined surfaces [10]. In addition, contouring strategies such as pre-contour and post-contour also contribute to the inclined surface roughness of the built parts [13]. Although numerous efforts have been made to investigate the effects of contouring scans on the inclined surface formation, a more common approach is still the standard trial-and-error experimental method. Such a method is highly time-consuming, resource-consuming, and unable to provide the physical insights driving the phenomena [14]. Besides empirical techniques, computational approaches have been proven to have an essential and irreplaceable role in understanding, controlling, and optimizing the L-PBF process [15]. With data visualization tools, numerical simulations can provide process information that cannot be achieved by both in-situ and ex-situ analysis of the experimental samples [16]. Numerical models can significantly decrease the number of required experiments; the simulation-guided experiment is much more efficient than the standard trial-and-error methods [17].
Recently, numerical efforts have been reported to investigate or optimize the surface formation of the inclined surface produced by L-PBF. Lin et al. [18] utilized COMSOL (COMSOL, Inc., Burlington, MA, USA) to develop a simplified pure-thermal model that neglects the fluid dynamics inside the melt pool to examine the melt pool temperature distribution abnormalities at the melt pool down-skin location. Chen et al. [12] used ANSYS Fluent (ANSYS Inc., Austin, TX, USA) to construct a melt pool model at the overhang region that considered the fluid flow inside the melt pool. Both models mentioned above were designed using the effective medium approach. Although the effective medium method brings considerable advantages in computational time and resources, the accuracy of the simulated results is limited due to the neglect of essential physics, such as free surface movement, laser multi-reflection, and recoil pressure. The powder bed and the solid substrate are treated as fixed solid blocks with effective material properties [15]. Therefore, the movement of the free surface between the solid phase and the liquid phase during the melting and solidifying process cannot be conveyed. As computational hardware and software advance, highly comprehensive models that can simulate the motion of the solid–liquid interface were introduced [19]. Such models pave the way for researchers to include and study more complex physical phenomena during the L-PBF process, such as the recoil pressure and the laser multi-reflection inside the keyhole [20]. Using OpenFOAM and LIGGGHTS, Le et al. [11] constructed a high-fidelity thermal fluid model to study the melt track formation of a single-track scan in different overhanging situations. The simulation results indicated that the inconsistency of the melt track is mainly caused by the poorly supported scanning area, which is partially or entirely covered by powder particles [11]. Feng et al. [21] used Flow3D to study the melt pool formation of the contouring scans on a single layer at different inclination angles. A dual contour scan track is cross-sectioned to realize the adhered powder particles at the down-skin surface, and the two-dimensional melt pool cross-sections are then stacked on top of each other in a sloping manner [21]. Ren et al. [13] built a thermal fluid model to elaborate on the differences in the melt track formation between post-contour and pre-contour scans. Similar to the models introduced by Feng et al. [21] and Le et al. [11], the simulation designed in [13] was conducted on a single layer. Therefore, the overhang setup was achieved by scanning the track on or along a wedge [21], a solid block [11], or on a step [13]. The most significant advantage of this type of setup is eliminating the need for a highly time-consuming and complicated multi-layer simulation. However, since the morphology of the previous scanning area plays an essential role in forming the next scanned layer, neglecting the multi-layer setup deviates the simulation far from real-life processing conditions.
The objective of this study is to develop a multi-track multi-layer numerical simulation to investigate the effects of various contouring parameters on the inclined surfaces of a sloped sample in L-PBF. The proposed simulation model is a powerful tool to study the physical phenomena driving the surface roughness of the sloped sample. For the contouring scans, three different levels of linear energy density (LED = Power/Speed) were investigated while the process parameters of the raster scans were kept constant. The Discrete Element Method (DEM) was deployed to introduce powder layers, and the Volume of Fluid (VOF) method was utilized to model the laser–matter interactions. Although the computation expense and resources required for a multi-layer L-PBF process simulation are tremendous, the simulation can account for the morphology of the previous layer when simulating the current layer in the DEM and CFD stages. To the best of our knowledge, this is the first attempt to use a multi-track multi-layer model to simulate the L-PBF process of inclined samples.
2. Multi-Track Multi-Layer Numerical Simulation of a Sloped Sample in L-PBF
The multi-track multi-layer simulation framework consisted of the Discrete Element Method (DEM) stage and the thermo-fluid simulation stage, as described in previous studies [22,23]. The DEM stage was primarily concerned with analyzing the powder spreading, powder particle dynamics, and powder–solid interactions, while the thermo-fluid simulation was responsible for simulating the laser–matter interaction to facilitate the melting and solidification of materials during laser irradiation. Both stages relied exclusively on the stereolithography (STL) file format for input and output. Specifically, the deposited powder layer in the STL file was imported into the thermo-fluid model for melting and solidification simulation, while the solidified irradiated surface was exported as an STL file for powder recoating in the DEM stage. This process was iterated repeatedly until the desired number of layers was achieved. Figure 1 illustrates the multi-track multi-layer simulation framework used in this study.
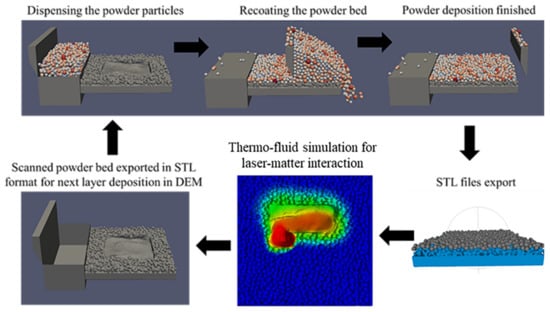
Figure 1.
Multi-track multi-layer numerical simulation framework.
The exported STL file of the powder bed obtained from the Flow3D scan presents certain limitations in removing the unmelted powder particles surrounding the scanned area. Consequently, in the discrete element method (DEM) simulation of the subsequent layer, the unmelted particles, the scanned region, and the solid substrate are considered a single solid entity. This approach is followed sequentially as the layers progress, accumulating unmelted powder particles around the built object. Regrettably, these unmelted particles pose a significant obstacle to the direct visualization of the up-skin and down-skin surfaces, thereby precluding a quantitative evaluation of their roughness. As a result, the assessment of the roughness of these inclined surfaces remains a challenge at present. Further research is warranted to explore alternative methods to overcome this obstacle and facilitate the accurate prediction of simulated surface roughness in the powder–bed fusion processes.
2.1. Discrete Element Method (DEM) Simulation for Power Deposition
For DEM simulation, LIGGGHTS, an open-source code, was deployed to simulate the deposition and spreading of powder particles. The Hertz-Mindlin (non-slip) contact model is utilized in the DEM simulation to account for particle collisions and the resulting momentum transfer. The contact model uses Hertz contact theory to determine the normal force () and tangential force () between particles [24]. The positions of all particles in the computational domain are updated by calculating their trajectories. The momentum conservation of a single particle during a collision with another particle is illustrated as follows [22,23].
In Equation (1), the normal force is denoted as , while represents the tangential force and represents any body force acting on the particle (e.g., gravitational force). In Equation (2), is included to address the torque induced by the tangential force, and an extra torque is applied to the particle to account for non-sphericity resulting from rolling friction. A detailed explanation and complete derivation of the contact model can be found in Ref. [25]. Our previous work [23] provides information on the material properties of the Ti6Al4V powder that was simulated during the DEM and the thermo-fluid stages. The High-Performance Computing cluster at the University of Louisville (Cardinal Research Cluster) was used to conduct the DEM simulations for this study. As the layer advances, an extension of the computational size in the sloping direction becomes necessary, resulting in a longer computation time. Nonetheless, for identical numbers of layers, the simulation time for the Discrete Element Method (DEM) remains consistent across all cases. Table 1 displays the actual simulation times for DEM in all cases for layers #1, #8, and #14.

Table 1.
Computational time (hours) of all cases at Layers #1, #8, and #14.
2.2. Thermo-Fluid Simulation for Laser-Matter Interactions
The VOF (Volume of Fluid) method is utilized to track the interface between two fluid phases. The commercial software Flow-3D (version 12, Flow Science, Inc., Santa Fe, NM, USA) is used to solve laser irradiation, laser–matter interaction, melting/solidification, and the flow of molten material. The fundamental conservation equations for mass, energy, and momentum are presented below [26,27].
The fluid density is represented by , denotes physical time, and is the fluid velocity. Additionally, signifies the pressure of the working fluid, represents the stress tensor, and is the gravitational force. represents the enthalpy of the material, denotes the thermal conductivity, denotes the momentum source, and is the heat source. A combination of the ray-tracing method and geometry-dependent absorptivity is used to model laser irradiation. The two-dimensional Gaussian laser heat flux is represented by Equation (6) [28], while the Fresnel equation describes the multiple reflections phenomenon between the laser and the materials in Equations (7) and (8) [29].
The incidence angle between the incoming laser ray and the material surface normal is represented by , while the dielectric constants are denoted by and , with being the vacuum permittivity. The electrical conductance per unit depth is represented by and the angular frequency of the laser is [23]. The formation of the melt pool is predominantly influenced by surface forces caused by the Marangoni convection and the recoil pressure arising from evaporation [15]. According to the following equation, the current numerical model formulates the recoil pressure due to evaporation [30].
The equation for the recoil pressure due to evaporation (Equation (9)) involves various parameters, including the working chamber pressure , the specific enthalpy of the metal vapor , the evaporation temperature , the fluid temperature , and the universal gas constant R. The surface tension force that acts on the molten material is described by Equation (10) [14].
In Equation (10), the surface tension force acting on the working fluid is denoted by , where represents the surface tension at melting temperature. The surface tension gradient is given by , and is the temperature difference. The material properties of Ti6Al4V are simulated in the thermo-fluid stage, with thermal conductivity, density, and specific heat being treated as functions of temperature. Other constant material properties can be found in Table 2.

Table 2.
Ti6Al4V material properties in the thermo-fluid simulation [31,32,33,34,35].
In the thermo-fluid simulation, the numerical domain is discretized using 5 µm hexahedral elements. The flow of the molten material is modeled as a Newtonian, viscous, incompressible, and laminar flow, while the inert gas flow within the processing chamber is not explicitly covered due to computational limitations and complexity. Nonetheless, the pressure and cooling effects resulting from forced convection on the free surface of the working fluid are implicitly considered. The simulations were performed on a local workstation with a single Intel Xeon processor (E5-2695 v4, 2.1 GHz, 36 CPUs). The computational time is subject to considerable variation based on the layer number and the scanning speed. With increasing layer numbers, the computational domain grows in both the build direction (Z-direction) and the sloping direction (Y-direction). As a result, the computational time increases substantially when the layer progresses. Table 1 presents the actual simulation times for layers #1, #8, and #14 across all three cases.
The process of creating one layer consists of both raster and contour scans. The raster scans involve five bi-directional scans with a hatching space of 100 µm and a scan length of 400 µm, with the direction rotated by 90° for every layer. The process parameters for the raster scans are fixed with a laser power (P) of 170 W, scanning speed (V) of 1250 mm/s, inclination angle () of 30°, and powder layer thickness of 30 µm, resulting in an inter-layer shift of approximately 52 µm towards the inclination direction for each layer. To investigate the impact of the linear energy density (LED = Power/Speed) of the contour scans on the formation of the bordering melt region of the inclined surfaces, the proposed thermo-fluid model was used to simulate three LED levels, with contouring offsets of 5 µm, 15 µm, and 20 µm for all cases, as presented in Table 3. A post-contouring strategy is also employed, as shown in Figure 2. The initial temperature of the computational domain is 308 K [23].

Table 3.
Ti6Al4V material properties in the thermo-fluid simulation.
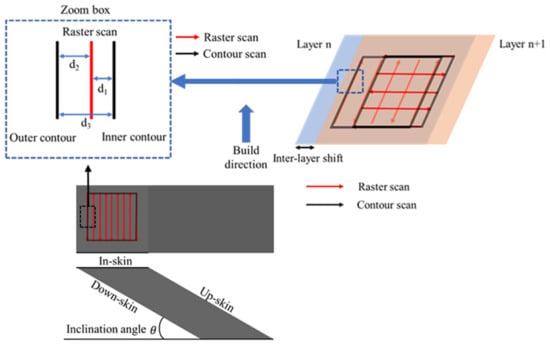
Figure 2.
Raster scan, contouring strategies, and sample schematic used in the simulation.
3. Simulation Results
3.1. Model Validation
The accuracy of the multi-track multi-layer simulation was validated using simulation results obtained from a single-track scan. The simulated dimensions of the melt pool, including its width and depth, were compared with published experimental data. In the single-track scan, a laser power of 170 W and a scanning speed of 1250 mm/s were used. Figure 3 shows the top view and cross-sections of the simulated single-track scan. As reported by Cunningham et al. [36], for Ti6Al4V, empirical observations indicate that the melt pool depth and depth/width ratio can be interpolated for similar laser power and scanning speeds, yielding approximately 100 µm and 0.92, respectively. The simulated melt pool has a depth of 95 µm and a width of 110 µm. These dimensions closely match the experimental data reported by Cunningham et al. [36]. Figure 3 shows that the melt pool depth stabilizes at 150 µm, indicating that a scan length of 400 µm is adequate.
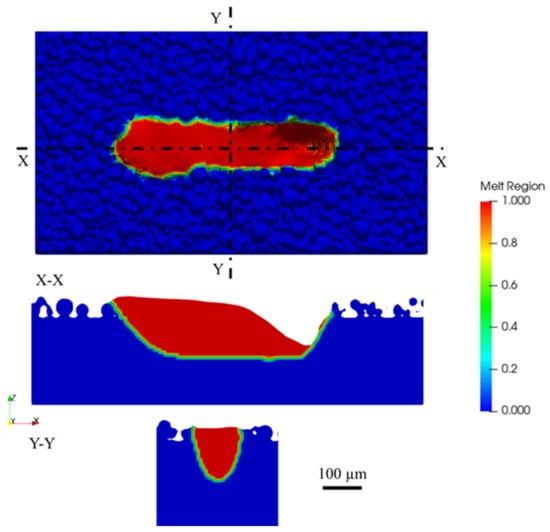
Figure 3.
Cross-section results in the X- and Y-Y-direction of the single-track scan.
To ensure a fair comparison of the different LEDs, the process parameters of the raster scans were kept similar across all three cases. As a result, no significant differences in the melt pool dimensions of the raster region were observed either between the cases or between the layers within each case. Figure 4 presents the simulated melt region for the raster scans of the Low-LED case at layer #10. As seen in Figure 4, the raster area dimensions are approximately 466 μm 498 μm. In addition, a lateral cross-section (X-X cross-section in Figure 4) indicates that the melt pool depth reaches a steady state at approximately 133 µm after the second raster scan. Hence, the choice of 5 raster scans is sufficient for the area scan to reach a steady state. Figure 5 demonstrates an example of simulation results at different time steps (showing the evolution of melt surface morphology) during the first layer deposition from a Mid-LED case.
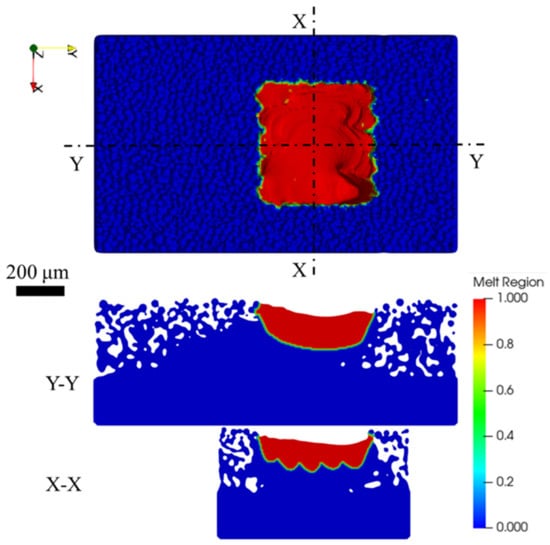
Figure 4.
Simulated melt region of the raster scans of the Low-LED case at layer #10.
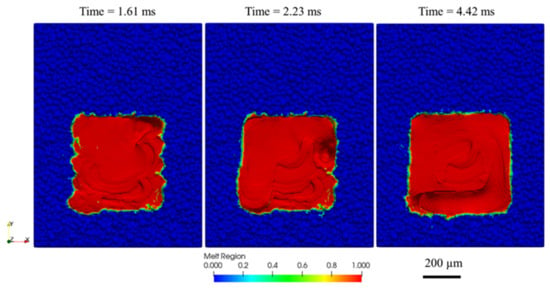
Figure 5.
Simulated single-layer scan in different time steps of the Mid-LED case (1st layer).
3.2. Multi-Track Multi-Layer Simulation Results
Figure 6 presents the result of the DEM simulation for the 14th layer of the High-LED case. The newly recoated powder layer is highlighted in teal, while the previously solidified layers, including the solid substrate, are demonstrated in dark gray. The new powder layer (shown in teal) had a maximum measured height of 417 μm from the solid substrate compared to the theoretical height of the 14th layer (420 μm). These results suggest that the recoating simulation conducted in the DEM stage was relatively accurate.
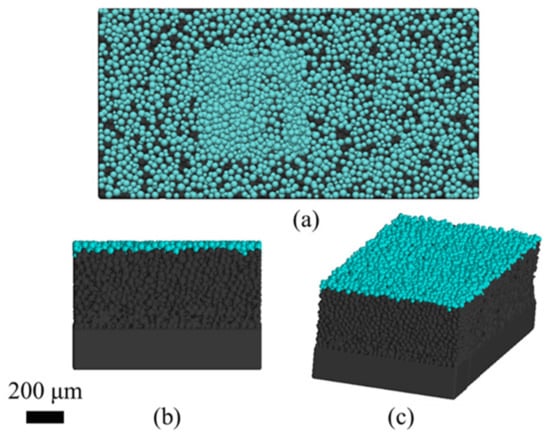
Figure 6.
DEM result of the 14th layer of the High-LED case: top view (a), front view (b), and 3D view (c).
Figure 7 compares the solidified layers simulated in three cases with different contour scan LEDs. The top view of Figure 7 shows that the size of the contour scan footprint increases as the LED increases. This is because the laser power input increases, leading to enlarged melt pool dimensions. The Y-Y cross-sections in Figure 7 demonstrate that the contour scans with larger LED power produce a less significant inclination of the down-skin region (the right edge of the solidified layers of the Y-Y cross-sections). This is due to the larger melt pool depth of the contour scan, resulting in excessive fusion of the underlying material. This phenomenon is most evident in the High-LED case, where the melt pool depth at the border reached the solid substrate, resulting in a much straighter down-skin edge compared to the Low- and Mid-LED cases. Increasing the LED also increases the recoil pressure due to evaporation, which enhances the depression of the solidified top surface at the border. This effect is particularly noticeable in the X-X and Y-Y cross-sections, where the depression becomes more pronounced as the LED power increases. On the other hand, at the up-skin edge (the left edge of the solidified layers in the Y-Y cross-sections), the inclination of approximately 30° is maintained in all three cases.
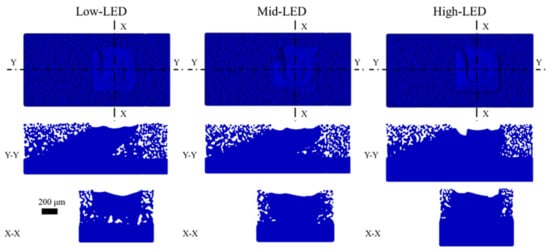
Figure 7.
Simulated solidified layers comparison between the three cases up to layer #14.
Using the Y-Y cross-section of the Mid-LED case at the 5th layer, Figure 8a illustrates the definitions for the melt pool height and width at the down-skin and up-skin regions. Figure 8b presents the simulated melt pool dimensions of all three LED cases up to layer #14 at up- and down-skin. In general, the discrepancies between the up-skin and the down-skin regions are negligible for all the cases. As depicted in Figure 8b, for the down-skin region, as the LED increases from Low (P = 100 W, V = 1750 mm/s, LED = 0.057 J/mm) to Mid (P = 150 W, V = 1250 mm/s, LED = 0.12 J/mm), the melt pool height increases by roughly 40%, while there is a negligible difference in the melt pool width between the Low-LED and Mid-LED cases. Nevertheless, upon a further increase in LED power to High (P = 200 W, V = 750 mm/s, LED = 0.27 J/mm), the simulated melt pool height nearly doubles that of the Mid-LED case. In contrast, the melt pool width experiences a minor drop of approximately 8%. The height-to-width ratios for the Low-, Mid-, and High-LED cases are 0.81, 1.09, and 2.23, respectively. As the input power increases, the impact of recoil pressure resulting from evaporation becomes more pronounced, which leads to a notably deeper melt pool [37]. The slight reduction in melt pool width can be attributed to the excessive downward force exerted on the molten material by the recoil pressure, which may cause an inward shift of the molten material as the keyhole formed by the recoil pressure collapses [38]. Furthermore, in all three cases, there is negligible variation in melt pool dimensions at both the down-skin and up-skin regions as the layers progress. The highest standard deviations of the dimensions between layers are approximately 60 μm and 40 μm for the down-skin and up-skin regions, respectively.
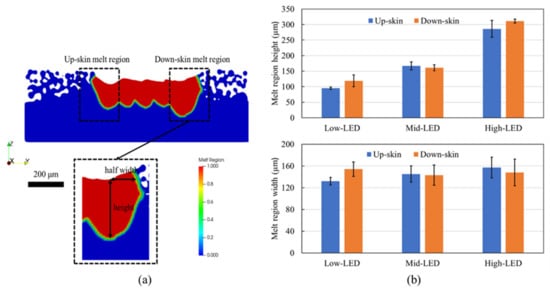
Figure 8.
Illustration of the melt region dimensions of the up-skin and down-skin regions (a). The melt pool dimensions of all three cases up to layer #14 (b). Inclination direction is Y+.
4. Discussions
In Figure 9, the Y-Y cross-sections of the simulated melt region at the 14th layer are presented for all cases, showing the inclination direction. Figure 9 illustrates an upward-facing boundary, inclined at an angle of 30°, originating from the furthest left point of the melted region on the upper surface and extending to the interface between the substrate and the powder. The white region around the up-skin line represents unmelted material, resulting in voids throughout the build. The number and size of voids indicate insufficient fusion due to inadequate laser energy input. Figure 9 shows that the Low-LED case exhibits the highest number of voids near the up-skin line, while the High-LED case results in a denser up-skin area. Increasing laser energy input results in the recoil pressure due to evaporation playing a more dominant role in influencing the melt pool depth. Since the direction of the recoil force is mainly downward, the increase in the melt pool height is much more significant than the increase in the melt pool width.
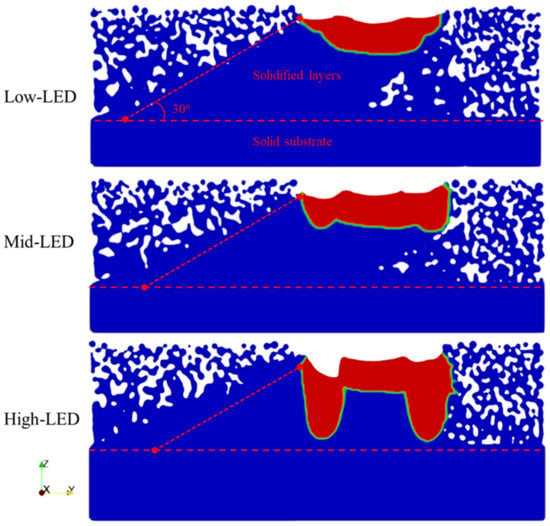
Figure 9.
Y-Y cross-sections of the simulated melt region at layer #14 of three cases (Y+ is the inclination direction, and the horizontal dash line indicates the substrate–powder interface).
Simulation results have demonstrated that higher LED values lead to a larger fusion zone at the edges of the scanning area, ensuring adequate material fusion in the up-skin region. A larger fusion zone eliminates voids formed in the previous layer, and the surrounding powder particles are melted more efficiently. Additionally, larger LED values for contouring scans may reduce the roughness of the up-skin surface by minimizing the negative impact of partially sintered powder particles attached to the surface, as suggested by Metelkova et al. [39].
For the down-skin region, the surface roughness is mainly contributed to by the attached particles at the melt pool boundary [21]. However, quantitative calculations and visualization of the attached particles are currently challenging for this numerical model. Since the adhered particles are not fully melted, observing those particles with the melt region plot is not feasible. Hence, the temperature gradient of the melt region is used to study the differences in the melt pool between up-skin and down-skin regions. To further investigate the temperature gradient differences between the up-skin (left edge) and down-skin (right edge) regions, temperature gradient profiles of all three cases at three different layers are presented in Figure 10, Figure 11, and Figure 12 for the Low-LED, Mid-LED, and High-LED cases, respectively. As illustrated in these figures, although the temperature gradient of the first layer in the up-skin region is slightly higher than the other two layers, the difference is insignificant. On the other hand, for the down-skin region, the temperature gradient at the border decreases as the layer increases. Similar numerical observations have been reported by Xiang et al. [40] and Ren et al. [13]. The most widely accepted explanation for this phenomenon is that, in the down-skin region, scanning occurs in a mixed environment of solidified material and powders. The lower thermal conductivity of the powder particles leads to a higher thermal conductivity difference in that region, resulting in a smaller temperature gradient. This effect becomes more pronounced as the layer increases, since more powder particles surround the scan region. Furthermore, irregular temperature gradient zones may be observed at the down-skin region due to the adhered particles at the boundary. The number of irregular temperature zones increases with higher LED values since the melt pool height increases with higher input power, resulting in more particles adhering to the boundary. The simulation results suggest that a lower LED value of the contour scan will result in a better down-skin surface quality [18,41,42,43].
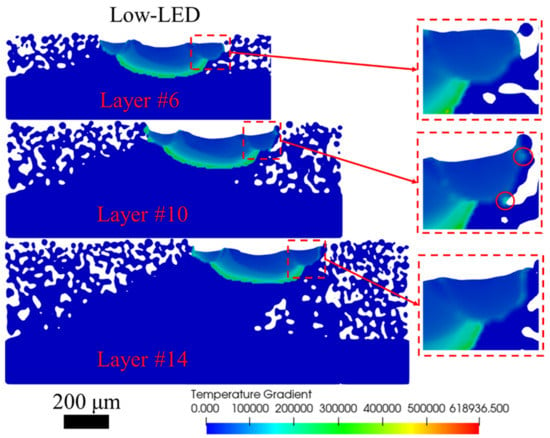
Figure 10.
Temperature gradient along the sloping direction (Y+) of the Low-LED case of Layer #6, #10, and #14. Red circles indicate irregular thermal gradient zones. Time = 0.008 s (Unit: K/cm).
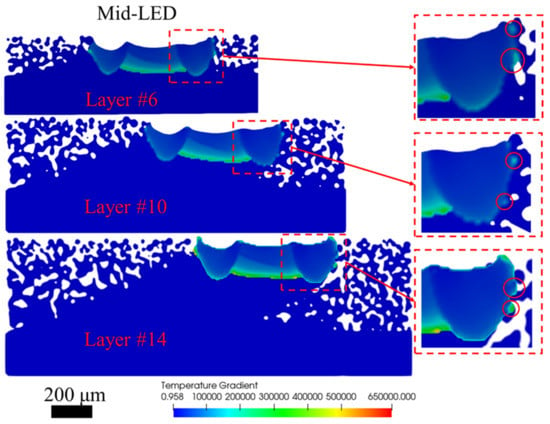
Figure 11.
Temperature gradient along the sloping direction (Y+) of the Mid-LED case of Layer #6, #10, and #14. Red circles indicate irregular thermal gradient zones. Time = 0.008 s (Unit: K/cm).
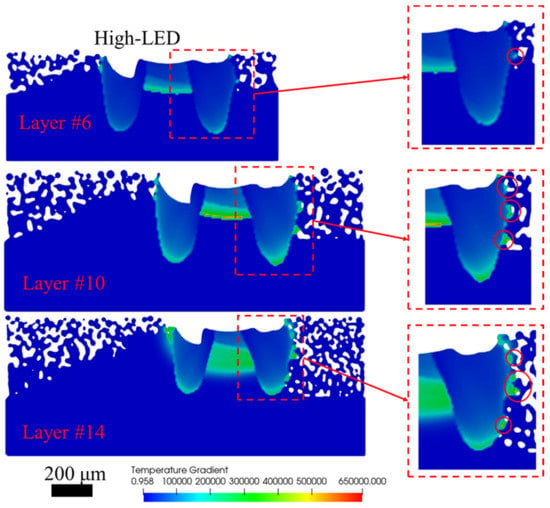
Figure 12.
Temperature gradient along the sloping direction (Y+) of the High-LED case of Layer #6, #10, and #14. Red circles indicate irregular thermal gradient zones. Time = 0.008 s (Unit: K/cm).
5. Conclusions
This research introduces a high-fidelity simulation framework for modeling the multi-track multi-layer process in L-PBF, focusing on inclined features. This preliminary study aims to demonstrate the feasibility of simulating such a process with multiple layers, tall enough to capture sloped surface formation. Computational DEM and thermo-fluid models were integrated to sequentially simulate powder recoating and laser–material interactions, respectively. The study investigates the effects of contouring scans on inclined surface formation by simulating and comparing three levels of Linear Energy Density (LED = Power/Speed). Due to the challenge of removing the surrounding unmelted particles from simulation results, visualizations to separate the actual up- or down-skin surfaces and the attached particles have to be manually processed, which is labor intensive, as well as being potentially uncertain and unattainable at this stage of the study. Nonetheless, the proposed simulation framework lays the groundwork for further investigation of the complex physical phenomena that affect the surface quality of sloped samples in L-PBF. In addition, the numerical results qualitatively agree with reported experimental data for both down- and up-skin surfaces. From the numerical results, some important conclusions can be drawn as follows:
- For a 30° inclination angle, at the up-skin region, the High-LED case (P = 200 W, V = 750 mm/s, LED = 0.27 J/mm) leads to a denser region at the up-skin area, while the Low-LED case (P = 100 W, V = 1750 mm/s, LED = 0.057 J/mm) results in mostly unmelted materials. Moreover, as the input power increases for the contouring scans, the dimensions of the melt pool (height and width) also increase, resulting in more sufficient fusion of powder particles at the boundary of the built part. This, in turn, may lead to a smoother up-skin surface.
- Regarding the down-skin region, while it was impossible to visualize and quantify the attached particles on the surface, the simulation results for the temperature gradient at the melt boundary were used for initial analysis. Since the scanning area at the down-skin is mainly supported by surrounding powder particles, the thermal dissipation is much lower than in the up-skin region, resulting in a higher thermal gradient at the melt pool boundary.
- Small, irregular zones with high thermal gradients at the edge of the melt pool may serve as an implicit indicator of the attached particles. According to the simulation results, such irregular zones are highest for the High-LED case and lowest for the Low-LED case. This phenomenon can be explained by the fact that the increase in LED enhances the dimensions of the melt pool.
For future work, the surface roughness of the down-skin and up-skin regions will be thoroughly examined and analyzed to establish a definitive correlation between contouring scans and the quality of inclined surfaces. To comprehensively understand the effects of contour scans on inclined surface quality, a wider range of inclination angles and contouring strategies such as contouring offsets, post- and pre-contour, and a broader range of LEDs will be tested, requiring significant numerical efforts. To further validate the numerical findings obtained from simulations, the next steps of the study will involve constructing an intensive Design of Experiment (DOE) revolving around the process parameters and conditions investigated in this study.
Author Contributions
Conceptualization, methodology, validation, analysis, software, original draft preparation, T.-N.L.; conceptualization, supervision, funding acquisition, review and editing, K.C. All authors have read and agreed to the published version of the manuscript.
Funding
This research has been supported by Technical Data Analysis, Inc. through a Navy STTR project, contract no. N68335-21-C-0168.
Data Availability Statement
Data will be provided upon reasonable request.
Conflicts of Interest
The funders had no role in the design of the study; in the collection, analyses, or interpretation of data; in the writing of the manuscript; or in the decision to publish the results.
References
- Gibson, I.; Rosen, D.; Stucker, B. Additive Manufacturing Technologies; Springer: Cham, Switzerland, 2021. [Google Scholar]
- Yakout, M.; Elbestawi, M.; Veldhuis, S.C. A Review of Metal Additive Manufacturing Technologies. Solid State Phenom. 2018, 278, 1–14. [Google Scholar] [CrossRef]
- Herriott, C.; Spear, A.D. Predicting microstructure-dependent mechanical properties in additively manufactured metals with machine- and deep-learning methods. Comput. Mater. Sci. 2020, 175, 109599. [Google Scholar] [CrossRef]
- Rodgers, T.M.; Lim, H.; Brown, J.A. Three-Dimensional Additively Manufactured Microstructures and Their Mechanical Properties. JOM 2019, 72, 75–82. [Google Scholar] [CrossRef]
- Wang, Z.; Jiang, C.; Liu, P.; Yang, W.; Zhao, Y.; Horstemeyer, M.F.; Chen, L.-Q.; Hu, Z.; Chen, L. Uncertainty quantification and reduction in metal additive manufacturing. NPJ Comput. Mater. 2020, 6, 175. [Google Scholar] [CrossRef]
- Tran, H.-C.; Lo, Y.-L.; Le, T.-N.; Lau, A.K.-T.; Lin, H.-Y. Multi-scale simulation approach for identifying optimal parameters for fabrication of high-density Inconel 718 parts using selective laser melting. Rapid Prototyp. J. 2021, 28, 109–125. [Google Scholar] [CrossRef]
- Charles, A.; Elkaseer, A.; Paggi, U.; Thijs, L.; Hagenmeyer, V.; Scholz, S. Down-facing surfaces in laser powder bed fusion of Ti6Al4V: Effect of dross formation on dimensional accuracy and surface texture. Addit. Manuf. 2021, 46, 102148. [Google Scholar] [CrossRef]
- Kumar, P.; Ramamurty, U. High cycle fatigue in selective laser melted Ti-6Al-4V. Acta Mater. 2020, 194, 305–320. [Google Scholar] [CrossRef]
- Metelkova, J.; Vanmunster, L.; Haitjema, H.; Van Hooreweder, B. Texture of inclined up-facing surfaces in laser powder bed fusion of metals. Addit. Manuf. 2021, 42, 101970. [Google Scholar] [CrossRef]
- Chen, Z.; Wu, X.; Tomus, D.; Davies, C.H. Surface roughness of Selective Laser Melted Ti-6Al-4V alloy components. Addit. Manuf. 2018, 21, 91–103. [Google Scholar] [CrossRef]
- Le, K.; Wong, C.; Chua, K.; Tang, C.; Du, H. Discontinuity of overhanging melt track in selective laser melting process. Int. J. Heat Mass Transf. 2020, 162, 120284. [Google Scholar] [CrossRef]
- Chen, H.; Gu, D.; Xiong, J.; Xia, M. Improving additive manufacturing processability of hard-to-process overhanging structure by selective laser melting. J. Mater. Process. Technol. 2017, 250, 99–108. [Google Scholar] [CrossRef]
- Ren, Z.; Wei, D.; Wang, S.; Zhang, D.Z.; Mao, S. On the role of pre- and post-contour scanning in laser powder bed fusion: Thermal-fluid dynamics and laser reflections. Int. J. Mech. Sci. 2022, 226, 107389. [Google Scholar] [CrossRef]
- Le, T.-N.; Lo, Y.-L.; Lin, Z.-H. Numerical simulation and experimental validation of melting and solidification process in selective laser melting of IN718 alloy. Addit. Manuf. 2020, 36, 101519. [Google Scholar] [CrossRef]
- Khairallah, S.A.; Anderson, A. Mesoscopic simulation model of selective laser melting of stainless steel powder. J. Mater. Process. Technol. 2014, 214, 2627–2636. [Google Scholar] [CrossRef]
- Reddy, P.; Patel, V.; Yadav, A.; Patel, S.; Kumar, A. Modelling and simulation of equilibrium and non-equilibrium solidification in laser spot welding. IOP Conf. Ser. Mater. Sci. Eng. 2018, 310, 012092. [Google Scholar] [CrossRef]
- Knapp, G.; Coleman, J.; Rolchigo, M.; Stoyanov, M.; Plotkowski, A. Calibrating uncertain parameters in melt pool simulations of additive manufacturing. Comput. Mater. Sci. 2023, 218, 111904. [Google Scholar] [CrossRef]
- Lin, H.-Y.; Tran, H.-C.; Lo, Y.-L.; Le, T.-N.; Chiu, K.-C.; Hsu, Y.-Y. Optimization of Surface Roughness and Density of Overhang Structures Fabricated by Laser Powder Bed Fusion. 3D Print. Addit. Manuf. 2022. ahead of print. [Google Scholar] [CrossRef]
- Moges, T.; Ameta, G.; Witherell, P. A Review of Model Inaccuracy and Parameter Uncertainty in Laser Powder Bed Fusion Models and Simulations. J. Manuf. Sci. Eng. 2019, 141, 040801. [Google Scholar] [CrossRef]
- Bayat, M.; Dong, W.; Thorborg, J.; To, A.C.; Hattel, J.H. A review of multi-scale and multi-physics simulations of metal additive manufacturing processes with focus on modeling strategies. Addit. Manuf. 2021, 47, 102278. [Google Scholar] [CrossRef]
- Feng, S.; Kamat, A.M.; Sabooni, S.; Pei, Y. Experimental and numerical investigation of the origin of surface roughness in laser powder bed fused overhang regions. Virtual Phys. Prototyp. 2021, 16, S66–S84. [Google Scholar] [CrossRef]
- Shrestha, S.; Chou, Y.K. A Numerical Study on the Keyhole Formation During Laser Powder Bed Fusion Process. J. Manuf. Sci. Eng. 2019, 141, 101002. [Google Scholar] [CrossRef]
- Fotovvati, B.; Chou, K. Multi-layer thermo-fluid modeling of powder bed fusion (PBF) process. J. Manuf. Process. 2022, 83, 203–211. [Google Scholar] [CrossRef]
- Hu, G.; Hu, Z.; Jian, B.; Liu, L.; Wan, H. On the Determination of the Damping Coefficient of Non-Linear Spring-Dashpot System to Model Hertz Contact for Simulation by Discrete Element Method. In Proceedings of the 2010 WASE International Conference on Information Engineering, Beidai, China, 14–15 August 2010; Volume 3, pp. 295–298. [Google Scholar]
- Kloss, C.; Goniva, C.; Hager, A.; Amberger, S.; Pirker, S. Models, algorithms and validation for opensource DEM and CFD-DEM. Prog. Comput. Fluid Dyn. Int. J. 2012, 12, 140–152. [Google Scholar] [CrossRef]
- Le, T.-N.; Lo, Y.-L.; Chen, K.-Y.; Hung, W. Numerical and experimental investigation into powder entrainment and denudation phenomena in laser powder bed fusion process. Powder Technol. 2022, 410, 117907. [Google Scholar] [CrossRef]
- Le, T.-N.; Lo, Y.-L. Effects of sulfur concentration and Marangoni convection on melt-pool formation in transition mode of selective laser melting process. Mater. Des. 2019, 179, 107866. [Google Scholar] [CrossRef]
- Bayat, M.; Mohanty, S.; Hattel, J.H. Multiphysics modelling of lack-of-fusion voids formation and evolution in IN718 made by multi-track/multi-layer L-PBF. Int. J. Heat Mass Transf. 2019, 139, 95–114. [Google Scholar] [CrossRef]
- Cho, J.; Na, S.-J. Implementation of real-time multiple reflection and Fresnel absorption of laser beam in keyhole. J. Phys. D Appl. Phys. 2006, 39, 5372–5378. [Google Scholar] [CrossRef]
- Ge, W.; Fuh, J.Y.; Na, S.J. Numerical modelling of keyhole formation in selective laser melting of Ti6Al4V. J. Manuf. Process. 2021, 62, 646–654. [Google Scholar] [CrossRef]
- Firm, K.; Boyer, R.; Welsch, G. Materials Properties Handbook: Titanium Alloys; ASM International, The Materials Information Society: Materials Park, OH, USA, 1994; ISBN 978-0-87170-481-8. [Google Scholar]
- Rai, R.; Elmer, J.W.; Palmer, T.A.; DebRoy, T. Heat transfer and fluid flow during keyhole mode laser welding of tantalum, Ti–6Al–4V, 304L stainless steel and vanadium. J. Phys. D Appl. Phys. 2007, 40, 5753–5766. [Google Scholar] [CrossRef]
- Rai, R.; Burgardt, P.; O Milewski, J.; Lienert, T.J.; DebRoy, T. Heat transfer and fluid flow during electron beam welding of 21Cr–6Ni–9Mn steel and Ti–6Al–4V alloy. J. Phys. D Appl. Phys. 2009, 42, 025503. [Google Scholar] [CrossRef]
- Rasheed, M.; Mohammed, O.Y.; Shihab, S.; Al-Adili, A. A comparative Analysis of PV Cell Mathematical Model. J. Phys. Conf. Ser. 2021, 1795, 012042. [Google Scholar] [CrossRef]
- Jalal, R.; Shihab, S.; Alhadi, M.A.; Rasheed, M. Spectral Numerical Algorithm for Solving Optimal Control Using Boubaker-Turki Operational Matrices. J. Phys. Conf. Ser. 2020, 1660, 012090. [Google Scholar] [CrossRef]
- Cunningham, R.; Zhao, C.; Parab, N.; Kantzos, C.; Pauza, J.; Fezzaa, K.; Sun, T.; Rollett, A.D. Keyhole threshold and morphology in laser melting revealed by ultrahigh-speed x-ray imaging. Science 2019, 363, 849–852. [Google Scholar] [CrossRef] [PubMed]
- Semak, V.V.; Matsunawa, A. The role of recoil pressure in energy balance during laser materials processing. J. Phys. D Appl. Phys. 1997, 30, 2541–2552. [Google Scholar] [CrossRef]
- Cho, W.-I.; Na, S.-J.; Thomy, C.; Vollertsen, F. Numerical simulation of molten pool dynamics in high power disk laser welding. J. Mater. Process. Technol. 2012, 212, 262–275. [Google Scholar] [CrossRef]
- Metelkova, J.; Ordnung, D.; Kinds, Y.; Witvrouw, A.; van Hooreweder, B. Improving the Quality of Up-Facing Inclined Surfaces in Laser Powder Bed Fusion of Metals Using a Dual Laser Setup. Procedia CIRP 2020, 94, 266–269. [Google Scholar] [CrossRef]
- Xiang, Z.; Wang, L.; Yang, C.; Yin, M.; Yin, G. Analysis of the quality of slope surface in selective laser melting process by simulation and experiments. Optik 2019, 176, 68–77. [Google Scholar] [CrossRef]
- Shange, M.; Yadroitsava, I.; du Plessis, A.; Yadroitsev, I. Roughness and Near-Surface Porosity of Unsupported Overhangs Produced by High-Speed Laser Powder Bed Fusion. 3D Print. Addit. Manuf. 2022, 9, 288–300. [Google Scholar] [CrossRef]
- Korkmaz, M.E.; Gupta, M.K.; Waqar, S.; Kuntoğlu, M.; Krolczyk, G.M.; Maruda, R.W.; Pimenov, D.Y. A short review on thermal treatments of Titanium & Nickel based alloys processed by selective laser melting. J. Mater. Res. Technol. 2022, 16, 1090–1101. [Google Scholar] [CrossRef]
- Korkmaz, M.E.; Gupta, M.K.; Robak, G.; Moj, K.; Krolczyk, G.M.; Kuntoğlu, M. Development of lattice structure with selective laser melting process: A state of the art on properties, future trends and challenges. J. Manuf. Process. 2022, 81, 1040–1063. [Google Scholar] [CrossRef]
Disclaimer/Publisher’s Note: The statements, opinions and data contained in all publications are solely those of the individual author(s) and contributor(s) and not of MDPI and/or the editor(s). MDPI and/or the editor(s) disclaim responsibility for any injury to people or property resulting from any ideas, methods, instructions or products referred to in the content. |
© 2023 by the authors. Licensee MDPI, Basel, Switzerland. This article is an open access article distributed under the terms and conditions of the Creative Commons Attribution (CC BY) license (https://creativecommons.org/licenses/by/4.0/).