Article

Corrosion Current Density of API 5L X65 Carbon Steel in Contact with Natural Callovian-Oxfordian Clay Pore Water, Assessed by Various Electrochemical Methods over 180 Days

by
Yendoube Charles Sano Moyeme
1,2,
Stephanie Betelu
1,
Johan Bertrand
3,
Karine Groenen Serrano
2 and
Ioannis Ignatiadis
1,*
1
French Geological Survey, Bureau de Recherches Géologiques et Minieres, Water, Environment, Processes and Analyses Division, 3 Avenue Claude Guillemin, 45060 Orleans, France
2
Laboratoire de Génie Chimique, Université de Toulouse, CNRS, INPT, UPS 118, Route de Narbonne, 31062 Toulouse, France
3
National Radioactive Waste Management Agency (Andra), 92298 Chatenay-Malabry, France
*
Author to whom correspondence should be addressed.
Metals 2023, 13(5), 966; https://doi.org/10.3390/met13050966
Submission received: 20 March 2023 / Revised: 20 April 2023 / Accepted: 4 May 2023 / Published: 17 May 2023
(This article belongs to the Special Issue Electrochemical Corrosion and Protection of Alloys and Steels)

Abstract

:
Near-neutral pH and a low redox potential are considered favorable conditions for immobilizing radionuclides in deep repository systems within clay formations. Cigeo is the future French Industrial Center for Geological Disposal for high- and intermediate-level long-lived radioactive waste, to be built at a depth of 500 m within the Callovian–Oxfordian clay. In-depth knowledge of the mechanisms and kinetics of corrosion occurring on the surface of API 5L X65 (X65) carbon steel tubing is essential for the reversible nuclear waste management of the Cigeo site. By using all-solid and robust handmade electrodes in addition to electrochemical and gravimetric techniques, we determined the corrosion phenomenology and kinetics of X65 in contact with natural Cox pore water in equilibrium with its rock gases, flowing continuously through a multi-parameter probe device and placed at a depth of 500 m at the Bure Underground Research Laboratory, for over 180 days. Two iron oxidants were encountered, namely, depleted dioxygen (O2) and proton H(I), accompanied by hydrogen sulfide. Corrosion mechanisms and kinetics were well established for the two X65 electrodes, whether electrochemically perturbed or not. The corrosion thickness loss rates, determined by both electrochemical and gravimetric techniques, were between 0.016 and 0.032 mm/year. This study demonstrates, on site, the reliability of a developed methodology for continuous monitoring of the corrosion kinetics of the API 5L X65 carbon steel at the same time as the temporal variation of the key geochemical parameters of the fluid was assessed.

1. Introduction

1.1. General Context

France derives about 70% of its electricity from nuclear energy due to a long-standing policy based on energy security. In 2016, nuclear energy generated 60.9% of that year’s radioactive waste (National Inventory of Radioactive Materials and Waste (https://inventaire.andra.fr/ (accessed on 2 January 2023)); 2018 edition of the National Inventory (based on late 2016 figures, https://international.andra.fr/sites/international/files/2021-11/Andra-MAJ_Essentiels_2021-21_02Fev_ENsdpdf%20%5Bpreview%5D_0.pdf (accessed on 2 January 2023))), with the rest coming from research (26.6%), defense (8.7%), non-nuclear industry (3.3%), and medicine (0.5%). Of the total, 3.1% comprised long-lived high-level (0.2%) and intermediate-level (2.9%) radioactive waste, making up 94.9% and 4.5%, respectively, of the level of radioactivity.
Deep geological facilities (DGF) are internationally recognized as one of the options for managing such high-level and intermediate-level long-lived radioactive waste (HL- and IL-LLRW, respectively, hereafter referred to as HLRW when unnecessary to distinguish between HL and IL). Moreover, near-neutral pH and low redox potential are considered favorable conditions for immobilizing most radionuclides in deep repository systems within clay formations [1].
In France, one of the objectives of Andra [2], the National Radioactive Waste Management Agency, which is in charge of radioactive waste management, is to conceive and construct the future Industrial Centre for Geological Disposal (Cigeo) to protect humans and the environment from the danger of long-lived radioactive waste over the very long term [1,2,3,4].
The Callovian–Oxfordian (Cox) clay formation is a water-saturated environment composed of clay minerals, organic matter, various oxides, and sulfides [5,6,7,8,9,10,11,12]. Its natural temperature ranges between 20 and 25 °C (at a depth of 500 m), its pH is 7.2 and 7.7, and its redox potential is −200 to −180 mV vs. a standard hydrogen electrode (SHE). The measurable and reproducible steady state with a mixed redox potential of Cox is controlled by a pyrite-based S(-II)/S(0) redox couple and a Fe(III)/Fe(II) redox couple formed by smectites [13,14], with a pCO2 of 8.10−3 atm. For these reasons, the Cox formation was selected as the host rock for Cigeo [2].
Cigeo will consist of separate disposal zones for HL- and intermediate-level IL-LLRW, as well as of connecting drifts and technical facilities. The HLRW disposal cells (Figure 1) will consist of carbon steel-lined micro-tunnels measuring about 60–70 cm in diameter and around 100 m in length. The initial annular space between the outer surface of the sleeve and the host rock will be filled with an “ASFM” (annular space-filling material) cementitious grout, which imposes corrosion-limiting environmental conditions.
Andra [2] launched an R&D program for evaluating monitoring systems and techniques dedicated to the surveillance of HLRW disposal cells. One of the monitoring objectives is to evaluate the condition of retrievability, one of the key parameters of which is evaluating the corrosion of the metallic liner material.
Evaluation of carbon steel corrosion and kinetics remains a major challenge of long-term measurements. In a laboratory, kinetic corrosion can be measured directly, according to mass loss of exposed steel coupons, or indirectly, according to changes in the electrochemical parameters related to reactions induced by the corrosion phenomena. However, the latter encounter three major challenges for on-site and long-term measurements:
  • Their definition requires a broad spectrum of multi-disciplinary knowledge, including their representativeness;
  • The selected operating conditions for the measurements may differ from the mode of analyzed corrosion phenomena;
  • Their implementation may be affected by future developments in electroanalytical technology, or be imperiled by locally occurring and unforeseen phenomena.
The objective of this paper is to demonstrate, on site, the reliability of a developed electrochemical methodology for continuous monitoring of the corrosion kinetics of the API 5L X65 carbon steel, used as an HLRW metallic liner material, in direct contact with the natural Cox pore water and in equilibrium with its rock gases (CO2, CH4, N2, H2S) within the deep geological facility, for subsequent deployment in ASFM.

1.2. Short Review on Corrosion Assessment Studies of Various Carbon Steels in Cox-Related Environments

General and basic data on the corrosion of Fe° in oxic and anoxic aqueous solutions are given in the Appendix A.
Several studies, undertaken within the scientific framework of international institutions [15,16,17,18,19,20,21,22,23], have investigated the corrosion assessment of carbon steels in clay environments. Nevertheless, the corrosion rate is clay-specific, as it depends upon several factors, including temperature, pH, redox conditions, clay and clay pore water composition, water salinity, porosity and hydraulic conductivity, flow rate, bacterial species, etc. This is the reason why this paragraph 1.2 only details corrosion assessment studies of various carbon steels within the Andra scientific framework in Cox-related environments.
Various experiments, undertaken within the Andra scientific framework, have provided knowledge regarding the corrosion behavior of various carbon steel types in contact with natural or reconstituted Cox pore water; directly in contact with the Cox clay; and under various temperature, pressure, and microbiology conditions [24,25,26,27,28,29,30], considering the evolution of physical and chemical parameters during storage.
This also included specific constraints of the on-site conditions:
  • The increased temperature due to radioactive disintegration (25 °C ≤ T ≤ 90 °C);
  • The wide range of redox potential values over the Pourbaix diagram owing to O2, diffusing through the near field clay rock due to excavation; H2, due to release from metal corrosion; and H2S, due to the activity of sulfate-reducing bacteria.
The corrosion assessment was mostly based on electrochemical impedance spectroscopy (EIS), with measurements performed at open circuit potential (OCP) at variable frequency ranges (ordinarily from 1 MHz to 1 mHz). The voltammetry at ±50 mV around open circuit potential (VaOCP) was used to avoid the very disturbing linear polarization of Tafel plots at ±250 mV around OCP. Finally, linear polarization resistance (LPR) (±20 mV around OCP) was systematically used. The gravimetric and mass-loss methods were also used. This empirical method for effectively measuring the rate of steel corrosion allows for the validation of electrochemical measurements.
Martin et al. [24] studied, in the laboratory and for over 800 days, the electrochemical behavior of low alloyed A37steel immersed in synthetic Cox pore water at 90 °C in the presence of a mass fraction of 10% Cox. At the same time, they also investigated the evolution of the mass loss of several A37 coupons under anoxic conditions and at a pH value of 7.6. By using EIS, they showed that the instantaneous corrosion rate, which initially reached 100 µm/year, firstly decreased to 10 μm a year later, and finally to 1 μm/year after 19–20 months. By using mass loss and post mortem surface analyses, the pseudo-passive behavior of carbon steel under the investigated conditions was confirmed, from the 20th day onward and during the whole 800-day experiment. This pseudo-passive behavior, which induced a decrease in the instantaneous carbon steel corrosion rate, was expressed by the presence of layers of corrosion deposits. The nature of these layers varied with time. The native iron oxide layer (maghemite or magnetite) was first covered by a silica-rich iron oxide layer and then covered by Ca-rich siderite.
This pseudo-passive behavior of carbon steel was also described by Schleger et al. [25]. They characterized—using µXRF, Raman spectroscopy, SEM-EDX, and XRD—the corrosion interface of low-alloy P235 carbon steel coupons reacting with clay pore water seeping into an in situ test chamber in the Callovian–Oxfordian clay formation of the Meuse-Haute Marne Underground Research Laboratory (URL), over 1800 days at temperatures ranging from 25 to 85 °C. Extensively corroded coupons were obtained when corrosion initially occurred under acidic anoxic conditions at a pH of 4.7 over about 454 days. This was followed by an increase up to 7; the pH drop was due to the oxidation of the constituent pyrite (FeS2) in the presence of dioxygen diffusing through the near-field clay rock. The subsequent oxygen depletion led to pH stabilization close to the value of natural Cox pore water. Under such conditions, the innermost layer was composed of Cl-rich Fe (hydr)oxide, later evolving to form a massive β-Fe2(OH)3Cl unit close to C-steel, which was sometimes crossed by magnetite ribbons sticking to cementite lamellas or by patches of green rust. The second inner layer was made of veinlets of Fe-hydrated silicate with sponge-like morphology, a molecular-scale structure reminiscent of clay minerals, and containing nodules of siderite and chukanovite. These (hydroxy)carbonate solids sometimes merged to form a massive layer close to the trace of the original surface. The layers external to this original surface were discontinuous and consisted of successively Ca-doped siderite (ankerite), Fe sulfide, S-rich Fe silicate, and, finally, pyrite nodules and ankerite. For the samples with limited damage, i.e., the accurately confined samples, siderite, chukanovite particles, and silica-rich veinlets were in close contact with metal, sometimes with interfacial magnetite. The outer layers consisted of Fe sulfide and ankerite, evidencing the presence of thermophilic sulfate-reducing bacteria into the clay pore water.
Necib et al. [26,27], using the same type of test chamber, conducted gravimetric tests over 1800 days on samples of P235, P275, and SA516 steels immersed in natural pore water and in contact with its gas, with a gradual rise in temperature over 77 days until reaching 85 °C. Similarly to Schleger et al. [25], they observed an initial pH decrease from 7 to 4.5, followed by an increase to 7. The corrosion rate was about 250 µm/year during the pH drop, and 10 µm/year under stabilized anoxic conditions at pH 7.
El Hajj et al. [28] demonstrated the influence of sulfate-reducing bacteria activity (producing H2S) on the corrosion rate of PG395GH-type carbon steel by comparing—under anoxic conditions—sterilized and non-sterilized media, with pore water as well as saturated Cox clay at 30 °C and 120 bars of pressure (to simulate deep geological conditions). They found, through µRaman analysis, the presence of mackinawite as a corrosion product in the non-sterilized medium, and Fe-oxyhydroxydes—such as lepidocite and ferrihydrite—under sterilized conditions. The global corrosion rate was twice as high under non-sterilized conditions. The saturated Cox clay thus contained enough nutriments to support bacterial development, producing H2S, and, thus, boosting corrosion. However, these authors noted that this role could be neglected in the presence of dihydrogen (H2) gas produced via corrosion. Indeed, with a high amount of H2, there is insufficient interstitial free water for the transport of matter useful for microorganism proliferation.
El Mendili et al. [29,30], in the presence of Cox synthetic water and Cox clay at 30 °C, showed the formation of magnetite (Fe3O4) and siderite (FeCO3), and also indicated the presence of bacterial activity. At 90 °C, the bacterial activity was inhibited, and a layer of ferrous sulfide (FeS, pyrrhotite) was produced by the reduction of pyrite present in Cox clay by hydrogen. The corrosion rates were about 1 and 2 µm/y for sterilized and non-sterilized samples, respectively.
All of these previous studies particularly characterized the nature of the corrosion products formed under various conditions and over long periods [23,26,27]. They highlighted the usefulness of electrochemical and mass-loss techniques for corrosion assessment. To gain better insight into long-term corrosion measurements, we conducted a large-scale study at the Bure Underground Research Laboratory (URL), where continuous monitoring of the natural Cox pore water was achieved while long-term corrosion was assessed. This paper presents a complete and comparative study for investigating the temporal variation of the natural geochemical parameters of Cox pore water, measuring the API 5L X65 carbon steel (X65) corrosion rates and characterizing three main corrosion mechanisms. The experiment used innovative solid and robust handmade electrodes inserted into a multi-parametric device [31]. In addition to potentiometric monitoring of the temperature, pH, redox-potential, S(-II) content, and OCP of X65, three electrochemical techniques were used for corrosion measurements. Voltammetry at ±50 mV around OCP (VaOCP), LPR technique (±20 mV around OCP), and EIS measurements, performed at OCP at frequency range of 1 MHz to 1 mHz, was suitably selected to minimize the corrosion induced by these techniques themselves. A gravimetric technique was finally applied to validate the corrosion measurements based on electrochemical techniques.

2. Materials and Methods

2.1. Carbon Steel API 5L X65 Characteristics and Electrodes Designed for Corrosion Studies

The tubing to be used as a receptor for the canisters was made of carbon steel (Figure 2a), the chemical composition of which is given in Table 1. This tubing was reprocessed for designing and constructing the API 5L X65 carbon steel electrodes (Figure 2b) to be used for the corrosion studies. The electrode body (diameter 12 mm) was in polyether ether ketone (PEEK). Robust sealing was ensured by two o-rings to prevent any crevice corrosion. The design and production was based on ten years of experience [31]. The exposed metal was a cylinder 5 mm in diameter and 3 mm in height, for a total exposed surface (lateral and one basal) of 0.64 cm2.

2.2. Cox Pore Water Characteristics and Borehole Device for Supplying Pore Water

2.2.1. Cox Pore Water

The investigated “corrosive” medium was well-balanced pore water within the Callovian–Oxfordian clay (Cox) formation at Bure (France). The pore water chemistry, in terms of the dissolved major elements [5,6,11], is given in Table 2.

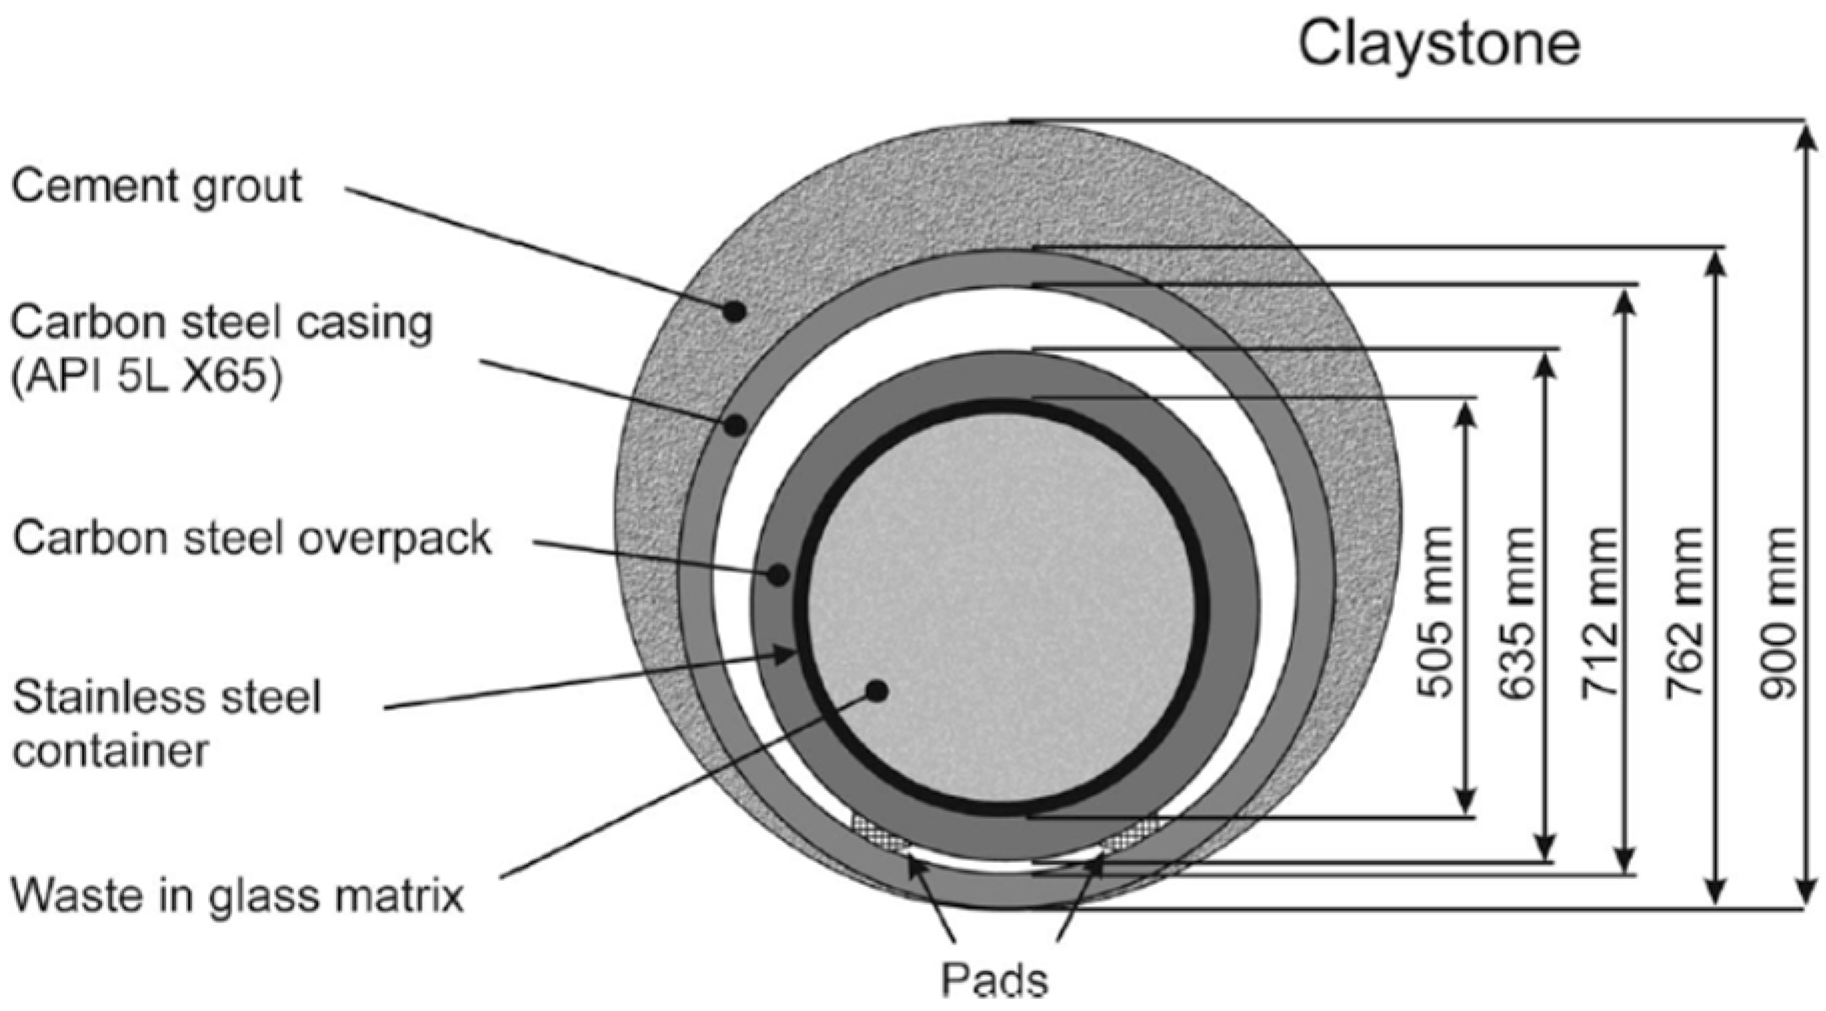
2.2.2. Borehole Supplying Cox Pore Water and Device for Contact with Sensors and Electrodes

The EPT1201—Clay 322 sealed borehole [32], drilled in the roof of the NED/GED gallery of the URL of Andra at Bure (France), supplied natural Cox pore water, in equilibrium with its rock gases (CO2, CH4, N2, H2S), to two hermetically sealed multi-parameter probe holders (MPP-1; MPP-2; Figure 3a,b, see Section 2.3.1).

2.3. Experimental Setup for Studying the Corrosivity of Cox Water against X65

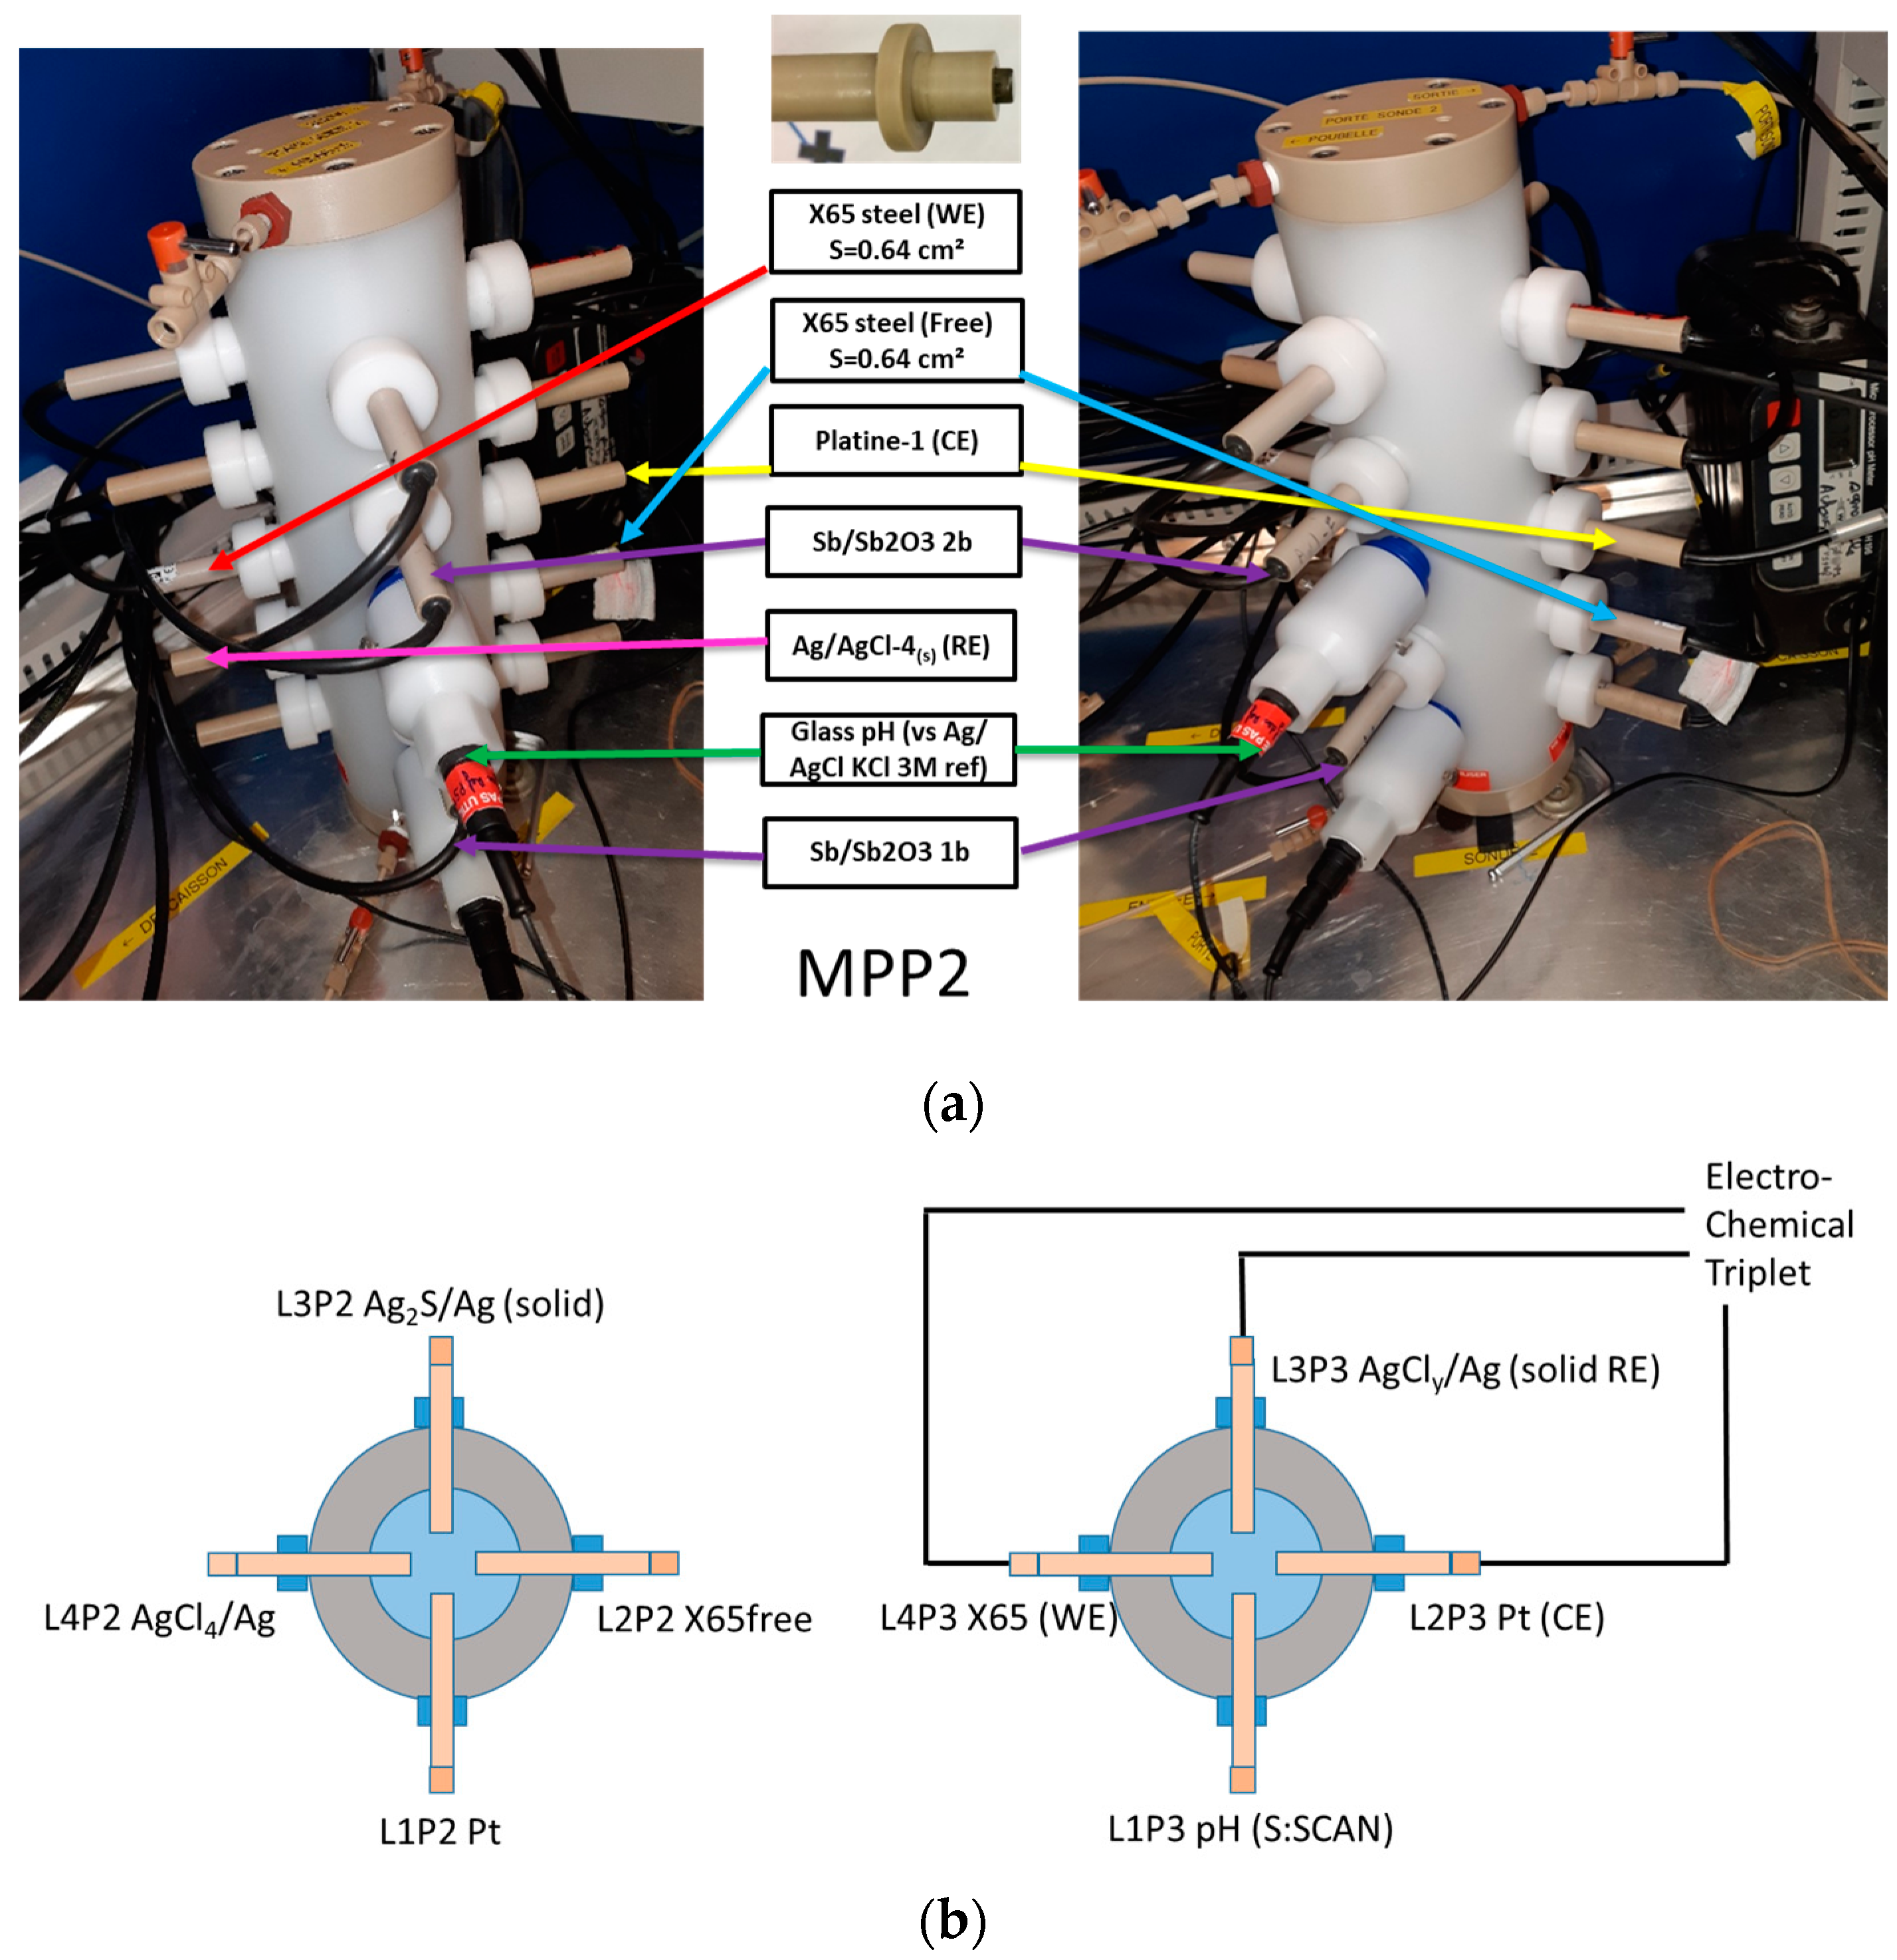
2.3.1. Multi-Parameter Probe (MPP) Holders, MPP-1 and MPP-2, and Designed Electrodes

Two innovative hermetically sealed MPP holders were designed and constructed for long-term monitoring of the temporal variation of the natural geochemical parameters of Cox pore water and measuring the X65 corrosion rates with various electrodes inserted into the MPPs while pore water is passing through them. As shown in Figure 3 and Figure 4, each MPP holder was able to hold 20 electrodes. The latter were disposed vertically in four lines (L1 to L4) and horizontally, concentrically, and cross-wise in five plateaus (P1 to P5) of four electrodes each (Figure 4a,b). Each MPP was equipped with sealed stopcocks and sampling cannulas for optimized Cox pore water filling, sampling, or emptying. MPP-1 and MPP-2 holders were fed in series and in an ascending direction of circulation (Figure 3a,b), with a continuous flowrate of Cox pore water, fixed by a flow controller at 2.5 mL/h (60 g/day), and remained constant for 180 days. The internal volume of each MPP, when electrodes were inserted, was about 80 mL, meaning that the MPP volume was renewed every 32 h (1.33 days). The total eluted volume through the MPPs was 10.92 L, which corresponds to about 136.5 column volumes (flushings) in 180 days. The water circuit ended in a hermetically sealed Tedlar bag, which weighed the water by a precision balance connected to a data acquisition system (DAS).
An electrochemical triplet was used only for electrochemical corrosion measurement (Figure 4b). Located on plateau P3 of MPP-2, it consisted of a solid reference electrode, AgCl(s)/Ag, named AgCl0 [31], designed for long-term use as a reference electrode (RE); a platinum electrode as a counter electrode (CE); and a X65 as a working electrode (WE) exposed to the external electrochemical disturbances.
Several all-solid electrodes of the MPP-2 holder were used to investigate the chemical parameters of the natural Cox pore water. Among them, one platinum, for redox potential measurement; three AgCl(s)/Ag, named AgCl1, AgCl2, and AgCl3, for demonstrating their robustness as all-solid reference electrodes; three Ag2S/Ag, named Ag2S, for S(-II) selective detection and quantification; two iridium for redox measurement, similarly to the Platinum electrode; two Sb2O3/Sb, named Sb, for pH determination after conversion of their potentials; two FeS2, to discern their proper behavior; and two Inox, for other electrochemical behaviors, were monitored versus the AgCl1 reference electrode.
Another X65, called the free electrode and located on plateau P2 (Figure 4b left), was used as the control electrode, remaining without external electrochemical disturbances. Only its OCP was measured versus AgCl1.
The OCP of all AgCl solid reference electrodes was monitored versus the AgCl/Ag internal reference of an E-514-pH electrode, which is known as a “without glycerol pH electrode”, from Scan Messtechnik GmbH (Brigittagasse, Austria). All potentials were converted properly versus SHE by taking into account the measured temperature evolution versus time.
The MPPs and all solid electrodes were designed to be hermetically sealed to avoid any gas or liquid exchange between the insides of the MPPs and the air atmosphere. The glass frit of the commercial reference electrodes was the only weak point, allowing gas exchange with the air atmosphere of the galleries. The continuous Cox water supply, which exerted back pressure, limited the atmospheric dioxygen diffusion through the glass frit of commercial electrodes. Obtaining anoxic conditions should clearly demonstrates the limitation of the dioxygen diffusion through the glass frit of commercial electrodes.
For technical reasons, such as (i) avoiding any degassing between the sealed borehole and the MPPs and (ii) preventing sudden pressure drops into the sealed borehole, the MPPs were initially filled with oxygenated natural Cox pore water. Before the start of the experiment, this oxygenated natural Cox pore water was replaced by 160 mL of natural Cox pore water coming from the sealed borehole that corresponded to one column volume. Five column volumes would have been suitable to renew the initial volume of water. Unfortunately, such a large water supply was not available all at once, as Cox is a water-saturated environment with extremely low permeability, porosity, and hydraulic conductivity. This water was progressively renewed by the natural Cox pore water coming from the sealed borehole, while preserving its original composition in equilibrium with its rock gases (CO2, CH4, N2, and H2S).

2.3.2. Electrochemical Apparatuses, pH Meters, and Data Logger

A potentiostat–galvanostat impedance meter, VersaStudio 4000A (Ametek, Berwyn, PA, USA) using classical electrochemical techniques was connected to an isolated electrochemical triplet present in MPP-2 plateau 3 (P3). Two WTW pH-meters (delivering output signals in volts for temperature and pH) were used, one per MPP, and connected to a 3700A DAS (Keithley Instruments, Cleveland, OH, USA) handled by a computer via KickStart-2 software.
Temperature probes were located into the cupboard, outside the MPPs, but close to the MPP external surface. Their temperatures were supposed to be equal to the one inside MPP-2. Forced atmospheric air from the surface vertically passed through a vertical 500 m well to ventilate and oxygenate the URL galleries. Whatever the season, air was injected at the ambient surface temperature, without conditioning. Our experiment began on 24 February 2022 and was stopped on 9 September 2022. The ambient temperature of the URL conditioned the cupboard temperature, to which the heat released by the measuring instruments located into the cupboard could be added.
Periods without measurements were encountered when electronic remote connection with the instrumentation was lost, whereas the instruments functioned continuously. The temporary files that contained the corresponding data were definitively lost. For technical reasons, at day 145, the flow controller was cut off for one day. The variations in all of the electrode potentials observed between 145 and 150 days were attributed to the flow rate disturbance.

2.3.3. Electrochemical Techniques

The corrosion of the X65 WE electrode of the triplet in contact with the natural Cox pore water was monitored using three main electrochemical techniques: LPR, VaOCP, and EIS.
LPR was measured by polarizing the X65 electrode at ±20 mV around OCP at a scan rate of 0.1 mV/s. VaOCP consisted of polarizing the X65 electrode at ±50 mV at a scan rate of 0.16 mV/s. Impedance measurements by EIS were performed at OCP over a frequency range of 1 MHz to 1 mHz, using perturbation signals with an amplitude of 10 mV.
We used a set of these three techniques in this order, preceded and followed by OCP measurements, and delays between the techniques. This set was realized automatically for a fixed number of loops. When the fixed number of loops was accomplished, the system stopped automatically; it required restarting to perform another series of loops. Within this work, the system was performing measurements for more than half of the total time.
The corrosion current density, CCR or Jcorr, ref. [33,34], was determined from the electrochemical measurements of the polarization resistance Rp by LPR, VaOPC, or EIS [35,36].
Knowing Rp measured from LPR, Jcorr was calculated using the Stern–Geary equation (Equation (1)) [37,38]:
J c o r r = B R p A = β a β c ln 10 ( β a + β c ) 1 R p A
where Jcorr is the corrosion current density (A/m2), B is the Stern–Geary constant (V), Rp is the polarization resistance (Ω), A is the exposed (polarized) surface of steel (m2), and βa and βc are the anodic and cathodic Tafel constants (V), respectively. Although this can be rapidly and easily observed, the Jcorr values could be unrealistic for continuous corrosion monitoring because the exchange current was obtained by fitting the anodic and cathodic branches of the current-overpotential curve [39]. This is why Tafel plots were banished from this long-term study and replaced by VaOCP, from which βa and βc were obtained.
The analysis of Nyquist plots of EIS measurements showed equivalent electrical circuits (EEC), revealing and explaining the interactions occurring on the steel surface. From EIS, the Rp was obtained by fitting the suitable equivalent circuit. Then, βa and βc were required for Stern–Geary constant B. The βa and βc were obtained by VaOCP.
As evident from the above observations, only VaOCP was a self-sufficient measurement for obtaining CCD, while LPR and EIS still relied on VaOCP. Thus, the error in VaOCP was also introduced to results based on LPR and EIS.
All of these techniques have been largely investigated and validated under laboratory conditions, more specifically for uniform corrosion. At the end of the immersion, the CCDs of the electrodes were obtained and converted to corrosion rates (thicknesses) in mm/year. These corrosion rates, accompanying the overall corrosion reaction during immersion, will be compared and discussed in relation to the conditions within the aqueous medium.

2.3.4. Gravimetric or Mass Loss Technique

The gravimetric technique for estimating corrosion thickness loss was based on the experimental determination of weight loss and surface area of carbon steel profile samples after attack by the corrosive environment. ASTM G1-90 was the standard norm applied for this analysis. The detailed procedure is described in references [40,41,42,43]. Weight loss was obtained after removing corrosion products by chemical treatment, including an inhibitor in the solution to avoid over-oxidation of the metal surface once the corrosion products were fully removed. From the gravimetric experiment, the corrosion thickness loss equation CRg (mm/year, Equation (2)) was obtained from the relationship between weight loss Wloss (in g) and the volumetric mass (or density) of the iron ρ (0.00785 g/mm3), exposed surface area of specimen S (in mm2), and immersion time T (in years):
C R g = W l o s s ρ T S

3. Results

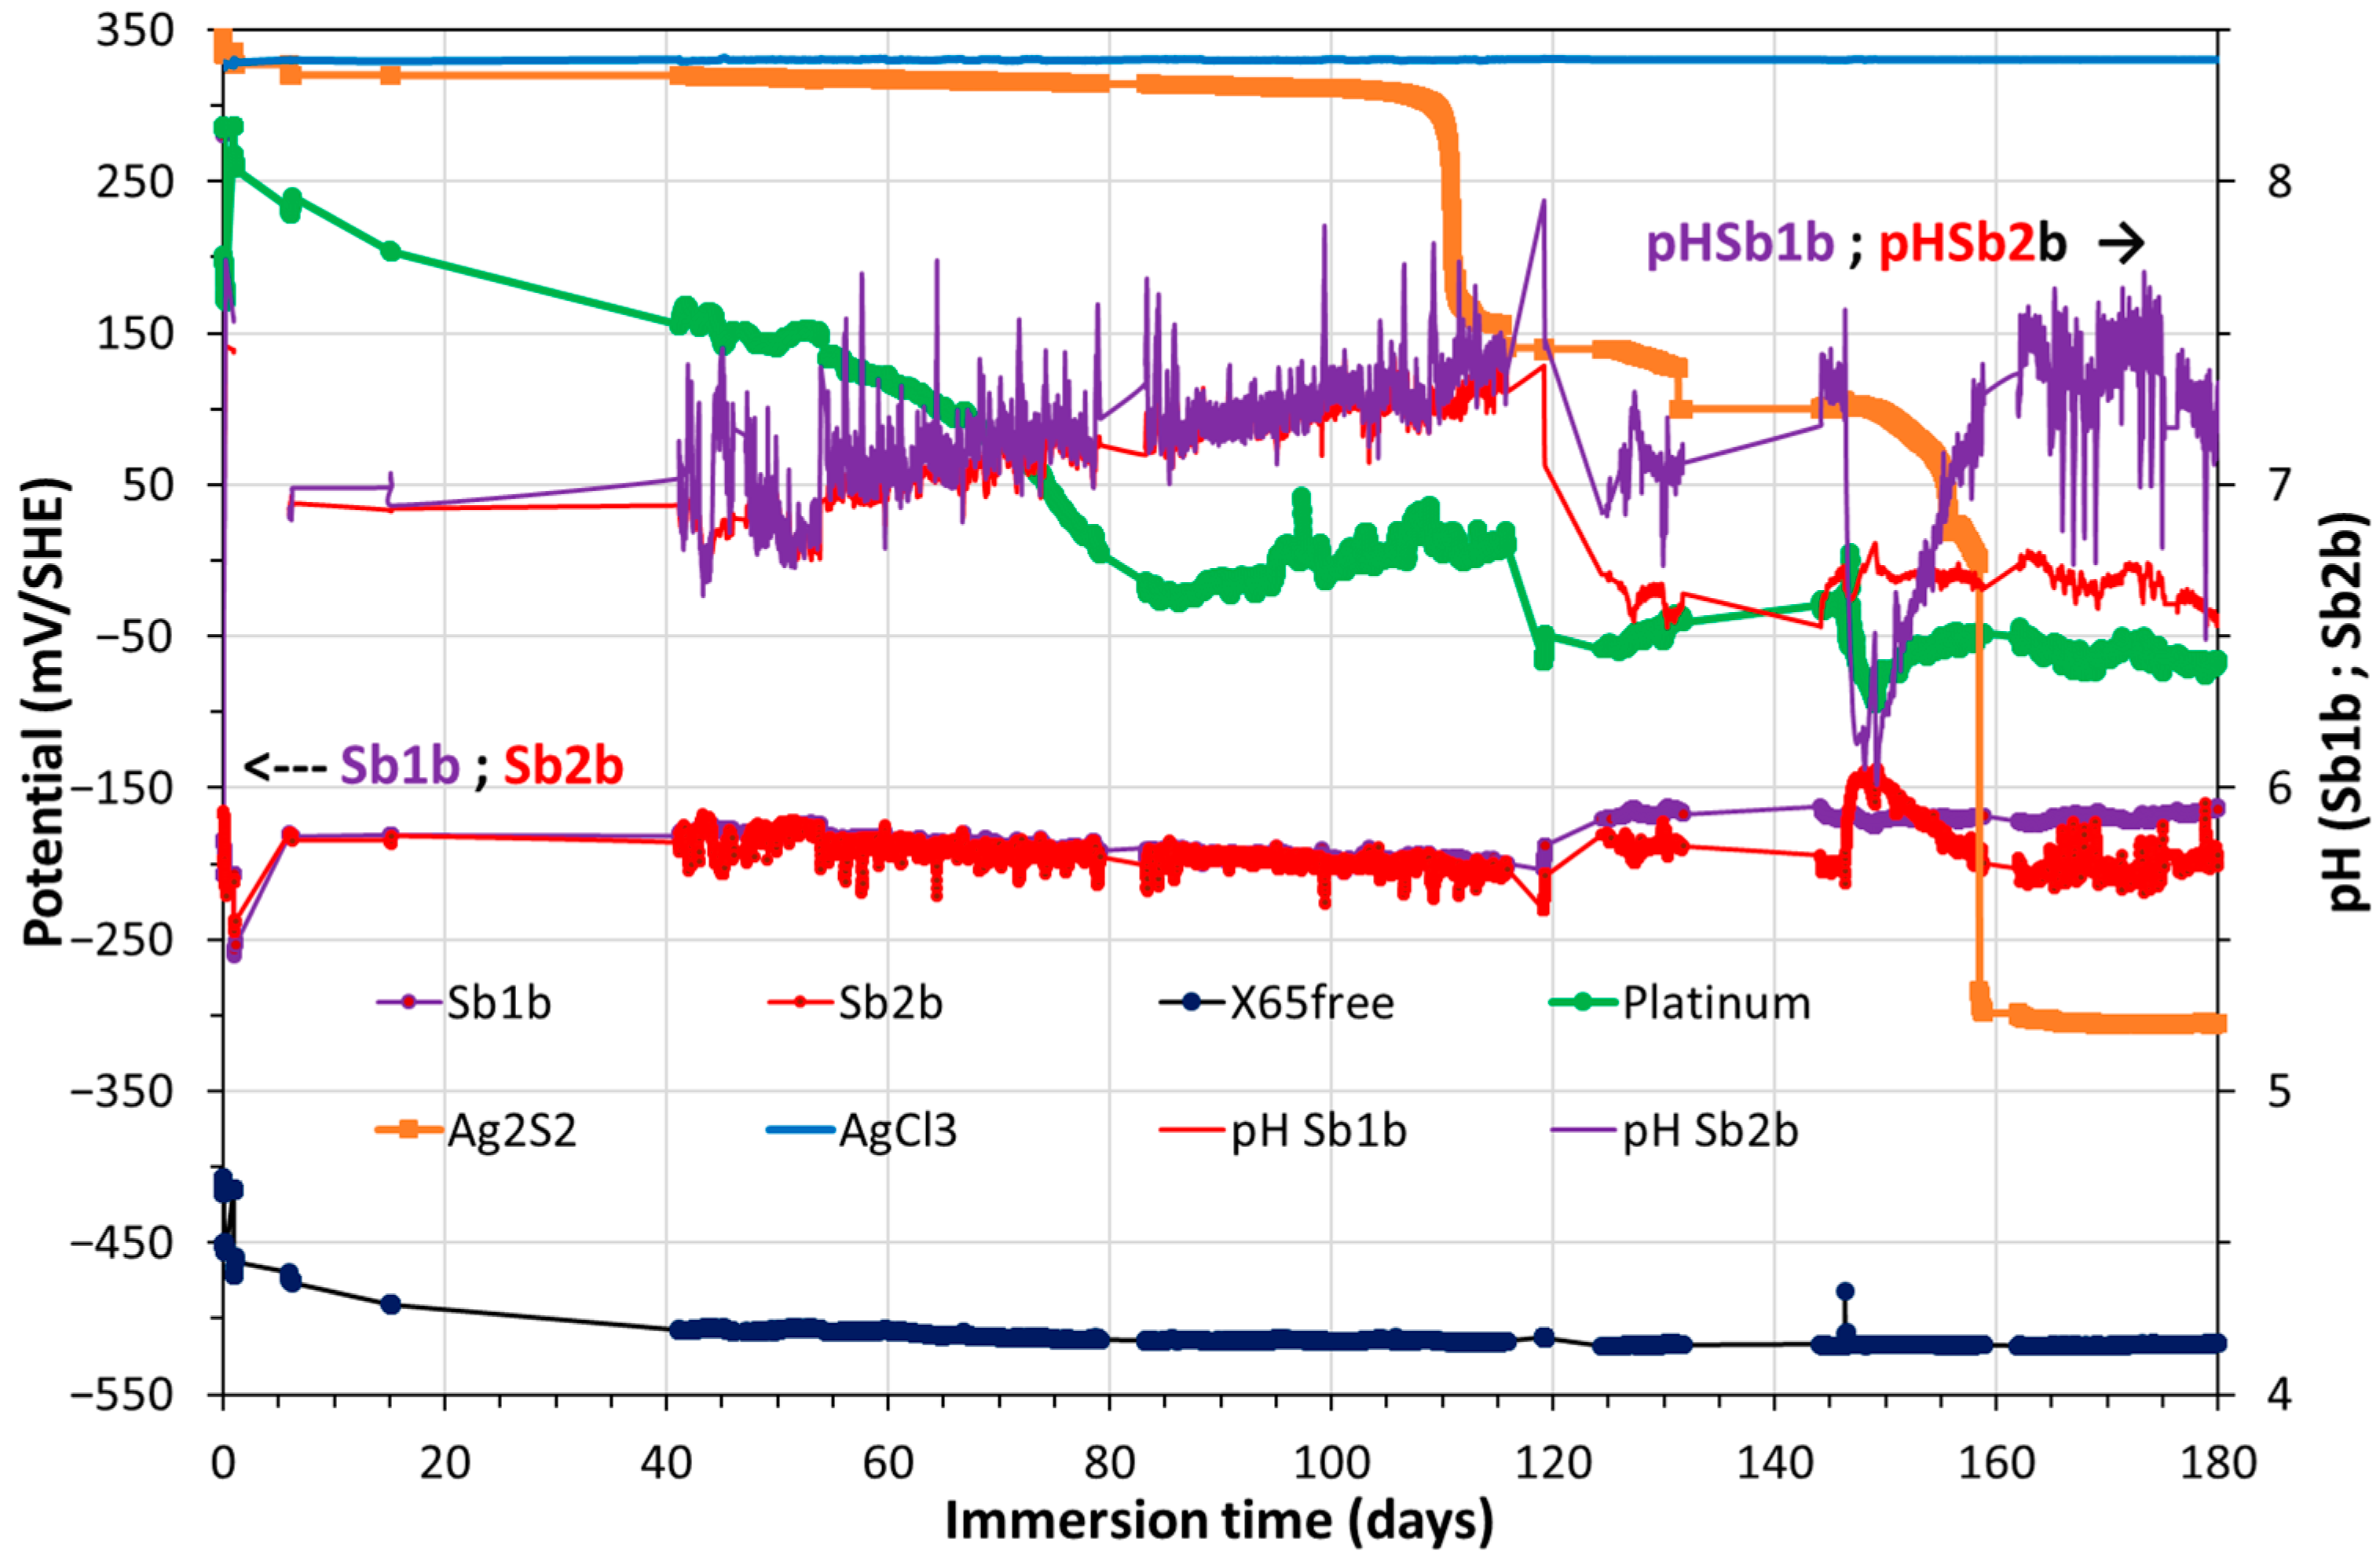
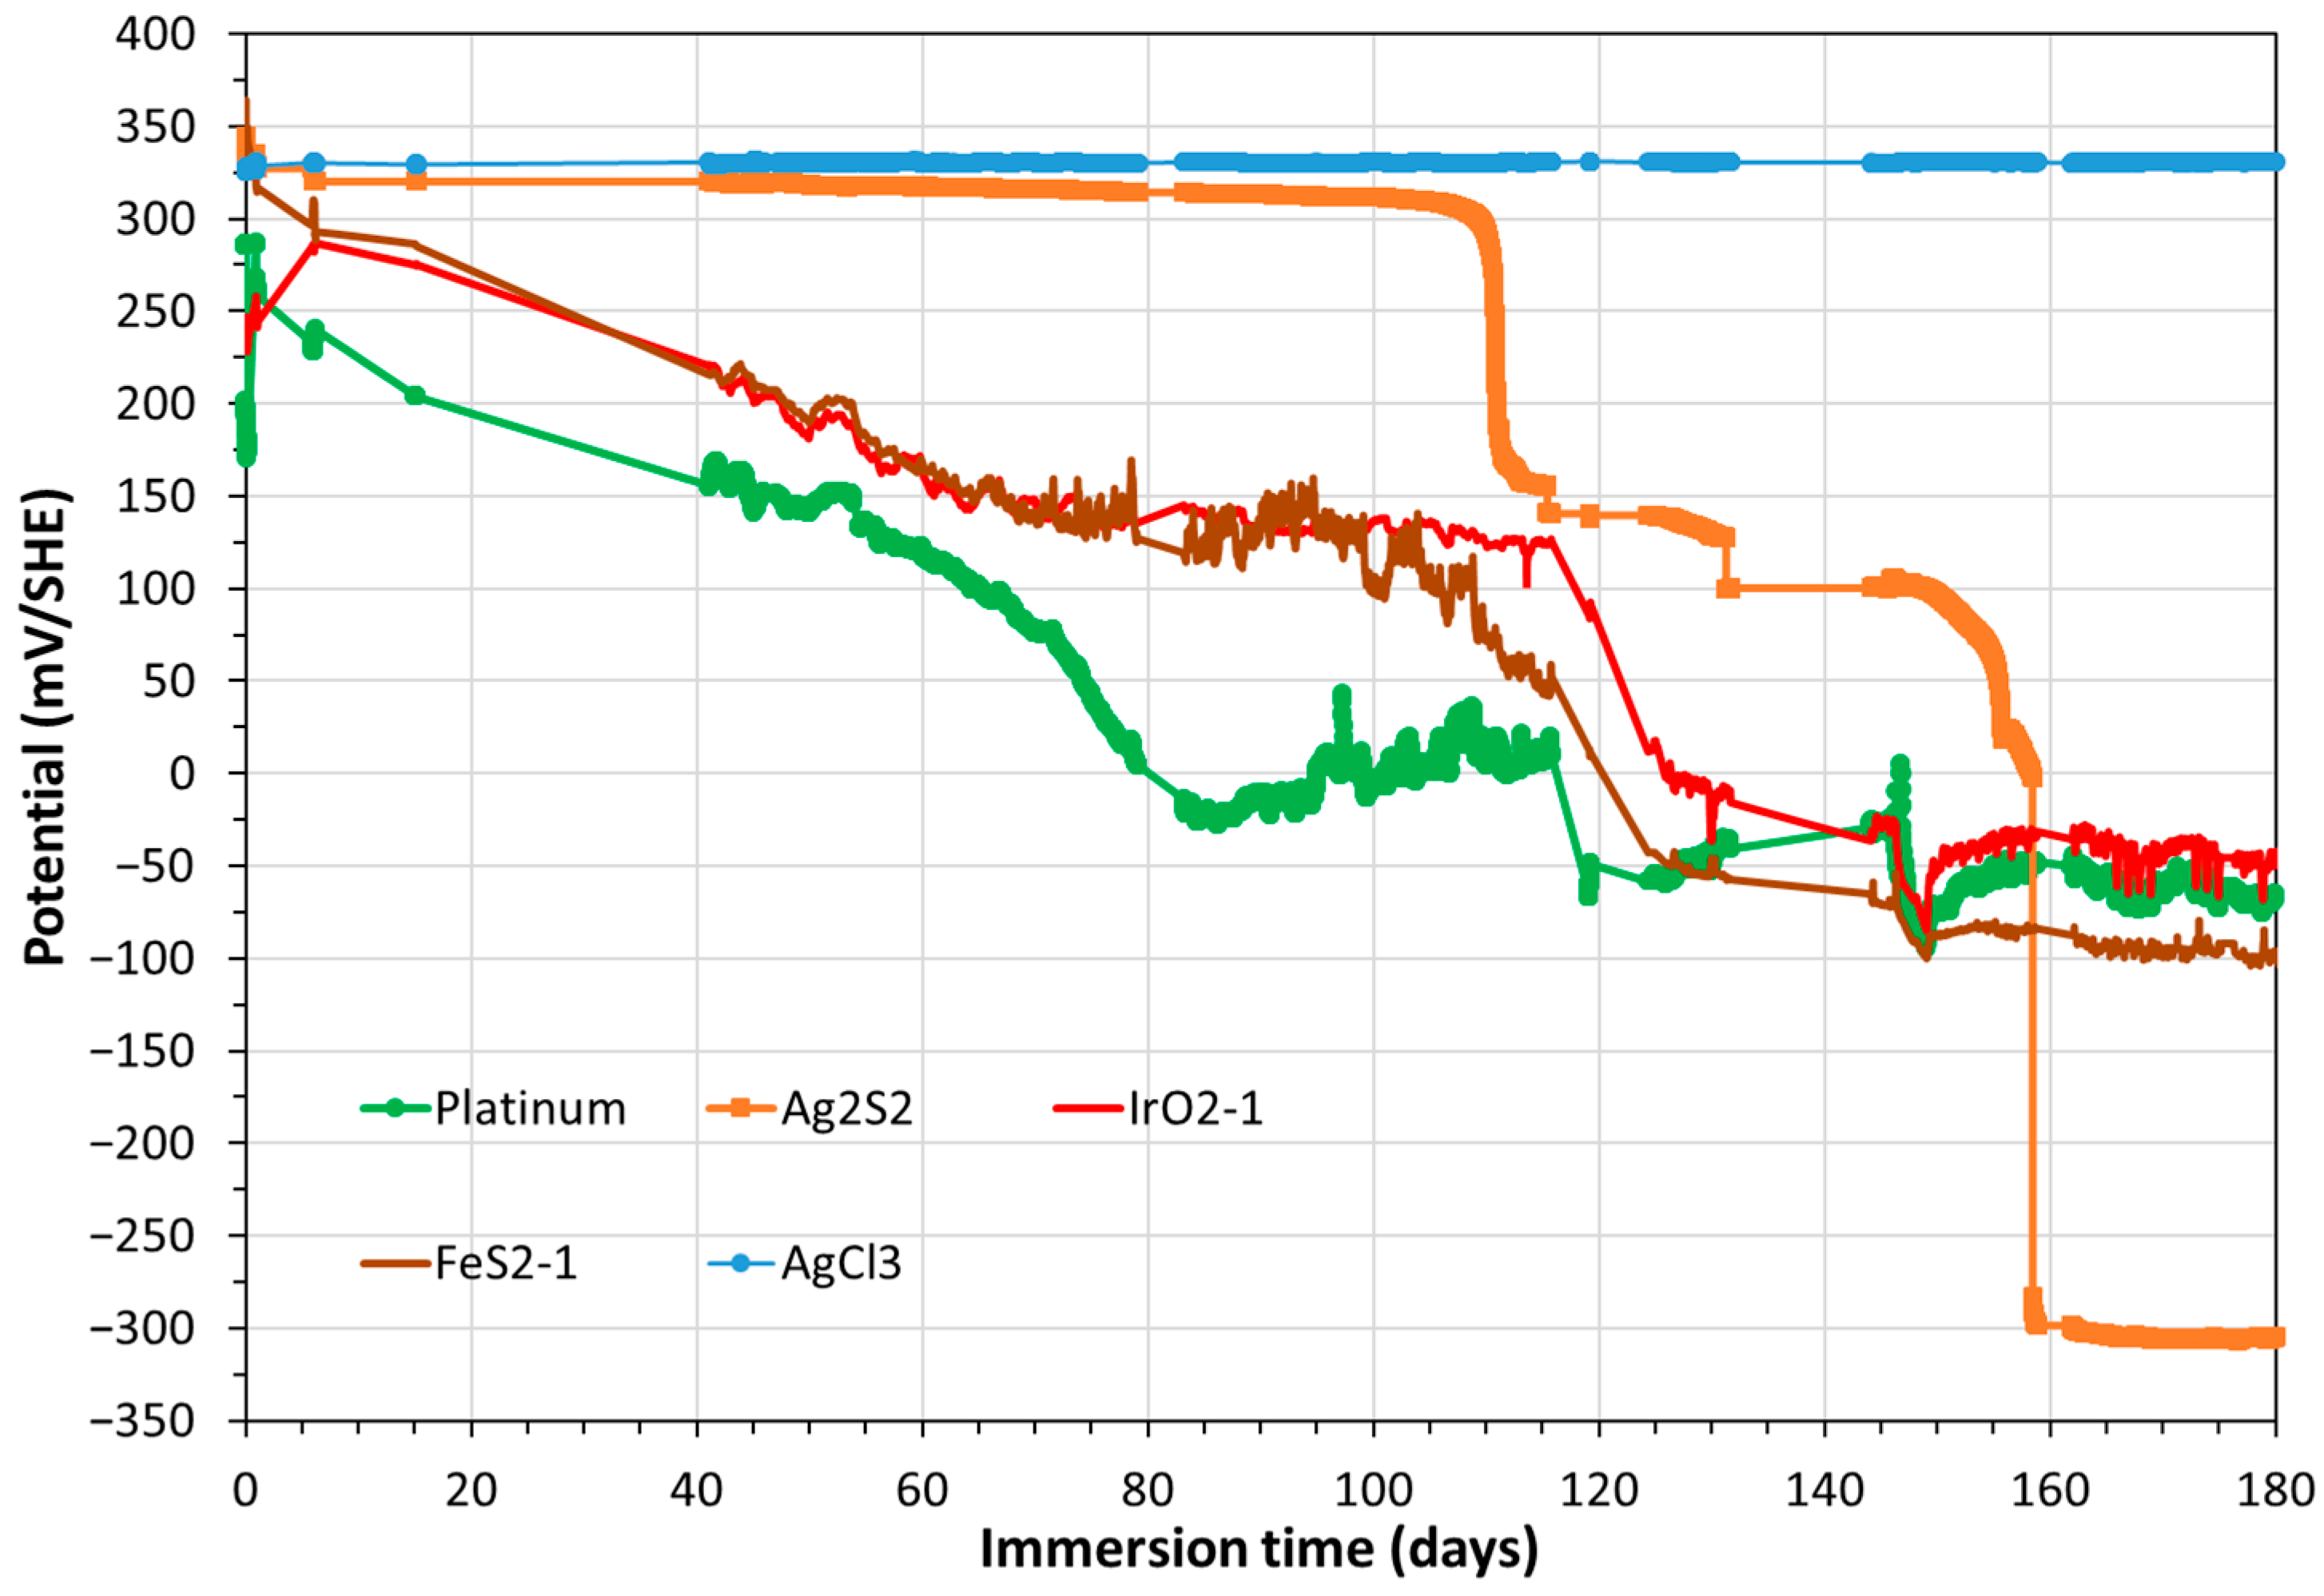
3.1. Monitoring of Temperature and OCP of Solid Reference Ag/AgCl Electrodes into MPP-2

The temperature in the cupboard ranged between 24 and 35 °C (Figure A1 in Appendix B).
The temporal variation, over 180 days, of potential values (mV) of AgCl1(s); AgCl2(s); AgCl3(s) vs. SHE and AgCl2(s); and AgCl3(s) vs. AgCl1(s) (see Figure A2, Appendix B) showed great stability and robustness of all handmade Ag/AgCl(s) solid reference electrodes over 180 days.

3.2. Monitoring of OCP of Solid Electrodes, Including CS-X65 Free, into MPP-2

Figure 5 shows the temporal variations of OCP recorded for the platinum electrode (green line); platinum was the most sensitive electrode in the measurement of the redox equilibria into aqueous solutions. The platinum OCP decreased progressively versus time to reach a constant value of about −25 mV/SHE until reaching 85 days, then decreased again until reaching 115 days to stabilize at −50 mV/SHE at pH 7; this will be discussed later in this paper. At day 40, it reached +150 mV/SHE at pH 7, where, in agreement with the potential versus pH calibration curves previously realized in a glove box, under a controlled atmosphere with pCO2 = 8.10−3 atm and pO2 ≈ 10−6 atm [31], anoxic conditions occurred and persisted until the end of the experiment.
Figure 5 also shows the temporal variations of OCP recorded for the Sb electrode (red and purple lines); Sb was the most sensitive solid electrode for pH measurement via the Sb2O3/Sb redox couple, according to Sb2O3(s) + 6H+ + 6e ↔ 2Sb(s) + 3H2O [31].
In the same Figure 5, the conversion of OCP of Sb electrodes to pH values (Figure 5, red and purple lines) is demonstrated, according to a previous study conducted at atmospheric pressure and/or in a glove box (pCO2 = 8.10−3 atm; pO2 ≈ 10−6 atm) [31].
Figure 6 presents the OCP temporal variations of three other electrodes (AgCl3, IrO2, and FeS2) in addition to platinum and Ag2S.
Figure 7 shows the OCPs of platinum, Ag2S, Sb2O3, AgCl3(s) and X65 free vs. pH over 180 days in a Pourbaix-type diagram. A straight line from −360 mV to −600 mV indicates the lower stability limit of water (H+/H2).
Figure 8 shows Sb2O3/Sb and PtO/Pt calibration curves under atmospheric pressure (pO2 = 0.2 atm; black symbols) and in a glove box (pCO2 = 8.10−3 atm and pO2 = 10−6 atm; gray symbols) at 25 °C, where O2/H2O was the unique redox couple. In Figure 8, the rectangle-shaped boxes show the OCP variations of PtO/Pt (−100; 300 mV/SHE) in green color, and of Sb2O3/Sb (−130; −240 mV/SHE) in red, as a function of pH values (6.45; 7.48) provided by Sb electrodes. The values shown in the green rectangle-shaped box further confirm the initial micro-oxic (pO2~0.07 atm) and even the anoxic conditions of the pore water.
AgCl, which is known to be a chloride-specific electrode, is only influenced by the Cl concentration. Its OCP remains constant over time (Figure 5, Figure 6 and Figure 7).
Ag2S, which is known to be a sulfide-specific electrode, is only influenced by the S(-II) concentration. Its OCP changes versus time (Figure 6). It became particularly sensitive when the concentration of S(-II) reached 10−7 M from day 110. The S(-II) content was calculated by using calibration curves of OCP values of Ag2S/Ag electrodes versus pH at different total concentrations of S(-II) (at pH 7, EAg2S/Ag~−300 mV/SHE for total S(-II) equal to 10−6 M) [31]. The same phenomenon was observed in MPP-1 (see Figure A3 in Appendix B). Then, from day 90 onward, the sulfide content entering into MPP-2 was 0.03206 mg/L (or 10−6 M of sulfide). This 10−6 M sulfide content was reached in MPP-2 on day 159.
From day 40 onward, the continuous arrival of S(-II) sensitively impacted the OCP of platinum. This is why, in Figure 7, contrary to Figure 8, the OCP of the platinum electrode did not vary linearly according to pH because its OCP was a mixed potential, the value of which is controlled by oxygen and sulfur species redox couples, O2/H2O until day 40, and S(IV)/S(-II) at −50 mV/SHE and a pH value 7.0 ± 0.5. In MPP2, the OCP of platinum is never fixed by the S(VI)/S(-II) redox couple, since if this was the case, the OCP value was expected to reach about −200 mV/SHE at pH 7.0 ± 0.5. A similar, but somewhat delayed, behavior was observed for the IrO2-1 and FeS2-1 electrodes.
Figure 5 shows that the OCP of X65free reached a value of −450 mV/SHE a few hours after its immersion. Its OCP decreased versus time to reach a stabilized value around −520 mV/SHE for pH values ranging from 6.45 to 7.48. Please note that the values of X65 free potential vs. pH in Figure 7 surround the water limit line. The OCP–pH values show that the corroding metal (X65) was partly close to its immunity domain (thermodynamically stable), or to one of very low corrosion.

3.3. Electrochemical Corrosion Measurements on the Triplet, Including the CS-X65 Working Electrode

Figure 9 shows the temporal variation of the OCP of X65 WE electrode vs. SHE over 180 days. It clearly identifies the periods of polarizations applied to X65 WE by the three electrochemical techniques for corrosion measurements, the most disturbing one being VaOCP at ±50 mV/OCP of X65 WE. It also makes it possible to assess the impact of the electrochemical measurements on the X65 WE. The comparison between the OCP values provided by X65 WE and X65 free after electrochemical loops shows that the OCP values of the X65 WE agreed with those measured by X65 free, i.e., the electrochemical methodology developed during this work appears non-disturbing for a better insight into the corrosion rate measurement.
Analyses of the impedance diagrams in Nyquist plots, obtained by EIS at the start of the experiments, showed only one capacitive loop corresponding to a Randles electrical equivalent circuit model Re(Q/Rp) (Figure 10a,b). Re and Rp are the electrolyte resistance and the polarization resistance, respectively. The flattened shape of the capacitive loop shows a frequency dispersion, represented here by a pseudo capacitance, Q, or a constant-phase element (CPE). Additionally, the degree of flattening of the loop depends on the interfacial boundary conditions of the admittance equation Y° = Qn, where the exponent n is relative to the dispersive character of the interface. This means that, with an exponent n = 1, the CPE is purely capacitive, while n = 0 represents purely resistive contributions. The n values remained constant, around 0.8, over 180 days, and the cutoff frequency was close to 3 Hz.
Figure 11 shows the temporal variation of the diameter of the capacitive loop, given by the Rp value. It appears that the system became increasingly resistive over the first 20 days of immersion, showing a significant decrease in the corrosion rate. Then, very abruptly, the size of the diameter returned to that of the first days, stabilizing after 50–55 days. This corrosion phase is highlighted in the high-frequency part of the Nyquist plot on Figure 10a,b. It was associated with an additional phenomenon of the X65-Cox pore water interface in the form of another capacitive loop, the cut-off frequency of which was close to 630 kHz.
It should also be noted that the loop of the charge transfer was increasingly incomplete from the fourth month of immersion in Cox pore water.
The value of electrolyte Re also varies, decreasing from 87 ohms at the beginning of the experiment to 72 ohms at the end (Figure 10b). This variation, obtained throughout the measurements, thus represents a real, but very weak, continuous increase in the conductivity of the water of MPP-2, the electrodes being rigid and motionless. This conductivity variation does not correlate with the variation in the corrosion current densities; other phenomena are more important, such as the accumulation of ions and some solids in suspension in the lower part of MMP-2.
To calculate the corrosion current density, CCD or Jcorr, the Stern–Geary parameter B value, is needed (see Equation (1)). B was obtained by VaOCP, assessed at each point, and was found to vary from 18 to 13 mV (average value 14 mV), thus allowing for the determination of the “instantaneous” CCD and the “instantaneous” corrosion rate CR (mm/year) of the carbon steel over 180 days, following Equation (3).
C R = 31.54 × 10 7 M J c o r r z F ρ S
where M is the molar mass of Fe (g/mol); Jcorr is the CCD (A); z is the number of exchanged electrons (for Fe° oxidation z equals 2); F is Faradic constant (C/mol e); ρ is the iron density (g/cm3); and S is the exposed surface area (cm2).
Figure 12 shows the evolution of CCDs (left axis in µA/cm2) and corrosion rates (right axis in mm/year) of X65 as a function of time over 180 days, determined by three different electrochemical techniques.
By integrating the CCDs of Figure 12, the cumulated thickness loss, (CTL, in mm) was calculated as a function of time between 0 and 0.5 years (Figure 13).
In Figure 13, considering a linear extrapolation of the CTLs (mm/year) obtained during the last exposure period (0.3–0.5 year) up to 1 year, the corrosion rates obtained at 1 year, in mm/year, were:
CTLEIS (mm/year) = 0.0220; CTLLPR (mg/year) = 0.0270; CTLVaOCP (mm/year) = 0.0325.
The average corrosion rate was calculated as 0.0272 mm/year, with an average standard deviation of 0.0027 mm/year.
In Figure 13, by multiplying the end values of the CTLs (mm/year) obtained for 0.5 years by 2, the corrosion rates at 1 year were found, in mm/year, as follows:
CLTEIS (mm/year) = 0.0210; CLRLPR (mm/year) = 0.0240; CTLVaOCP (mm/year) = 0.0300.
The average corrosion rate was calculated as 0.025 mm/year, with an average standard deviation of 0.0025 mm/year.

3.4. Mass Loss Corrosion Measurements on the CS-X65 Electrode (Working and Free)

By applying the method of mass loss (weighing the electrodes before and after exposition for 180 days and desquamation) and according to Equation (2), where T equals 0.5 year and S equals 64 mm2, Wloss is 8.0 mg and 4.0 mg for X65 WE and X65 free, respectively, and the corresponding values of CRg or corrosion thickness loss are 0.032 mm/year and 0.016 mm/year, respectively. This is an important indication regarding the corrosion of the electrochemically perturbed sample: its corrosion is twice as large as that of the undisturbed one. These values, when compared to those of Figure 13, are close. These averaged corrosion rates were estimated considering that corrosion is uniform.

4. Discussion

The electrode potentials vs. time, provided continuously by the probes shown in Figure 5 and Figure 6, but also these potentials vs. pH in Figure 7, allowed us to identify the changes in Cox pore water in contact with the X65 over 180 days. The total duration of this contact can be divided into two main periods.
The first period, from 0 to 40 days, is characterized by micro-oxic pore water (pO2~0.07 atm). The potential values of the platinum probe (and those of the other probes) highlight that the initially micro-oxic water progressively became anoxic.
The second period, from day 40 to 180, is characterized by anoxic water, passing from the total absence of O2 to a progressive presence of hydrogen sulfide. The increase in the S(-II) content is demonstrated by the decreasing OCP values of Ag2S probe, which is an ion-selective electrode for sulfide. Indeed, the OCP values of the Ag2S probe initially showed a slight, but constant, decrease, as well as a staircase phenomenon after 110 days, and then again at around 159 days. From this last day onward, the sulfide content reached 10−6 M (EAg2S/Ag = −300 mV/SHE at pH 7).
These previously mentioned elements help us to understand the variations in CCDs, CRs, or CTLs, which could be estimated thanks to the three electrochemical techniques (Figure 12 and Figure 13).
During the first period, before day 40, all three CCDs (and CRs) decreased sharply in the first hours (Figure 12), remaining stable afterwards. The CCDs values from EIS and LPR were especially close during these first 40 days. This situation seems to correspond to an oxidant limitation and a protective deposit on the X65 surface. The dissolved dioxygen concentration was depleted progressively over time, as shown by the OCP values of the electrodes (Figure 5, Figure 6 and Figure 7), and an anoxic state was reached after 40 days of immersion. The CCD drop in the first ten days of immersion (matching to a strong increase of Rp) corresponded to the formation of a pseudo-passive layer generated by various iron oxides. The iron corrosion came from the reduction in dissolved dioxygen confined in the water (reaction (A2) in Appendix A), as shown by reaction (A4) in Appendix A. The high and constant n values of the dispersive character of the interface show the rather homogeneous characteristics of the layer generated by iron oxidation, and, thus, its protective role for X65 during the first 40 days.
During the second period, after day 40, all three CCDs (and CRs) increased progressively before stabilizing between 2 and 3 µA/cm2, without any change in the flow rate or another apparent operating condition, except temperature (see temperature evolution in Figure A1 in Appendix B). However, there was no correlation between small temperature variations and CCD values. This drastic change in CCDs indicated a change in the oxidant nature, and a concomitant corrosion phenomenon and kinetics. The oxidant was H+, according to the half electrochemical reaction ((A5) in Appendix A) and the overall electrochemical reaction (A7) in Appendix A. In parallel, EIS diagrams in Nyquist plots showed that a new interface was formed at high frequencies after 46 days, corresponding to the formation of iron sulfides initially as usual as amorphous iron sulfides, and then as mackinawite [44,45,46,47,48]. These sulfides, in turn, acted as a pseudo-protective layer for the X65, thus stabilizing the CCD.
Figure 12 shows that the CCD values (in µA/cm2) obtained with the three techniques were close to one another. Their initial slight divergence began in the third month and increased progressively, with an EIS value lower than the LPR and VaOCP ones. The greatest difference between LPR and EIS was 15%, 4 months after the start of the experiments. Between 165 and 180 days, the measured CCDs fluctuated within 1.8 µA/cm2 (EIS), 2.8 µA/cm2 (LPR) and 3.0 µA/cm2 (VaOCP), or a difference of 40% between the two extreme values. The reason for this difference is that the impedance signals became less accurate over time. Indeed, the capacitive loops at low frequencies were less and less well-defined. The Rp values were, thus, obtained by extrapolation from the beginning of the arc. The noted divergence, which gradually increased between the two methods over the last two months, is proof that the EEC model Re(Q1Rp) was incomplete for the end of the experiment.

5. Conclusions

A large-scale study was conducted at the Bure Underground Research Laboratory (URL), where a continuous monitoring of the geochemical parameters of the natural Cox pore water was achieved at the same time that long-term corrosion was assessed. The objective of this work was to demonstrate, on site, the reliability of our developed electrochemical methodology for continuous monitoring of the corrosion kinetics of the API 5L X65 carbon steel when used as an HLRW metallic liner material.
This study highlights the information needed for electrochemical monitoring of the corrosion of carbon steel. We have constantly and preferentially used solid reference electrodes for measuring the OCP values of different all-solid selected materials and determining the pH, redox-potential, S(-II) content, and OCP of X65. We used standard electrochemical methods which were selected, tested, and validated here for measuring the corrosion parameters of X65 for 180 days while in contact with natural Cox pore water in equilibrium with its rock gases (CO2, CH4, N2, and H2S).
The combination of potentiometric and electrochemical techniques helped us to evaluate our measurements at all points over 180 days, explaining the corrosion phenomena and elucidating the corrosion kinetics for X65 carbon steel in contact with Cox pore water, in terms of CCDs (µA/cm2), CRs (mm/year), and CTL (mm), as a function of time.
The utilized materials and techniques were validated. The use of various electrodes, especially the reference ones, showed great stability over long durations under the investigated conditions, with reliable and robust results. Moreover, the use of a steel control probe and its comparison with a working electrode of the same material proved that disturbances linked to regular electrochemical measurements have no impact on its behavior or the value of its OCP. Regarding the electrochemical techniques, VaOCP, IES, and LP obtained very similar results in terms of CCDs over 180 days. The VaOCP method had the advantage of determining the Stern–Geary parameter without disturbing the steel interface, thanks to a weak over-potential polarization. The EIS and LPR methods provided suitable CCD values as well.
Regarding the corrosion mechanism, we showed that—under the investigated conditions—corrosion occurred during the first 40 days due to the presence of oxygen. A protective layer formed very rapidly on the steel surface. The oxygen in the water and the promotion of H+ as the new oxidant provoked, from day 40 onward, an increase in the corrosion rate concomitantly with the progressive increase in S(-II), leading to iron sulfide precipitation and stabilization of the CCDs.
The average (electrochemical) corrosion rates, obtained at 0.5 years and extrapolated to 1 year, fluctuated between 0.0210 and 0.0272 mm/year. The gravimetrically obtained corrosion thickness loss rate for disturbed X65 was found to be 0.032 mm/year, twice that of its unperturbed counterpart (0.016 mm/year).
The developed electrochemical method opens up particularly interesting prospects for deployment in the ASFM, which constitutes a more complex matrix, and in which carbonate and chloride ions, as well as sulfur species (sulfate, thiosulfate, sulfide, and polysulfide), are the most aggressive species under anoxic conditions.

Author Contributions

I.I. and K.G.S. are co-directors of the doctoral thesis of Y.C.S.M. Conceptualization, S.B., J.B. and I.I.; methodology, all authors; software, all authors; validation, all authors; formal analysis, all authors; investigation, all authors; data curation, all authors; writing—original draft preparation, Y.C.S.M. and I.I.; writing—review and editing, all authors; visualization, all authors; supervision, S.B., J.B., K.G.S. and I.I.; project administration, J.B. and I.I.; funding acquisition, S.B., J.B. and I.I. All authors have read and agreed to the published version of the manuscript.

Funding

Part of this work was supported by the French National Agency for Radioactive Waste Management (Andra) as part of the PhD thesis of M. Sano Moyeme. This research also was funded by BRGM and Andra in the framework of the CINECOR project (2020–2023), grant numbers 20080531 for Andra-UT3 and 20080523 for Andra-BRGM, and also in the framework of the VITCOR project (2020–2023), grant number 20081088 for Andra-BRGM.

Data Availability Statement

The data presented in this study are available upon request from the corresponding authors.

Acknowledgments

The authors thank Melanie Lundy, Myriam Agnel, Yannick Linard, Patrick Delage, and Philippe Tabani for substantial assistance during the experiment at the Underground Research Laboratory of Andra in Bure, France. The authors thank SCODIP, from Orleans, France (Yannik Legueunic), for fabricating the electrodes, and SOLEXPERT from Vandoeuvre-les-Nancy, France, for manufacturing the multi-parameter devices. H.M. Kluijver revised the English version of the MS.

Conflicts of Interest

The authors declare no conflict of interest.

Appendix A

General and basic knowledge on the corrosion of Fe° implies oxidation of Fe° to Fe2+, according to the half-electrochemical reaction (A1):
Fe° → Fe2 + 2e
Under oxic aqueous conditions, dissolved oxygen is the oxidant for Fe° (half electrochemical reactions (A2) and (A3)):
O2 + 4H+ + 4e → 2H2O
O2 + 2H2O + 4e → 4OH
An overall electrochemical reaction can be:
2Fe° + O2 + 2H2O → 2Fe2+ + 4OH
Fe2+ can be oxidized to Fe3+, and oxides, such as Fe(OH)3, Fe(OH)2, and Fe3O4 (FeO-Fe2O3), can occur.
Under anoxic aqueous conditions, the oxidant is H+ or H2O (half-electrochemical reactions (A5) and (A6)).
2H+ + 2e → H2(g)
2H2O + 2e → H2(g) + 2OH
Two overall electrochemical reactions can be:
Fe° + 2H+ → Fe2 + H2(g)
or
Fe° + 2H2O → Fe2 + H2(g) + 2OH
Hydrogen sulfide (H2S/HS/S2−) in the solution can yield iron sulfides instead of free Fe2+, or, as a function of pH, its complexes with OH, Fe(OH)2, or other iron oxy-hydroxides.

Appendix B

The difference of 1 or 2 °C between temperatures T1 (MPP1) and T2 (MPP2) can be explained by the positioning of the temperature probes into the cupboard, probe T1 being located near a heat dissipation vein of the data acquisition system.
Figure A1. Temporal variation, over 180 days, of the temperature values in the cupboard close to the MPP-2 external surface, and those supposed to be equal to that of the interior.
Metals 13 00966 g0a1
Figure A2. Temporal variation, over 180 days, of potential values (mV) of AgCl1(s); AgCl2(s); AgCl3(s) vs. SHE and AgCl2(s); and AgCl3(s) vs. AgCl1(s).
Metals 13 00966 g0a2
Figure A3. Temporal variation, over 180 days, of the OCP values (mV/SHE) of two platinum (1 and 2), an Ag/AgCl(s)a (AgCla), and four Ag/Ag2S(s) (Ag2Sa, Ag2Sb, Ag2S4, and Ag2S5) electrodes of the MPP-1.
Metals 13 00966 g0a3

References

  1. Altmann, S. “Geo”chemical research: A key building block for nuclear waste disposal safety cases. J. Contam. Hydrol. 2008, 102, 174–179. [Google Scholar] [CrossRef] [PubMed]
  2. French National Radioactive Waste Management Agency—Andra. Available online: https://international.andra.fr/ (accessed on 2 January 2023).
  3. Han, T.; Shi, J.; Chen, Y.; Li, Z. Effect of chemical corrosion on the mechanical characteristics of parent rocks for nuclear waste storage. Sci. Technol. Nucl. Install. 2016, 2016, 7853787. [Google Scholar] [CrossRef]
  4. Jonsson, M. Radiation effects on materials used in geological repositories for spent nuclear fuel. ISRN Mater. Sci. 2012, 2012, 639520. [Google Scholar] [CrossRef]
  5. Gaucher, E.C.; Robelin, C.; Matray, J.M.; Négrel, G.; Gros, Y.; Heitz, J.F.; Vinsot, A.; Rebours, H.; Cassagnabère, A.; Bouchet, A. ANDRA underground research laboratory: Interpretation of the mineralogical and geochemical data acquired in the Callovian–Oxfordian formation by investigative drilling. Phys. Chem. Earth 2004, 29, 55–77. [Google Scholar] [CrossRef]
  6. Gaucher, C.; Blanc, P.; Bardot, F.; Braibant, G.; Buschaert, S.; Crouzet, C.; Gautier, A.; Girard, J.-P.; Jacquot, E.; Lassin, A.; et al. Modelling the pore water chemistry of the Callovian-Oxfordian formation at a regional scale. Comptes Rendus Geosci. 2006, 338, 917–930. [Google Scholar] [CrossRef]
  7. Gaucher, E.; Tournassat, C.; Pearson, F.; Blanc, P.; Crouzet, C.; Lerouge, C.; Altmann, S. A robust model for pore-water chemistry of clayrock. Geochimi. Cosmochim. Acta 2009, 73, 6470–6487. [Google Scholar] [CrossRef]
  8. Fernández, A.M.; Sánchez-Ledesma, D.M.; Tournassat, C.; Melón, A.; Gaucher, E.C.; Astudillo, J.; Vinsot, A. Applying the squeezing technique to highly consolidated clayrocks for pore water characterization: Lessons learned from experiments at the Mont Terri Rock Laboratory. Appl. Geochem. 2014, 49, 2–21. [Google Scholar] [CrossRef]
  9. Tournassat, C.; Vinsot, A.; Gaucher, E.C.; Altmann, S. Chapter 3—Chemical conditions in clay-rocks Natural and Engineered Clay Barriers. In Natural and Engineered Clay Barriers, 1st ed.; Tournassat, C., Steefel, C.I., Bourg, I.C., Bergaya, F., Eds.; Elsevier: Amsterdam, The Netherlands, 2015; pp. 71–100. [Google Scholar]
  10. Tournassat, C.; Steefel, C.I.; Bourg, I.C.; Bergaya, F. Chapter 1—Surface Properties of Clay Minerals. In Natural and Engineered Clay Barriers, 1st ed.; Tournassat, C., Steefel, C.I., Bourg, I.C., Bergaya, F., Eds.; Elsevier: Amsterdam, The Netherlands, 2015; pp. 5–31. [Google Scholar]
  11. Vinsot, A.; Appelo, C.; Cailteau, C.; Wechner, S.; Pironon, J.; De Donato, P.; De Cannière, P.; Mettler, S.; Wersin, P.; Gäbler, H.-E. CO2 data on gas and pore water sampled in situ in the Opalinus Clay at the Mont Terri rock laboratory. Phys. Chem. Earth Parts A B C 2008, 33, 54–60. [Google Scholar] [CrossRef]
  12. Vinsot, A.; Mettler, S.; Wechner, S. In situ characterization of the Callovo-Oxfordian pore water composition. Phys. Chem. Earth Parts A B C 2008, 33, S75–S86. [Google Scholar] [CrossRef]
  13. Betelu, S.; Ignatiadis, I.; Tournassat, C. Redox potential measurements in a claystone. In Proceedings of the Clay Conference, Davos, Switzerland, 24–27 September 2017; p. 111. [Google Scholar]
  14. Betelu, S.; Ignatiadis, I.; Tournassat, C. Redox potential measurements in Callovian Oxfordian claystone: Insights into the nature of the mineral(s) responsible for the redox reactivity. In Proceedings of the Clay Conference, Nancy, France, 13–16 June 2022; p. Clay00387. [Google Scholar]
  15. Abramova, E.; Popova, N.; Artemiev, G.; Boldyrev, K.; Kazakov, K.; Kryuchkov, D.; Safonov, A. Biological factors affecting the evolution of safety barrier materials in the Yeniseisky deep geological repository. Eng. Geol. 2023, 312, 106931. [Google Scholar] [CrossRef]
  16. Fernández, A.M.; Kaufhold, S.; Olin, M.; Zheng, L.G.; Wersin, P.; Wilson, J. Editorial for Special Issue “Clay Mineral Transformations after Bentonite/Clayrocks and Heater/Water Interactions from Lab and Large-Scale Tests”. Minerals 2022, 12, 569. [Google Scholar] [CrossRef]
  17. Karthick, S.; Muralidharan, S.; Saraswathy, V. Corrosion performance of mild steel and galvanized iron in clay soil environment. Arab. J. Chem. 2020, 13, 3301–3318. [Google Scholar] [CrossRef]
  18. Schlegel, M.L.; Martin, F.; Fenart, M.; Blanc, C.; Varlet, J.; Foy, E. Corrosion of carbon steel in clay compact environments at 90 °C: Effect of confined conditions. Corros. Sci. 2021, 184, 109368. [Google Scholar] [CrossRef]
  19. Leupin, O.X.; Smart, N.R.; Zhang, Z.; Stefanoni, M.; Angst, U.; Papafotiou, A.; Diomidis, N. Anaerobic corrosion of carbon steel in bentonite: An evolving interface. Corros. Sci. 2021, 187, 109523. [Google Scholar] [CrossRef]
  20. Chaparro, M.C.; Finck, N.; Metz, V.; Geckeis, H. Reactive Transport Modelling of the Long-Term Interaction between Carbon Steel and MX-80 Bentonite at 25 °C. Minerals 2021, 11, 1272. [Google Scholar] [CrossRef]
  21. Shrestha, R.; Černoušek, T.; Stoulil, J.; Kovářová, H.; Sihelská, K.; Špánek, R.; Ševců, A.; Steinová, J. Anaerobic microbial corrosion of carbon steel under conditions relevant for deep geological repository of nuclear waste. Sci. Total Environ. 2021, 800, 149539. [Google Scholar] [CrossRef]
  22. Reddy, B.; Padovani, C.; Smart, N.R.; Rance, A.P.; Cook, A.; Milodowski, A.; Field, L.; Kemp, S.; Diomidis, N. Further results on the in situ anaerobic corrosion of carbon steel and copper in compacted bentonite exposed to natural Opalinus Clay porewater containing native microbial populations. Mater. Corros. 2021, 72, 268–281. [Google Scholar] [CrossRef]
  23. Crusset, D.; Deydier, V.; Necib, S.; Gras, J.M.; Combrade, P.; Féron, D.; Burger, E. Corrosion of carbon steel components in the French high-level waste programme: Evolution of disposal concept and selection of materials. Corros. Eng. Sci. Technol. 2017, 52, 17–24. [Google Scholar] [CrossRef]
  24. Martin, F.A.; Perrin, S.; Bataillon, C. Evaluating the corrosion rate of low alloyed steel in Callovo-Oxfordian clay: Towards a complementary EIS, gravimetric and structural study. MRS Online Proc. Libr. 2012, 1475, 471–476. [Google Scholar] [CrossRef]
  25. Schlegel, M.L.; Necib, S.; Daumas, S.; Blanc, C.; Foy, E.; Trcera, N.; Romaine, A. Microstructural characterization of carbon steel corrosion in clay borehole water under anoxic and transient acidic conditions. Corros. Sci. 2016, 109, 126–144. [Google Scholar] [CrossRef]
  26. Necib, S.; Linard, Y.; Crusset, D.; Schlegel, M.L.; Daumas, S.; Michau, N. Corrosion processes of C-steel in long-term repository conditions. Corros. Eng. Sci. Technol. 2017, 52, 127–130. [Google Scholar] [CrossRef]
  27. Necib, S.; Linard, Y.; Crusset, D.; Michau, N.; Daumas, S.; Burger, E.; Romaine, A.; Schlegel, M.L. Corrosion at the carbon steel clay borehole water and gas interfaces at 85 °C under anoxic and transient acidic conditions. Corros. Sci. 2016, 111, 242–258. [Google Scholar] [CrossRef]
  28. El Hajj, H.; Abdelouas, A.; Grambow, B.; Martin, C.; Dion, M. Microbial corrosion of P235GH steel under geological conditions. Phys. Chem. Earth 2010, 35, 248–253. [Google Scholar] [CrossRef]
  29. El Mendili, C.Y.; Abdelouas, A.; Bardeau, J.F. Corrosion of P235GH carbon steel in simulated Bure soil solution. J. Mater. Environ. Sci. 2013, 4, 786–791. [Google Scholar]
  30. El Mendili, Y.; Abdelouas, A.; Karakurt, G.; Chaou, A.A.; Essehli, R.; Bardeau, J.-F.; Greneche, J.-M. The effect of temperature on carbon steel corrosion under geological conditions. Appl. Geochem. 2015, 52, 76–85. [Google Scholar] [CrossRef]
  31. Daoudi, J.; Betelu, S.; Tzedakis, T.; Bertrand, J.; Ignatiadis, I. A Multi-Parametric Device with Innovative Solid Electrodes for Long-Term Monitoring of pH, Redox-Potential and Conductivity in a Nuclear Waste Repository. Sensors 2017, 17, 1372. [Google Scholar] [CrossRef]
  32. Lundy, M.; Garitte, B.; Lettry, Y.; Vinsot, A. Water Rock Interaction [WRI 14] Experimental design for in situ characterization of the Callovo-Oxfordian pore water composition at 85 °C. Procedia Earth Planet. Sci. 2013, 7, 533–536. [Google Scholar] [CrossRef]
  33. Bard, A.J.; Faulkner, L.R. Electrochemical Methods: Fundamentals & Applications, 2nd ed.; John Wiley & Sons: Hoboken, NJ, USA, 2000; ISBN 978-0-471-04372-0. [Google Scholar]
  34. Rodrigues, R.; Gaboreau, S.; Gance, J.; Ignatiadis, I.; Betelu, S. Reinforced concrete structures: A review of corrosion mechanisms and advances in electrical methods for corrosion monitoring. Constr. Build. Mater. 2021, 269, 121240. [Google Scholar] [CrossRef]
  35. Fahim, A.; Ghods, P.; Isgor, O.B.; Thomas, M.D.A. A critical examination of corrosion rate measurement techniques applied to reinforcing steel in concrete. Mater. Corros. 2018, 69, 1784–1799. [Google Scholar] [CrossRef]
  36. Ribeiro, D.V.; Abrantes, J.C.C. Application of electrochemical impedance spectroscopy (EIS) to monitor the corrosion of reinforced concrete: A new approach. Constr. Build. Mater. 2016, 111, 98–104. [Google Scholar] [CrossRef]
  37. Stern, M.; Geary, A.L. Electrochemical polarization: I. A theoretical analysis of the shape of polarization curves. J. Electrochem. Soc. 1957, 104, 56–63. [Google Scholar] [CrossRef]
  38. Andrade, C.; Alonso, C. Test methods for on-site corrosion rate measurement of steel reinforcement in concrete by means of the polarization resistance method. Mater. Struct. 2004, 37, 623–643. [Google Scholar] [CrossRef]
  39. Ignatiadis, I.; Amalhay, M. Experimental study of corrosion of two stainless steels during the oxidative bacterial dissolution of pyrite using mass loss and electrochemical techniques. Int. J. Miner. Process. 2001, 62, 199–215. [Google Scholar] [CrossRef]
  40. ASTM G16-13(2019); Standard Guide for Applying Statistics to Analysis of Corrosion Data. ASTM International: West Conshohocken, PA, USA, 2019.
  41. Haynie, F.H. Statistical treatment of data, data interpretation and reliability. In Corrosion Tests and Standards: Application and Interpretation, 2nd ed.; Baboian, R., Ed.; ASTM International: West Conshohocken, PA, USA, 2005; pp. 83–88. [Google Scholar]
  42. Roberge, P.R. Statistical interpretation of corrosion test results. In ASM Handbook: Corrosion: Fundamentals, Testing and Protection, 10th ed.; Cramer, S.D., Covino, B.S., Eds.; ASM International: West Conshohocken, PA, USA, 2003; pp. 425–429. [Google Scholar]
  43. Panchenko, Y.M.; Marshakov, A.I.; Igonin, T.N.; Kovtanyuk, V.V.; Nikolaeva, L.A. Long-term forecast of corrosion mass losses of technically important metals in various world regions using a power function. Corros. Sci. 2014, 88, 306–316. [Google Scholar] [CrossRef]
  44. Amalhay, M.; Abou Akar, A.; Ignatiadis, I. Overview of the deposition phenomena in geothermal wells in the Paris Basin. In Proceedings of the World Geothermal Congress, Worldwide Utilization of Geothermal Energy; Barbier, E., Frye, G., Iglesias, E., Palmason, G., Eds.; International Geothermal Association (IGA): Auckland, New Zealand, 1994; pp. 2497–2502. [Google Scholar]
  45. Amalhay, M.; Cotiche, C.; Ignatiadis, I. Study of the electrochemical behavior of a carbon-steel in a real and treated geothermal environment. In Proceedings of the World Geothermal Congress, Worldwide Utilization of Geothermal Energy; Barbier, E., Frye, G., Iglesias, E., Palmason, G., Eds.; International Geothermal Association (IGA): Auckland, New Zealand, 1995; Volume 4, pp. 2369–2374. [Google Scholar]
  46. Amalhay, M.; Ignatiadis, I. Study of the behavior of a carbon-steel in a natural or modified and treated geothermal environment. In Proceedings of the International Symposium, Eurocorr’ 96, Nice, France, 24–26 September 1996; pp. 1–4. [Google Scholar]
  47. Ignatiadis, I.; Amalhay, M. The effect of iron sulfide deposits on corrosion of carbon steel in a natural and treated geothermal water using electrochemical techniques and X-ray diffractometry. In Proceedings of the International Symposium, Eurocorr’ 96, Nice, France, 24–26 September 1996; pp. 1–4. [Google Scholar]
  48. Rickard, D.; Luther, G.W. Chemistry of Iron Sulfides. Chem. Rev. 2007, 107, 514–562. [Google Scholar] [CrossRef]
Figure 1. Cross-section of high-level radioactive waste storage in the French deep geological facility (DGF).
Metals 13 00966 g001
Figure 2. (a) Tubing to be used as the receptors for the canisters was made of X65. (b) X65 electrodes with a body in PEEK were designed and constructed for corrosion studies, to be inserted into the MPP-2 device (see Section 2.3.1). The electrode dimensions were 5 mm diameter and 3 mm height, with an exposed surface of 0.64 cm2.
Metals 13 00966 g002
Figure 3. (a) Schematic representation of the device within the Andra URL (Bure, France), showing the circuit for supplying Cox pore water to the two multi-parametric probe holders (MPPs). (b) top left and right. Cupboard (dimensions: 90 × 50 × 200 cm) with two MPPs and instruments (computer, DAS, pH meters, flow controller, and precision balance connected to DAS). (c) Bottom. Outside of the cupboard of (b), a potentiostat–galvanostat impedance meter.
Metals 13 00966 g003
Figure 4. (a) Two views of the same MPP-2 with an electrochemical triplet, its electrodes positioned in the same plateau (P3) at a central level of the MPP-2. (b) Left: Plateau P2 with schematic representation of the doublets for monitoring the OCP of X65free (L2P2), Ag2S/Ag (L3P2), and Pt (L1P2) vs. AgCl(s)4)/Ag (L4P2). Right: Plateau P3 with schematic representation of the pH commercial electrode and the electrochemical triplet connected to the potentiostat–galvanostat for corrosion monitoring.
Metals 13 00966 g004
Figure 5. Temporal variation, over 180 days, of the OCP (mV/SHE) of Pt, Ag/Ag2S, Sb/Sb2O3, and X65 free electrodes (left axis), and of the pH (right axis), resulting from the conversion of Sb/Sb2O3 potentials.
Metals 13 00966 g005
Figure 6. Temporal variation, over 180 days, of the OCP (mV/SHE) of the Pt, Ag/AgCl, Ag/Ag2S, FeS2, and IrO2 electrodes.
Metals 13 00966 g006
Figure 7. OCP variation of the Pt, Ag2S, Sb2O3, AgCl3, and X65 free electrodes vs. pH over 180 days in a Pourbaix-type diagram. The straight line from −360 to −600 mV/SHE indicates the lower stability limit of water (H+/H2).
Metals 13 00966 g007
Figure 8. Sb2O3/Sb and PtO/Pt calibration curves under AP (pO2 = 0.2 atm; black symbols) and in GB (pO2 = 10−6 atm; gray symbols) at 25 °C. The variations in Pt and Sb2O3 potentials vs. pH clearly show the micro-oxic and, finally, anoxic state of the pore water. PtO/Pt and Sb2O3/Sb show near-Nernstian behavior. Green and red rectangles surround the evolution of platinum and Sb2O3, respectively.
Metals 13 00966 g008
Figure 9. Temporal variation of the OCP of the X65 WE electrode vs. SHE over 180 days.
Metals 13 00966 g009
Figure 10. Impedance diagrams in a Nyquist plot, obtained from the beginning of the experiments to 180 days later: (a) at low frequencies and (b) at high frequencies. Exposed surface of X65 WE is 0.64 cm2.
Metals 13 00966 g010
Figure 11. Temporal variation of Rp values; polarization resistance; and n, the exponent relative to the dispersive character of the interface, using a Re(Q/Rp) model over 180 days.
Metals 13 00966 g011
Figure 12. Evolution of CCDs (left axis in µA/cm2) and CRs (right axis in mm/year) of X65 steel as a function of time over 180 days, determined by three different electrochemical techniques.
Metals 13 00966 g012
Figure 13. Evolution of cumulated thickness loss (CTL, in mm) of X65 steel as a function of time over 180 days (0.5 year), determined by three different electrochemical techniques.
Metals 13 00966 g013
Table 1. Carbon steel API 5L X65 chemical composition.
ElementsChemical Composition (% Mass)
C0.16
Mn1.65
Si0.45
Ti0.06
P0.02
S0.01
V0.07
Nb0.05
Fe~97.53
Table 2. Pore water chemistry of Cox formation with major elements in mmol.L−1.
Elements or ChemistryConcentration (mM) or ValueElementsConcentration (mM)
pH7.35K7.07
Redox potential (mV/SHE)−180Ca14.8
Ionic strength116.0Mg14.1
C(4)1.29Sr1.12
S34.0Si0.0943
Cl30.1Fe0.0940
Na32.0Al0.0000086
Disclaimer/Publisher’s Note: The statements, opinions and data contained in all publications are solely those of the individual author(s) and contributor(s) and not of MDPI and/or the editor(s). MDPI and/or the editor(s) disclaim responsibility for any injury to people or property resulting from any ideas, methods, instructions or products referred to in the content.

