Abstract
Additive manufacturing is rapidly evolving and revolutionizing the fabrication of complex metal components with tunable properties. Machine learning and neural networks have emerged as powerful tools for process–property optimization in additive manufacturing. These techniques work well for the prediction of a single property but their applicability in optimizing multiple properties is limited. In the present work, an exclusive neural network is developed to demonstrate the potential of a single neural network in optimizing multiple part properties. The model is used to identify the optimal process parameter values for laser power, scan speed, and hatch spacing for the required surface roughness, relative density, microhardness, and dimensional accuracy in stainless steel parts. In-house-generated experimental data are used to train the model. The model has seven neurons in the hidden layer, which are selected using hyperparameter optimization. K-fold cross-validation is performed to ensure the robustness of the model, which results in a mean squared error of 0.0578 and R2 score of 0.59. The developed model is then used to predict the optimal process parameters corresponding to the user-required part properties. The model serves as a significant pre-processing step to identify the best parameters before printing, thus saving time and costs for repeated part fabrication. The study provides more insights into the usage of a single artificial neural network for the optimization of multiple properties of printed metal parts.
1. Introduction
Additive manufacturing (AM) is an emerging field that has been a topic of interest to many researchers in metal processing as it offers flexibility in the designing and fabrication of intricate geometries. AM uses data from computer-aided design (CAD) software to fabricate precise shapes layer-by-layer. Laser powder bed fusion (LPBF) or selective laser melting (SLM) is an attractive manufacturing technique for aerospace, automotive, and biomedical applications [1] due to its ability to produce complex geometries, energy efficiency, and minimal waste [2]. Despite the flexibility, LPBF has limitations in process repeatability [3,4], surface quality, and dimensional accuracy, which are critical for the part performance. The complex nature of LPBF, involving multiscale and multiphysics [5], makes the comprehensive understanding of the processing–structure–properties–performance (PSPP) challenging. Process parameters in LPBF can be classified as preprocessing, in-process, and postprocess [6]. The in-process parameters involve laser power, scan speed, hatch spacing, and layer thickness, which are of great interest when PSPP modeling is considered. Numerous studies have reported the influence of process parameters on the mechanical properties and the need for process optimization to obtain a desired property [7,8,9,10,11,12].
Many studies have performed the optimization of SLM process parameters by applying statistical techniques such as the design of experiments (DoE) [13], response surface methodology (RSM) [14], and Taguchi design methods [15]. DoE is used to plan, conduct, and analyze the experiments to identify the relationships between the variables. The goal of DoE is to find the most important factor that affects the part performance. RSM is a combination of statistical and mathematical techniques that aims at finding an optimal combination of inputs that will produce the best outcome. It involves the fitting of a response surface to the experimental data to model the relationship. Strano et al. [16] developed a new mathematical model to predict the surface roughness at sloping angles using SLM process parameters. Cao et al. [17] introduced a surrogate model to predict the surface roughness and dimensional accuracy by integrating the whale optimization algorithm and kriging model. Despite modeling the input–output relationship for the best input parameters, the statistical methods lack in establishing a combined effect of the input parameters.
With the advent of machine learning (ML), the use of computational data techniques significantly increased in process parameter optimization. Artificial neural networks (ANN) are a subset of deep learning algorithms that can analyze a large amount of data and identify the patterns and relationship between the input variables and the output. The development of pre-built libraries and frameworks, continuous advancements in techniques, and ease of deployment made ML algorithms versatile tools in solving a wide range of problems. In additive manufacturing, ML algorithms have been used for tasks such as topology optimization [18,19], in-situ process monitoring [20,21,22], and process parameter optimization [23,24,25,26,27,28,29,30,31,32,33,34,35,36,37,38,39]. ML algorithms have been employed in understanding the PSPP relationships through exploring the feasible process design space and its optimization, which is challenging through experimentation [23]. One of the earliest works using neural networks in process parameter optimization was reported by Shen et al. [24]. They developed an ANN model to predict the part density for a nylon-12 polymer and suggested that the training of the network can be accelerated using batch training. Wang et al. [25] modeled the effects of process parameters on the density of HBI (composite of polystyrene) parts prepared by SLM using ANN and demonstrated the capability of neural networks in modeling the PSPP relationship. Rong-Ji et al. [26] extended the modeling using a neural network combined with genetic algorithm (GA) to identify the optimal process parameters, such as layer thickness, hatch spacing, laser power, scanning speed, work surrounding temperature, interval time, and scanning mode, to obtain minimal shrinkage in HBI alloys. Nguyen et al. [27] developed an optimization system to find optimal process parameters for Ti-6Al-4V in SLM with an as-built part density close to 98%. Lo et al. [28] employed ANNs coupled with numerical simulations to create process maps relating the melt pool temperature and melt pool depth to hatch spacing and scan length for SS 316L and verified their optimality through validation experiments. Srinivasan et al. [29] developed a procedure coupling the physics-based process modeling with ML and optimization to find a suitable AM processing space for Ti-6Al-4V alloys. Many researchers have extended the use of ML algorithms for the prediction of one or two properties [30,31,32] and compared the performance of different ML algorithms, such as support vector machines (SVM), random forest (RF), k-nearest neighbors (KNN), and XGBoost [33,34,35,36,37,38,39].
Most of the studies modeled the effect of the process parameters individually on the part properties. Chia et al. [40] demonstrated that AM is effectively a multi-objective optimization problem and the key issue in multi-objective optimization is the lack of accurate PSPP models that describe the response outputs as a function of the input variable. There is a need to obtain an optimal process window for multiple properties of as-built parts without restricting this to a combination of one or two. Fe-Perdomo et al. [41] analyzed various ML approaches for surface roughness and other mechanical properties such as hardness, tensile strength, and relative density. They developed different ML models with hyperparameter optimization for each property, which is tedious and time-consuming. Many studies listed above are restricted to the combination of one or two output properties while modeling the effect of process parameters, thus indicating a need for extension to multiple part properties. In this study, we develop an exclusive ANN model to optimize process parameters such as laser power, scan speed, and hatch spacing for multiple part properties such as relative density, surface roughness, microhardness, and dimensional error with a single neural network. The developed model is then used to predict the above properties for a feasible design space of processing parameters.
2. Materials and Methods
2.1. Experimental Setup
For this study, 23 sets of process parameters are selected based on a literature review [42] to fabricate the specimens. Table 1 shows the selected values of laser power, scan speed, and hatch spacing for each set. However, the layer thickness was maintained constant at 30 μm and the energy density for each set was calculated as
where Ev (J/mm3) is the volumetric energy density (VED), LP (W) is the laser power, SS (mm/s) is the scan speed, HS (μm) is the hatch spacing, and LT (μm) is the layer thickness.

Table 1.
List of process parameters and corresponding experimental values.
SS 316L metal powder (SLM Solutions Group AG, Lübeck, Germany) was used on an SLM 125 HL (SLM Solutions Group AG, Lübeck, Germany) metal printer. The metal powder had d10, d50, d90 particle sizes as 22.7 μm, 32.4 μm, and 45.2 μm, respectively [43]. The printer had a workspace of 125 mm × 125 mm × 125 mm and used a 400 W laser heat source. Each specimen’s dimensions were 8 mm × 8 mm × 6 mm.
A wire electric discharge machine was used to separate the printed specimens from the build plate and the parts were sonicated in isopropyl alcohol to remove any lose un-melted powder. The relative density of the specimens was calculated using the Archimedes principle as reported by Guzman et al. [44] using a precision balance. For surface roughness measurement, an optical microscope (Keyence Corporation of America, Itasca, IL, USA) was used. To ensure consistent measurements, a sample holder was used to align the edges for each specimen. Area surface roughness (Sa) was measured four times and the mean values are reported for each specimen. Figure 1 shows the optical microscopy images of two representative samples (No. 4 and 10) and the corresponding roughness maps used for the calculation of roughness values. The un-melted powder particles can be clearly seen on the surfaces of samples. Similar images were recorded for all samples and the surface roughness values were computed. The microstructure of 3D-printed stainless steel has been extensively studied as a function of the processing conditions [1,45,46].
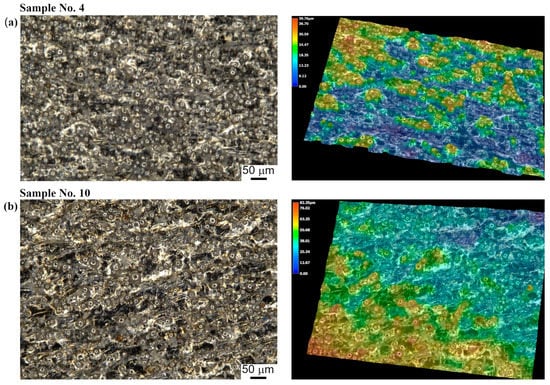
Figure 1.
Optical microscopy images and surface roughness maps of (a) sample 4 and (b) sample 10.
A Vickers microhardness tester (Pace Technologies, Tucson, AZ, USA) was used to measure the microhardness values of as-built specimens. Dimensional error for each specimen was measured using a micrometer (Mitutoyo America Corporation, Aurora, IL, USA). The absolute difference between the measured and the designed value (8 mm) was measured three times and mean values are reported in Table 1.
Figure 2 shows the scatter plots of each property with respect to VED. All the results with corresponding process parameters were tabulated and saved in a csv file for feeding into the ANN model.
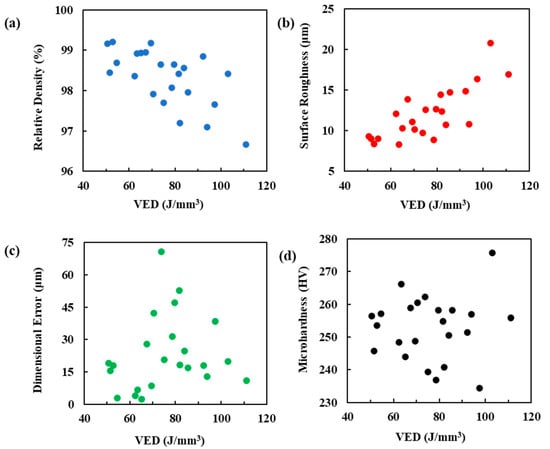
Figure 2.
Scatter plots of properties against VED. (a) Relative density, (b) surface roughness, (c) dimensional error, and (d) microhardness.
2.2. Artificial Neural Network
Artificial neural networks (ANNs) are deep learning algorithms modeled after the structure and function of the human brain. ANNs consist of interconnected nodes, called neurons, which work together to process information, recognize patterns and relationships in input data, and make predictions or decisions. In this research, an ANN with a single hidden layer was developed using the Keras library in the tensorflow framework [47]. The architecture of the ANN is shown in Figure 3. The input layer consists of 3 neurons for our inputs: laser power, scan speed, and hatch spacing. The output layer consists of 4 neurons, which give the output for surface roughness, microhardness, relative density, and dimensional error. The data fed to the neural network are within different ranges and are normalized to simplify the training process. Therefore, all inputs and outputs to the network are transformed using the transformation
where Xt is the transformed value, X is the original value, and Xmin and Xmax are the minimum and maximum values in that class. The ANN consists of 7 neurons in the hidden layer, which are found using parameter optimization. The activation function applies transformation to the output from neurons before propagating it to the next layer. The Rectified Linear Unit (ReLU) activation function is chosen as it is widely used to predict continuous variables as in regression [48]. It can be expressed as
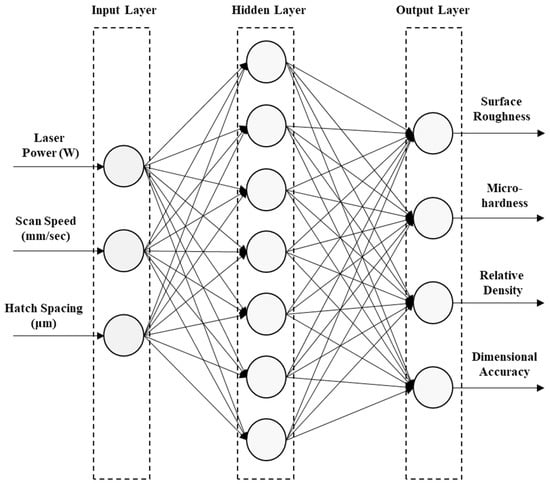
Figure 3.
Artificial neural network with a single hidden layer.
During the training of the ANN, the mean squared error (MSE) is used as a loss function. It is one of the most used error metrics in regression problems. The loss function is used with the Adam optimizer algorithm [49]. The loss function is calculated using
where is the loss, is the predicted value, is the actual value, and N is the total number of samples.
The error metrics used in the study are the MSE and R2 score. The MSE for the model is obtained during the training and testing of the network as it is used as a loss function. The R2 w is a measure of the fitting of a model. It is a robust metric in evaluating the performance of any statistical model. For better performance, any model should produce a lower MSE with an R2 score close to 1. The MSE can never be negative as it is a square of deviations, but the R2 can be negative, indicating a poor fit to the data. The R2 score is calculated using the equation
2.3. Hyperparameter Optimization and K-Fold Cross-Validation
Hyperparameter optimization refers to the process of tuning the parameters of a neural network model to achieve optimal performance. This is done by experimenting with different combinations of hyperparameters, such as the number of hidden layers, the number of neurons per layer, the learning rate, and the regularization term, to find the best set of values for a particular problem. In this study, the hyperparameter optimization is done for the number of neurons in the hidden layer.
K-fold cross-validation, on the other hand, is a model evaluation technique that helps to prevent overfitting. In k-fold cross-validation, the original dataset is divided into k smaller subsets, or folds, and the model is trained on k-1 of these folds and evaluated on the remaining one. This process is repeated k times, with each fold used as the evaluation set once. The performance across all k-folds is then averaged as an estimate of the model’s performance on unseen data [50]. Seven-fold cross-validation (7 folds give 80% as training data and 20% testing data for every fold) is applied in the current study to produce a more robust model.
By combining hyperparameter optimization with k-fold cross-validation, researchers can more accurately evaluate the performance of a neural network and ensure that it generalizes well to new data.
2.4. Process Parameter Optimization Algorithm
For process parameter optimization, an algorithm is developed as shown in Figure 4. First, an ANN with a single hidden layer is developed and trained using the experimental data. The performance of the ANN is evaluated. The ANN is then used to make predictions on generated test data created by combining different levels of processing parameters where the laser power range is from 150 to 290 W, scan speed from 650 to 890 mm/s, and hatch spacing from 111 to 129 μm. Based on user-required properties, the predictions of relative density, surface roughness, microhardness, and dimensional error from the ANN are filtered and are compared with the user requirements. The index of the satisfied data is noted from the prediction set and the optimal process parameter set is found by indexing the generated test data set with the index obtained.
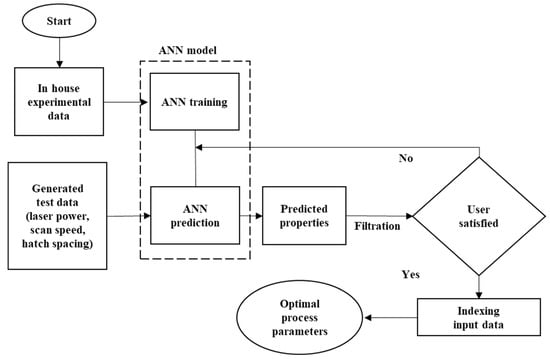
Figure 4.
Algorithm for obtaining optimal process parameters.
3. Results and Discussion
3.1. Hyperparameter Optimization and K-Fold Cross-Validation
The hyperparameter selected for the current study is the number of neurons in the hidden layer. The neurons are varied from 4 to 14 and are cross-validated using seven-fold cross validation. Figure 5 shows the hyperparameter optimization and seven-fold cross-validation results for the model. In Figure 5a, the MSE values during training and validation are reported for each set of hyperparameters. As the number of neurons increased, the training loss decreased, indicating that the model was able to learn the training data by reducing the error. However, if closely examine the validation error, it was reduced initially until seven neurons and then started to increase. This indicates that our model is overfitting the training data after seven neurons. An overfit model has a low training error as it memorizes the training data and a high validation error as it behaves poorly on the validation set. The R2 score obtained was 0.594 at seven neurons, indicating this as the optimal number of neurons in the hidden layer.
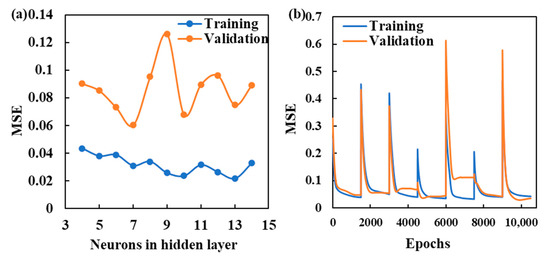
Figure 5.
(a) MSE values during training and validation with respect to number of neurons in hidden layer for hyperparameter optimization; (b) 7-fold cross-validation.
Figure 5b shows the seven-fold cross-validation of the developed ANN model. In each fold, the model is trained on the training set, which reduces the training error gradually with epochs. The validation error is initially high as it is unseen data and gradually reduces as the model learns the relationship from the training data and minimizes the error. When a new fold of data is introduced to the model, both training and validation errors show a sharp increase and slowly start to decrease, which indicates that the model is learning the new data in the new fold. The same process is seen in subsequent folds, where the model’s training and validation errors reduce and converge at the end. However, at the end of the third and fifth folds, the validation error was more than the training error, indicating overfitting of the network. Despite overfitting in two folds, in the remaining folds of validation, the error between the training and the validation is negligible and the error can be averaged to produce an acceptable value. The average MSE of the cross-validation is found to be 0.058, indicating the fair performance of the model on the experimental data. Overfitting can be addressed using techniques such as early stopping, dropout, and regularization [27].
3.2. Performance of the ANN
Once the model is hyperparameter-optimized along with cross-validation, the model is saved to preserve the weights. From the experimental data, 20% is randomly selected to test the model. Predictions are made for relative density, roughness, dimensional error, and microhardness, and their corresponding comparisons with actual values are reported in Figure 6. From Figure 6a, only for sample 3, the predicted value of relative density closely matches with the actual value. The remaining three samples showed a deviation from their actual density values. For relative densities of more than 99%, the ANN model predicted closer values than the densities that were less than 98% and this could be attributed to the limited availability of process parameter data points corresponding to densities less than 98%. Figure 6b shows the predictions for surface roughness, indicating close predicted values to the actual values.
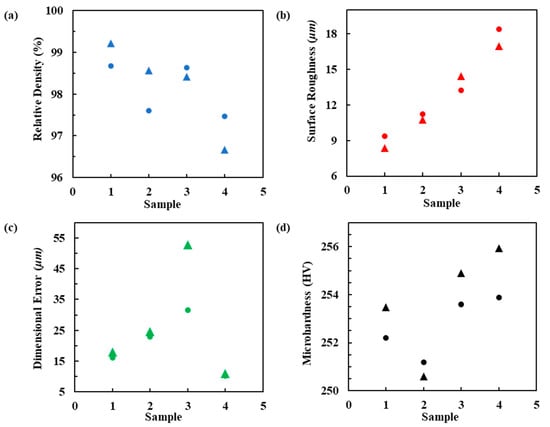
Figure 6.
Model performance for (a) relative density, (b) surface roughness, (c) dimensional error, (d) microhardness. Triangles represent the actual values and circles represent the predicted values.
Figure 6c compares the values of dimensional error. The predicted values are close to the measured values for three samples. Sample 3 had a significant deviation from the actual value. Microhardness values are plotted in Figure 6d. Only sample 2 had a predicted value close to the actual value from [42]. The rest of them had deviations from the actual values. However, the deviations below 253 are smaller and those above 254 are much higher. Overall, the model accurately predicted the surface roughness and gave decent predictions in dimensional error. Relative densities above 99% and microhardness values below 253 had less deviations.
3.3. Optimization of Process Parameters and Performance
The developed exclusive neural network is used to predict the optimal process parameters by making predictions on the generated test data. The model parameters for the ANN are saved after cross-validation and the same model is used to make the predictions on the generated test data. To assess the performance of our model, the predicted data are compared with experimental data from the literature. Table 2 shows the comparison of the predicted results from the model and the literature data. For relative density, the deviation (%) was much lower than the experimental value in the literature [35], indicating that the model can predict relative densities close to 99% accurately, as mentioned earlier. The predicted values of surface roughness had a deviation of 2.68% from the experimental literature value [51] and can be fairly used to estimate the property. Microhardness prediction had a 3.07% deviation from the literature [11]. As discussed in the previous section, microhardness values of more than 254 HV had significant deviations, indicating a need for more data in this region. The predictions from the model are saved and plots are generated for the required parameters to understand their effects and obtain the optimal processing parameters.
Table 2.
Comparison of model predictions and experimental values in literature.
The user requirement is set to have an as-built part relative density of more than 99% with acceptable ranges for surface roughness, dimensional error, and microhardness. The predicted data are filtered using the above user requirements. The index of filtered data satisfying the user requirements is indexed in the generated input data set for the optimal process parameters. Hatch spacing was held at 127.5 μm and a variation in laser power and scan speed was considered to generate the optimal processing window. The contour plots (Figure 7) show the effects of the processing parameters on the individual property. The optimal processing window is found by plotting the contour lines of all user-required properties on a single plot. Figure 8 shows the optimal processing region (shaded area) that satisfies all the user requirements. This region satisfies the user requirements for a part density more than 99%, roughness less than 10.5 μm, dimensional error less than 20 μm, and microhardness more than 260 HV.
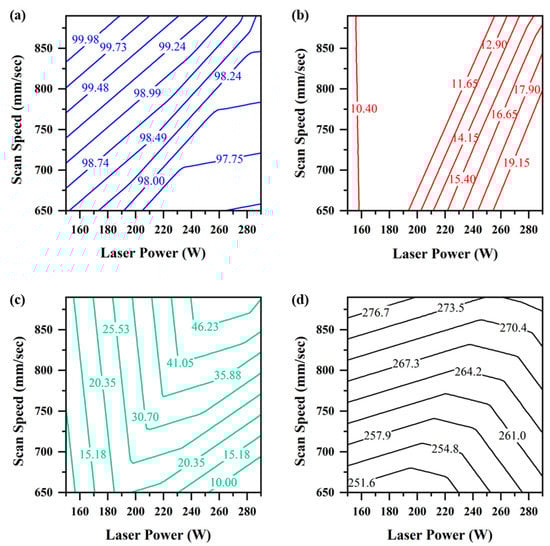
Figure 7.
Contour plots showing the effect of laser power and scan speed on (a) relative density (%), (b) surface roughness (μm), (c) dimensional error (μm), and (d) microhardness (HV).
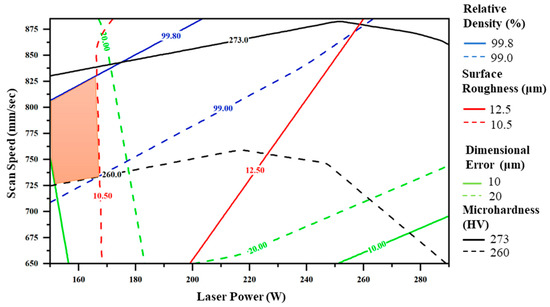
Figure 8.
Contour plots showing the effect of laser power and scan speed on the required properties with optimal processing region (in orange).
4. Conclusions
To find the optimal process parameters for user-required part properties in laser powder bed fusion, an optimization model based on experimental data is developed using artificial neural networks. An exclusive neural network is developed to optimize the laser power, scan speed, and hatch spacing with the desired relative density, surface roughness, dimensional error, and microhardness. It was found that the developed model resulted in a decent R2 score of 0.59. The predicted values were compared to the experimental values in the literature and indicated a close match. The results demonstrate the ability of an exclusive neural network in modeling the process parameter–property relationships for multiple properties. The developed model can find the optimal processing parameters that satisfy the user requirement for customized part properties. Thus, it reduces the preprocessing time and cost significantly. The following conclusions are drawn based on the current study.
- Hyperparameter optimization and cross-validation are crucial steps in developing a robust prediction model. The combination can reduce the model loss and enhance the performance on unseen data.
- Neural networks are highly sensitive to the training data. To have comparable performance for every property, training data must contain inclusive data points within the range. Having less data in the given range would affect the performance of the predictions.
- Finding the optimal parameters for the laser powder bed fusion process requires an understanding of the combined effect of the process parameters on the part properties. ANN is a powerful tool in modeling the combined relationship and obtaining the optimal process parameters in the given range of data.
Author Contributions
Conceptualization, S.T., S.H.J. and B.B.R.; methodology, S.T.; formal analysis, S.T., S.H.J. and B.B.R.; resources, G.K.; writing—original draft preparation, S.T.; writing—review and editing, S.T., S.H.J. and B.B.R.; supervision, G.K.; project administration, G.K.; funding acquisition, G.K. All authors have read and agreed to the published version of the manuscript.
Funding
This research was funded by a University of Texas System STARs award.
Conflicts of Interest
The authors declare no conflict of interest.
References
- Gong, H.; Snelling, D.; Kardel, K.; Carrano, A. Comparison of Stainless Steel 316L Parts Made by FDM- and SLM-Based Additive Manufacturing Processes. JOM 2019, 71, 880–885. [Google Scholar] [CrossRef]
- Shayfull, Z.; Sharif, S.; Zain, A.M.; Ghazali, M.F.; Saad, R.M. Potential of Conformal Cooling Channels in Rapid Heat Cycle Molding: A Review. Adv. Polym. Technol. 2014, 33, 21381. [Google Scholar] [CrossRef]
- Dowling, L.; Kennedy, J.; O’Shaughnessy, S.; Trimble, D. A Review of Critical Repeatability and Reproducibility Issues in Powder Bed Fusion. Mater. Des. 2020, 186, 108346. [Google Scholar] [CrossRef]
- Malekipour, E.; El-Mounayri, H. Common Defects and Contributing Parameters in Powder Bed Fusion AM Process and Their Classification for Online Monitoring and Control: A Review. Int. J. Adv. Manuf. Technol. 2018, 95, 527–550. [Google Scholar] [CrossRef]
- Markl, M.; Körner, C. Multiscale Modeling of Powder Bed–Based Additive Manufacturing. Annu. Rev. Mater. Res. 2016, 46, 93–123. [Google Scholar] [CrossRef]
- Shipley, H.; McDonnell, D.; Culleton, M.; Coull, R.; Lupoi, R.; O’Donnell, G.; Trimble, D. Optimisation of Process Parameters to Address Fundamental Challenges during Selective Laser Melting of Ti-6Al-4V: A Review. Int. J. Mach. Tools Manuf. 2018, 128, 1–20. [Google Scholar] [CrossRef]
- Tian, Y.; Tomus, D.; Rometsch, P.; Wu, X. Influences of Processing Parameters on Surface Roughness of Hastelloy X Produced by Selective Laser Melting. Addit. Manuf. 2017, 13, 103–112. [Google Scholar] [CrossRef]
- Moussaoui, K.; Rubio, W.; Mousseigne, M.; Sultan, T.; Rezai, F. Effects of Selective Laser Melting Additive Manufacturing Parameters of Inconel 718 on Porosity, Microstructure and Mechanical Properties. Mater. Sci. Eng. A 2018, 735, 182–190. [Google Scholar] [CrossRef]
- Larimian, T.; Kannan, M.; Grzesiak, D.; AlMangour, B.; Borkar, T. Effect of Energy Density and Scanning Strategy on Densification, Microstructure and Mechanical Properties of 316L Stainless Steel Processed via Selective Laser Melting. Mater. Sci. Eng. A 2020, 770, 138455. [Google Scholar] [CrossRef]
- Khaimovich, A.; Balyakin, A.; Oleynik, M.; Meshkov, A.; Smelov, V. Optimization of Process Parameters for Powder Bed Fusion Additive Manufacturing Using a Linear Programming Method: A Conceptual Framework. Metals 2022, 12, 1976. [Google Scholar] [CrossRef]
- Greco, S.; Gutzeit, K.; Hotz, H.; Kirsch, B.; Aurich, J.C. Selective Laser Melting (SLM) of AISI 316L—Impact of Laser Power, Layer Thickness, and Hatch Spacing on Roughness, Density, and Microhardness at Constant Input Energy Density. Int. J. Adv. Manuf. Technol. 2020, 108, 1551–1562. [Google Scholar] [CrossRef]
- Liu, Q.C.; Elambasseril, J.; Sun, S.J.; Leary, M.; Brandt, M.; Sharp, P.K. The Effect of Manufacturing Defects on the Fatigue Behaviour of Ti-6Al-4V Specimens Fabricated Using Selective Laser Melting. Adv. Mater. Res. 2014, 891–892, 1519–1524. [Google Scholar] [CrossRef]
- Laakso, P.; Riipinen, T.; Laukkanen, A.; Andersson, T.; Jokinen, A.; Revuelta, A.; Ruusuvuori, K. Optimization and Simulation of SLM Process for High Density H13 Tool Steel Parts. Phys. Procedia 2016, 83, 26–35. [Google Scholar] [CrossRef]
- Ravichander, B.B.; Amerinatanzi, A.; Shayesteh Moghaddam, N. Study on the Effect of Powder-Bed Fusion Process Parameters on the Quality of as-Built IN718 Parts Using Response Surface Methodology. Metals 2020, 10, 1180. [Google Scholar] [CrossRef]
- Liu, Y.; Wu, Z.; Wang, Q.; Zhao, L.; Zhang, X.; Gao, W.; Xu, J.; Song, Y.; Song, X.; Zhang, X. Optimization of Parameters in Laser Powder Bed Fusion TA15 Titanium Alloy Using Taguchi Method. Crystals 2022, 12, 1385. [Google Scholar] [CrossRef]
- Strano, G.; Hao, L.; Everson, R.M.; Evans, K.E. Surface Roughness Analysis, Modelling and Prediction in Selective Laser Melting. J. Mater. Process. Technol. 2013, 213, 589–597. [Google Scholar] [CrossRef]
- Cao, L.; Li, J.; Hu, J.; Liu, H.; Wu, Y.; Zhou, Q. Optimization of Surface Roughness and Dimensional Accuracy in LPBF Additive Manufacturing. Opt. Laser Technol. 2021, 142, 107246. [Google Scholar] [CrossRef]
- Yao, X.; Moon, S.K.; Bi, G. A hybrid machine learning approach for additive manufacturing design feature recommendation. Rapid Prototyp. J. 2017, 23, 983–997. [Google Scholar] [CrossRef]
- Sosnovik, I.; Oseledets, I. Neural networks for topology optimization. Russ. J. Numer. Anal. Math. Model. 2019, 34, 215–223. [Google Scholar] [CrossRef]
- Ye, D.; Fuh, J.Y.H.; Zhang, Y.; Hong, G.S.; Zhu, K. In situ monitoring of selective laser melting using plume and spatter signatures by deep belief networks. ISA Trans. 2018, 81, 96–104. [Google Scholar] [CrossRef]
- Scime, L.; Beuth, J. Using machine learning to identify in-situ melt pool signatures indicative of flaw formation in a laser powder bed fusion additive manufacturing process. Addit. Manuf. 2019, 25, 151–165. [Google Scholar] [CrossRef]
- Gaikwad, A.; Williams, R.J.; de Winton, H.; Bevans, B.D.; Smoqi, Z.; Rao, P.; Hooper, P.A. Multi phenomena melt pool sensor data fusion for enhanced process monitoring of laser powder bed fusion additive manufacturing. Mater. Des. 2022, 221, 110919. [Google Scholar] [CrossRef]
- Kouraytem, N.; Li, X.; Tan, W.; Kappes, B.; Spear, A.D. Modeling Process–Structure–Property Relationships in Metal Additive Manufacturing: A Review on Physics-Driven versus Data-Driven Approaches. J. Phys. Mater. 2021, 4, 032002. [Google Scholar] [CrossRef]
- Shen, X.; Yao, J.; Wang, Y.; Yang, J. Density Prediction of Selective Laser Sintering Parts Based on Artificial Neural Network. In Advances in Neural Networks—ISNN 2004; Lecture Notes in Computer, Science; Yin, F.L., Wang, J., Guo, C., Eds.; Springer: Berlin/Heidelberg, Germany, 2004; Volume 3174, ISNN 2004. [Google Scholar] [CrossRef]
- Wang, R.J.; Li, J.; Wang, F.; Li, X.; Wu, Q. ANN Model for the Prediction of Density in Selective Laser Sintering. Int. J. Manuf. Res. 2009, 4, 362. [Google Scholar] [CrossRef]
- Rong-Ji, W.; Xin-hua, L.; Qing-ding, W.; Lingling, W. Optimizing process parameters for selective laser sintering based on neural network and genetic algorithm. Int. J. Adv. Manuf. Technol. 2009, 42, 1035. [Google Scholar] [CrossRef]
- Nguyen, D.S.; Park, H.S.; Lee, C.M. Optimization of Selective Laser Melting Process Parameters for Ti-6Al-4V Alloy Manufacturing Using Deep Learning. J. Manuf. Process. 2020, 55, 230–235. [Google Scholar] [CrossRef]
- Lo, Y.L.; Liu, B.Y.; Tran, H.C. Optimized hatch space selection in double-scanning track selective laser melting process. Int. J. Adv. Manuf. Technol. 2019, 105, 2989. [Google Scholar] [CrossRef]
- Srinivasan, S.; Swick, B.; Groeber, M.A. Laser Powder Bed Fusion Parameter Selection via Machine-Learning-Augmented Process Modeling. JOM 2020, 72, 4393–4403. [Google Scholar] [CrossRef]
- Ravichander, B.B.; Rahimzadeh, A.; Farhang, B.; Shayesteh Moghaddam, N.; Amerinatanzi, A.; Mehrpouya, M. A Prediction Model for Additive Manufacturing of Inconel 718 Superalloy. Appl. Sci. 2021, 11, 8010. [Google Scholar] [CrossRef]
- Chaudhry, S.; Soulaïmani, A. A Comparative Study of Machine Learning Methods for Computational Modeling of the Selective Laser Melting Additive Manufacturing Process. Appl. Sci. 2022, 12, 2324. [Google Scholar] [CrossRef]
- Caiazzo, F.; Caggiano, A. Laser Direct Metal Deposition of 2024 Al Alloy: Trace Geometry Prediction via Machine Learning. Materials 2018, 11, 444. [Google Scholar] [CrossRef] [PubMed]
- Eshkabilov, S.; Ara, I.; Azarmi, F. A Comprehensive Investigation on Application of Machine Learning for Optimization of Process Parameters of Laser Powder Bed Fusion-Processed 316L Stainless Steel. Int. J. Adv. Manuf. Technol. 2022, 123, 2733–2756. [Google Scholar] [CrossRef]
- Gor, M.; Dobriyal, A.; Wankhede, V.; Sahlot, P.; Grzelak, K.; Kluczyński, J.; Łuszczek, J. Density Prediction in Powder Bed Fusion Additive Manufacturing: Machine Learning-Based Techniques. Appl. Sci. 2022, 12, 7271. [Google Scholar] [CrossRef]
- Barrionuevo, G.O.; Ramos-Grez, J.A.; Walczak, M.; Betancourt, C.A. Comparative Evaluation of Supervised Machine Learning Algorithms in the Prediction of the Relative Density of 316L Stainless Steel Fabricated by Selective Laser Melting. Int. J. Adv. Manuf. Technol. 2021, 113, 419–433. [Google Scholar] [CrossRef]
- Zou, M.; Jiang, W.G.; Qin, Q.H.; Liu, Y.C.; Li, M.L. Optimized XGBoost Model with Small Dataset for Predicting Relative Density of Ti-6Al-4V Parts Manufactured by Selective Laser Melting. Materials 2022, 15, 5298. [Google Scholar] [CrossRef]
- Khanzadeh, M.; Chowdhury, S.; Marufuzzaman, M.; Tschopp, M.A.; Bian, L. Porosity prediction: Supervised-learning of thermal history for direct laser deposition. J. Manuf. Syst. 2018, 47, 69. [Google Scholar] [CrossRef]
- So, M.S.; Seo, G.J.; Kim, D.B.; Shin, J.-H. Prediction of Metal Additively Manufactured Surface Roughness Using Deep Neural Network. Sensors 2022, 22, 7955. [Google Scholar] [CrossRef]
- Theeda, S.; Ravichander, B.B.; Jagdale, S.H.; Kumar, G. Optimization of Laser Process Parameters Using Machine Learning Algorithms and Performance Comparison. In Proceedings of the 2022 International Solid Freeform Fabrication Symposium, Austin, TX, USA, 25–27 July 2022. [Google Scholar] [CrossRef]
- Chia, H.Y.; Wu, J.; Wang, X.; Yan, W. Process Parameter Optimization of Metal Additive Manufacturing: A Review and Outlook. J. Mater. Inform. 2022, 2, 16. [Google Scholar] [CrossRef]
- La Fé-Perdomo, I.; Ramos-Grez, J.A.; Jeria, I.; Guerra, C.; Barrionuevo, G.O. Comparative Analysis and Experimental Validation of Statistical and Machine Learning-Based Regressors for Modeling the Surface Roughness and Mechanical Properties of 316L Stainless Steel Specimens Produced by Selective Laser Melting. J. Manuf. Process. 2022, 80, 666–682. [Google Scholar] [CrossRef]
- Jagdale, S.H.; Theeda, S.; Ravichander, B.B.; Kumar, G. Surface morphology and Hardness of powder Bed Fused SS316L as a Function of Process Parameters. In Proceedings of the 2022 International Solid Freeform Fabrication Symposium, Austin, TX, USA, 25–27 July 2022. [Google Scholar] [CrossRef]
- Gatões, D.; Alves, R.; Alves, B.; Vieira, M.T. Selective Laser Melting and Mechanical Properties of Stainless Steels. Materials 2022, 15, 7575. [Google Scholar] [CrossRef]
- Guzmán, J.; Nobre, R.d.M.; Nunes, E.R.; Bayerlein, D.L.; Falcão, R.B.; Sallica-Leva, E.; Neto, J.B.F.; Oliveira, H.R.; Chastinet, V.L.; Landgraf, F.J.G. Laser Powder Bed Fusion Parameters to Produce High-Density Ti–53%Nb Alloy Using Irregularly Shaped Powder from Hydride-Dehydride (HDH) Process. J. Mater. Res. Technol. 2021, 10, 1372–1381. [Google Scholar] [CrossRef]
- Gorsse, S.; Huchinson, C.; Goune, M.; Banerjee, R. Additive manufacturing of metals: A brief review of the characteristic microstructures and properties of steels, Ti-6Al-4V and high-entropy alloys. Sci. Technol. Adv. Mater. 2017, 18, 584. [Google Scholar] [CrossRef] [PubMed]
- Parikh, Y.; Kuttolamadom, M. Property-Graded Stainless Steel 316L by Selective Laser Melting: Characterization & Design. J. Manuf. Sci. Eng. 2023, 144, 61008. [Google Scholar] [CrossRef]
- Abadi, M.; Barham, P.; Chen, J.; Chen, Z.; Davis, A.; Dean, J.; Devin, M.; Ghemawat, S.; Irving, G.; Isard, M.; et al. TensorFlow: A System for Large-Scale Machine Learning. arXiv 2016, arXiv:1605.08695. [Google Scholar] [CrossRef]
- Liu, J.; Ye, J.; Silva Izquierdo, D.; Vinel, A.; Shamsaei, N.; Shao, S. A Review of Machine Learning Techniques for Process and Performance Optimization in Laser Beam Powder Bed Fusion Additive Manufacturing. J. Intell. Manuf. 2022. [Google Scholar] [CrossRef]
- Kingma, D.P.; Ba, J. Adam: A Method for Stochastic Optimization. arXiv 2017, arXiv:1412.6980. [Google Scholar] [CrossRef]
- Anguita, D.; Ghelardoni, L.; Ghio, A.; Oneto, L.; Ridella, S. The ‘K’ in K-Fold Cross Validation. In Proceedings of the European Symposium on Artificial Neural Networks, Computational Intelligence and Machine Learning, Bruges, Belgium, 25–27 April 2012; pp. 441–446. [Google Scholar]
- Deng, Y.; Mao, Z.; Yang, N.; Niu, X.; Lu, X. Collaborative Optimization of Density and Surface Roughness of 316L Stainless Steel in Selective Laser Melting. Materials 2020, 13, 1601. [Google Scholar] [CrossRef]


Disclaimer/Publisher’s Note: The statements, opinions and data contained in all publications are solely those of the individual author(s) and contributor(s) and not of MDPI and/or the editor(s). MDPI and/or the editor(s) disclaim responsibility for any injury to people or property resulting from any ideas, methods, instructions or products referred to in the content. |
© 2023 by the authors. Licensee MDPI, Basel, Switzerland. This article is an open access article distributed under the terms and conditions of the Creative Commons Attribution (CC BY) license (https://creativecommons.org/licenses/by/4.0/).