


Removing of Fe, Pb and Hg from Crude Selenium by Fractional Crystallization

Abstract
1. Introduction
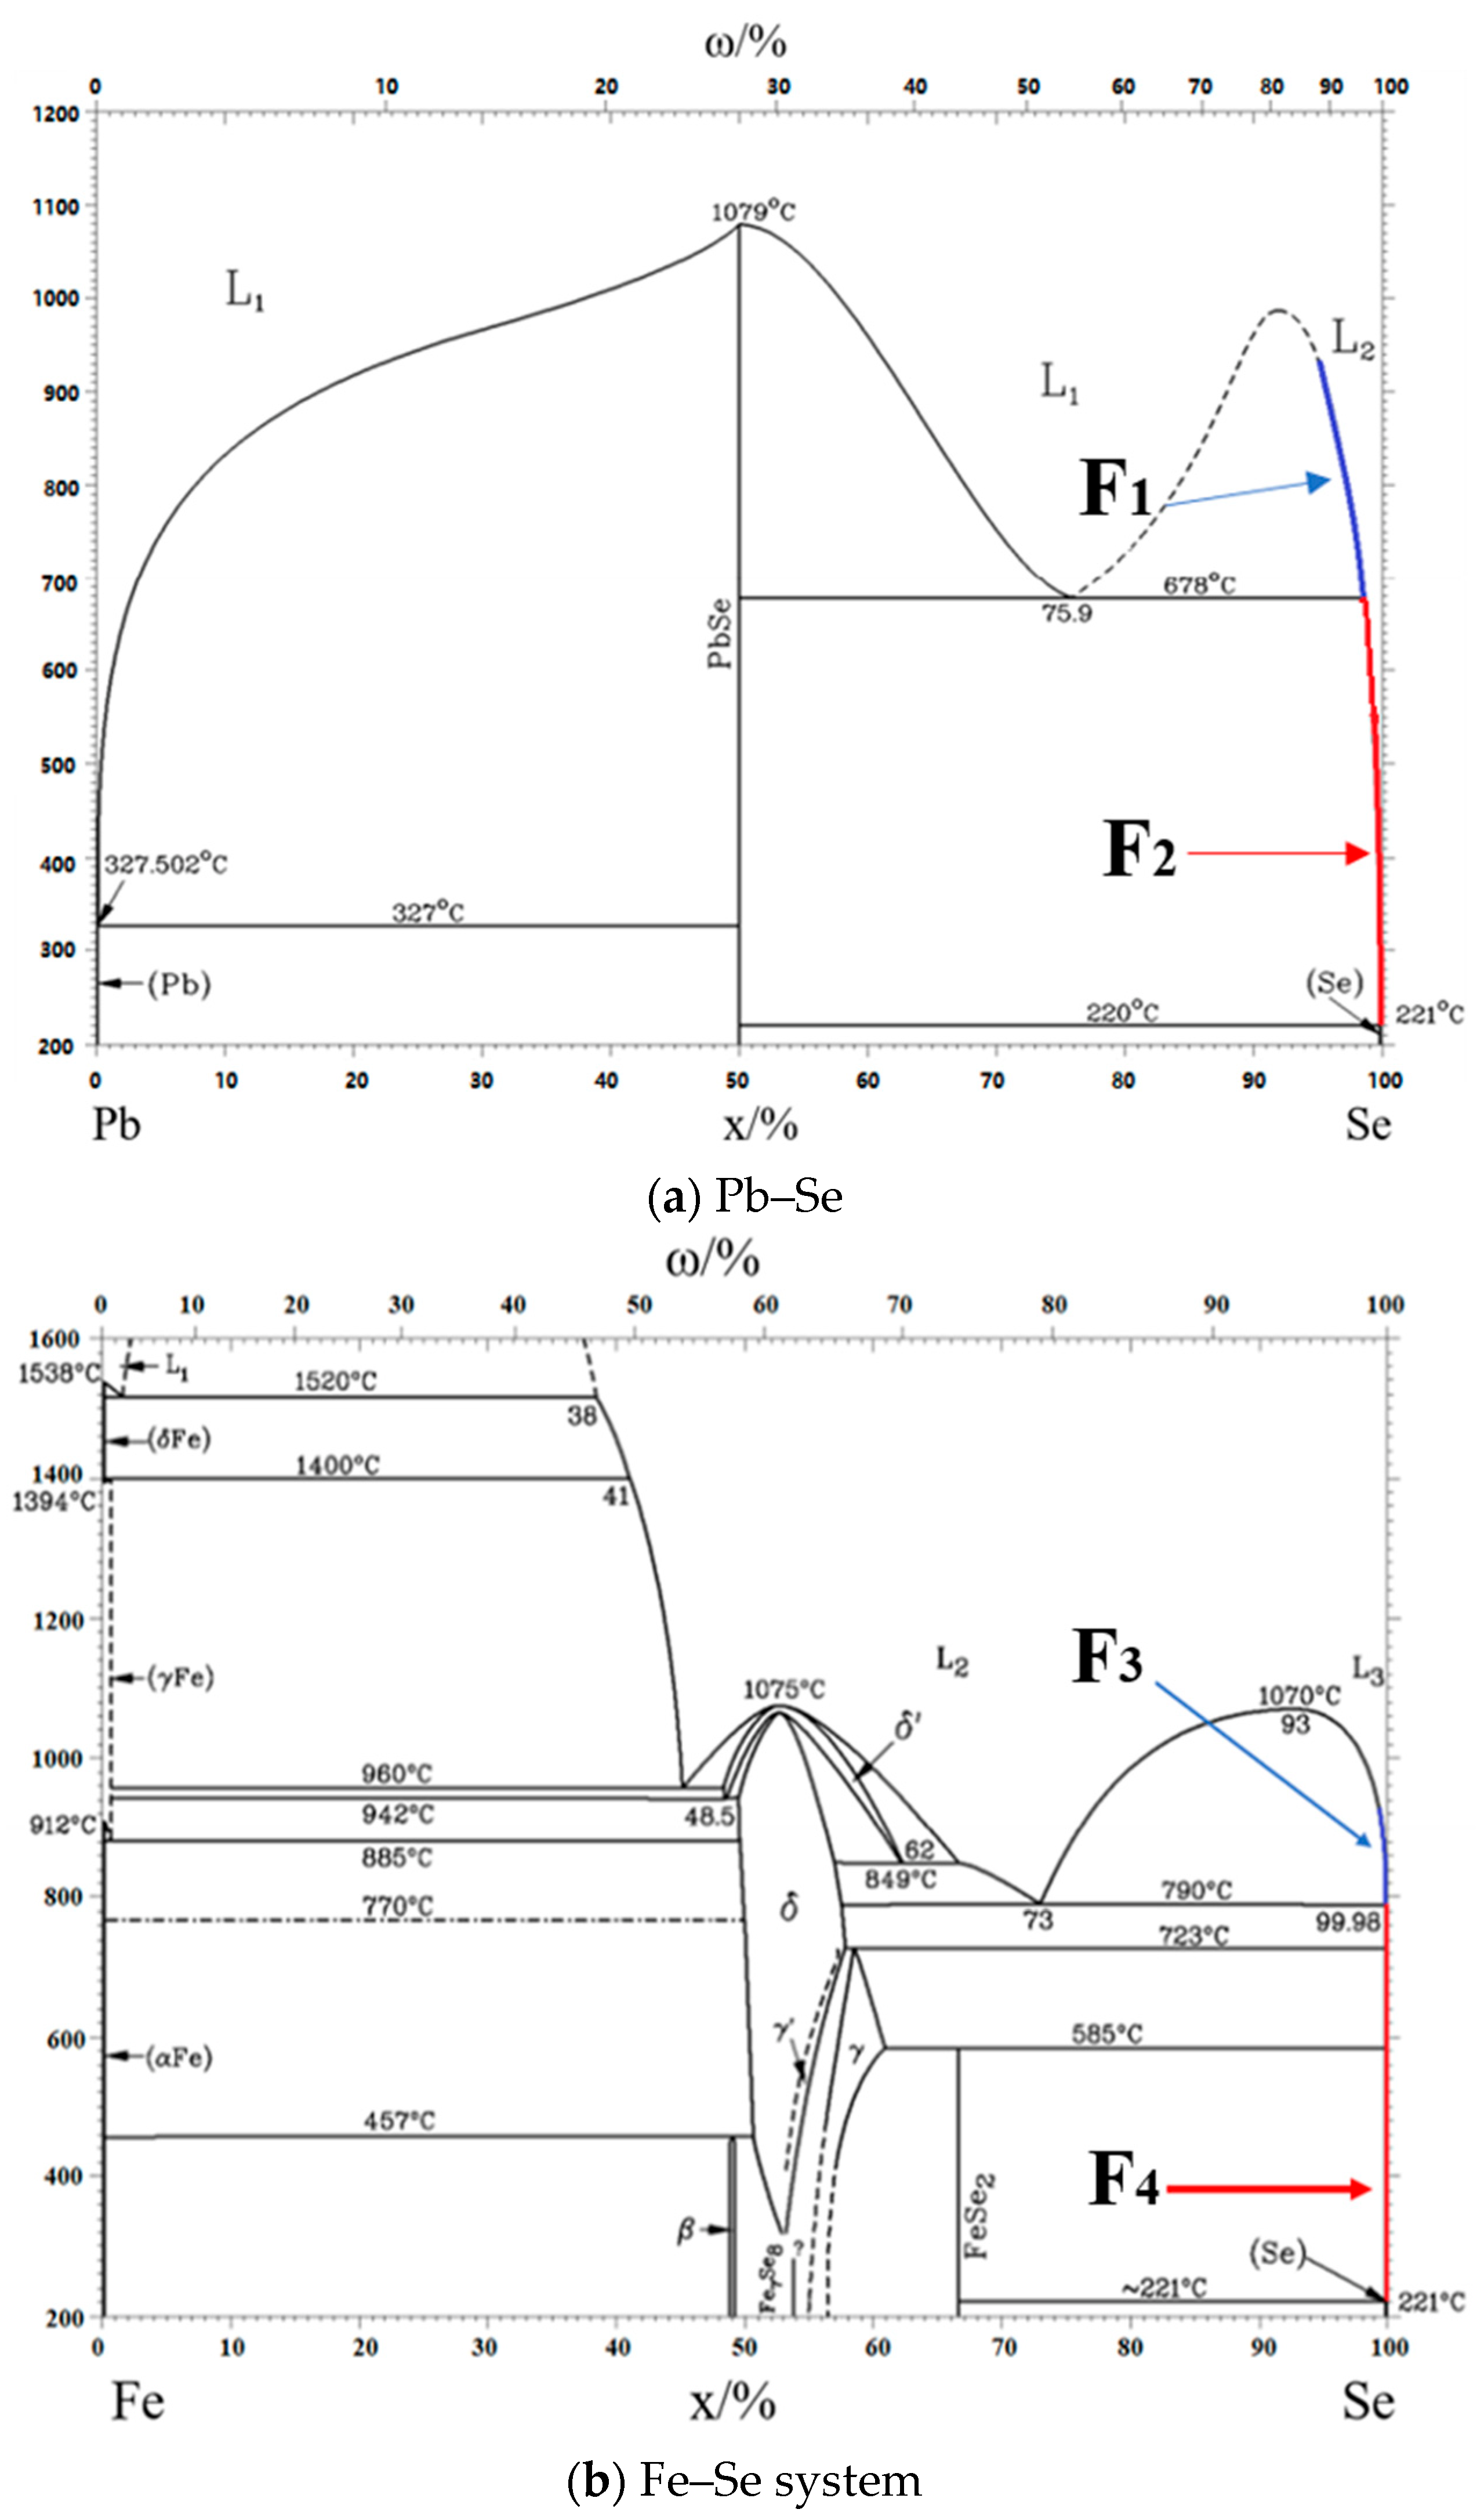
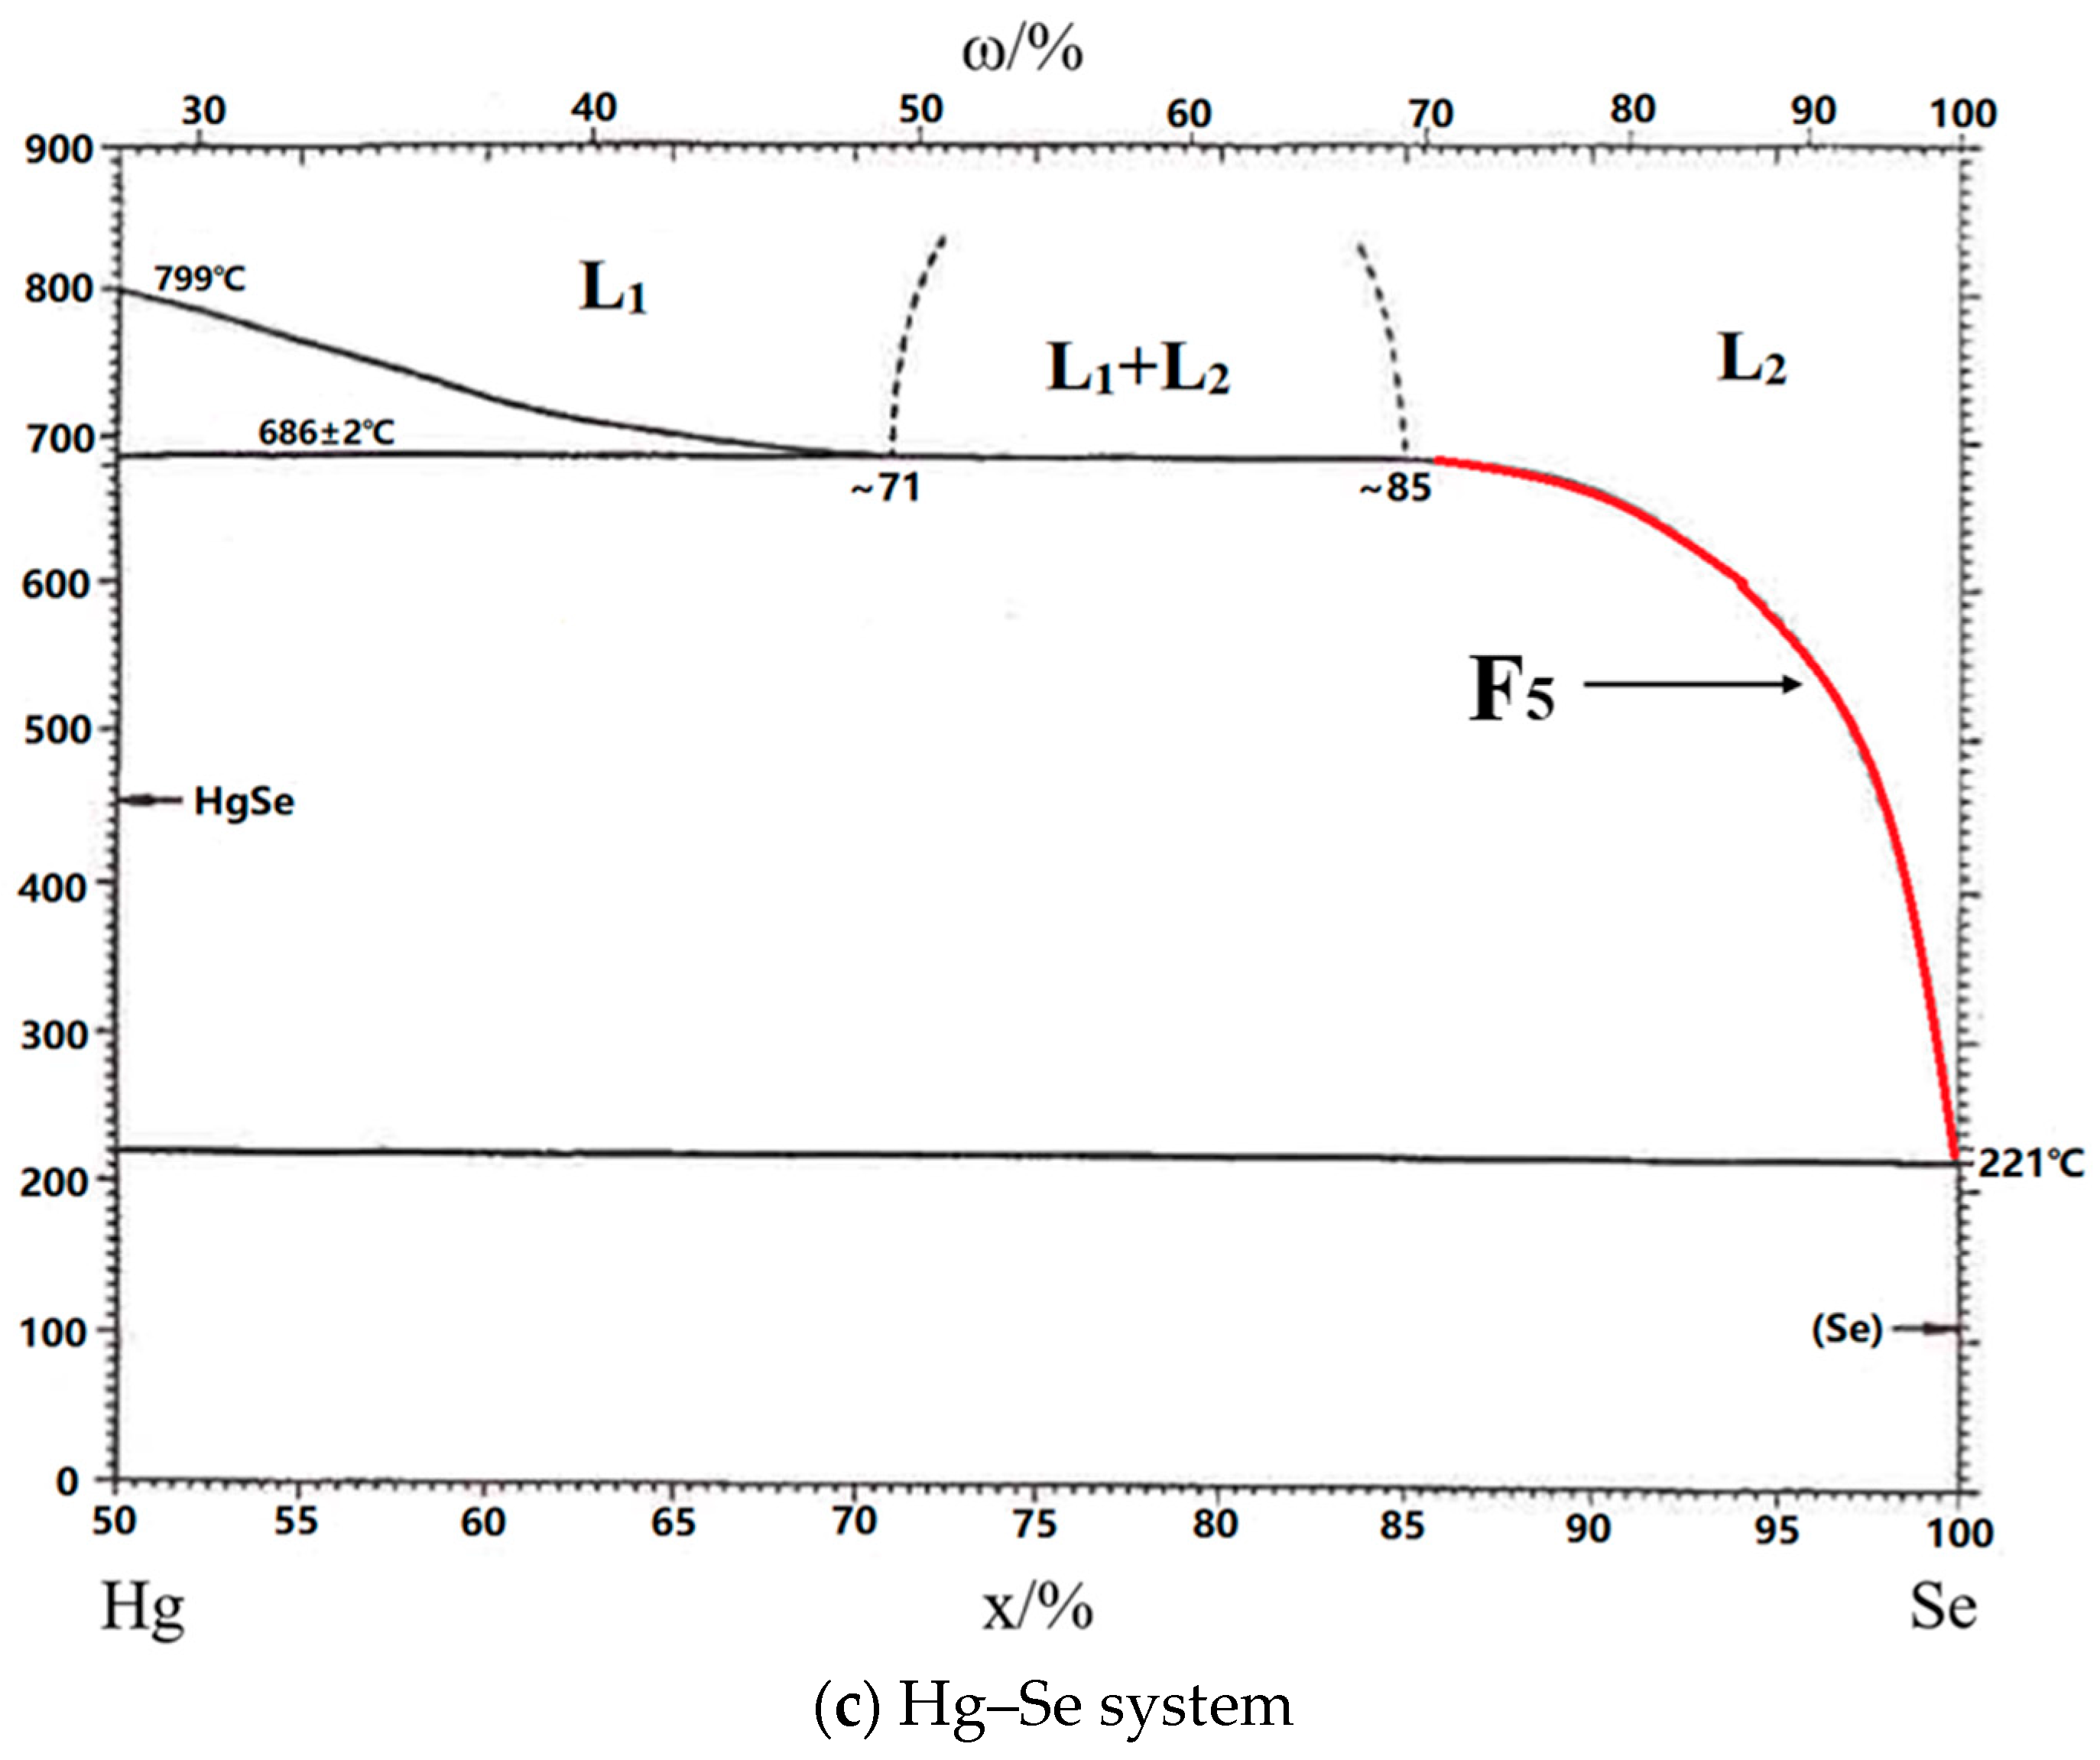
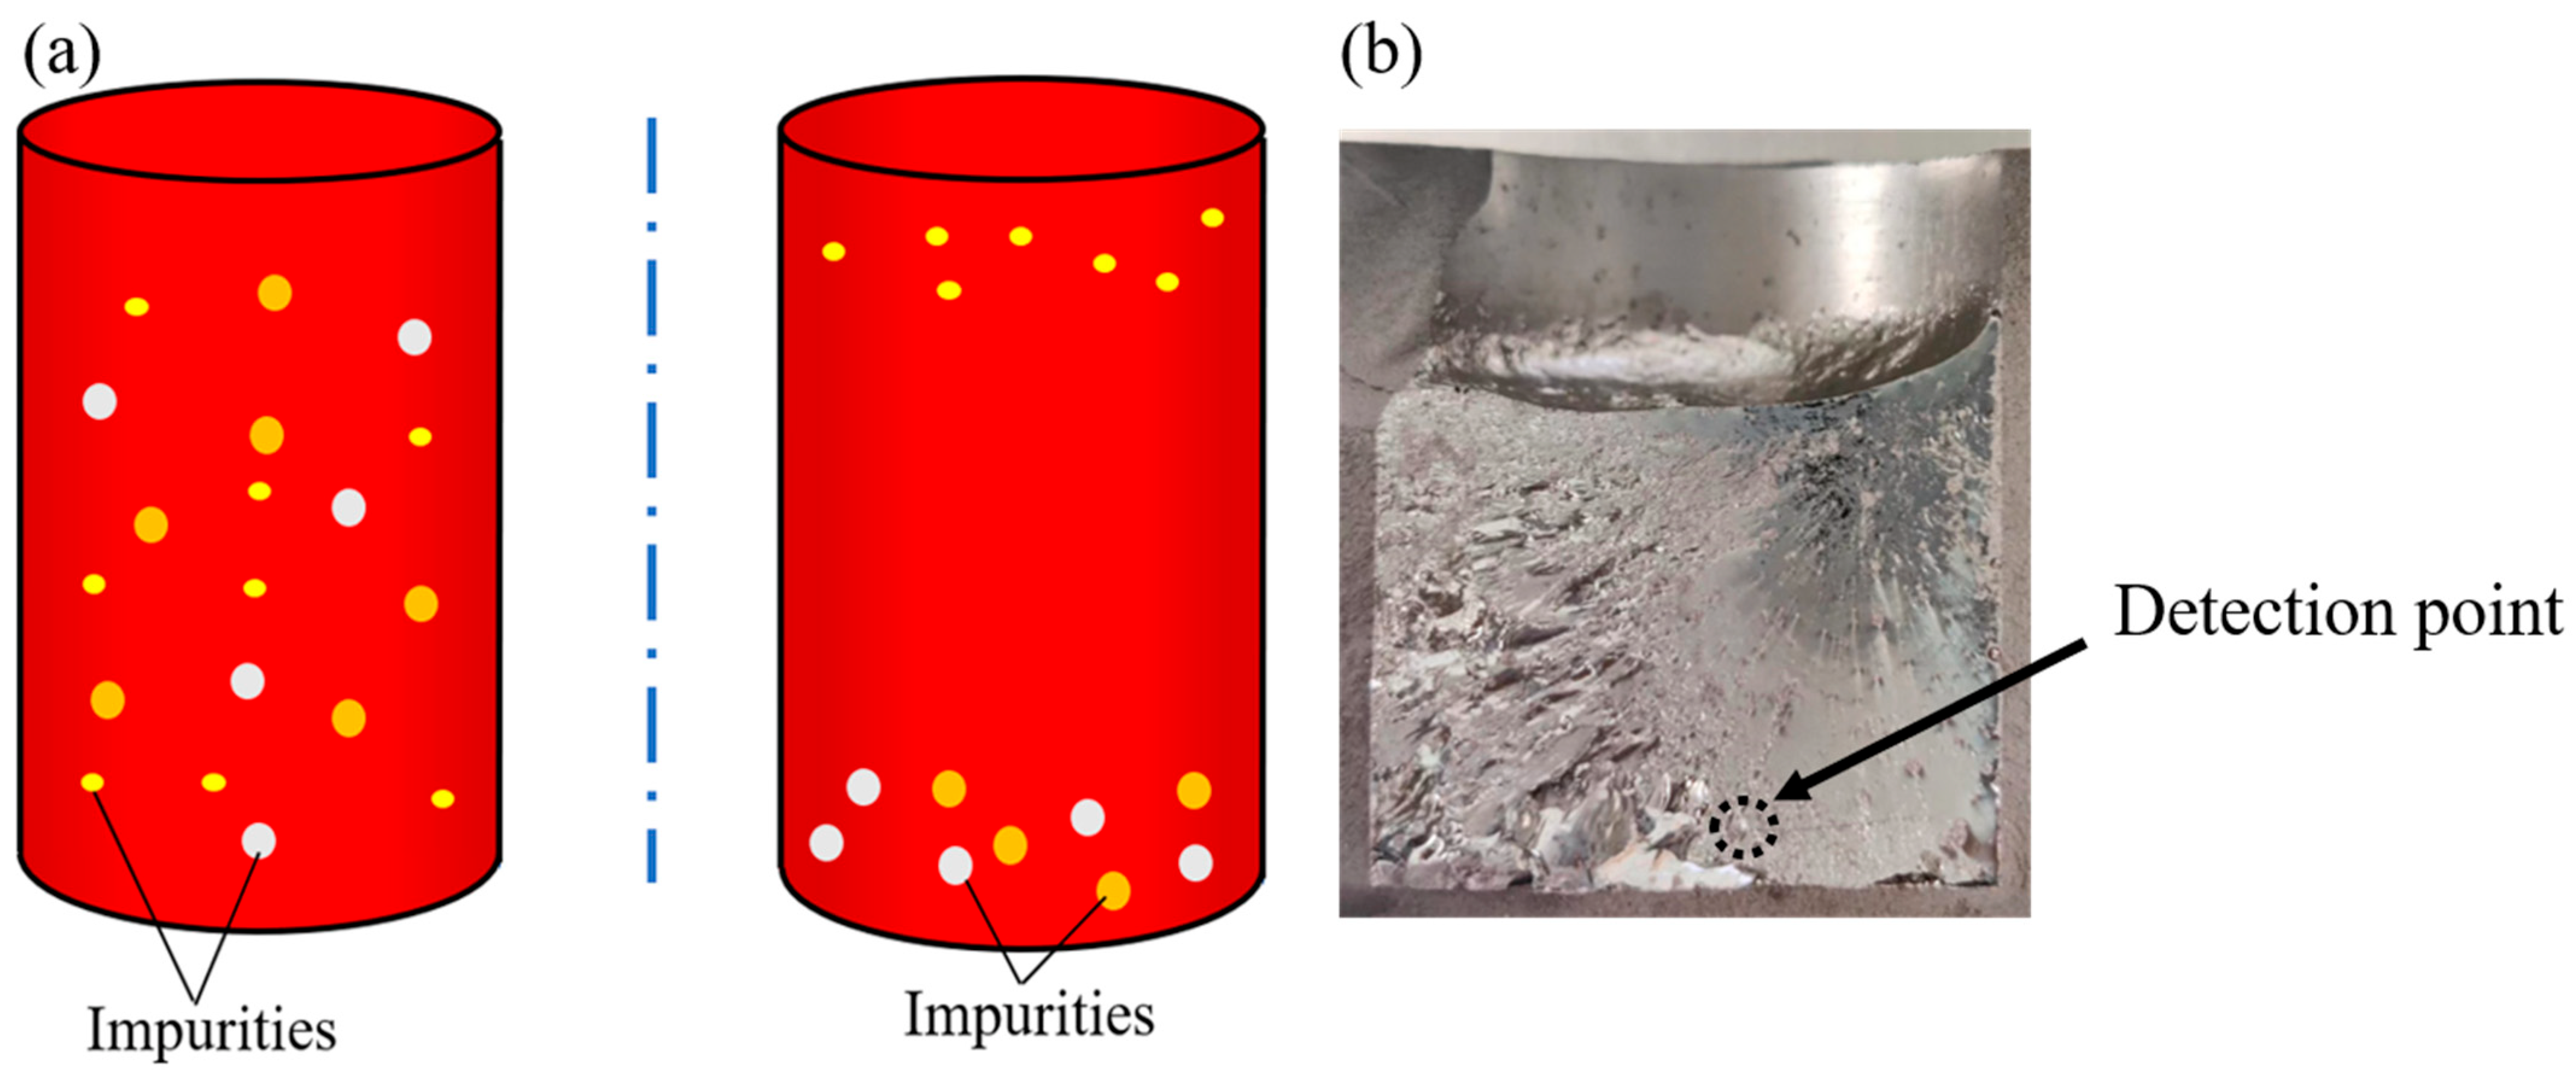
2. Theory
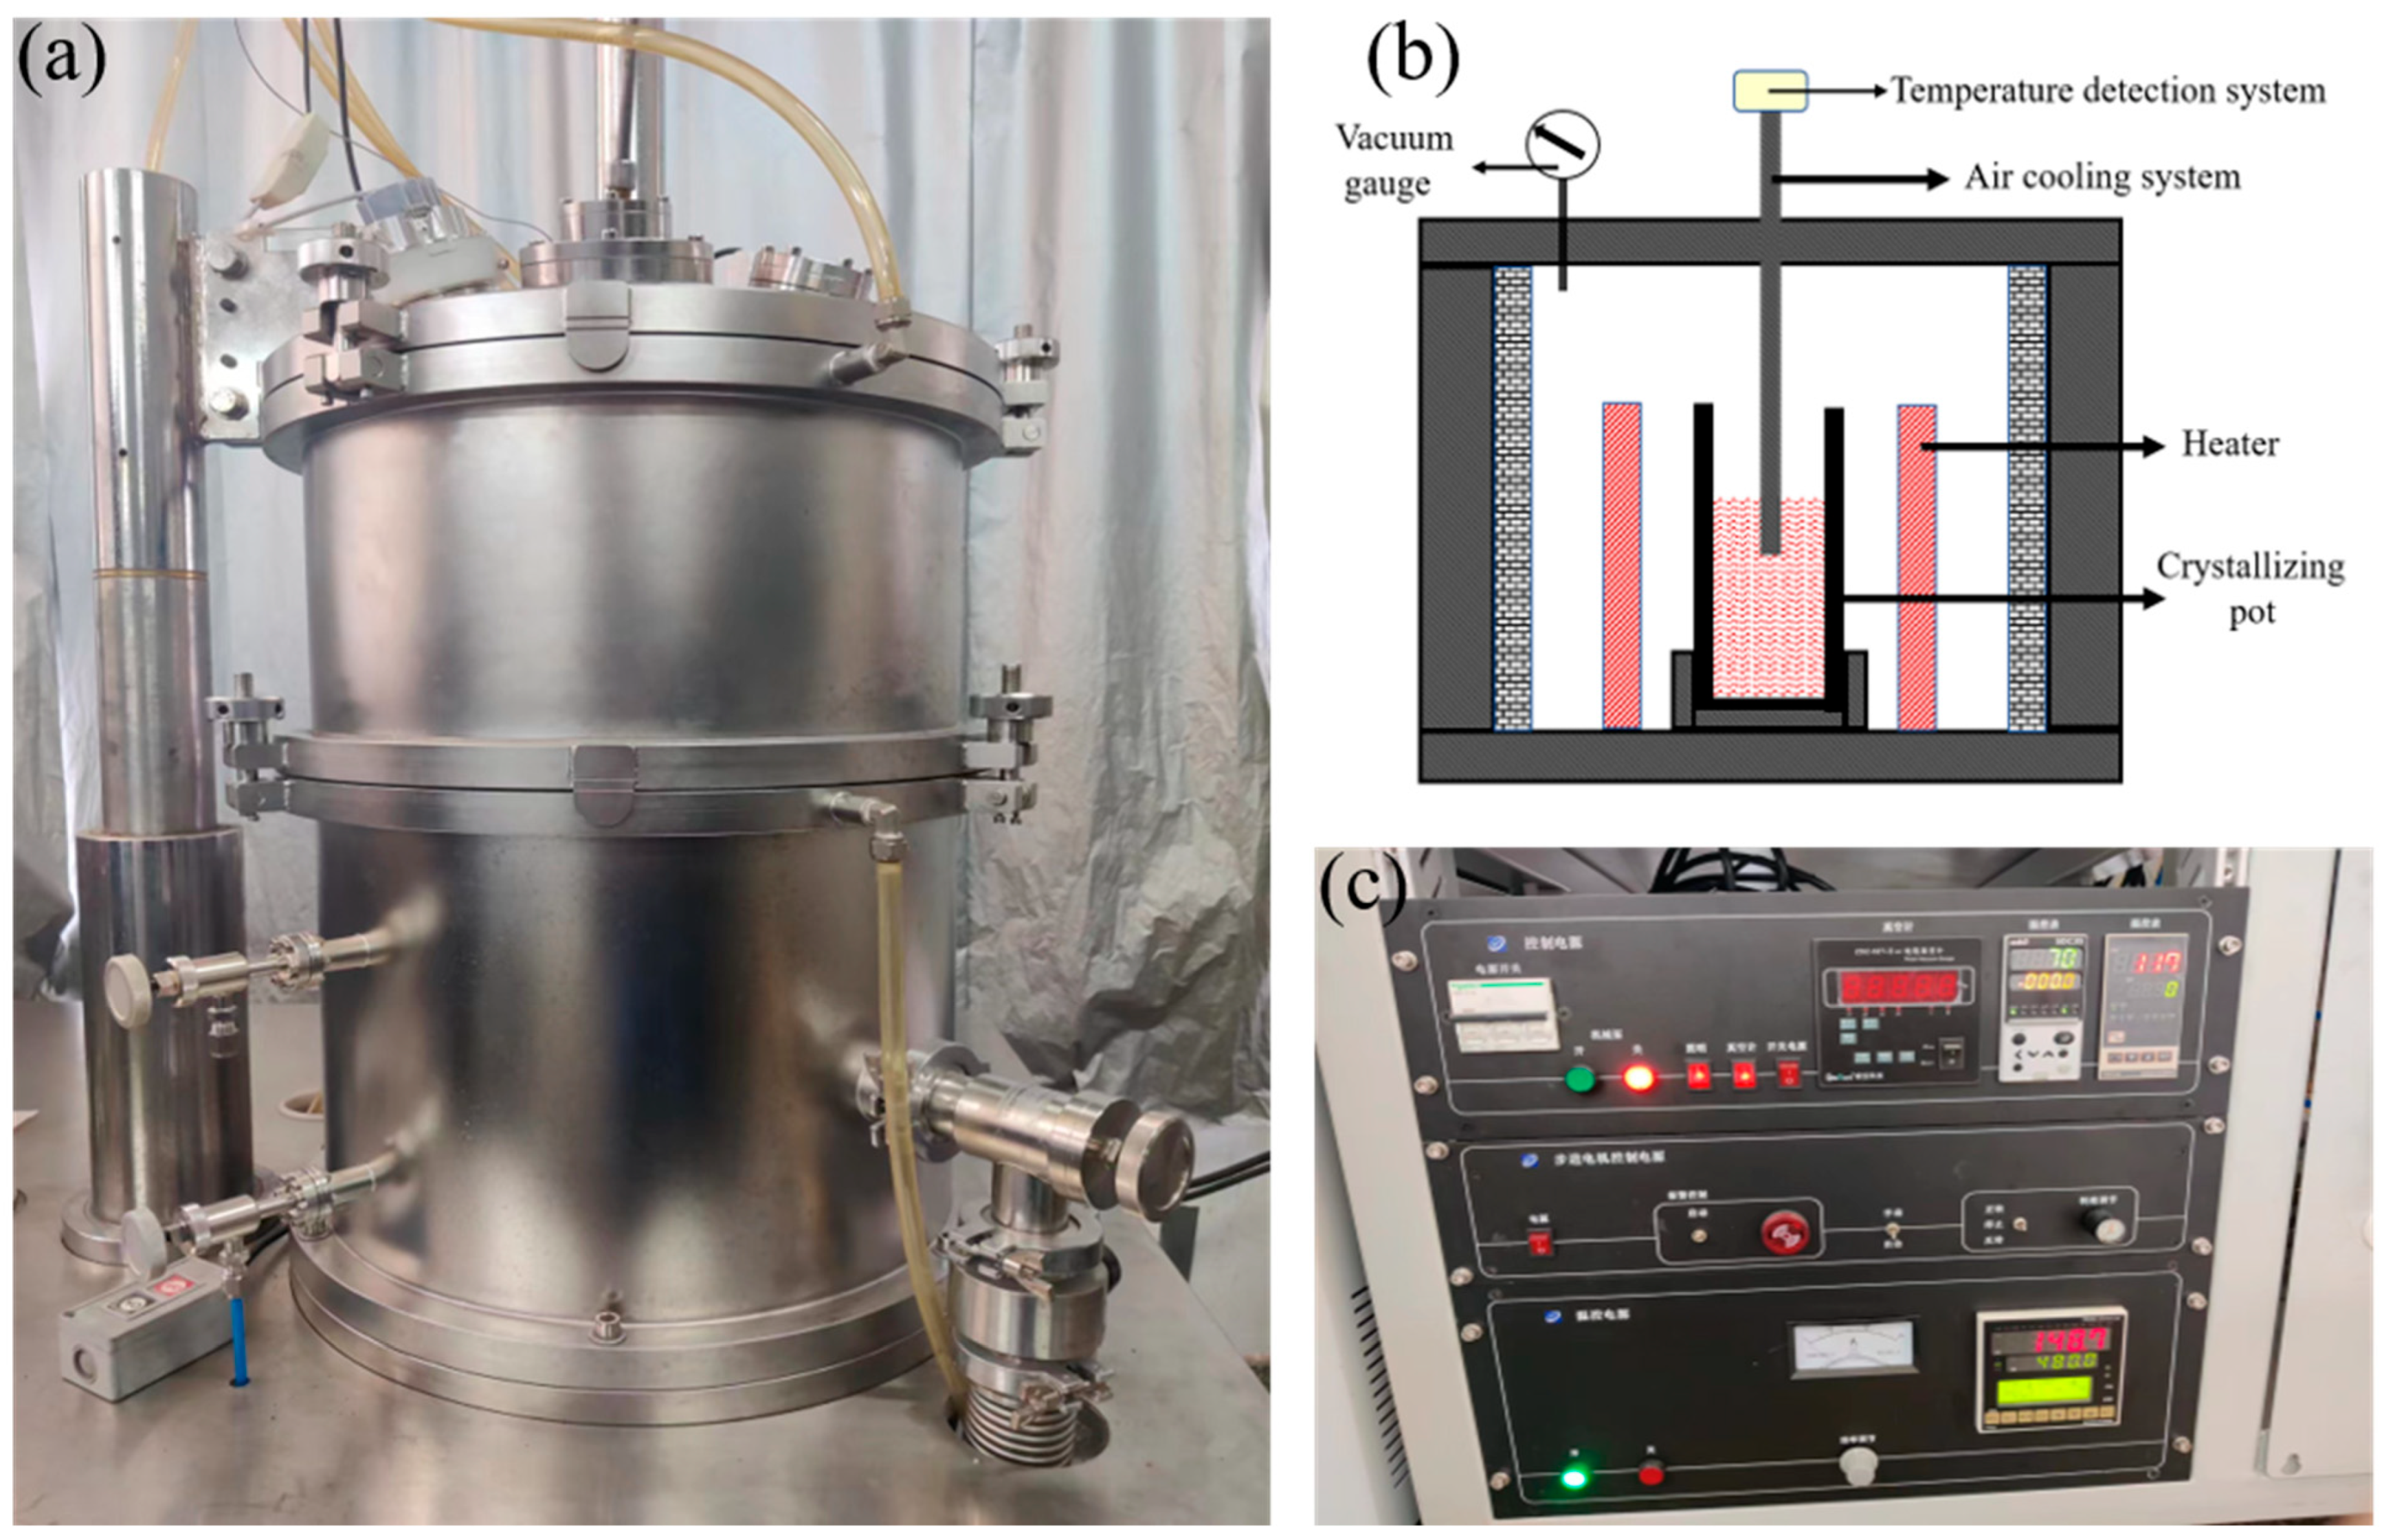
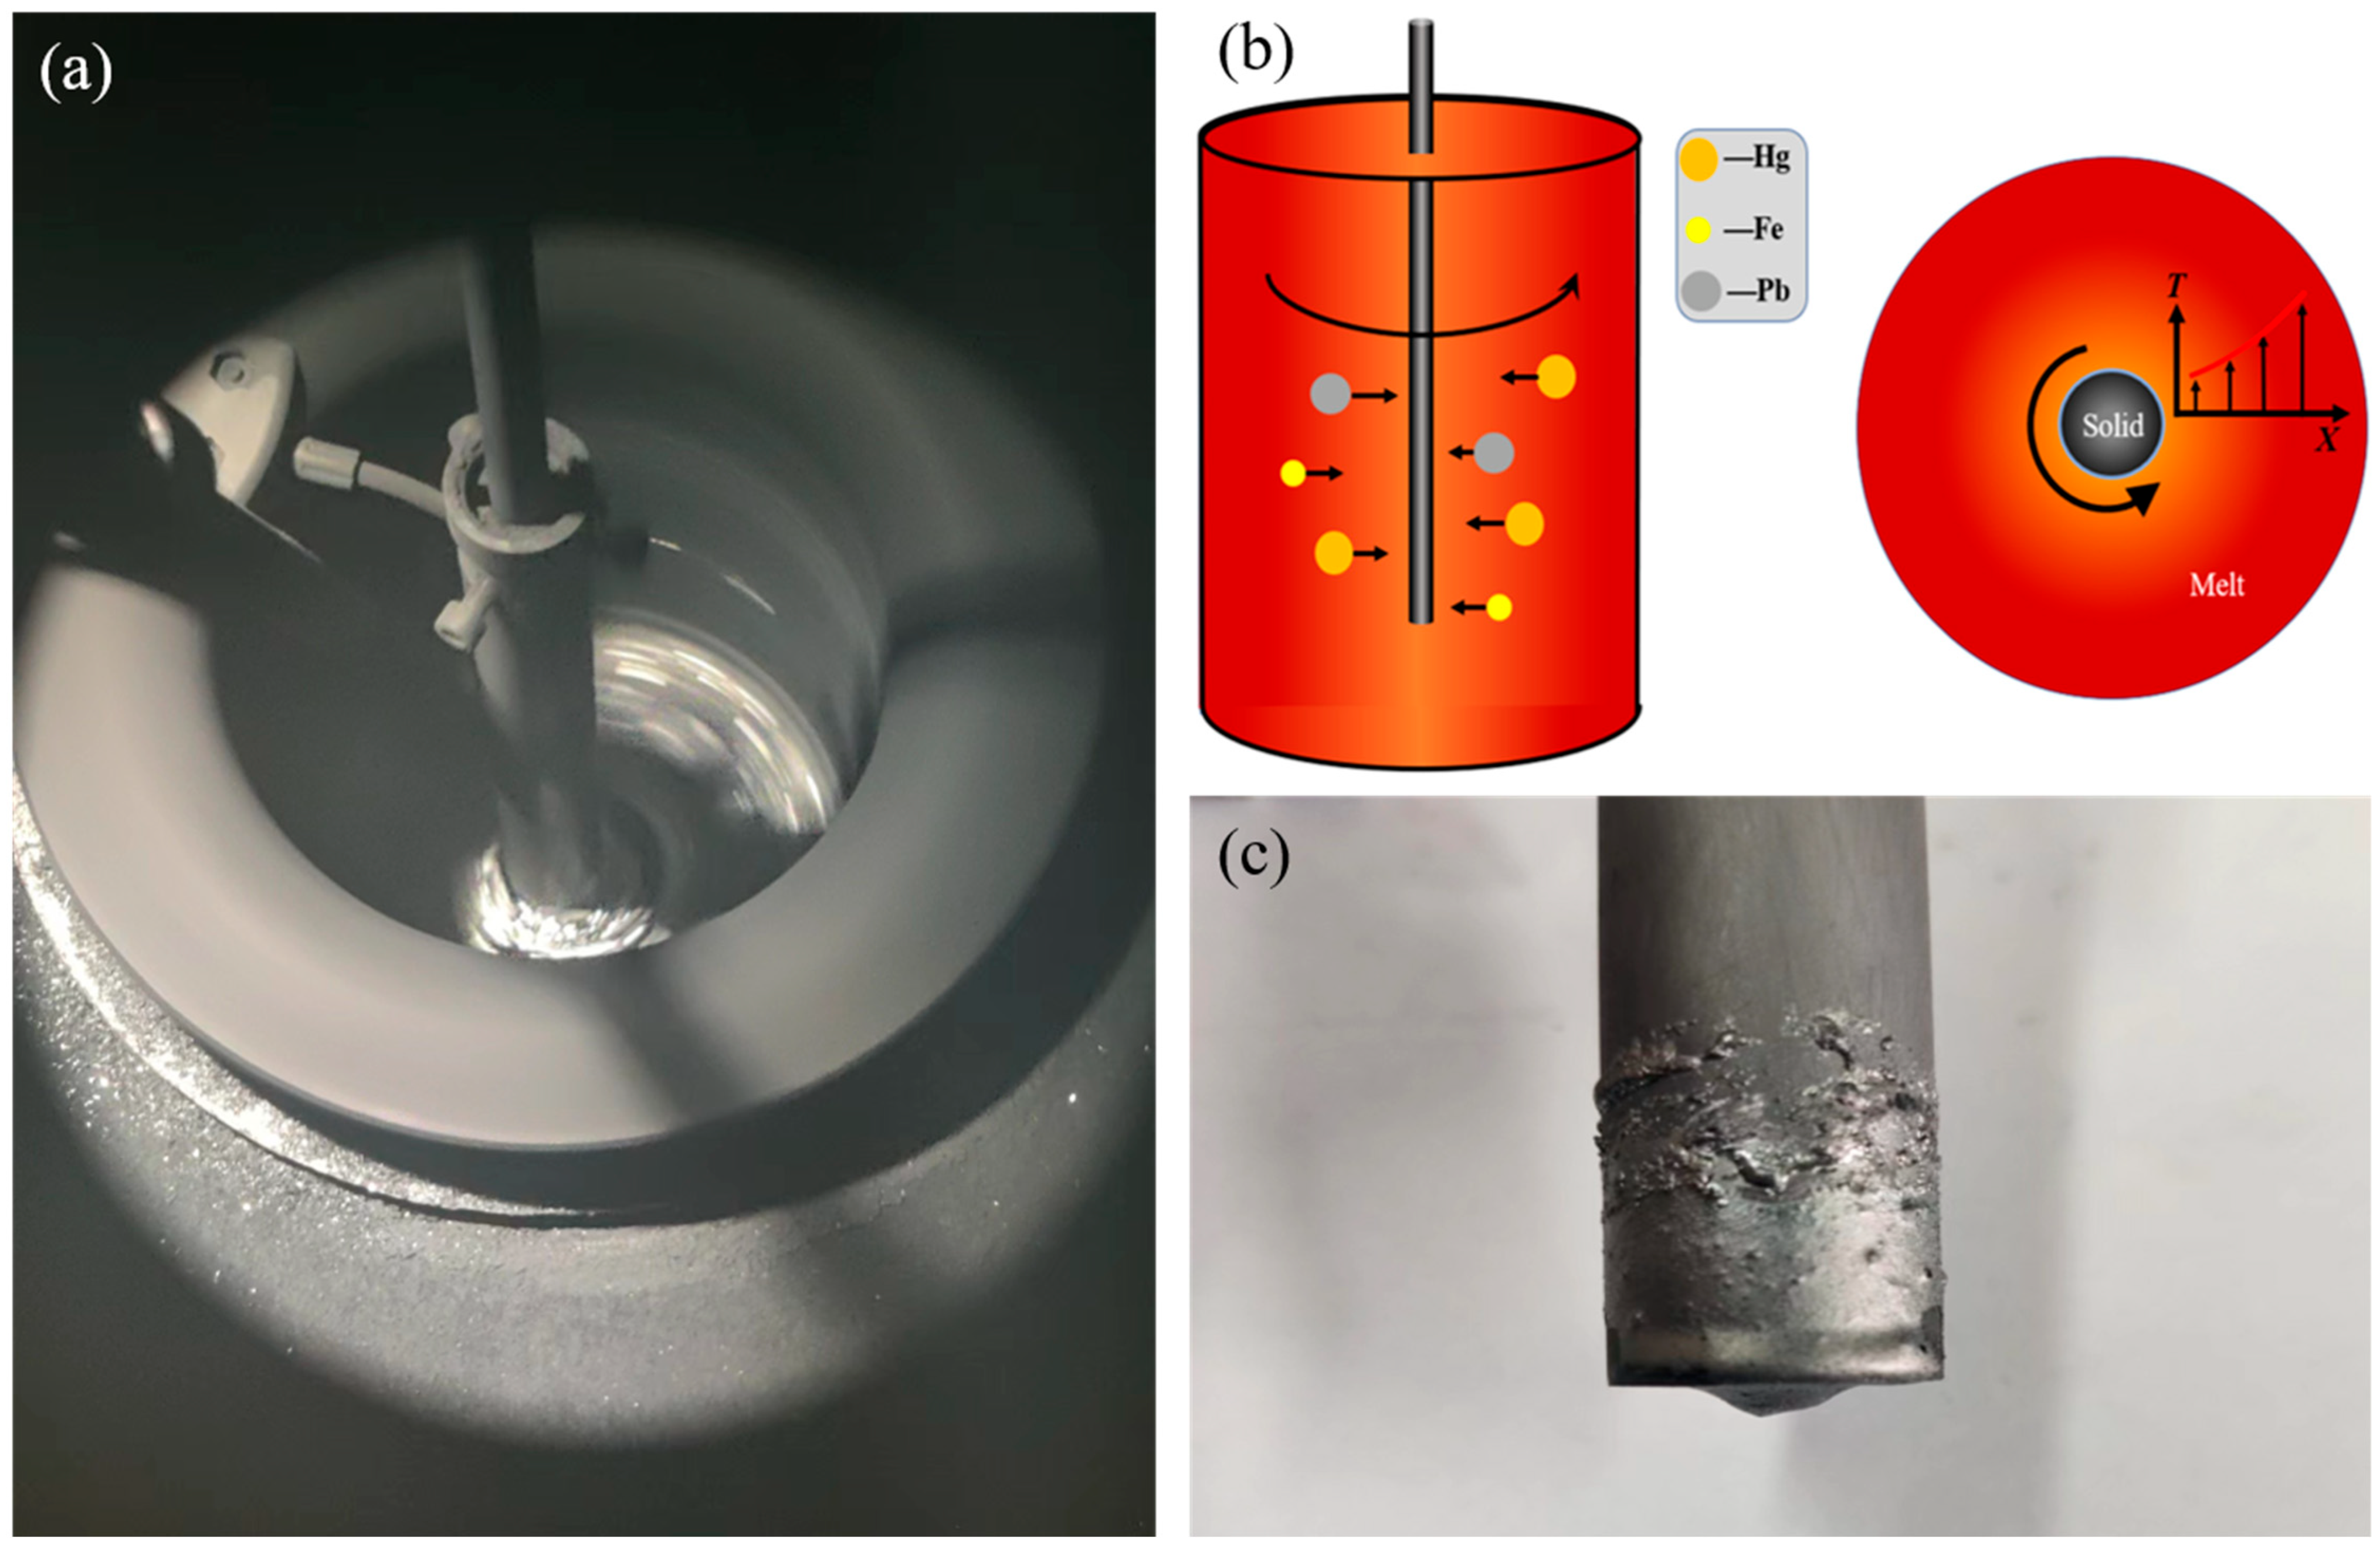
3. Experimental Procedure
4. Results and Discussion
4.1. Calculation of Distribution Coefficient
4.2. Crystallization Temperature
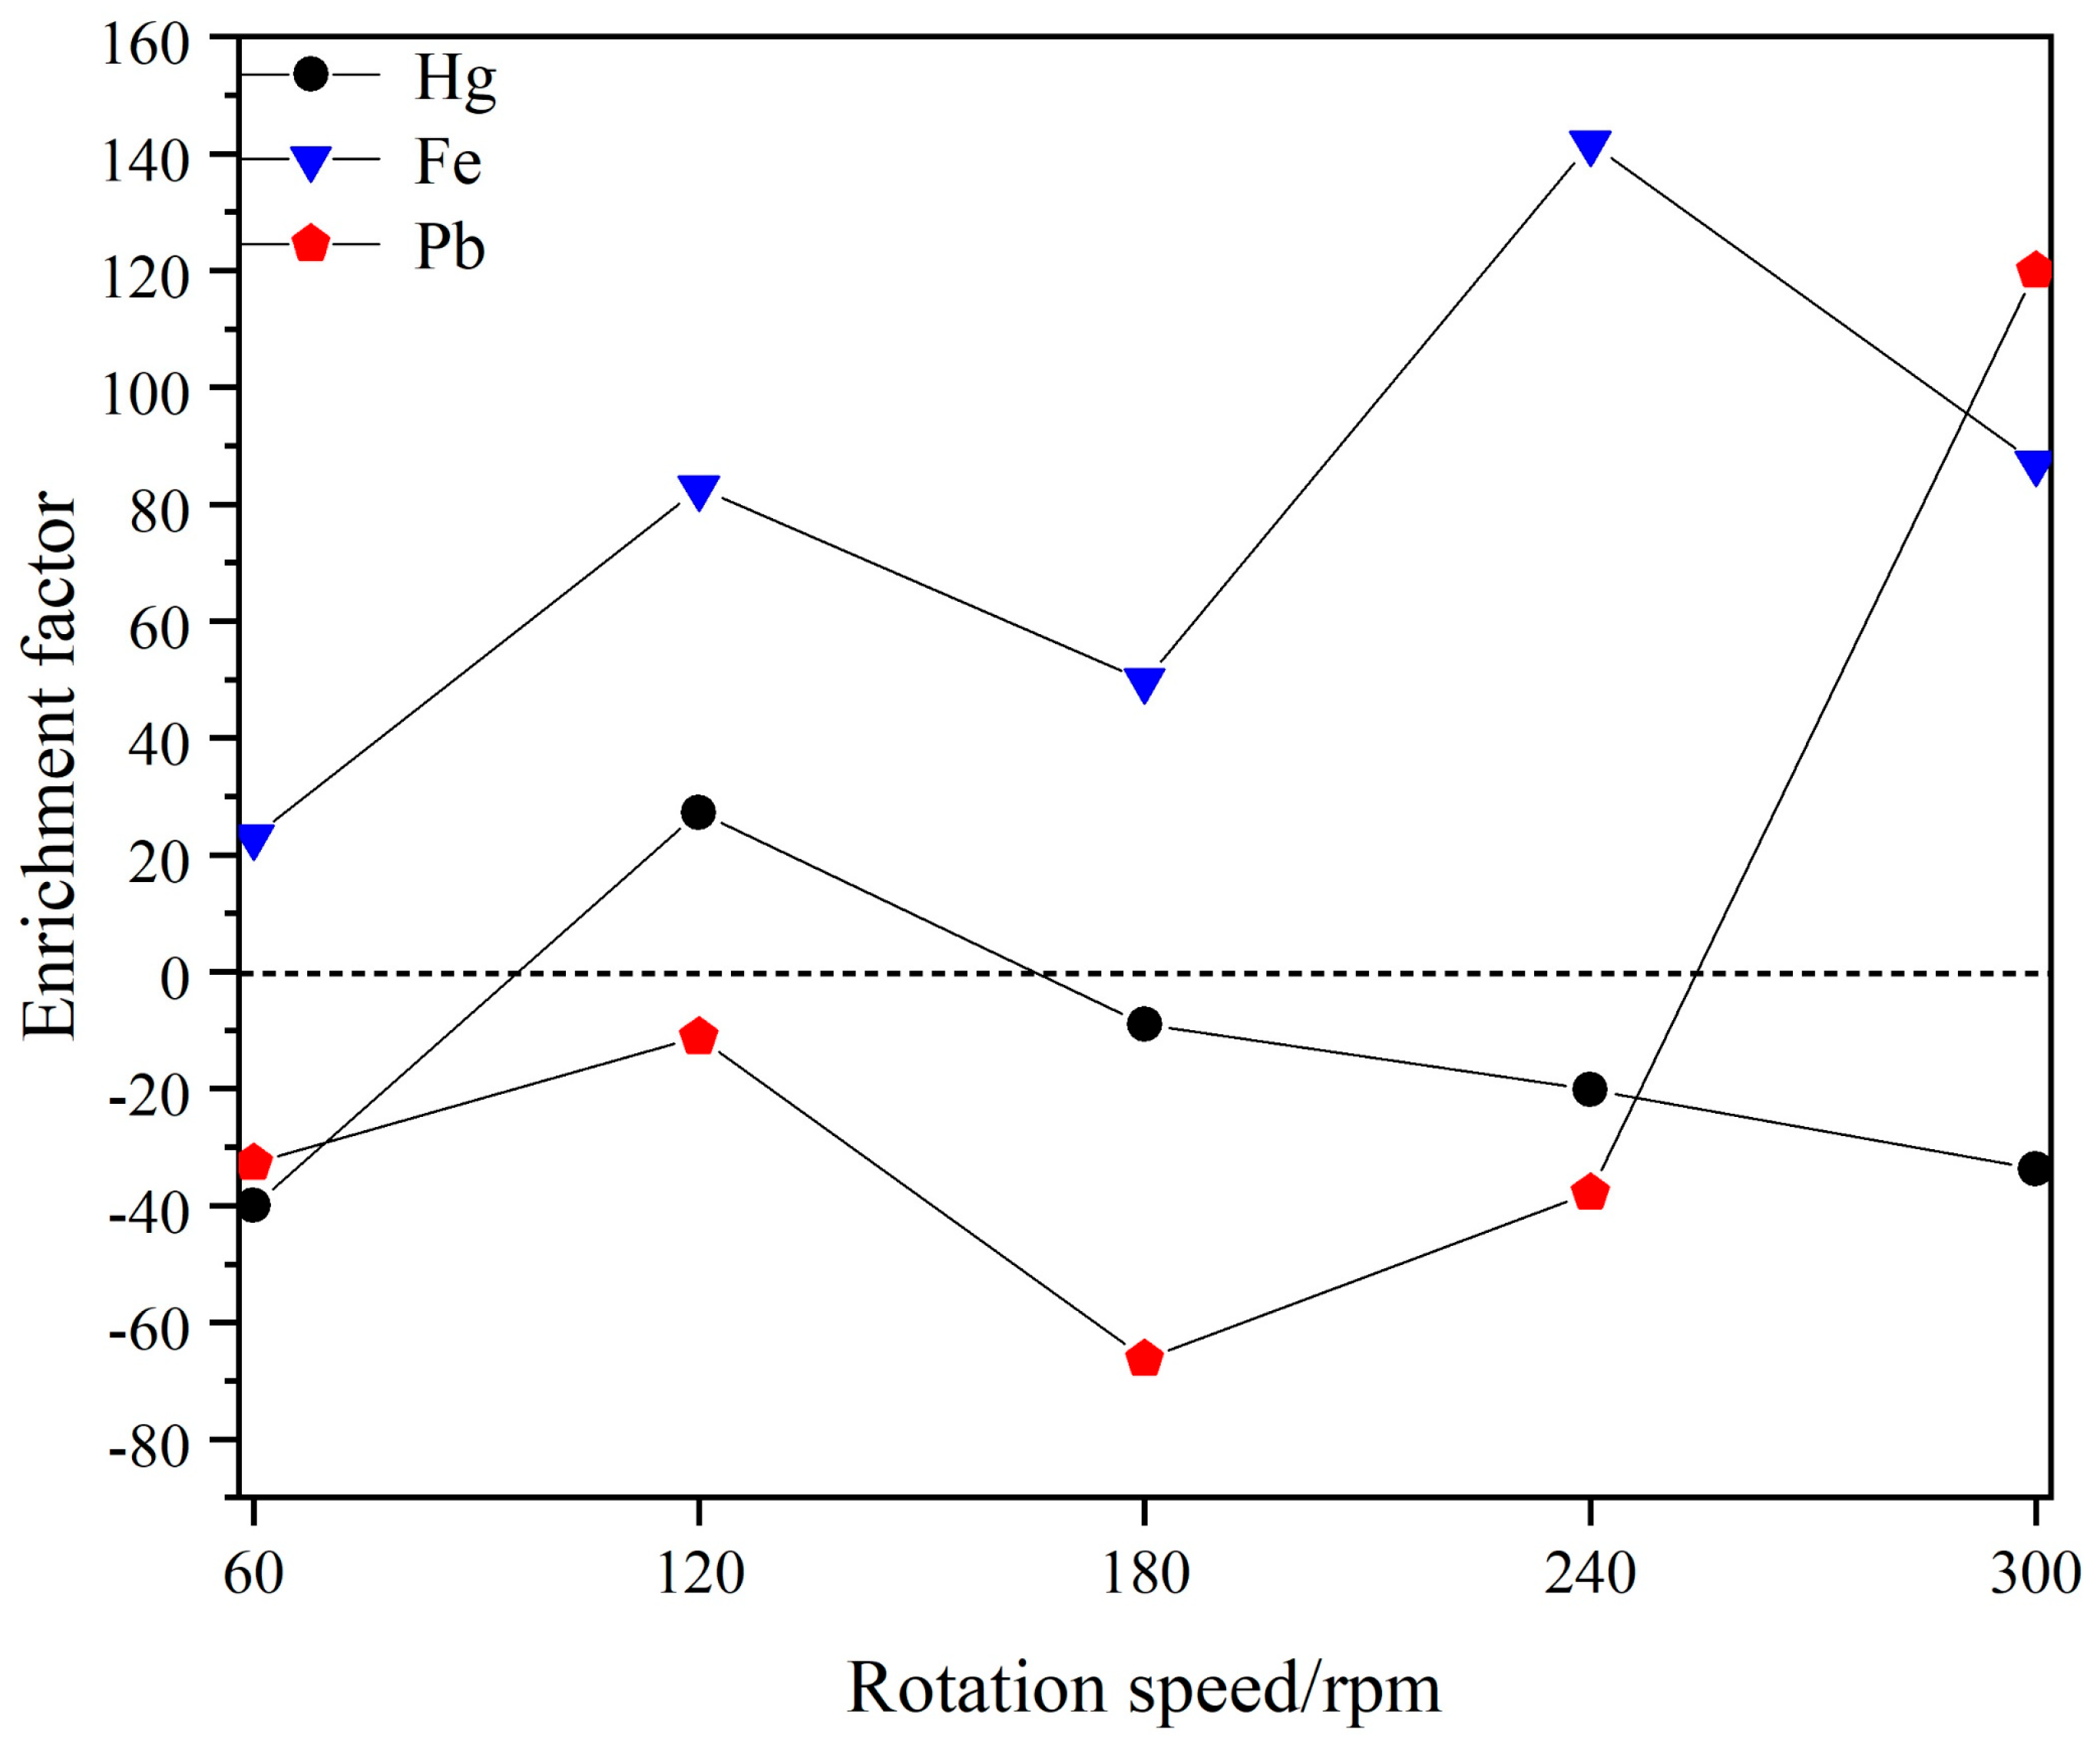
4.3. Rotation Rate
4.4. Purification of Crude Selenium
5. Conclusions
Author Contributions
Funding
Data Availability Statement
Conflicts of Interest
References
- Boyd, R. Selenium stories. Nat. Chem. 2011, 3, 570. [Google Scholar] [CrossRef] [PubMed]
- Gustafsson, A.M.K.; Foreman, M.R.S.J.; Ekberg, C. Recycling of high purity selenium from CIGS solar cell waste materials. Waste Manag. 2014, 34, 1775–1782. [Google Scholar] [CrossRef] [PubMed]
- Jiafeng, Z.; Bao, Z.; Xueyi, G.; Danqing, Z.; Chao, S.; Qian, L. Study on crude selenium purifying by a sulfite sodium leaching method. Rare Met. Mater. Eng. 2011, 40, 121–125. (In Chinese) [Google Scholar]
- Pearson, R.K.; Haugen, G.R. Kinetics of the thermal decomposition of H2Se. Int. J. Hydrog. Energy 1981, 6, 509–519. [Google Scholar] [CrossRef]
- Nielsen, S.; Heritage, R.J. A method for the purification of selenium. J. Electrochem. Soc. 1959, 106, 39. [Google Scholar] [CrossRef]
- Zha, G.; Wang, Y.; Cheng, M.; Huang, D.; Jiang, W.; Xu, B.; Yang, B. Purification of crude selenium by vacuum distillation and analysis. J. Mater. Res. Technol. 2020, 9, 2926–2933. [Google Scholar] [CrossRef]
- Burger, A.; Henderson, D.O.; Morgan, S.H.; Feng, J.; Silberman, E. Purification of selenium by zone refining. J. Cryst. Growth 1990, 106, 34–37. [Google Scholar] [CrossRef]
- Feldewerth, G.B.; Bollong, A.B.I.; Bunnell, D.C. Preparation of High Purity Elements. U.S. Patent 5,513,834, 7 May 1996. [Google Scholar]
- Su, C.H.; Sha, Y.G. Segregation coefficients of impurities in selenium by zone refining. J. Cryst. Growth 1998, 187, 569–572. [Google Scholar] [CrossRef]
- Salman, S.; Hasan, N.; Hasan, M.; Kubra, K.T.; Sheikh, C.; Rehan, A.I.; Waliullah, R.; Rasee, A.I.; Awual, E.; Hossain, M.S.; et al. Improving copper (II) ion detection and adsorption from wastewater by the ligand-functionalized composite adsorbent. J. Mol. Struct. 2023, 1282, 135259. [Google Scholar] [CrossRef]
- Salman, S.; Sheikh, C.; Hasan, M.; Hasan, N.; Kubra, K.T.; Rehan, A.I.; Awual, E.; Rasee, A.I.; Waliullah, R.; Hossain, M.S.; et al. Chitosan-coated cotton fiber composite for efficient toxic dye encapsulation from aqueous media. Appl. Surf. Sci. 2023, 622, 157008. [Google Scholar] [CrossRef]
- Hasan, M.; Kubra, K.T.; Hasan, N.; Awual, E.; Salman, S.; Sheikh, C.; Rehan, A.I.; Rasee, A.I.; Waliullah, R.; Islam, S.; et al. Sustainable ligand-modified based composite material for the selective and effective cadmium (II) capturing from wastewater. J. Mol. Liq. 2023, 371, 121125. [Google Scholar] [CrossRef]
- Ramirez-Sanchez, I.M.; Apul, O.G.; Saleh, N.B. Photocatalytic activity of micron-scale brass on emerging pollutant degradation in water: Mechanism elucidation and removal efficacy assessment. RSC Adv. 2020, 10, 39931–39942. [Google Scholar] [CrossRef] [PubMed]
- Wang, Q.; Chen, J.; Zhao, J.; Cao, Y.; Li, J.; Liu, H.; Chen, F. Removal of p-chloronitrobenzene from wastewater by aluminum and low melting point metals (Al-Ga-In-Sn) alloy. J. Environ. Chem. Eng. 2021, 9, 106339. [Google Scholar] [CrossRef]
- Friedrich, S.; Curtolo, D.C.; Friedrich, B. Effect of process parameter variation on purity during rotary fractional crystallization of Aluminum. Open J. Met. 2017, 7, 25. [Google Scholar] [CrossRef]
- Curtolo, D.C.; Friedrich, S.; Bellin, D.; Nayak, G.S.; Friedrich, B. Definition of a first process window for purification of aluminum via “Cooled Finger” crystallization technique. Metals 2017, 7, 341. [Google Scholar] [CrossRef]
- Yaghy, G.; Ali, A.; Charpentier, T.V.J.; Fusi, L.; Neville, A.; Harbottle, D. Wax deposition using a cold rotating finger: An empirical and theoretical assessment in thermally driven and sloughing regimes. J. Pet. Sci. Eng. 2021, 200, 108252. [Google Scholar] [CrossRef]
- Versey, J.R.; Phongikaroon, S.; Simpson, M.F. Separation of CsCl from LiCl-CsCl molten salt by cold finger melt crystallization. Nucl. Eng. Technol. 2014, 46, 395–406. [Google Scholar] [CrossRef]
- Qiu, K.; Chen, Q. Thermodynamical principle of metal refining by fractional crystallization from metals. Nonferrous Met. 1999, 51, 43–48. (In Chinese) [Google Scholar]
- Burton, J.A.; Prim, R.C.; Slichter, W.P. The distribution of solute in crystals grown from the melt. Part I. Theoretical. J. Chem. Phys. 1953, 21, 1987–1991. [Google Scholar] [CrossRef]
- Thaddeus, B.; Massalski, T.B. Binary Phase Diagrams, 2nd ed.; Plus Updates; ASM International, The Materials Information Society: Russell Township, OH, USA, 1996. [Google Scholar]


| Hg | Fe | Pb | As | Sb | Te | Bi | Al | |
|---|---|---|---|---|---|---|---|---|
| Raw material 1 | 19.72 | 18.53 | 2.75 | 4.92 | 2.44 | 2.94 | 2.63 | 1.01 |
| Raw material 2 | 13.38 | 139 | 21.07 | 5.43 | 8.38 | 12.42 | 0.96 | 0.67 |
| 3N standard | 10 | 100 | 20 | 30 | 10 | 100 | / | / |
| 4N standard | 3 | 10 | 5 | 5 | 5 | 10 | 5 | 8 |
| Equation | A | B | C | D | E | Range of x | R2 |
|---|---|---|---|---|---|---|---|
| F1(Pb–Se) | 0 | 93.4–98.5% | 0.9986 | ||||
| F2(Pb–Se) | 98.5–100% | 0.9932 | |||||
| F3(Fe–Se) | 99.8–99.98% | 0.9995 | |||||
| F4(Fe–Se) | 0 | 0 | 0 | 99.98–100% | 0.9989 | ||
| F5(Hg–Se) | 0 | 86–100% | 0.9957 |
| Temperature/℃ | Rotation Speed/rpm | Holding Time/min | Hg/ppm | Pb/ppm | Fe/ppm |
|---|---|---|---|---|---|
| 212 | 120 | 120 | 7.84 | 23.31 | 254 |
| 217 | 120 | 120 | 9.52 | 15.35 | 387 |
| 222 | 120 | 120 | 27.03 | 18.43 | 899 |
| 227 | 120 | 120 | 15.51 | 11.71 | 512 |
| 232 | 120 | 120 | 12.46 | 13.37 | 311 |
| Raw material 1 | 19.72 | 2.75 | 18.53 |
| Hg | Fe | Pb | As | Sb | Te | Bi | Al | |
|---|---|---|---|---|---|---|---|---|
| Sample | 19.44 | 18.53 | 3.52 | 5.76 | 8.49 | 7.03 | 0.31 | 4.22 |
| Raw material 1 | 19.72 | 18.53 | 2.75 | 4.93 | 2.44 | 2.94 | 2.63 | 1.01 |
| 3N standard | 10 | 100 | 20 | 30 | 10 | 100 | / | / |
| Crystallization Times | Mass/g | Impurity Content/ppm | |||
|---|---|---|---|---|---|
| Pb | Fe | Hg | As | ||
| Raw material 2 | 2000 | 21.07 | 139 | 13.38 | 5.43 |
| 1 | 1986 | 18.71 | 95 | 12.45 | 5.10 |
| 3 | 1947 | 10.27 | 33.81 | 10.25 | 4.66 |
| 5 | 1914 | 5.63 | 16.19 | 9.86 | 4.21 |
| 7 | 1887 | 2.48 | 11.83 | 9.72 | 3.86 |
| 9 | 1853 | <0.5 | 5.17 | 9.54 | 3.15 |
| Crystallization Times | Mass/g | Sb | Te | Bi | Al |
| Raw material 2 | 2000 | 8.38 | 12.42 | 0.96 | 0.67 |
| 1 | 1981 | 7.13 | 10.57 | 0.61 | <0.5 |
| 3 | 1943 | 5.45 | 6.31 | <0.5 | <0.5 |
| 5 | 1903 | 3.84 | 4.55 | <0.5 | <0.5 |
| 7 | 1884 | 3.41 | 3.78 | <0.5 | <0.5 |
| 9 | 1853 | 2.89 | 2.27 | <0.5 | <0.5 |
Disclaimer/Publisher’s Note: The statements, opinions and data contained in all publications are solely those of the individual author(s) and contributor(s) and not of MDPI and/or the editor(s). MDPI and/or the editor(s) disclaim responsibility for any injury to people or property resulting from any ideas, methods, instructions or products referred to in the content. |
© 2023 by the authors. Licensee MDPI, Basel, Switzerland. This article is an open access article distributed under the terms and conditions of the Creative Commons Attribution (CC BY) license (https://creativecommons.org/licenses/by/4.0/).
Share and Cite
He, B.; Wang, W.; Jiang, W.; Xu, B.; Yang, H. Removing of Fe, Pb and Hg from Crude Selenium by Fractional Crystallization. Metals 2023, 13, 739. https://doi.org/10.3390/met13040739
He B, Wang W, Jiang W, Xu B, Yang H. Removing of Fe, Pb and Hg from Crude Selenium by Fractional Crystallization. Metals. 2023; 13(4):739. https://doi.org/10.3390/met13040739
Chicago/Turabian StyleHe, Bei, Weiyi Wang, Wenlong Jiang, Baoqiang Xu, and Hongwei Yang. 2023. "Removing of Fe, Pb and Hg from Crude Selenium by Fractional Crystallization" Metals 13, no. 4: 739. https://doi.org/10.3390/met13040739
APA StyleHe, B., Wang, W., Jiang, W., Xu, B., & Yang, H. (2023). Removing of Fe, Pb and Hg from Crude Selenium by Fractional Crystallization. Metals, 13(4), 739. https://doi.org/10.3390/met13040739