Abstract
The performance of Cu-Fe alloy is related to the solidification structure, which is directly determined by the microstructure evolution during solidification. The solidification sequence, solid–liquid interface variation, and microstructural evolution of Cu-20wt%Fe alloy at three cooling rates (0.3, 1.5, and 5.0 °C/s) were investigated. The results indicate that the remelting of primary γ-Fe dendrites was directly observed through the solidification experiment, and the partial γ-Fe dendrite was fragmented owing to remelting. The Fe phase morphology changed from the cellular structure to the typical finer and longer dendrite structure with the cooling rate increasing. As the cooling rate increased, the constitutional undercooling caused by the decrease in the Fe atom concentration and the increase in the Cu atom concentration increased in the solidifying interface. There was a parabolic relationship between the growth rate of the dendrite tip and time. Meanwhile, the growth of the primary γ-Fe phase was inhibited by the insufficient diffusion of Fe and Cu at the solidification front, which resulted in a decrease in the Fe phase volume fraction, and the Fe content in the Fe dendritic phase decreased slightly.
1. Introduction
Because of its potential as a high-strength and highly electric material, Cu-Fe alloys have attracted the interest of many researchers [1,2,3,4]. It has the properties of both copper and iron, exhibits the advantages of high strength, electrical conductivity, thermal conductivity, and electromagnetic wave shielding, and can be used in many fields. Research on Cu-Fe alloys has mainly been conducted in two directions: low Fe (<2.8 wt.%) and high Fe (>5 wt.%) according to Fe contents. If the Fe content is less than 2.8 wt.%, the solid solution is directly precipitated from the liquid phase when the alloy solidifies. This alloy is a typical precipitation-strengthened alloy, such as C19400. If the Fe content is more than 5.0 wt.%, γ-Fe is first precipitated during solidification, and then the peritectic reaction occurs. The microstructure of the alloy after solidification comprised of the Fe phase and the copper matrix. Through the hot working and cold deformation, the Fe phase can be elongated and become fibrous within the Cu matrix to obtain high-strength microcomposites with good electrical conductivity [5]. The research shows that the tensile strength of the alloy can reach 820–1578 MPa, and its electrical conductivity is between 31–64% ICAS [2,6,7,8,9,10,11]. The tensile strength and conductivity of Cu-10wt.% Fe alloy prepared by Wang et al. [1] were 608 MPa and 57.5% IACS, respectively. By means of arc melting and a large cold rolling deformation, Stepanov et al. [6] refined the average thickness of Fe fiber in Cu-14Fe alloy structure to 30 nm, thus significantly improving the tensile strength of the alloy from 325 MPa to nearly 1 GPa, but the corresponding elongation decreased significantly.
Due to the low price and easy availability of iron raw material, it is considered that increasing the content of Fe in binary Cu-Fe alloy is an economic and practical method to improve its comprehensive properties. However, it is well known that Cu-Fe alloy is a typical metastable immiscible alloy system, which is characterized by a metastable immiscible gap under the liquidus, and there is a huge trend of easy phase separation or serious segregation during solidification. This results in difficulty to produce qualified large-size ingots by the traditional casting method, especially the Cu-Fe ingots with high Fe content (>10wt.%). The segregation of Fe (inhomogeneous Fe phase) causes the product performance not to be improved. The realization of high-strength electrical conductivity of Cu-Fe microcomposites is closely related to the following two aspects: the first is to increase the Fe precipitation to ensure electrical conductivity. The second method is to control the Fe phase in solidification structure. According to the strengthening principle of microcomposites, the morphology, size, uniformity and volume fraction of the Fe phase have an important influence on material properties [11,12,13,14,15], so controlling the solidification process of alloy is needed to improve the solidification structure. Therefore, in order to realize the large-scale preparation of Cu-Fe ingots with high Fe content (>10wt.%), it is necessary to investigate the precipitation and growth process of the Fe phase in the solidification process of Cu-Fe alloy with high Fe content.
Currently, research on the solidification process of Cu-Fe alloys is mostly focused on the liquid-phase separation mechanism during solidification [16,17,18,19]. However, little research has been conducted on the microstructural evolution of Cu-Fe alloys during solidification, especially for Cu-Fe alloys with high Fe content. Fully understanding the precipitation and growth evolution process will help to improve the Fe phase in the solidification structure during the solidification of Cu-Fe alloys, improving the alloy properties. The purpose of this study is to study the evolutionary behavior of Fe phase during the solidification of Cu-20Fe alloy, and obtain more solidification information to provide help for improving the solidification structure of the alloy. The high temperature confocal laser scanning microscope (CLSM) is a new technology in recent years, which can realize in situ observation of the solidification process of liquid metal. Therefore, in situ observation techniques such as high temperature confocal laser scanning microscopy (CLSM) were used to study the effect of the cooling rate on solidification. In addition, some auxiliary experiments including differential scanning calorimetry (DSC), optical microscopy (OM), and energy dispersive spectrometry (EDS) were also carried out to comprehensively evaluate the evolution of the microstructure and morphology during the solidification process.
2. Materials and Methods
2.1. Experimental Materials
The Cu-20wt.% Fe alloy was prepared by melting in a vacuum arc melting furnace; the raw materials were oxygen-free copper (>99.99wt%) and pure iron (>99.86wt%). Pure Fe and oxygen-free copper were placed in the smelting furnace according to the mass ratio. After the alloy was completely melted (>1300 °C) and stirred for 2 min using an electric arc, it rapidly solidified on a water-cooled copper chassis in the smelting furnace.
2.2. DSC Measurements
DSC experiments were performed using a NETZSCH DSC 404F3 analyzer. The specimens with 5.22 mg were cut from the Cu-Fe alloy sample which were obtained from the upper melting experiment. The sample was analyzed in a corundum crucible. For DSC measurements, the samples were heated from 25 to 1450 °C at a constant rate of 20 °C/min and then cooled to 25 °C with a cooling rate of 20 °C/min. The sampling rate during the experiment was 200 times/min. The measuring range of the equipment is 5000 Μv. The test temperature was 22 °C and the humidity was 59%. Purified argon gas (≥99.999%) was used as a protective atmosphere in the chamber to prevent the samples from interacting with the atmosphere during DSC measurements.
2.3. In Situ Observation
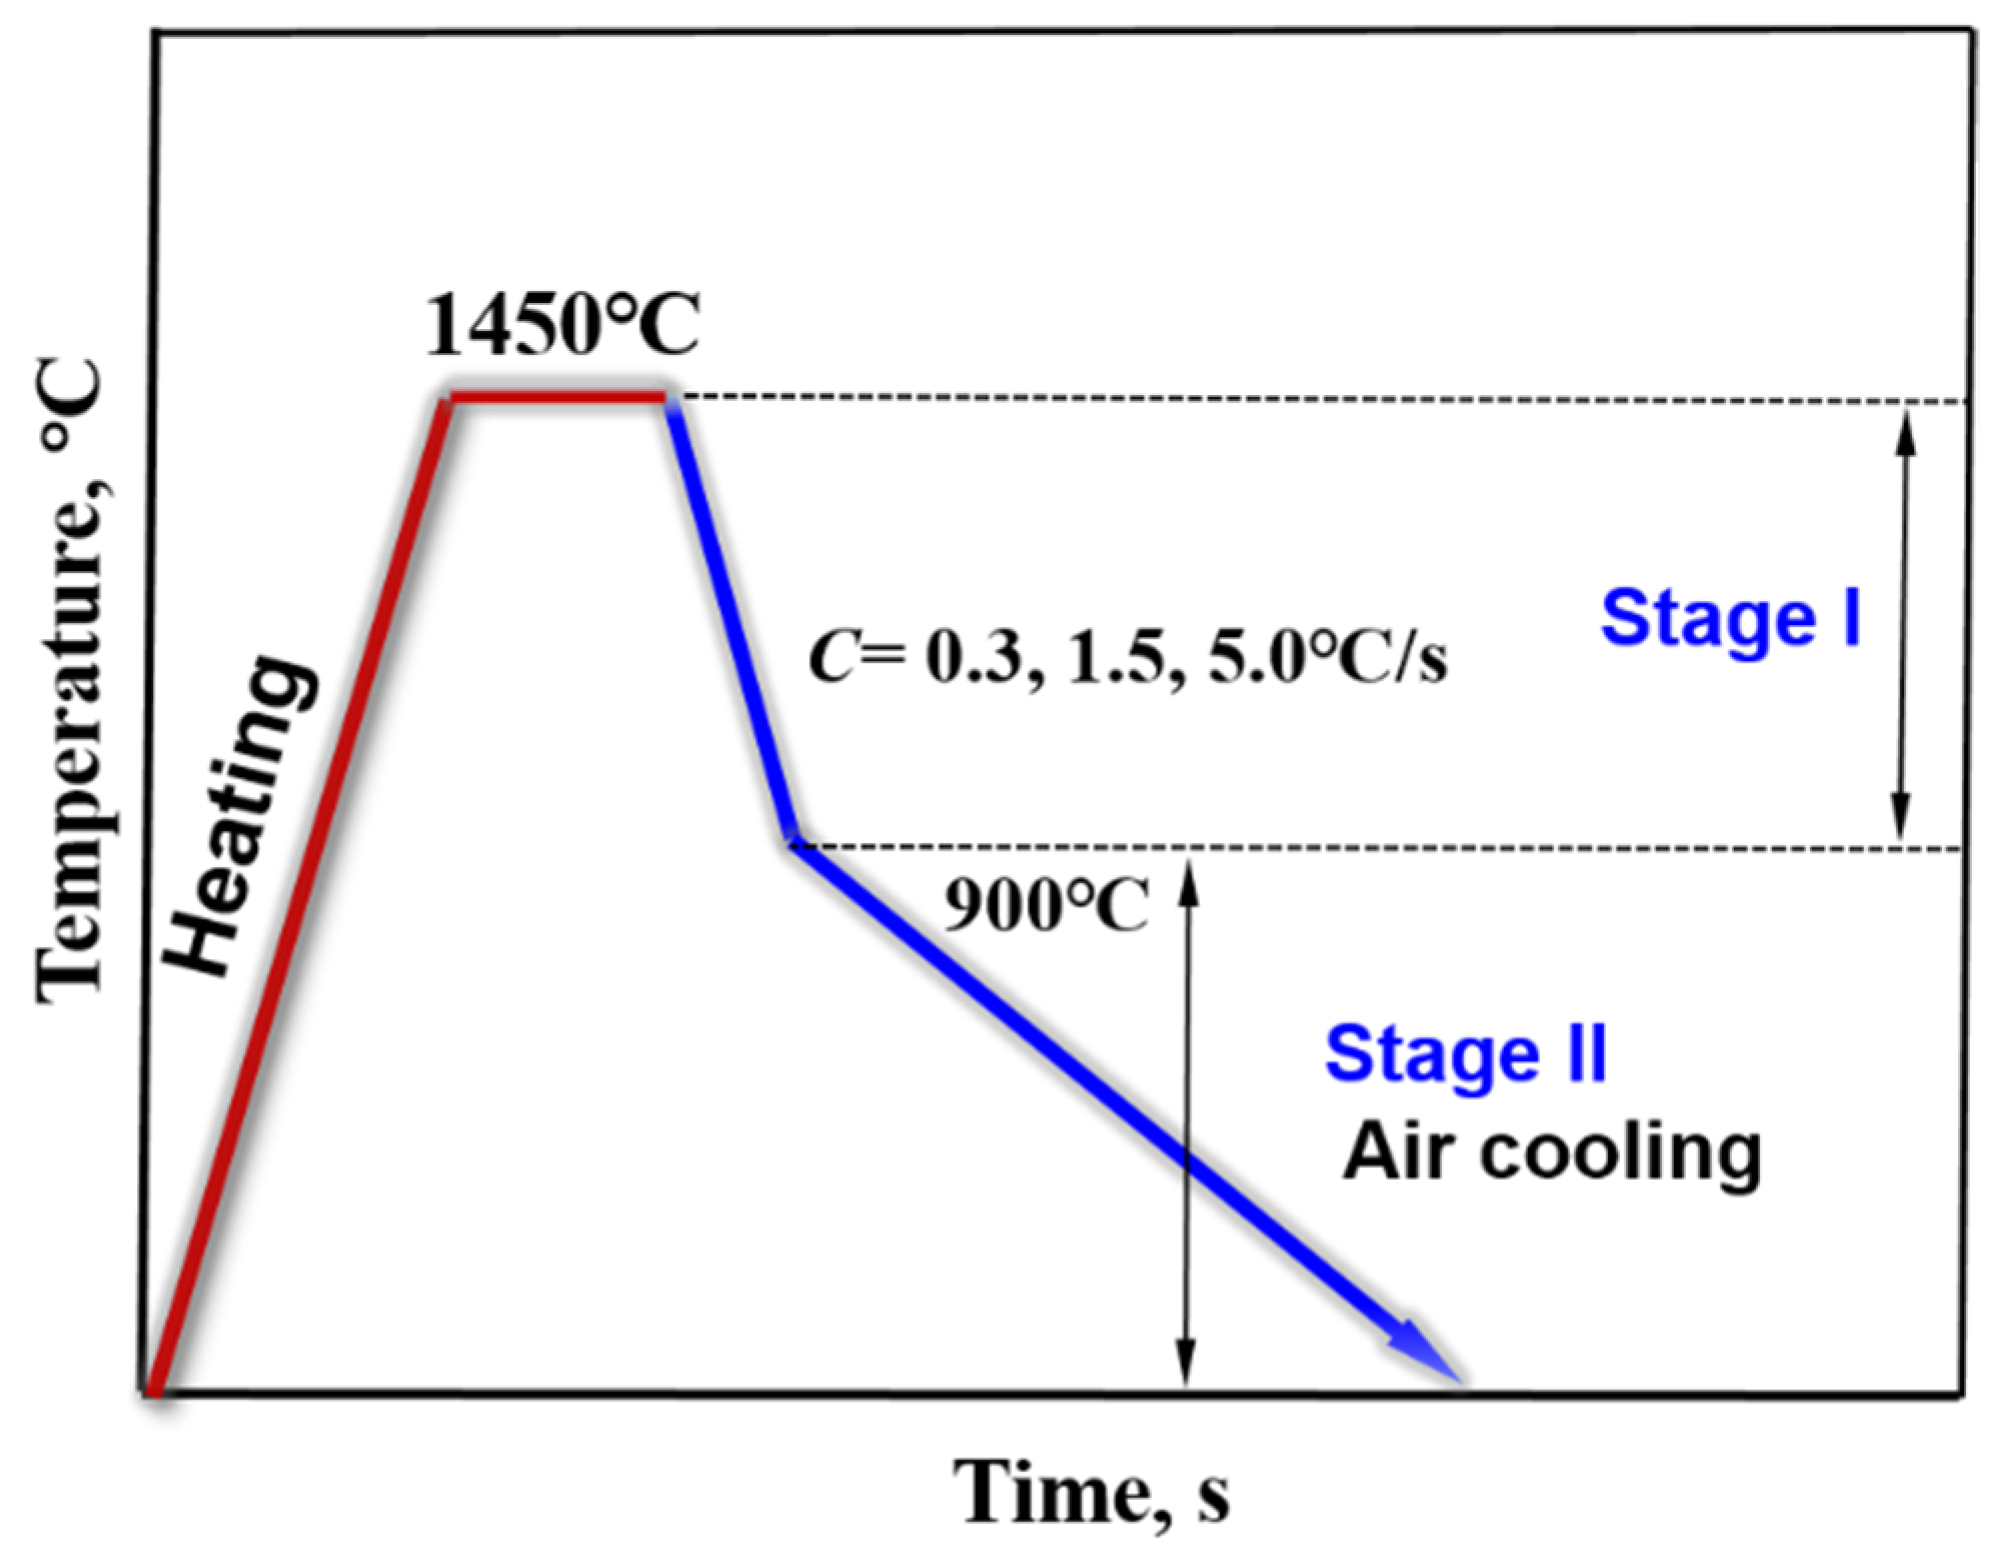
In the study, a confocal laser scanning microscope (CLSM, VL2000DX-SVF17SP, LASERTEC Inc., Kanagawa, Japan) was used to simulate the solidification process of Cu-20Fe alloys under different cooling rates. Detailed parameters of the equipment can be found in the literature [20]. CSLM can offer advantageous real-time and continuous observations of the solidification process at high temperatures. Specimens with 7.0 mm diameter and 3.0 mm height were taken from the above melting sample. Before the CLSM experiment, 600 mesh, 100 mesh and 1500 mesh abrasive paper were used to polish the sample firstly (including the cylindrical surface of the sample), then the sample was put in the alcohol solution, clearing it in the ultrasonic cleaner for 5 min, and last the sample was taken out and blown dry. The sample after clearing was placed into high-purity alumina crucibles. After the sample was put into the instrument, the experimental chamber was vacuumed by the vacuum equipment. When the vacuum degree was less than 20 Pa, high-purity argon (≥99.99 pct) was injected into the vacuum chamber. After that, the vacuumizing and inflating operations were repeated twice to eliminate the oxygen in the experimental chamber as much as possible. The temperature regime of the sample in the CLSM experiment is shown in Figure 1. Three solidification processes were performed in the experiment. The specimen was heated from the room temperature to 1450 °C and held for 2 min to be melted evenly. The liquid samples were subsequently cooled to 25 °C at different rates. The cooling rates were 0.3, 1.5, and 5.0 °C/s, respectively. The real-time videos and pictures were recorded during the solidification process.
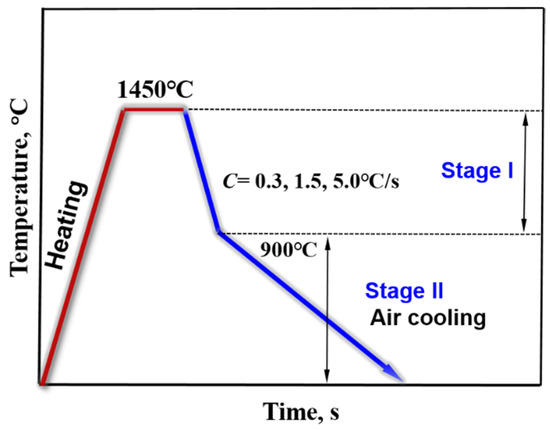
Figure 1.
The temperature regime in the CLSM experiment.
2.4. Microstructure Studies
The samples after being solidified in the CLSM experiment were used to analyze the microstructure. A solution of 10 g FeCl3 + 30 mL of HCl + 120 mL H2O was used to etch the sample. The microstructural features were analyzed using an Olympus optical microscope (OM). The dendrite arm spacing and the volume fraction of the Fe phase were measured and calculated based on the micrographs. The measurement method of dendrite spacing is the intercept method, which counts more than 15 grains under two fields of view (the diameter of CLSM test sample is 7 mm, after melting test the samples became spherical through solidified, the size and diameter become smaller, and the number of complete fields of view was limited by the size). The chemical compositions of the dendrite arm were measured using an energy dispersive spectrometer (EDS) detector, which was attached to the SEM.
3. Result and Discussion
3.1. Expected Solidification Process
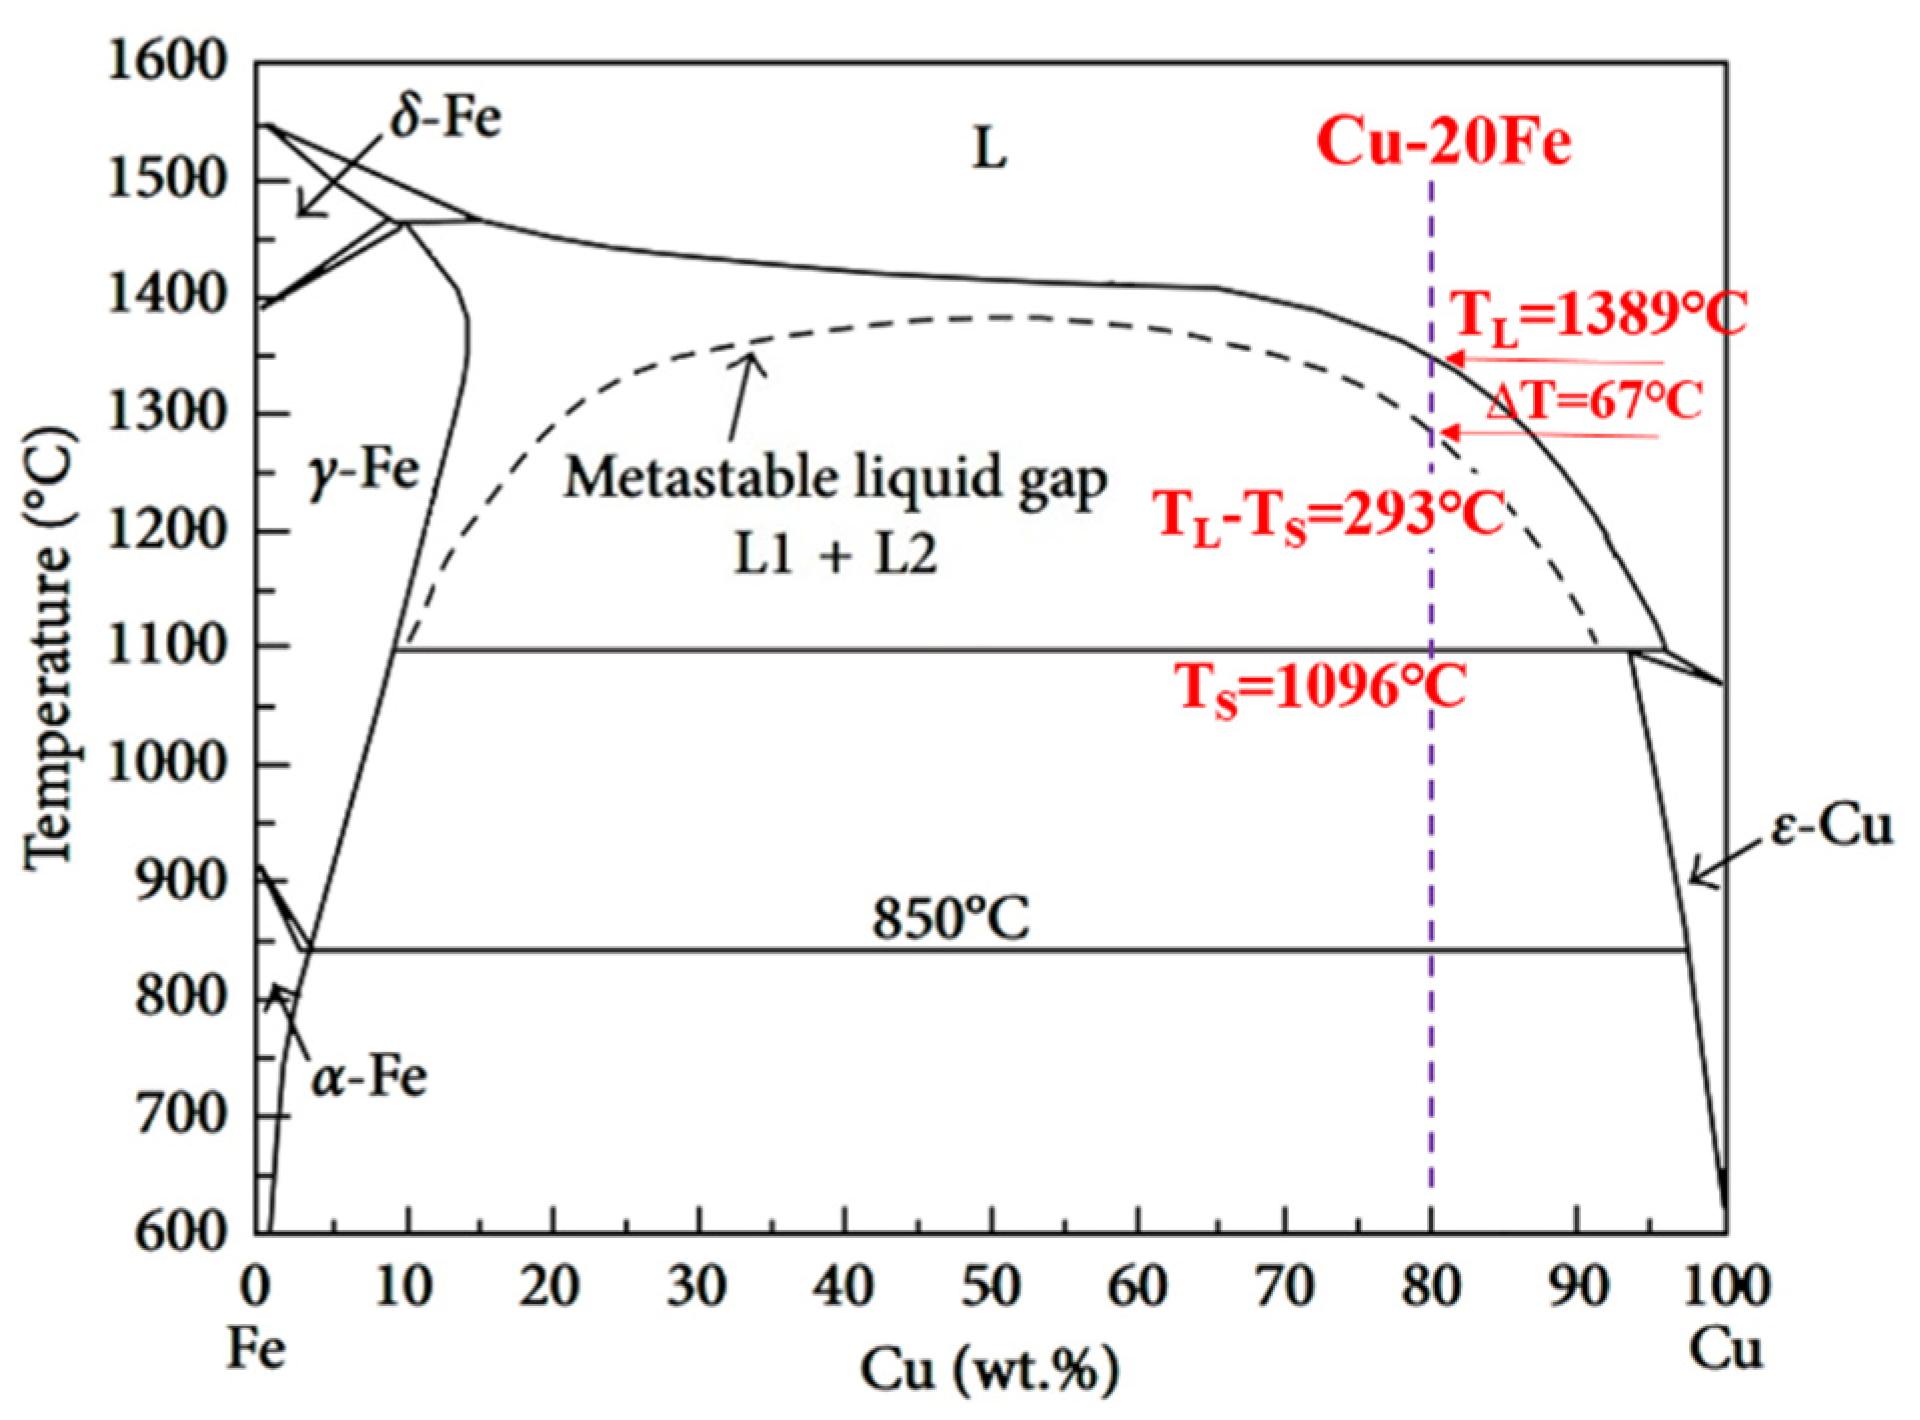
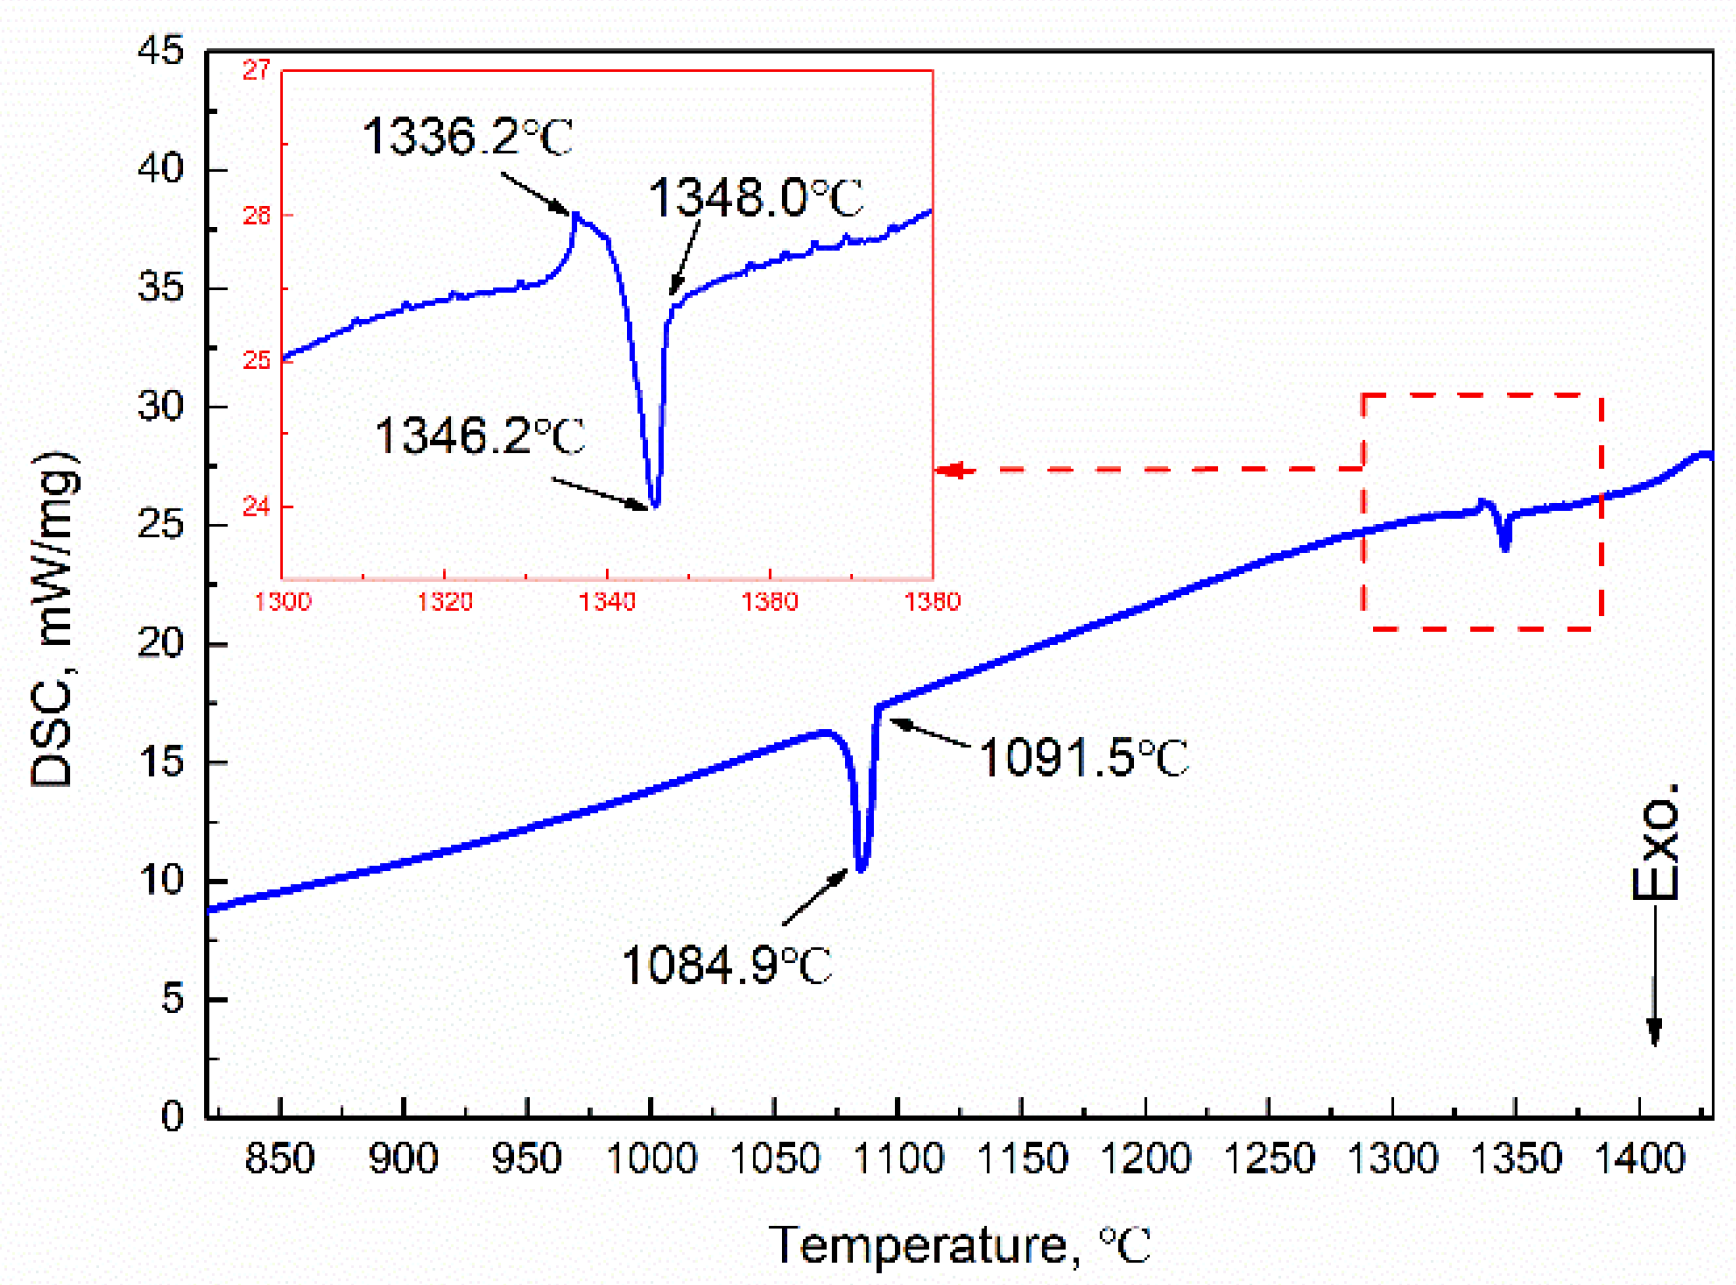
The phase diagram of the Cu-Fe system is shown in Figure 2, where the metastable miscibility gap is included. If solidification occurs below the miscibility gap boundary when the undercooling is large enough, a liquid alloy separates into two liquids, L1(Fe) and L2(Cu). If solidification occurs above the miscibility gap boundary, the primary γ-Fe forms first by liquid–solid transformation. Subsequently, the further cooling led to a peritectic reaction at 1096 °C: γ-Fe + L→ ε-Cu. The DSC curves of the experimental Cu-20Fe alloys at the cooling rate of 20 °C/min was illustrated in Figure 3. As shown in Figure 3, the temperature when the cooling curve deviates from the 1348 °C baseline is the liquidus temperature, which indicates liquid–solid transformation begins. As the temperature decreases, two large exothermic peaks and one small absorption peak appears. The first peak (1346.2 °C) was the thermal response of the latent heat release of crystallization, which can be regarded as the formation of primary γ-Fe dendrites in the liquid phase. The second small absorption peak appeared at 1336.2 °C, which represents a remelting of γ-Fe dendrites (recalescence) that can be confirmed during the solidification of CLSM. Upon further cooling, the third peak at 1084.9 °C indicates that the residual liquid phase undergoes peritectic solidification with the primary γ-Fe phase: γ-Fe + L→ ε-Cu. Finally, the residual liquid phase after the peritectic reaction directly precipitated into the ε-Cu phase. In addition, owing to non-equilibrium solidification, the practical solidus temperature displayed at each stage of the cooling process is lower than the equilibrium solidification temperature (Figure 2). Before the peritectic solidification, the residual liquid phase is approximately 80% (fs<0.2) according to the phase diagram, and the mushy zone between liquidus and solidus is close to 293 °C, which means that primary γ-Fe has been in free motion for a long time. In a practical casting process, the motion induced by the density difference between γ-Fe dendrites and the liquid phase leads to an uneven distribution of the Fe phase in the casting structure.
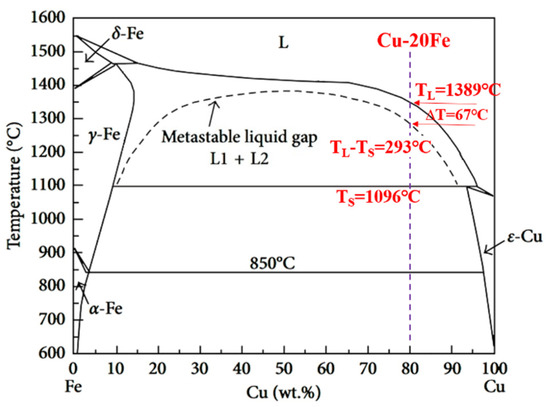
Figure 2.
Phase diagram of Cu-Fe system.
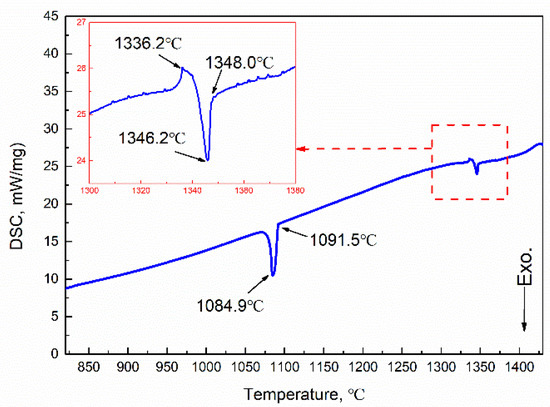
Figure 3.
DSC curve at a cooling rate of 20 °C/min.
3.2. CLSM Observation
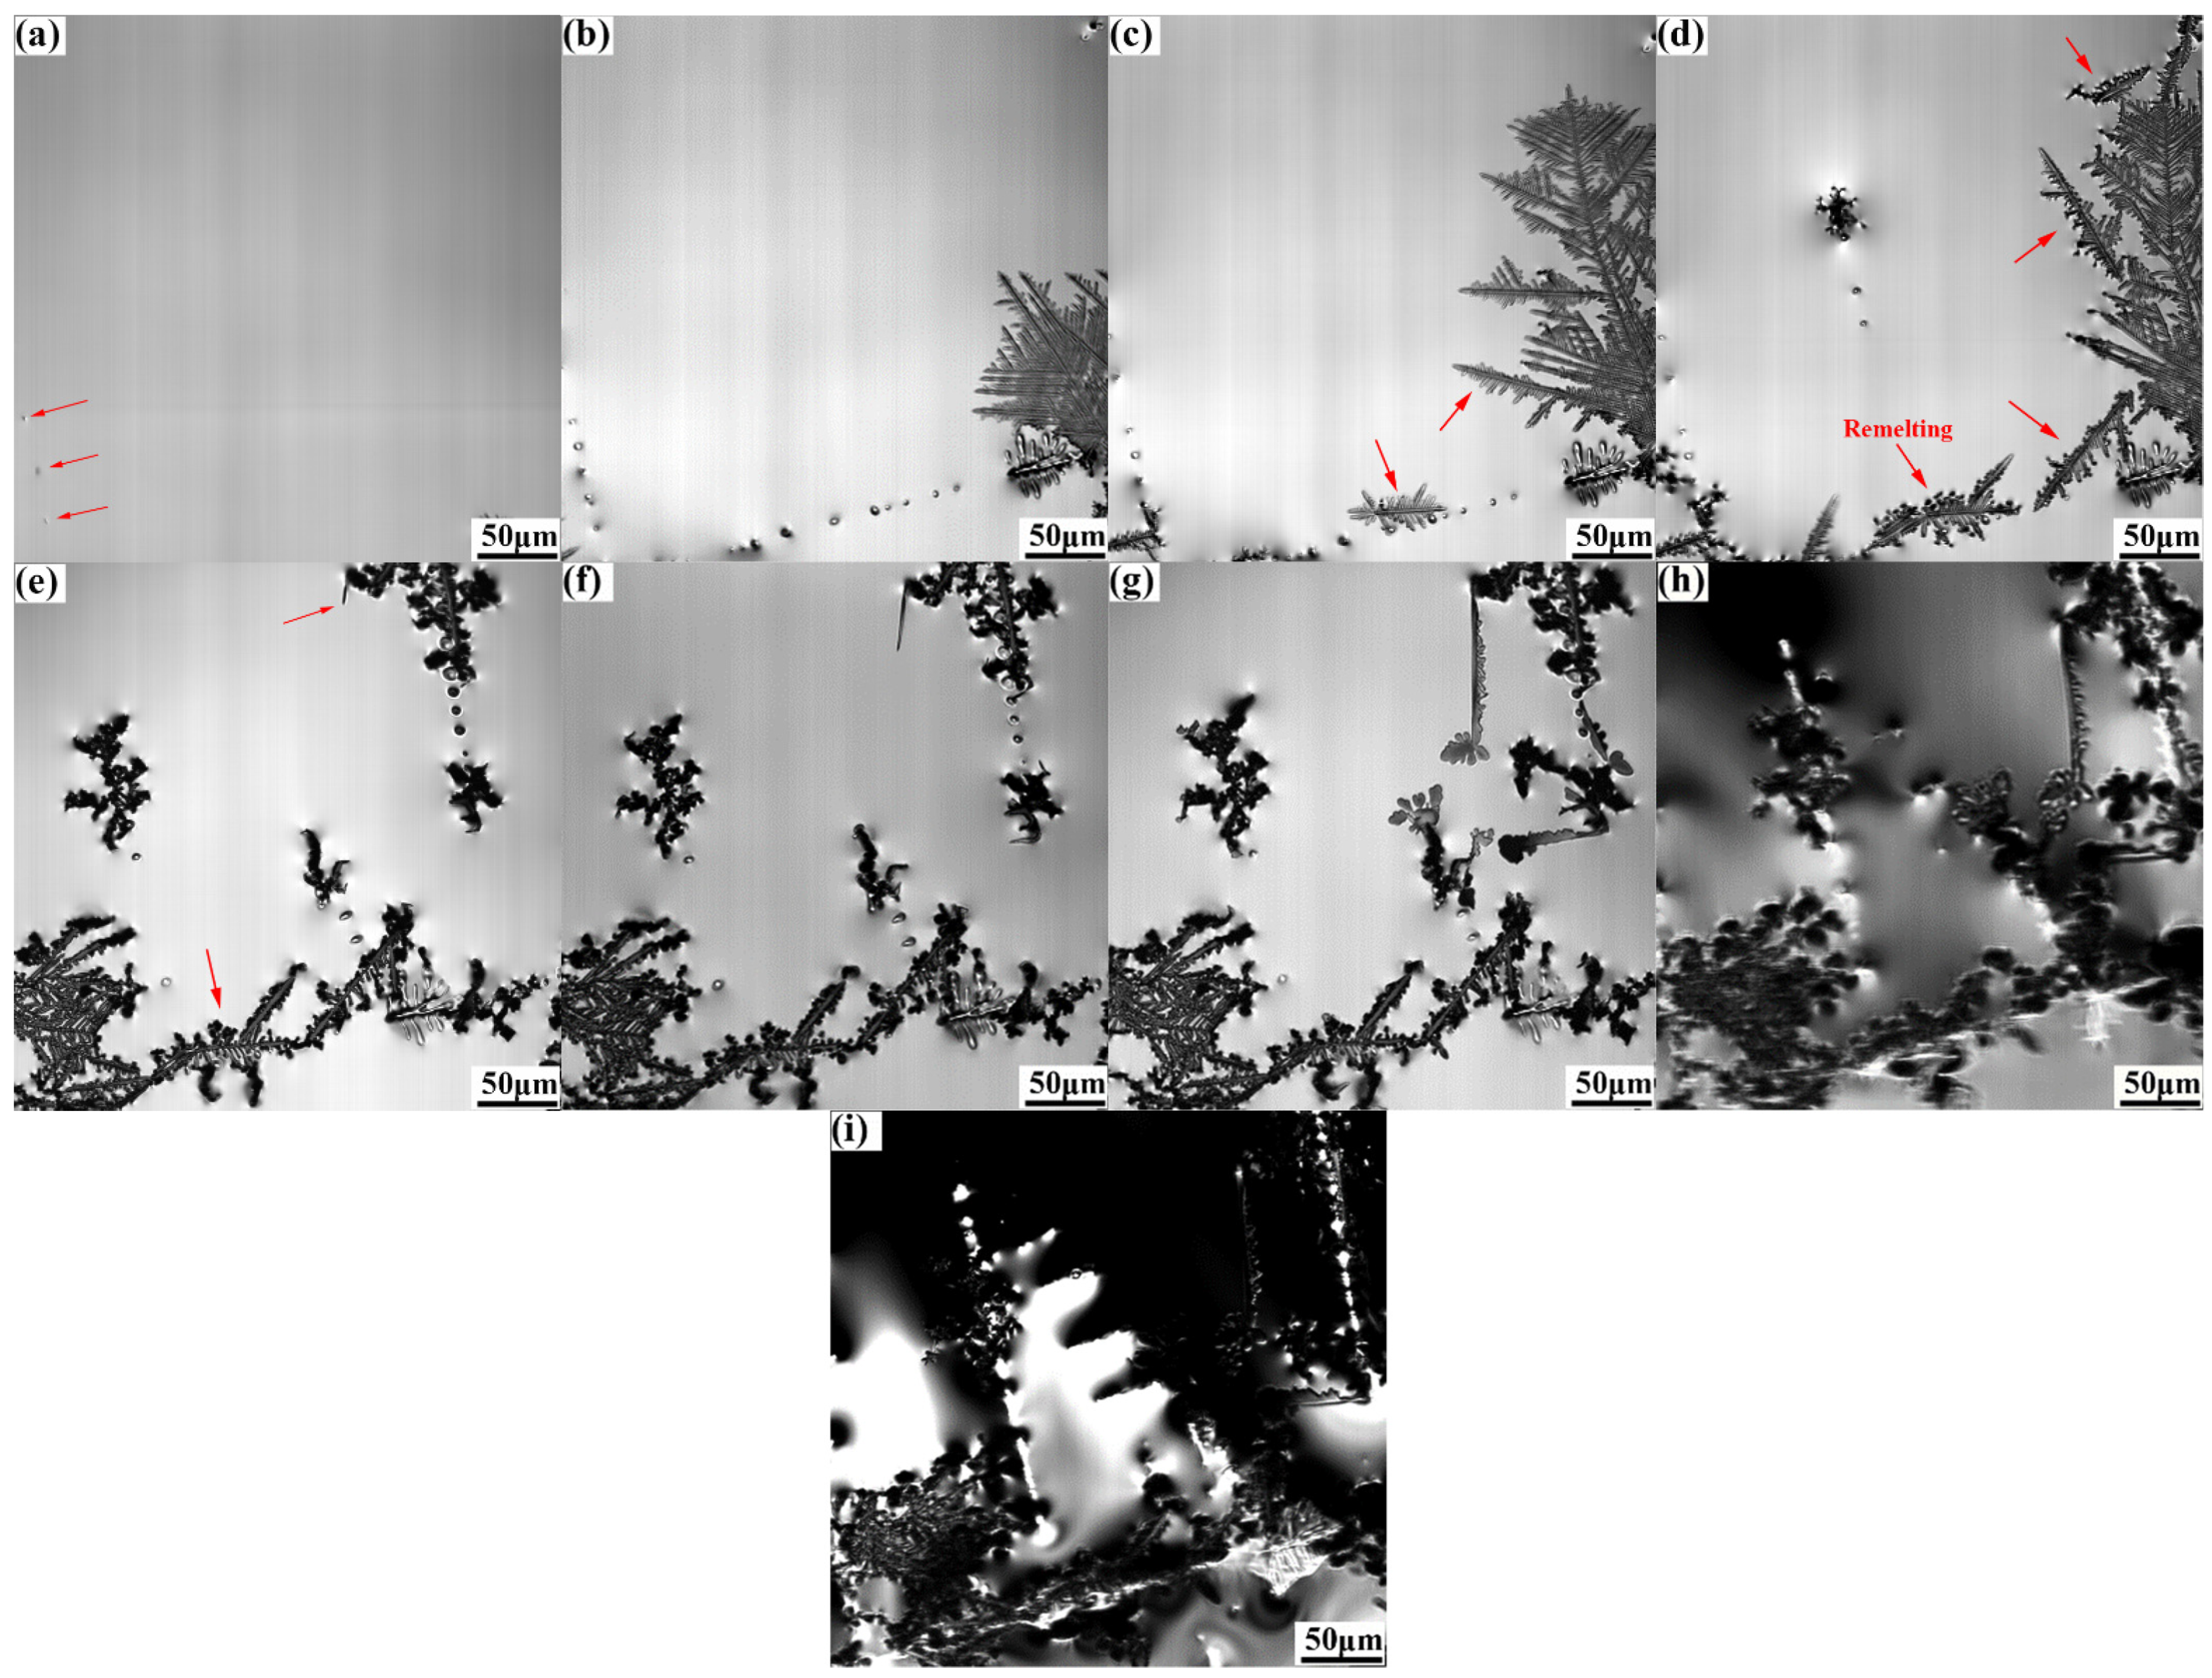
Figure 4 illustrates the nucleation and growth process of γ-Fe observed by CLSM during solidification at a cooling rate of 1.5 °C/s. The γ-Fe solid phase first precipitated and grew on the liquid surface when the temperature decreased to approximately 1325 °C. As the temperature decreased to 1302.1 °C, several leaf-like γ-Fe dendrites appeared and grew rapidly. Here, the solidification front of γ-Fe dendrites started to remelt at a temperature of 1267.0 °C. Simultaneously, a small number of primary and secondary dendrites were fragmented due to remelting (Figure 3). The dendrite fragmentation induced by remelting is an important information of Cu-Fe alloy. If the dendrite is further interrupted by external force at the stage of remelting, this will lead to the refinement of Fe phase in the solidification structure. The solidification process of liquid alloy determines the final microstructure of the alloy. A certain amount of dendrite fragments can increase the heterogeneous nucleation in the solidification process, thus achieving the effect of refining the grain and improving the performance [21]. The dendrite remelting observed in the CLSM experiment now results in the phenomenon of dendrite breakage during the solidification process, which may be related to the phenomenon of recalescence, resulting in the breakage of the weak position of the dendrite. Wang et al. [22] conducted a study on the mechanism of dendrite fracture of camper alloy (SCN-5wt.%) caused by the ultrasonic field. The research shows that the ultrasonic field can cause dendrite fatigue fracture. Therefore, if an external force, including ultrasonic and pulse, were applied to the dendrite remelting stage at this time, it may increase the amount of dendrite fragments to refine the Fe phase in the solidification structure.
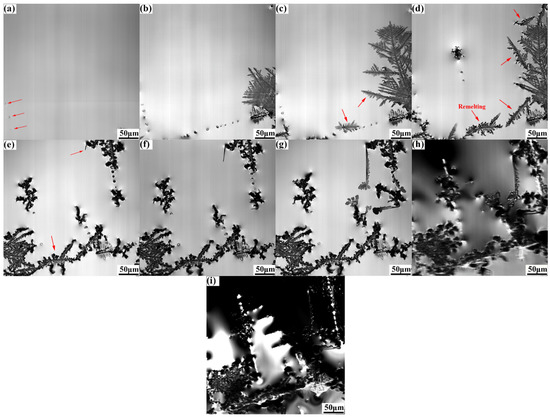
Figure 4.
In situ observation of the microstructure evolution at the cooling rate of 1.5 °C/s: (a) 1302.1 °C, (b) 1270.5 °C, (c) 1267.0 °C, (d) 1264.5 °C, (e) 1177.2 °C, (f) 1166.1 °C, (g) 1105.7 °C, (h) 1046.6 °C, and (i) 1042.7 °C.
Upon further cooling to 1177.2 °C, a small number of needle dendrites were generated at the solid–liquid interface and grew rapidly (Figure 4e–g). With a further decrease in temperature, the area of the liquid phase decreased continuously, and a small number of independent liquid-phase areas were formed. Theoretically, the solidification would undergo a peritectic reaction (γ-Fe+L→ ε-Cu) at approximately 1096 °C, and then the remaining liquid phase would be precipitated and solidified. However, morphological changes could not be observed clearly because the undulating dendrite morphology affected the depth of the field.
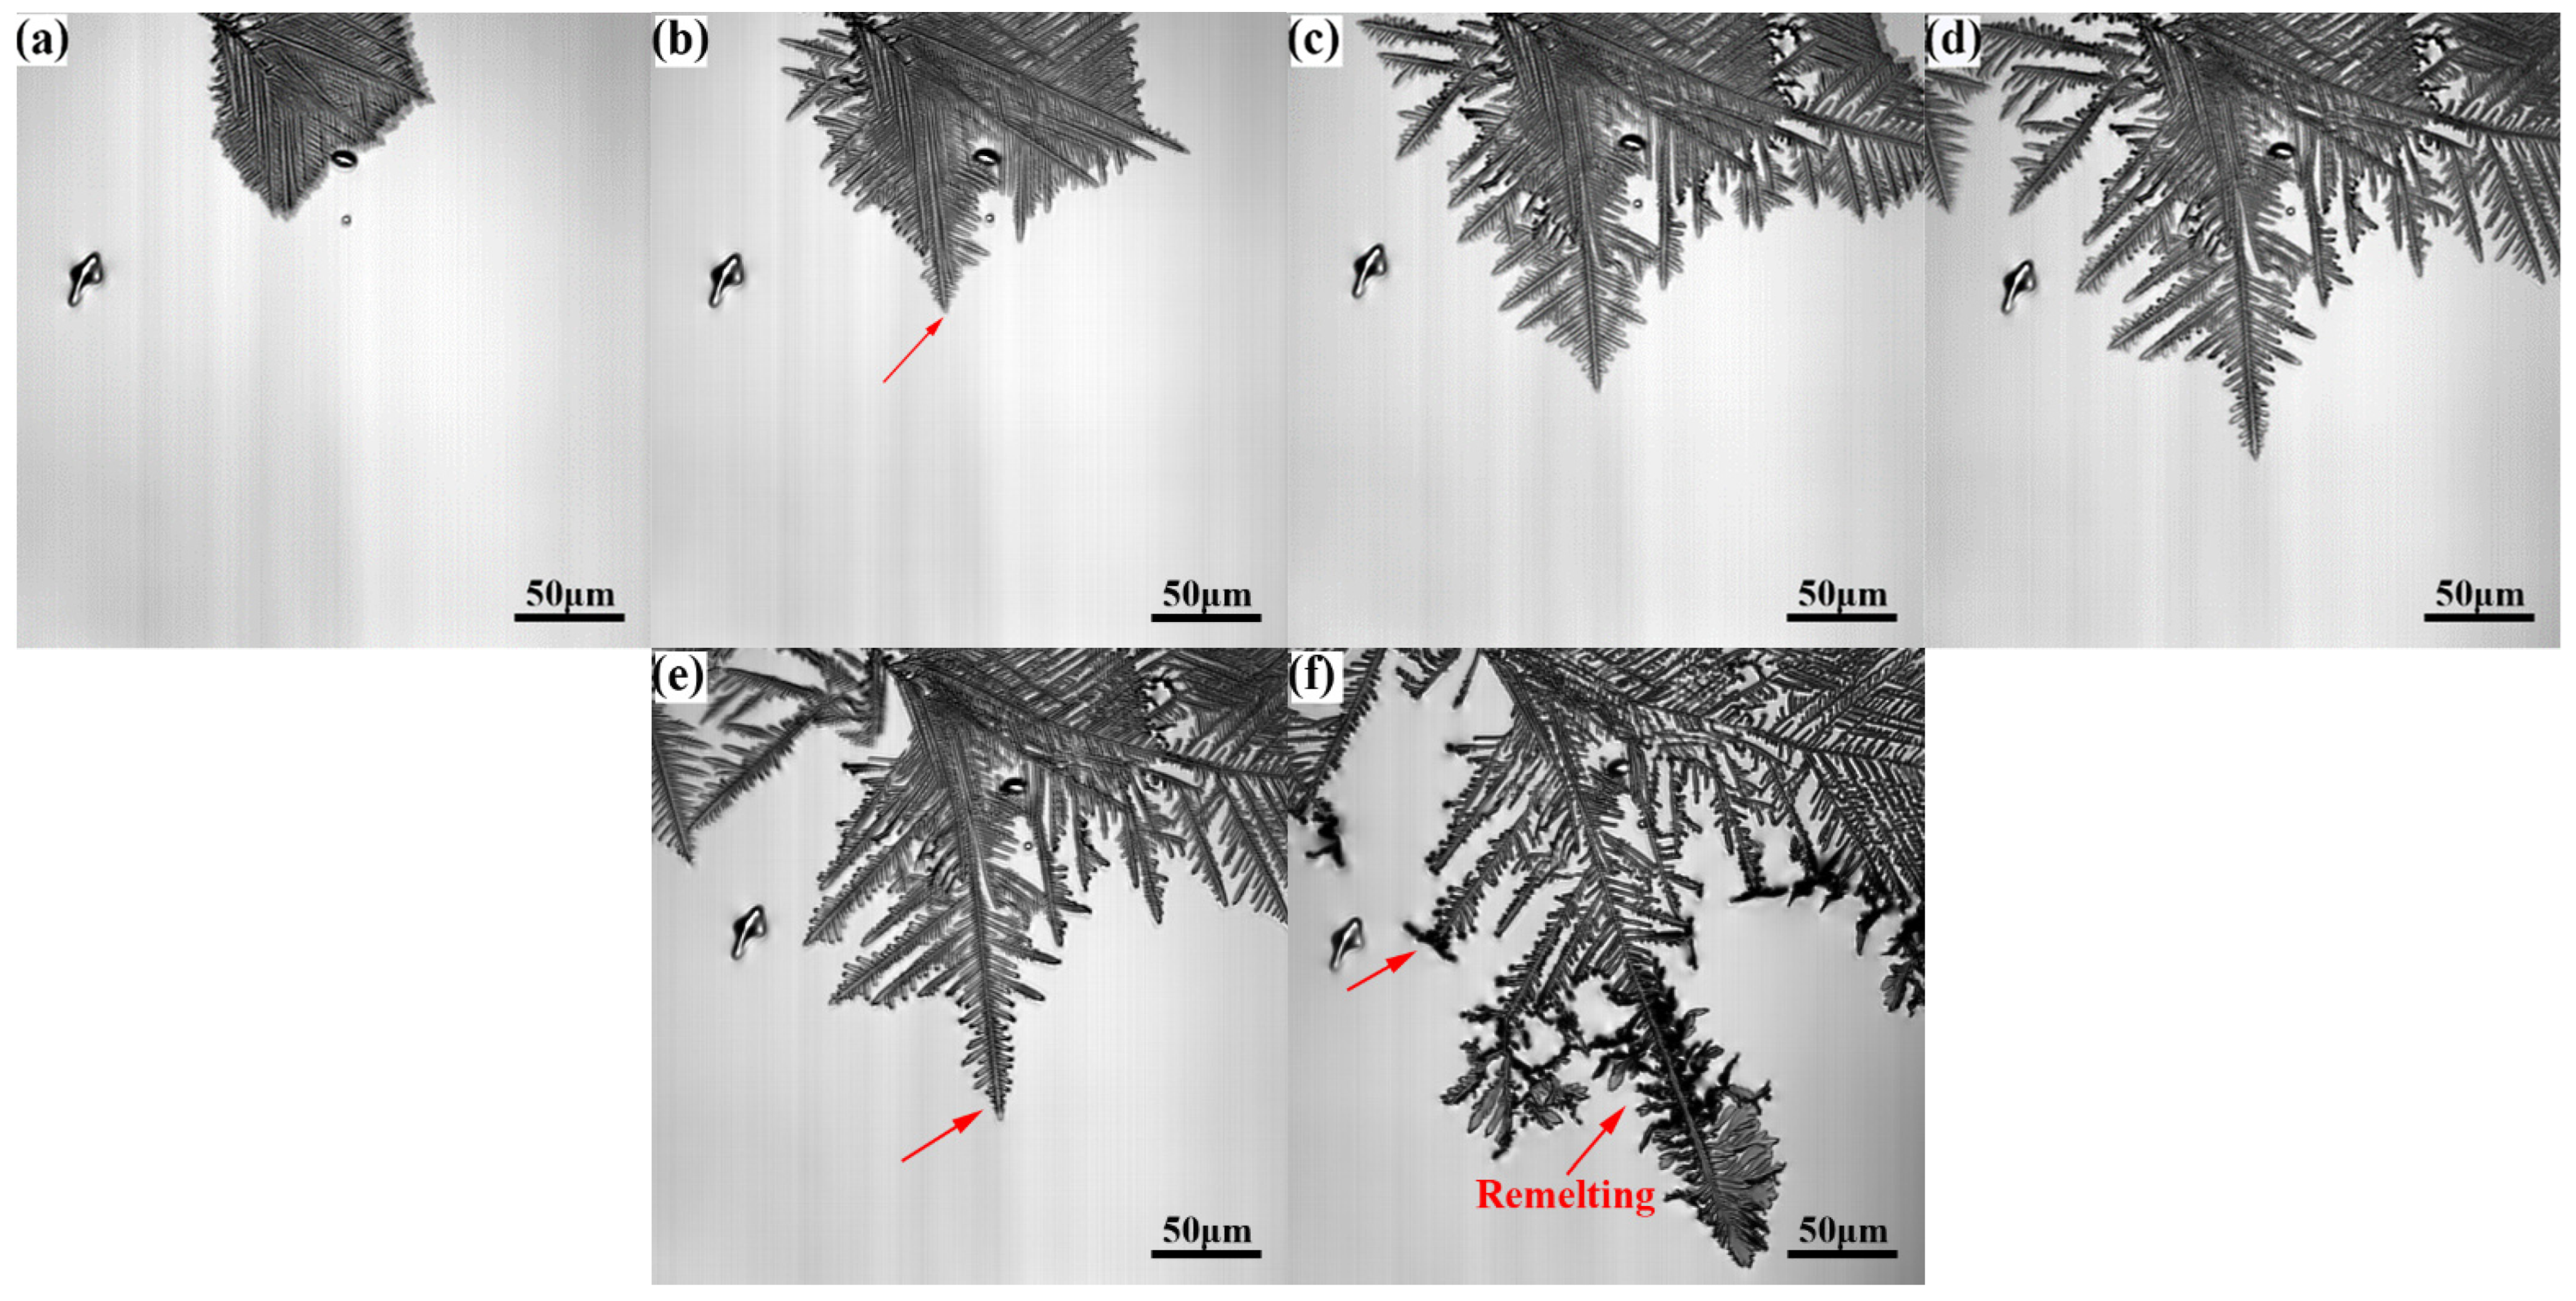
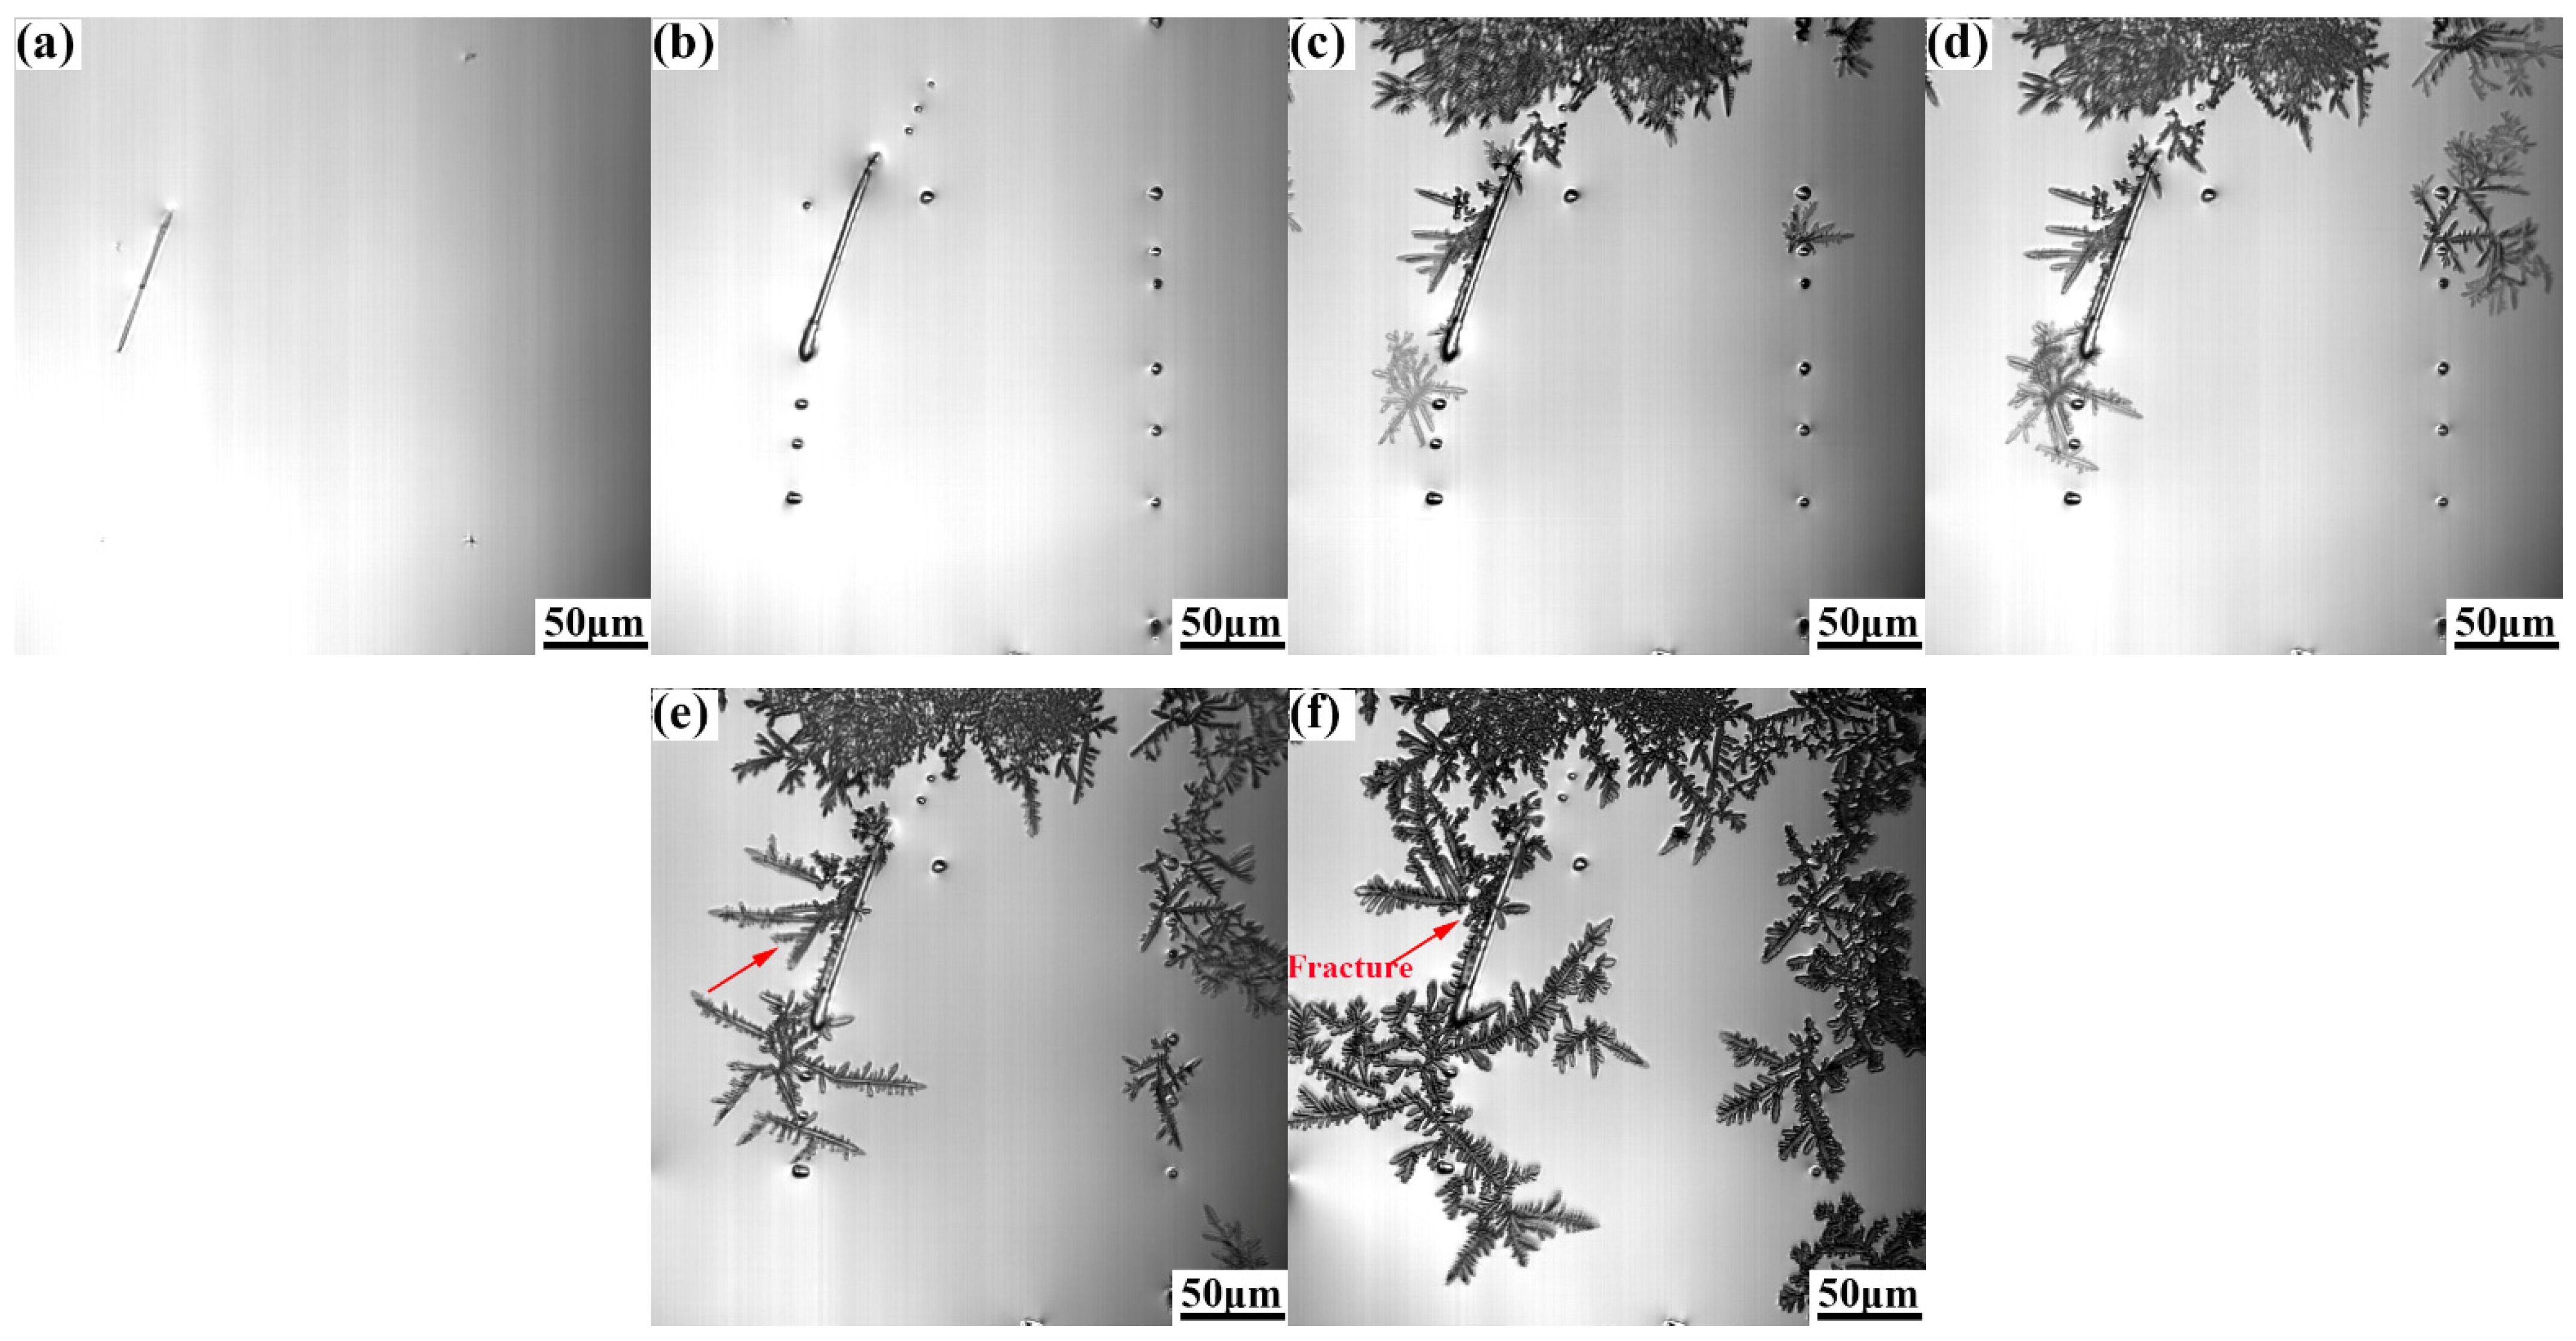
Figure 5 and Figure 6 show the growth process of γ-Fe dendrites of Cu-20Fe alloy when the cooling rate is 0.3 °C/s and 5.0 °C/s, respectively. In this study, the sequence of the liquid solidification at different cooling rates is similar to that observed at the cooling rate of 1.5 °C/s, except γ-Fe dendrite crystallization temperature, growth rate, and dendrite remelting temperature. The crystallization temperature of the DSC test was measured to be approximately 1348.0 °C. The crystallization temperatures at 0.3, 1.5 and 5.0 °C/s in the CLSM experiment are about 1356.0 °C, 1304.0 °C and 1300.4 °C, respectively. The remelting of γ-Fe dendrites occurred near 1282.8 °C at the cooling rate of 0.3 °C/s, which was lower than the remelting exothermic peak observed in the DSC experiment (the cooling rate was 0.33 °C/s) at 1336.3 °C, and the remelting temperature and dendrite morphology density were higher than 1.5 °C/s. The remelting of γ-Fe dendrites occurred near 1216.1 °C at the cooling rate of 5.0 °C/s. It is well known that the liquid undercooling has an important impact on the microstructure during solidification. The larger the cooling rate, the lower the actual crystallization temperature, and the greater the undercooling. In the experiment, it can be seen that the crystallization temperature and remelting temperature of γ-Fe decrease continuously with the increase of cooling rate during the solidification process, but the solidification process shown by CLSM is consistent with that shown by the DSC curve in Figure 3.
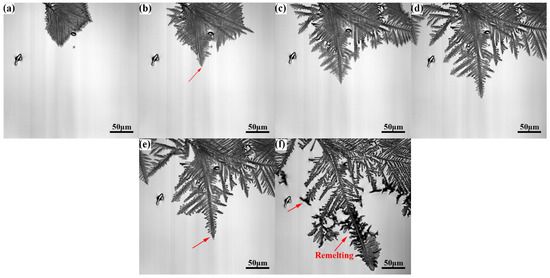
Figure 5.
γ-Fe dendrite microstructure evolution during solidification at the cooling rate of 0.3°C/s: (a), 1286.5 °C, (b) 1286.2 °C, (c) 1285.9 °C, (d) 1285.6 °C, (e) 1285.3 °C, and (f) 1282.8 °C.
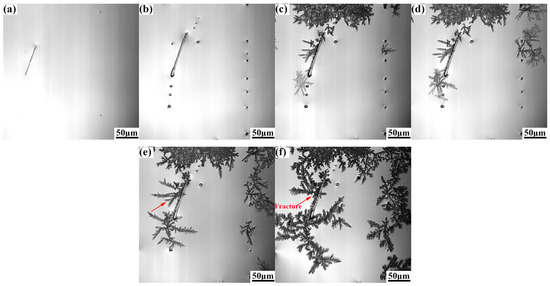
Figure 6.
γ-Fe dendrite microstructure evolution during solidification at the cooling rate of 5.0 °C/s: (a) 1285.4 °C, (b) 1188.1 °C, (c) 1172.7 °C, (d)1169.2 °C, (e) 1165.7 °C, and (f) 1153.9 °C.
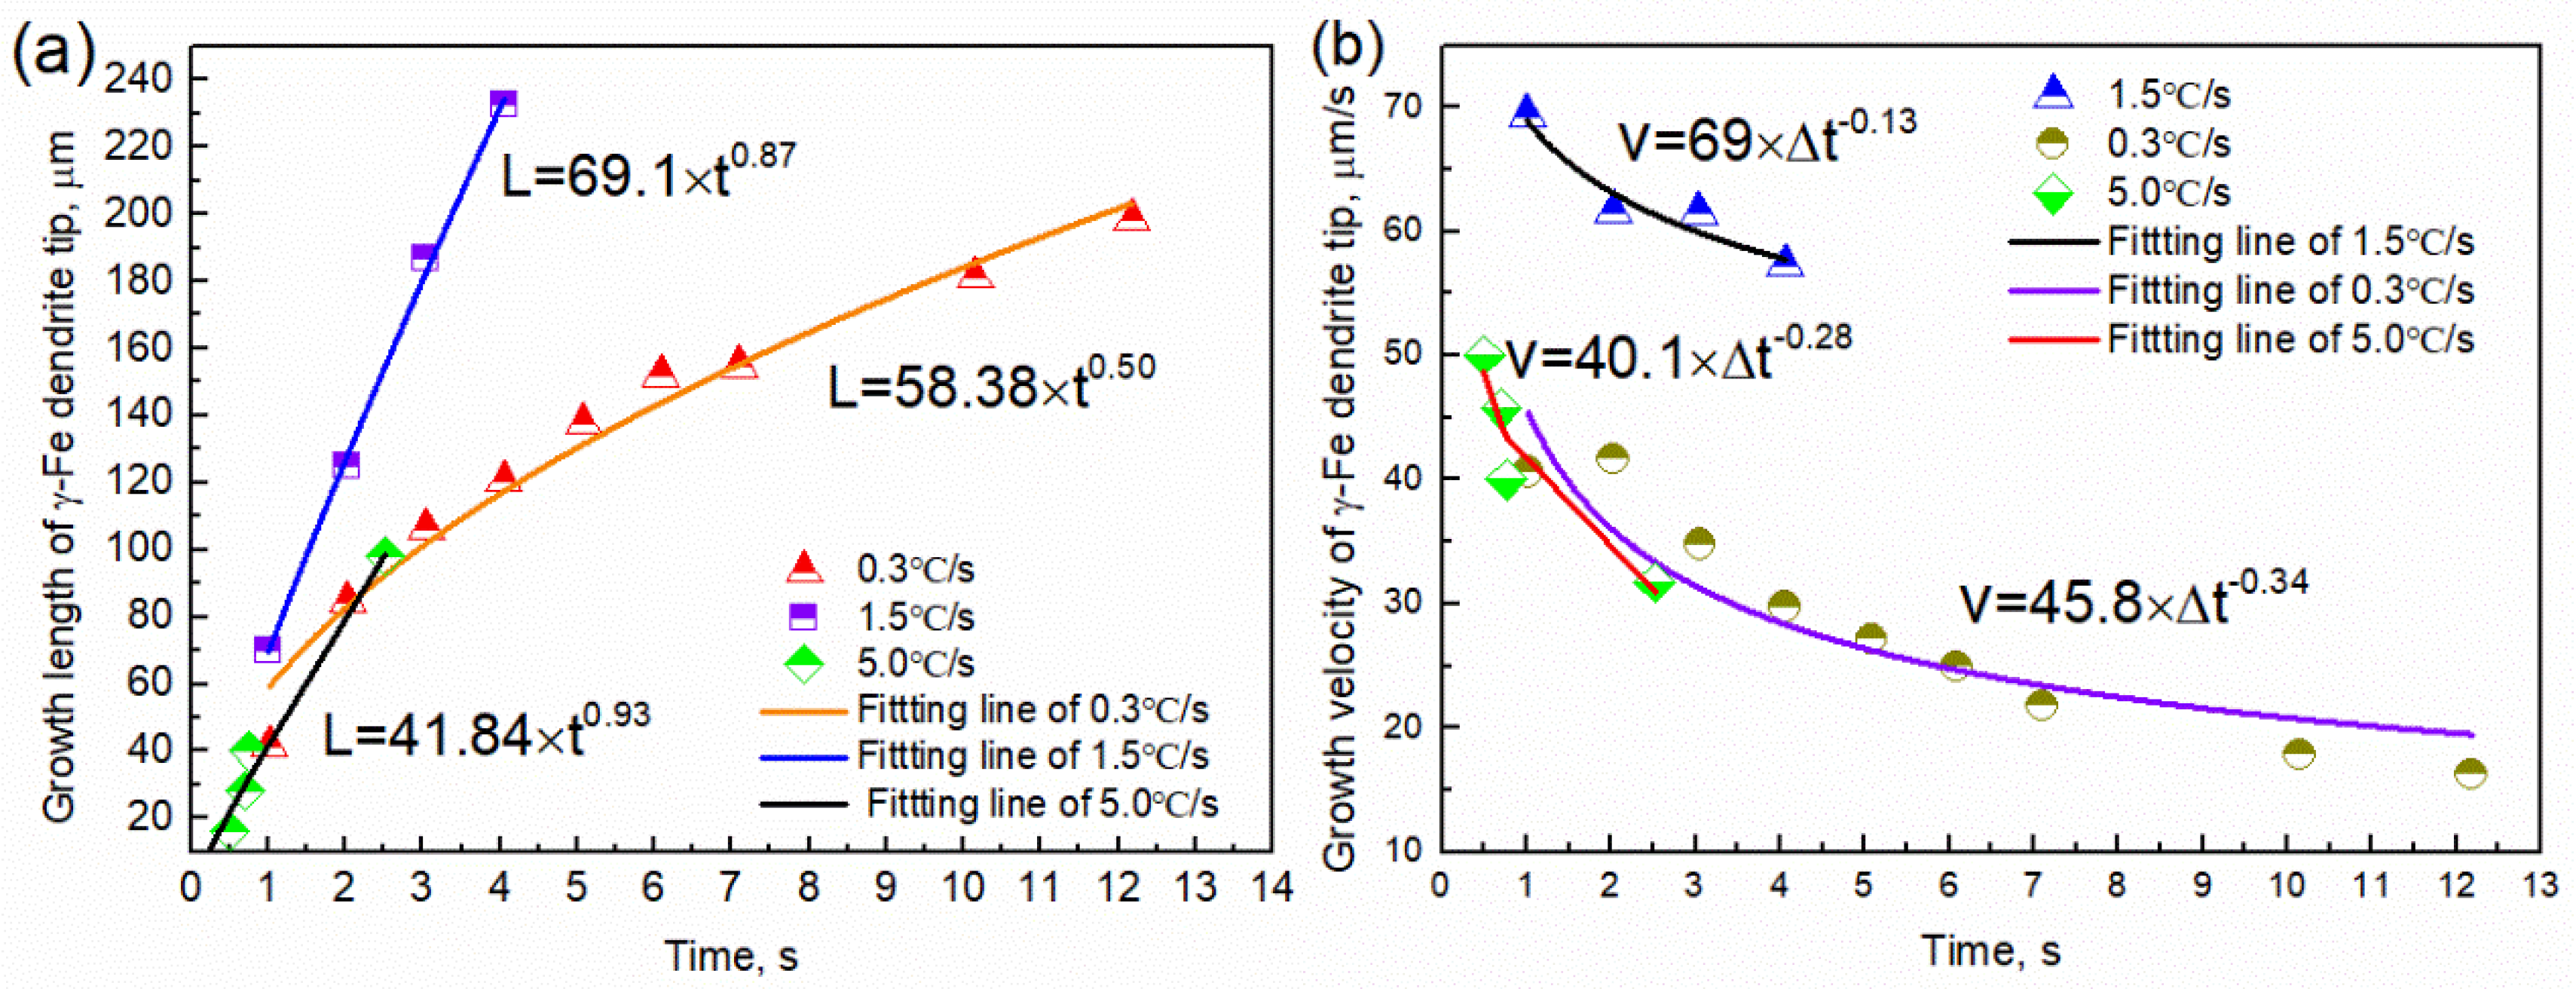
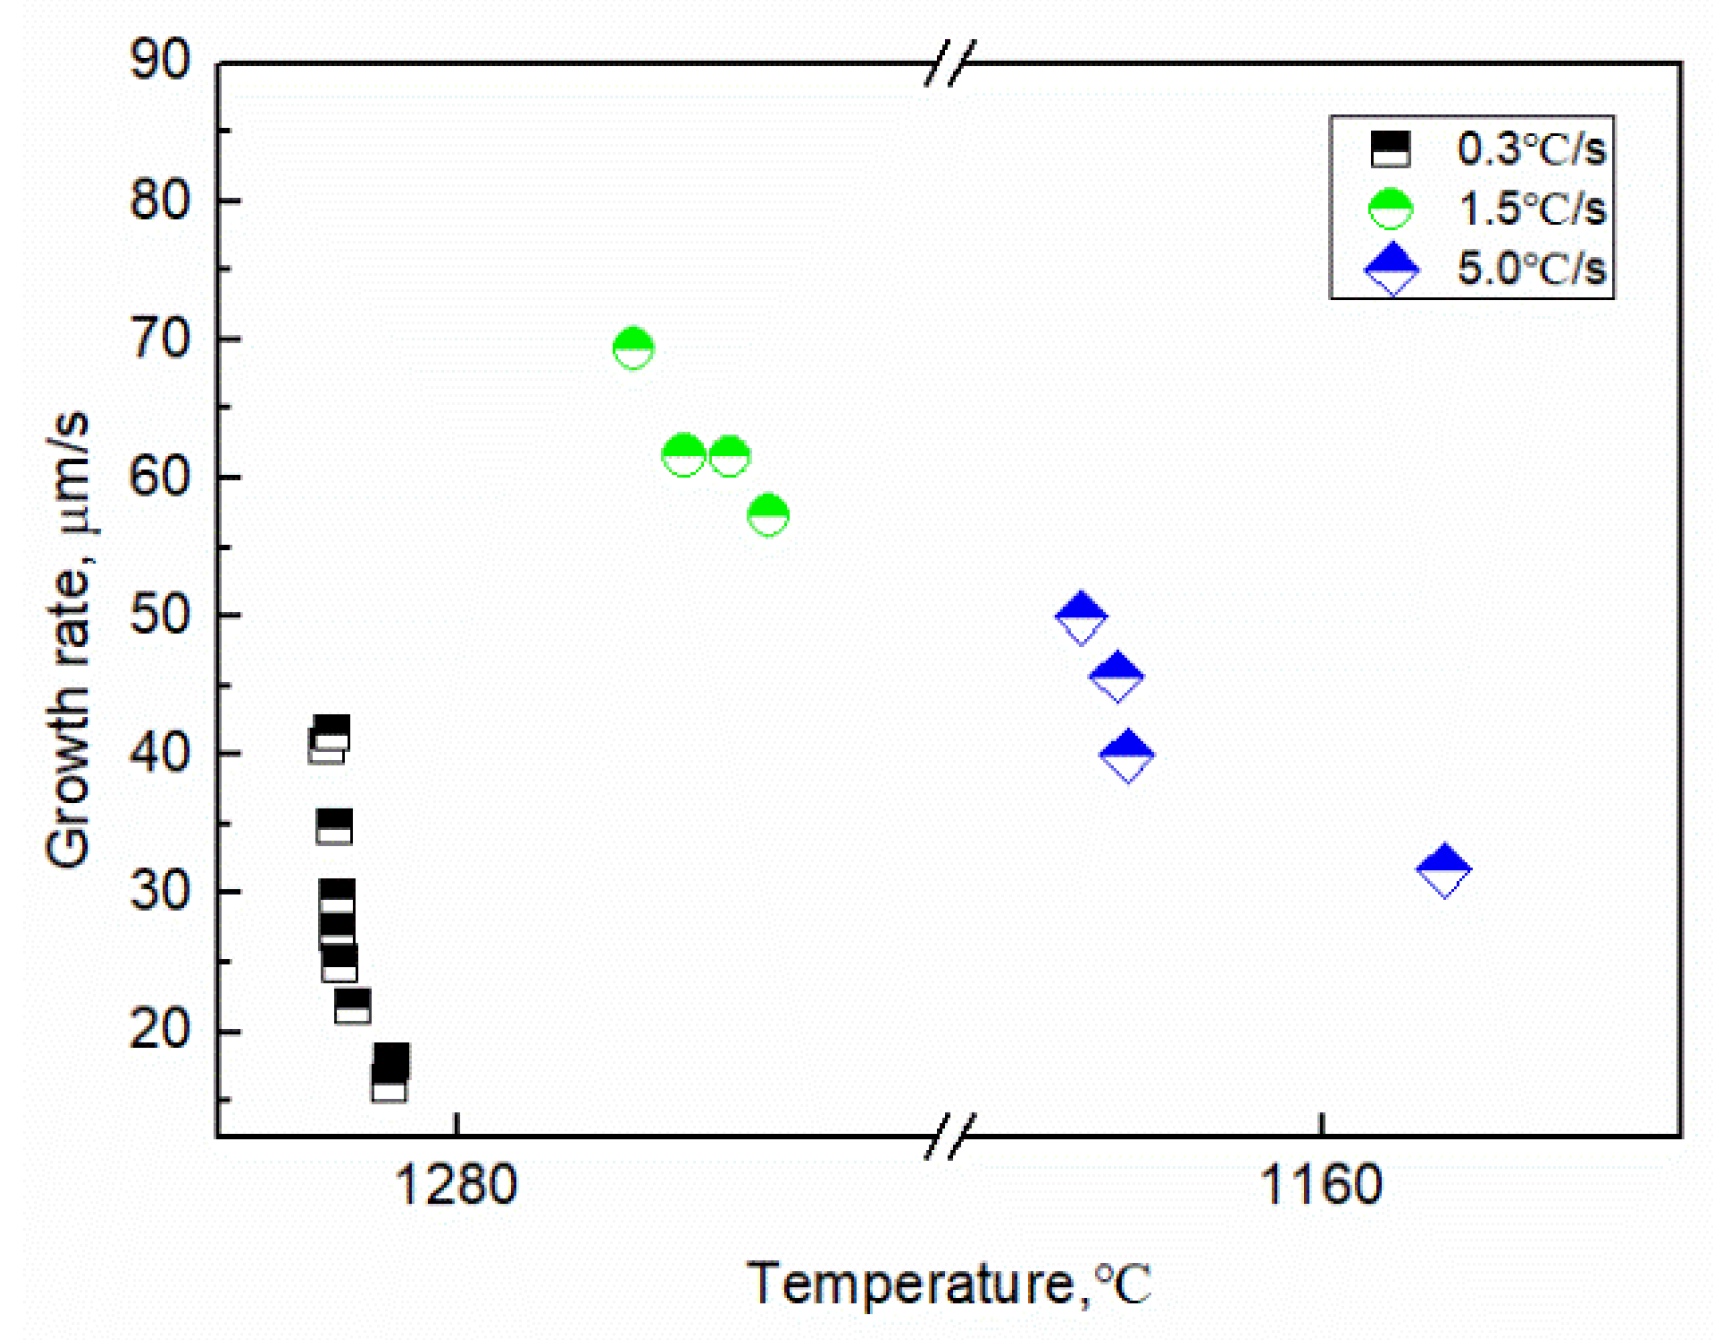
The growth length and rate of the tip of the γ-Fe dendrite were determined using image analysis, as shown in Figure 7. The growth length of the γ-Fe dendrite tip increased by 198.28 μm within 0~12.18 s (1286.5–1282.8 °C) at the cooling rate of 0.3 °C/s, and the growth length and rate have a parabolic relationship with time: L = 58.38 × t0.50 and V = 45.8 × t−0.34, respectively. The dendrite growth at the solid–liquid interface was controlled by solute diffusion. The growth length and rate also exhibit a parabolic relationship with time at a cooling rate of 1.5 °C/s, where L = 69.1 × t0.87 and V = 69 × t−0.13, respectively. When the cooling rate was 5.0 °C/s and the temperature was 1169.2~1156.2 °C, there also is a parabola relationship between the growth length and rate of dendrite tip and time, L = 41.84 × t0.93 and v = 40.1 × t−0.28, respectively. This result illustrates that the higher the cooling rate, the faster the dendrite tip speed. Comparing the result observed in the CLSM experiment, the development degree of γ-Fe dendrite during solidification is significantly reduced with the increase of cooling rate in the observable temperature range. The tertiary dendrites of γ-Fe can be clearly seen during solidification at the cooling rate of 0.3 and 1.5 °C/s, while only secondary dendrites can be seen at the cooling rate of 5.0 °C/s for the γ-Fe dendrite. The change of the dendrite development degree also shows the effect of cooling rate on the morphology of dendrite growth. When the cooling rate increases, the local solidification time of the dendrite becomes shorter, and the coarsening time along the dendrite decreases, thus reducing the dendrite spacing and inhibiting the nucleation and growth of the tertiary dendrite [23]. Figure 8 shows the relationship between the growth rate of γ-Fe dendrite tip and temperature. The results show that the growth rate of dendrite tip decreases gradually with the decrease of temperature at three cooling rates. It is different from the growth of dendrite under the forced growth conditions. Under the condition of directional solidification, the crystal is forced to grow. There is an exponential relationship between the solidification rate at the tip of the dendrite and the undercooling. The greater the undercooling, the greater the growth rate [24]. Based on the Wilson–Frenked model [25,26], the relationship between the dendrite growth rate and the temperature (undercooling) is essentially determined by both thermodynamics and kinetics. At the thermodynamics, it mainly shows the driving force of crystal growth, expressed by Gibbs free energy, which increases with the decrease of temperature. At the kinetics, it mainly shows the diffusion process of solute atoms. The diffusion ability is characterized by the diffusion coefficient, and its value decreases with the decrease of temperature. The growth rate of γ-Fe dendrite was gradually decreased in the experiment and was mutually influenced by the above-mentioned factors.
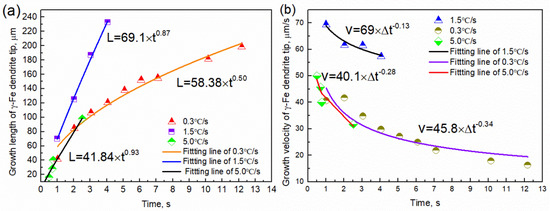
Figure 7.
Image analysis results of the γ−Fe dendrite growing at 1286.5−1282.8 °C, 1273.1−1267.0 °C, and 1224.6−1218.3 ° corresponding to the cooling rates of 0.3 °C/s, 1.5 °C/s and 5.0 °C/s: (a) the growth length of the γ−Fe dendrite with time; (b) the growth rate of the γ−Fe dendrite with time.
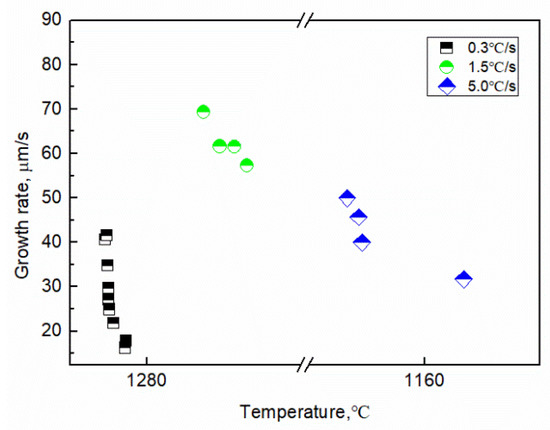
Figure 8.
Image analysis results of the growth rate of the γ-Fe dendrite with undercooling.
3.3. Solidification Microstructure
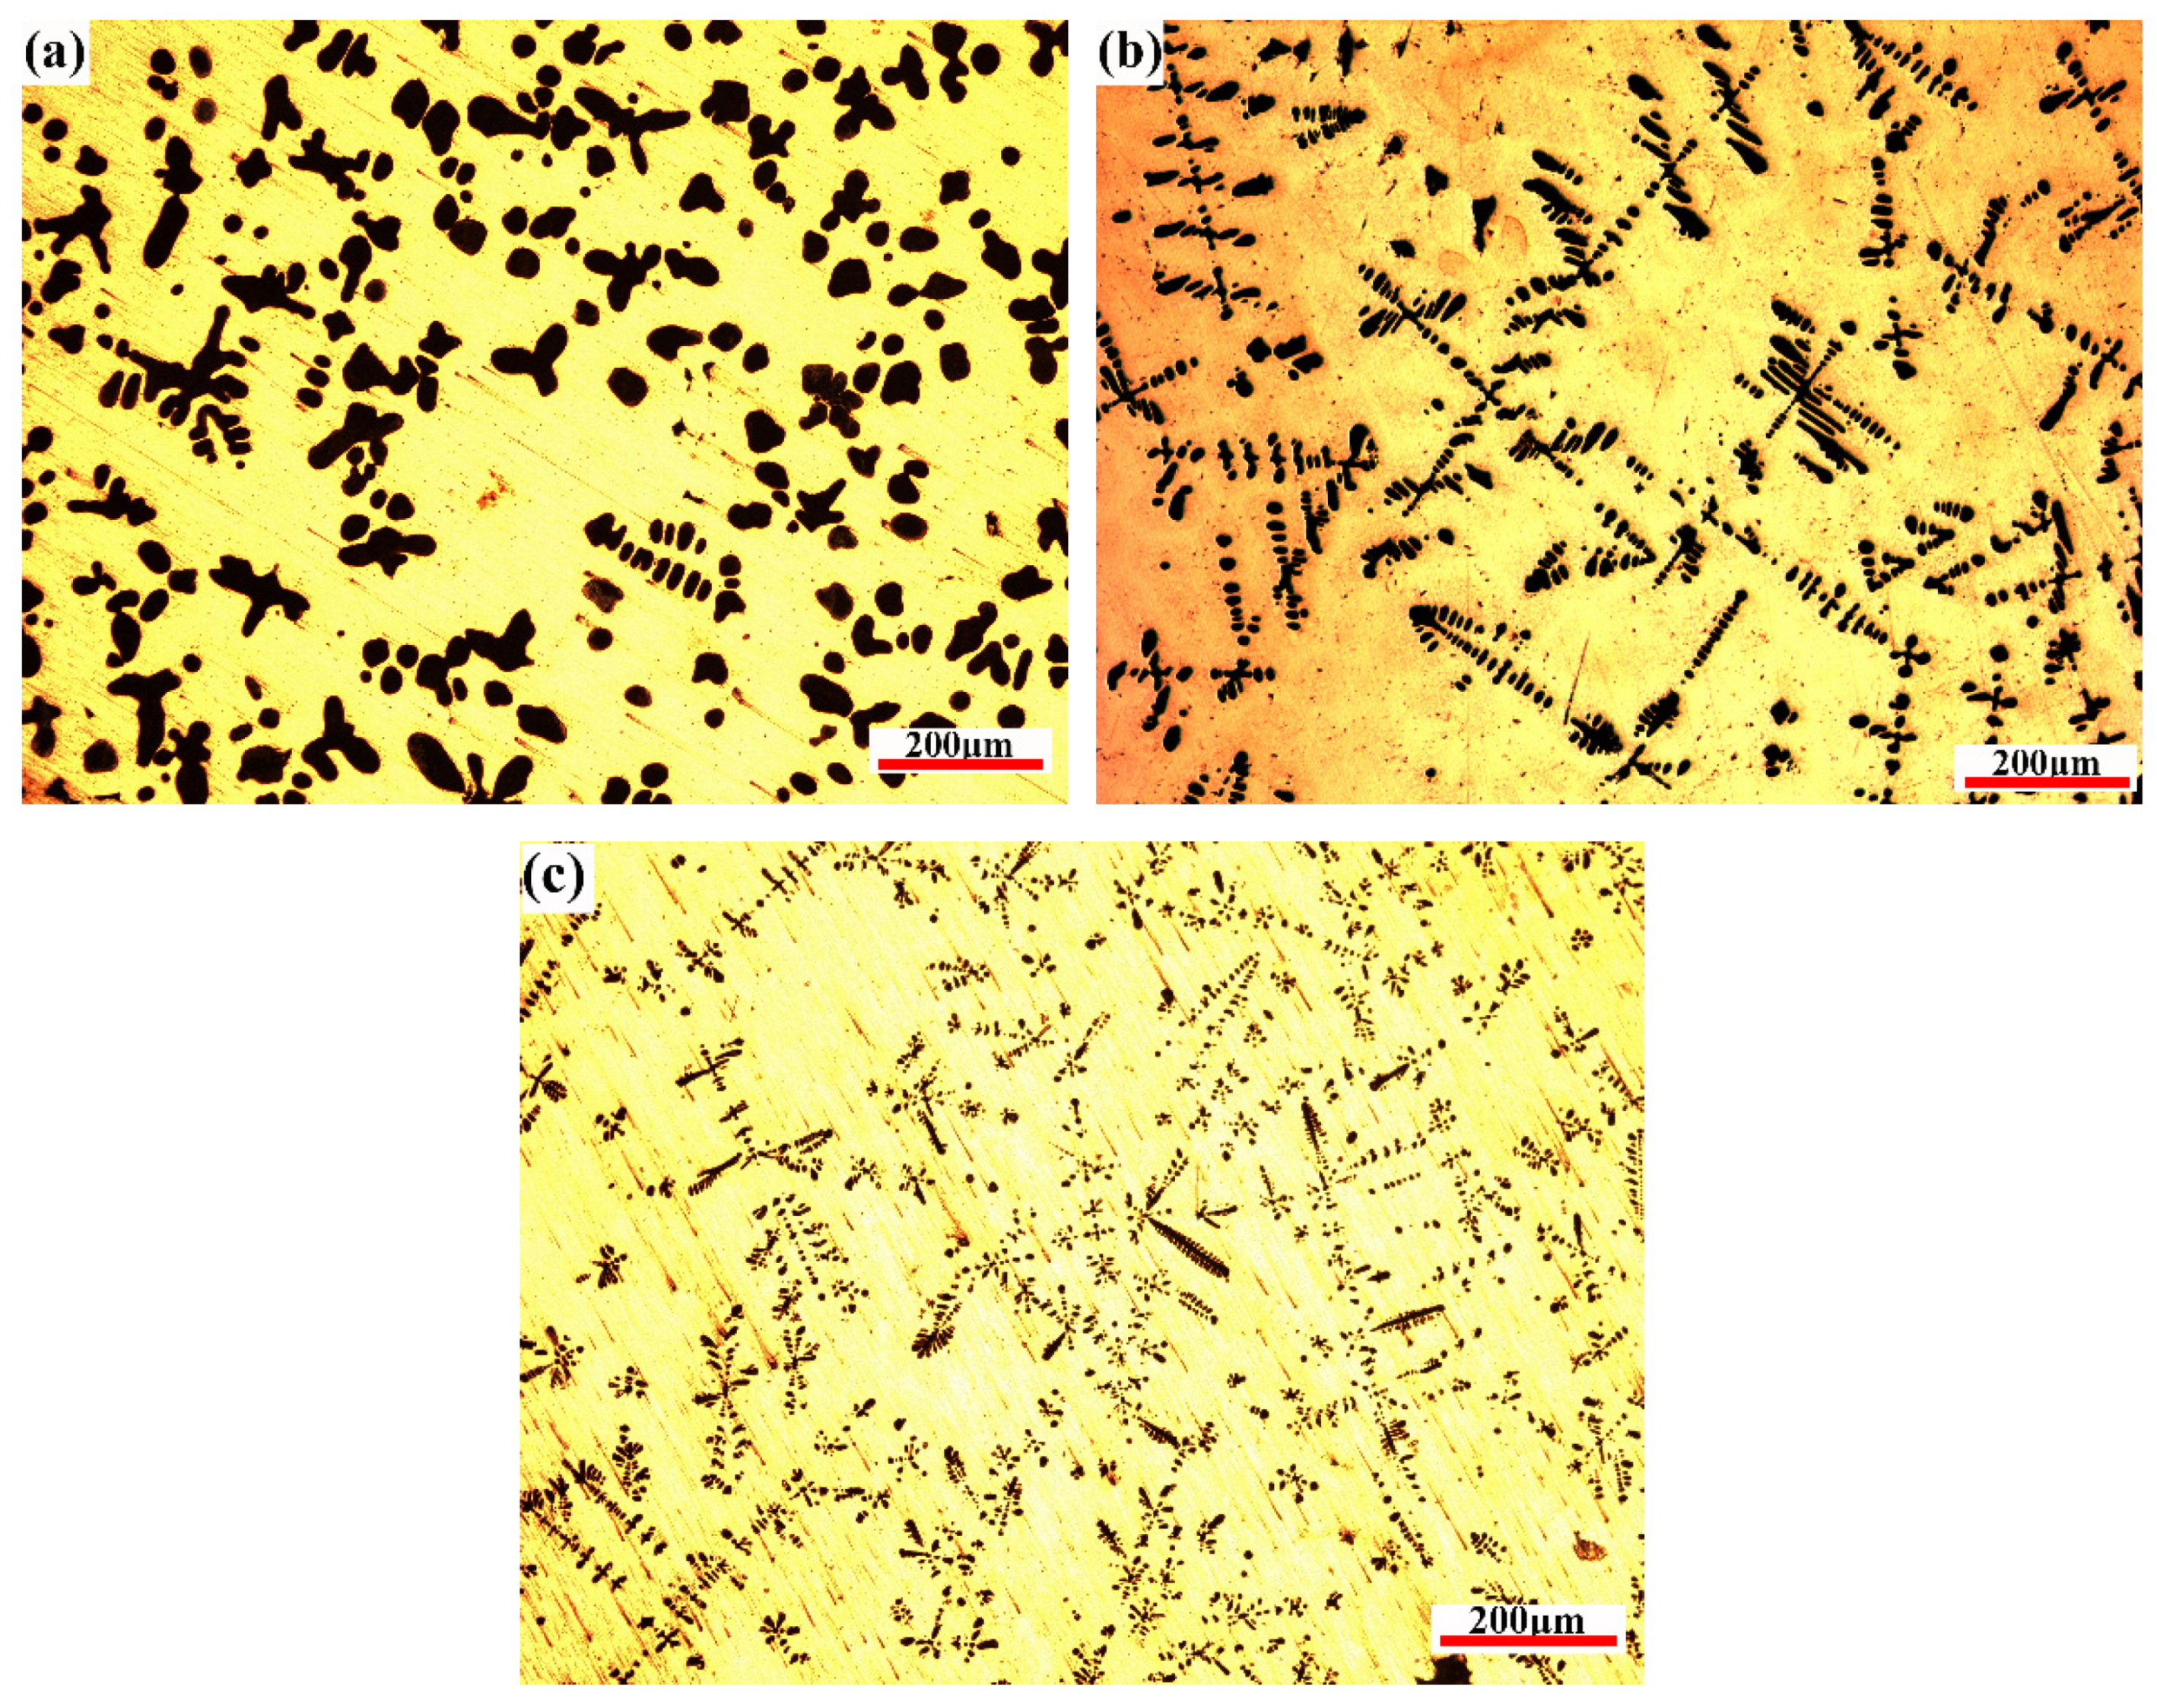
Figure 9 presents the microstructure images obtained at different cooling rates after the CLSM observation. The notable obvious tendency is that the Fe phase (α-Fe transformed from γ-Fe) morphology formed at high cooling rates is finer and longer than that formed at low cooling rates, where the Fe phase shows a typical dendritic structure. In addition, the volume fraction of the Fe phase decreased. The solidified morphology of the Fe phase is mainly cellular, and there are few dendritic crystals at the cooling rate of 0.3 °C/s. When the cooling rate increased to 1.5 °C/s, a typical dendritic structure was shown. Simultaneously, the dendrite diameter in the as-cast microstructure decreased from approximately 29.4 μm at 0.3 °C/s to approximately 9.5 μm at 1.5 °C/s. Along with the cooling rate increasing to 5 °C/s, the size of primary dendrite arms decreases to 4.5 μm. It is worth noting that the Fe phase is mainly cellular and there are few dendrites in the metallographic diagram at the cooling rate of 0.3 °C/s (Figure 9a), which is slightly different from CLSM observation. There are two possible reasons for this result: (1) Dendrite degradation occurs. In the process of dendrite growth, the concentration is different near the dendrite arm with different radius of curvature. The larger the radius of curvature, the greater the solute concentration in the liquid phase near the dendrite. The existence of solute concentration will promote solute diffusion at the front of the solid–liquid interface, making the fine dendrite dissolved and the thick dendrite arm thickened [23,27]. In general, the longer the time of the solid–liquid two-phase region during solidification, the more fully the dendrite coarsening is carried out, and the dendrite degradation makes the Fe phase in the solidification structure appear cellular at this time. (2) The peritectic reaction: when the temperature decreases to 1096 °C, Cu-Fe alloy undergoes the peritectic reaction (γ-Fe + L→ ε-Cu); because the peritectic reaction needs to consume the primary precipitated phase, the increase of solidification time will help the peritectic reaction to proceed more thoroughly when the solidification rate is low, thus making the fine dendrites further dissolve and degenerate.
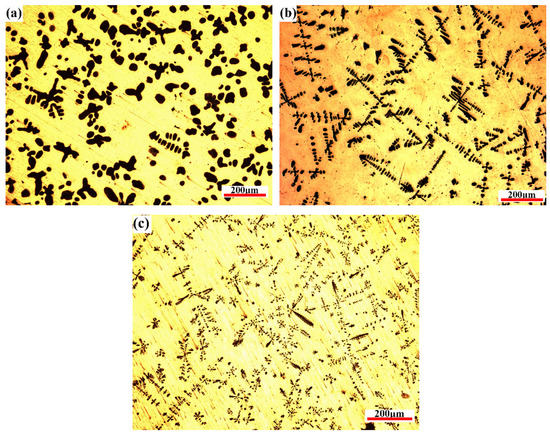
Figure 9.
OM solidification microstructures under three different cooling rates: (a) 0.3 °C/s, (b) 1.5 °C/s, and (c) 5 °C/s.
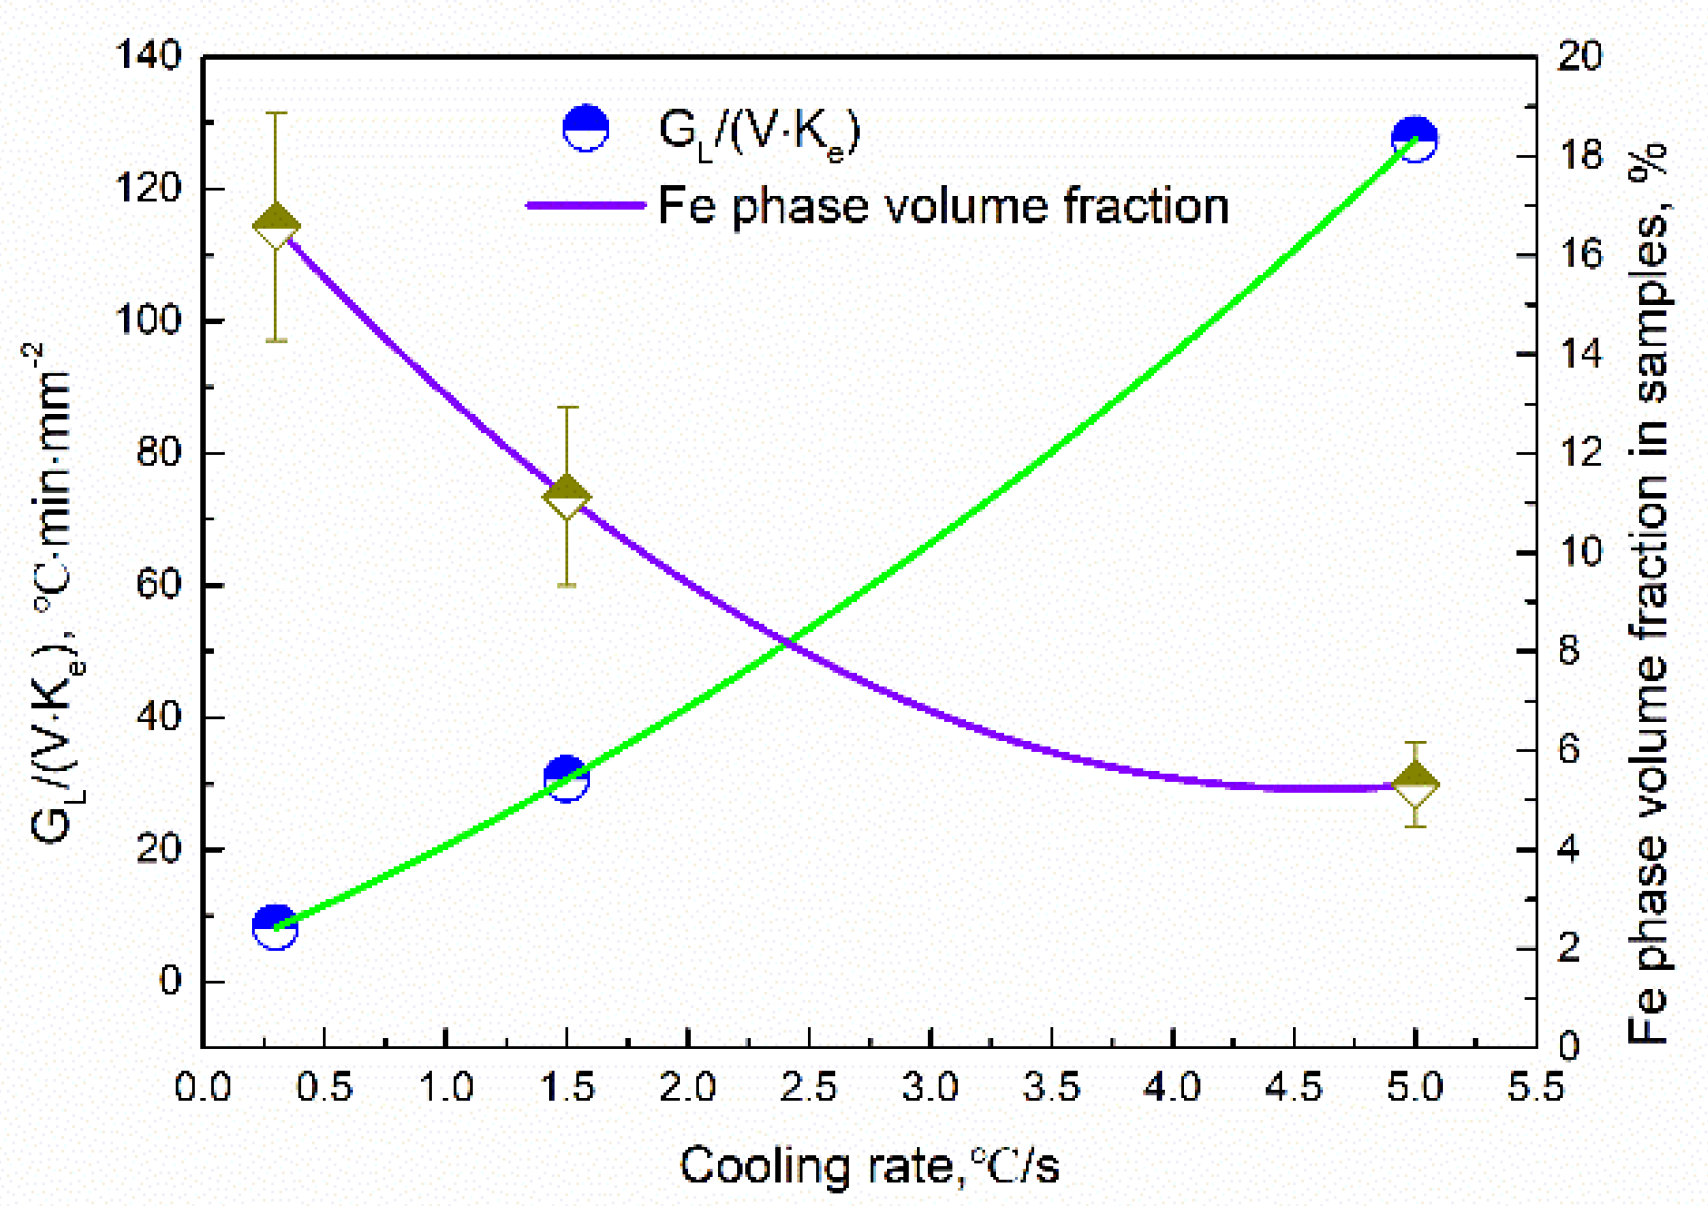
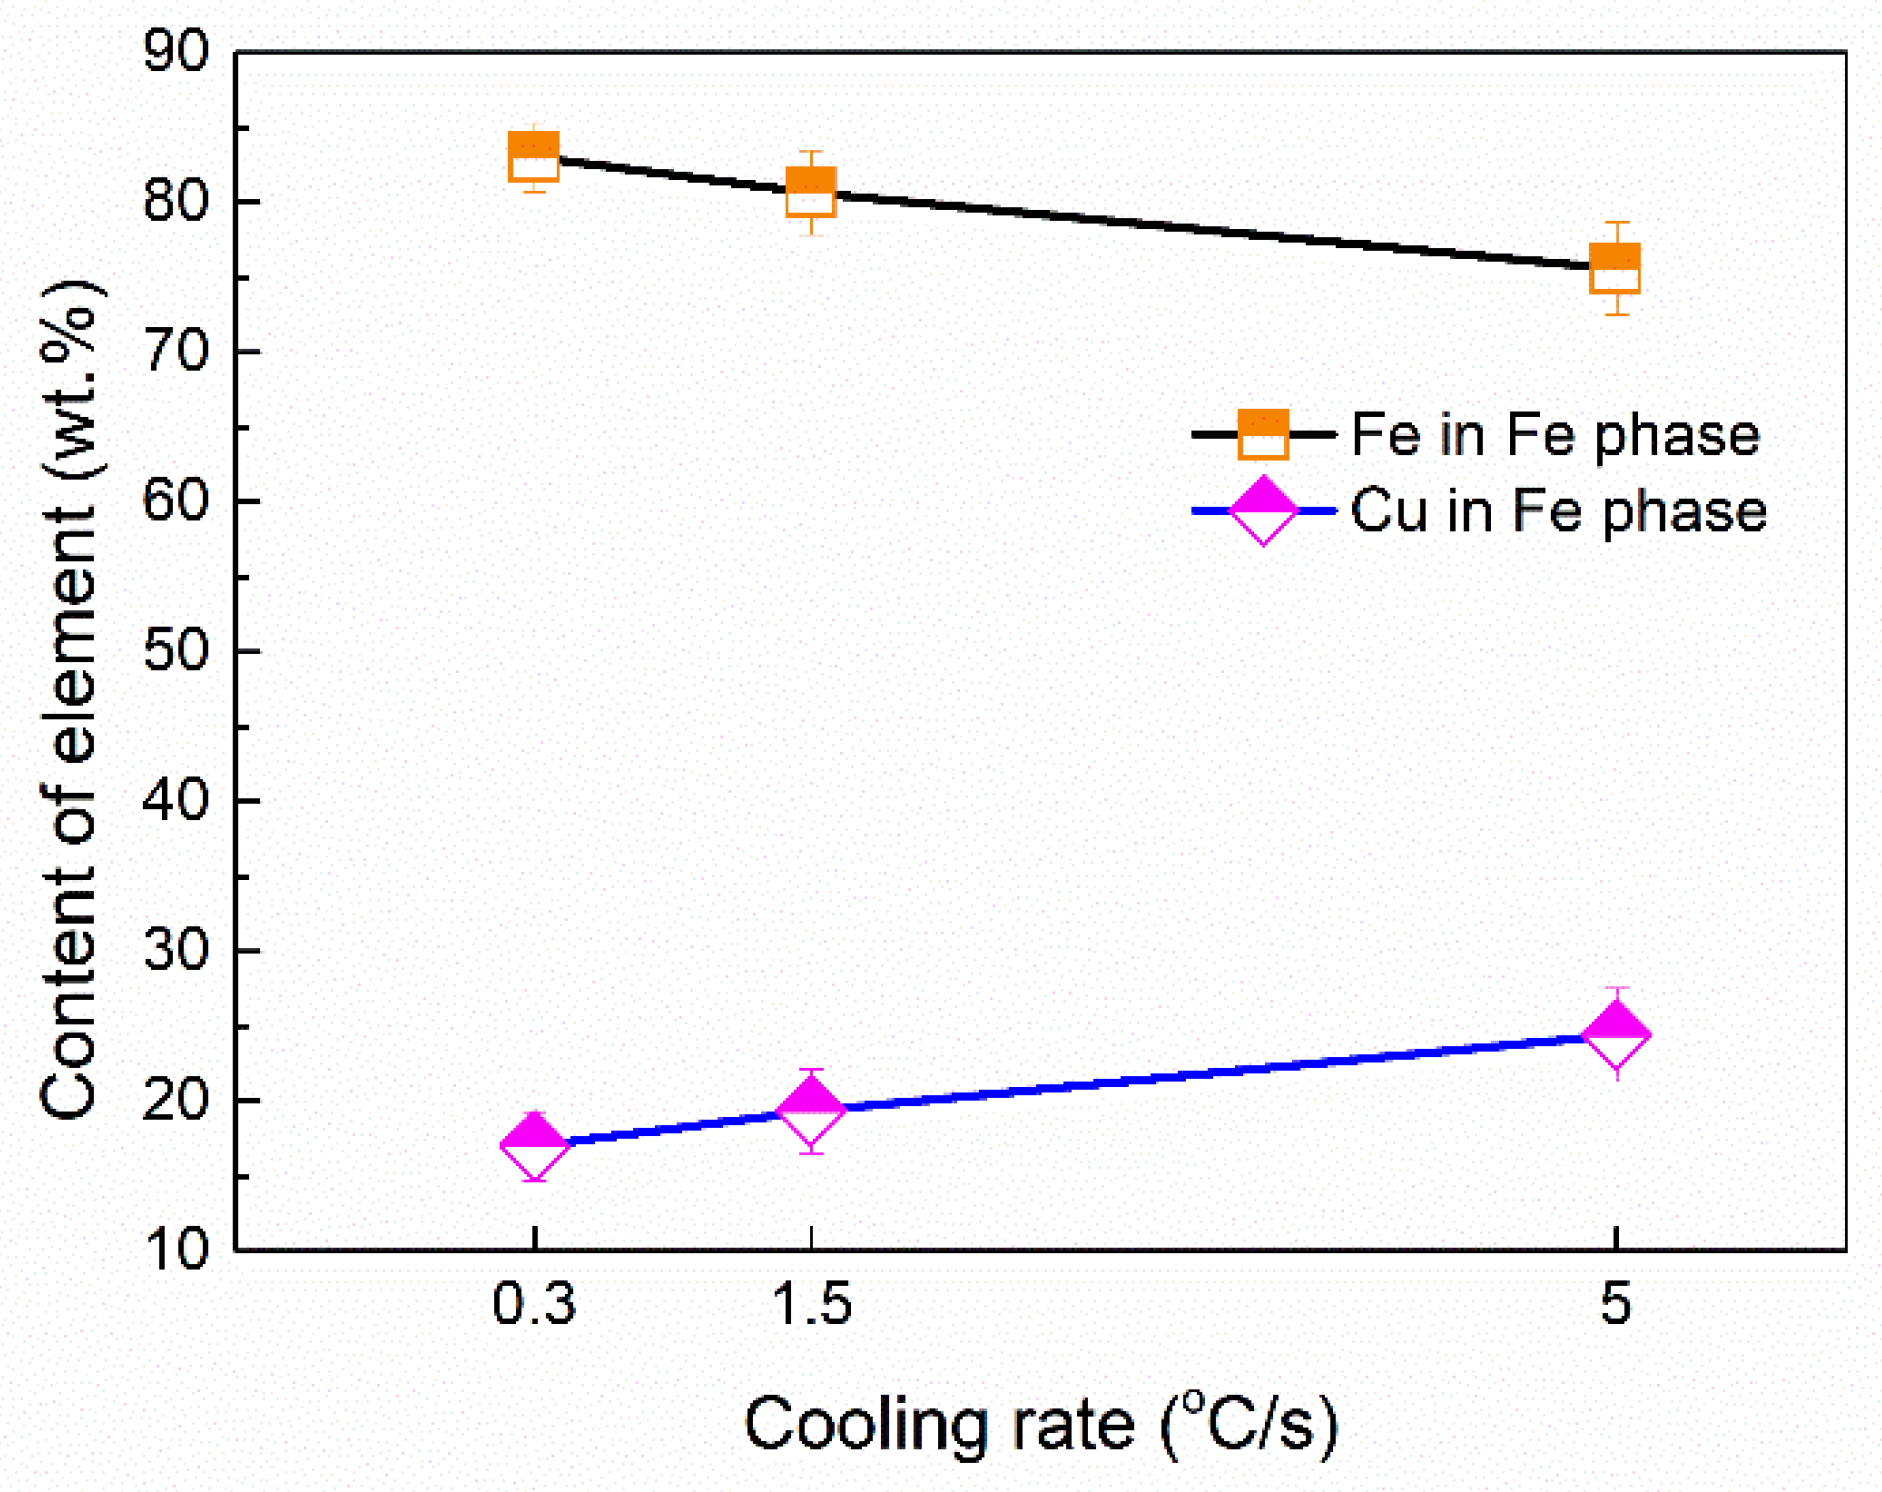
Figure 10 shows the average volume fractions of the Fe phase in different samples. The average volume fractions were analyzed by using Image-Pro Plus software. It can be seen that the precipitation fraction of the Fe phase decreased with an increase in the cooling rate. The average composition of the Fe dendritic phase was shown in Figure 11. The Fe content slightly decreases in the Fe dendritic phase, and simultaneously, the content of Cu increases with the increasing of cooling rates. This implies that the Fe content in the Cu matrix increased as the cooling rate varied.
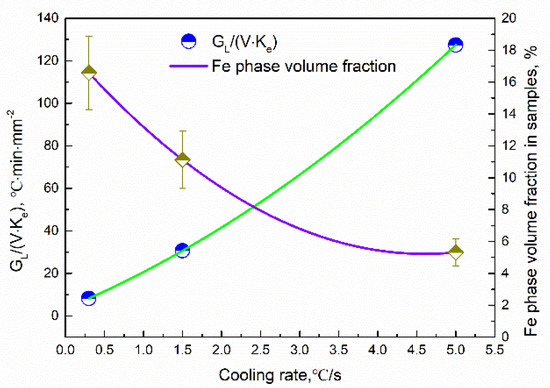
Figure 10.
Relation between cooling rates and Fe phase volume fraction: the constitutional undercooling.
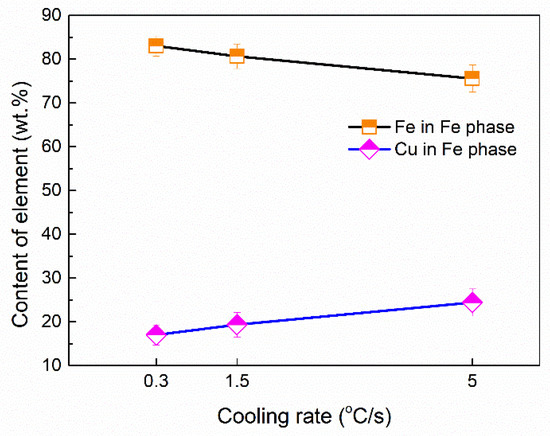
Figure 11.
Average chemical composition in the Fe phase dendrite.
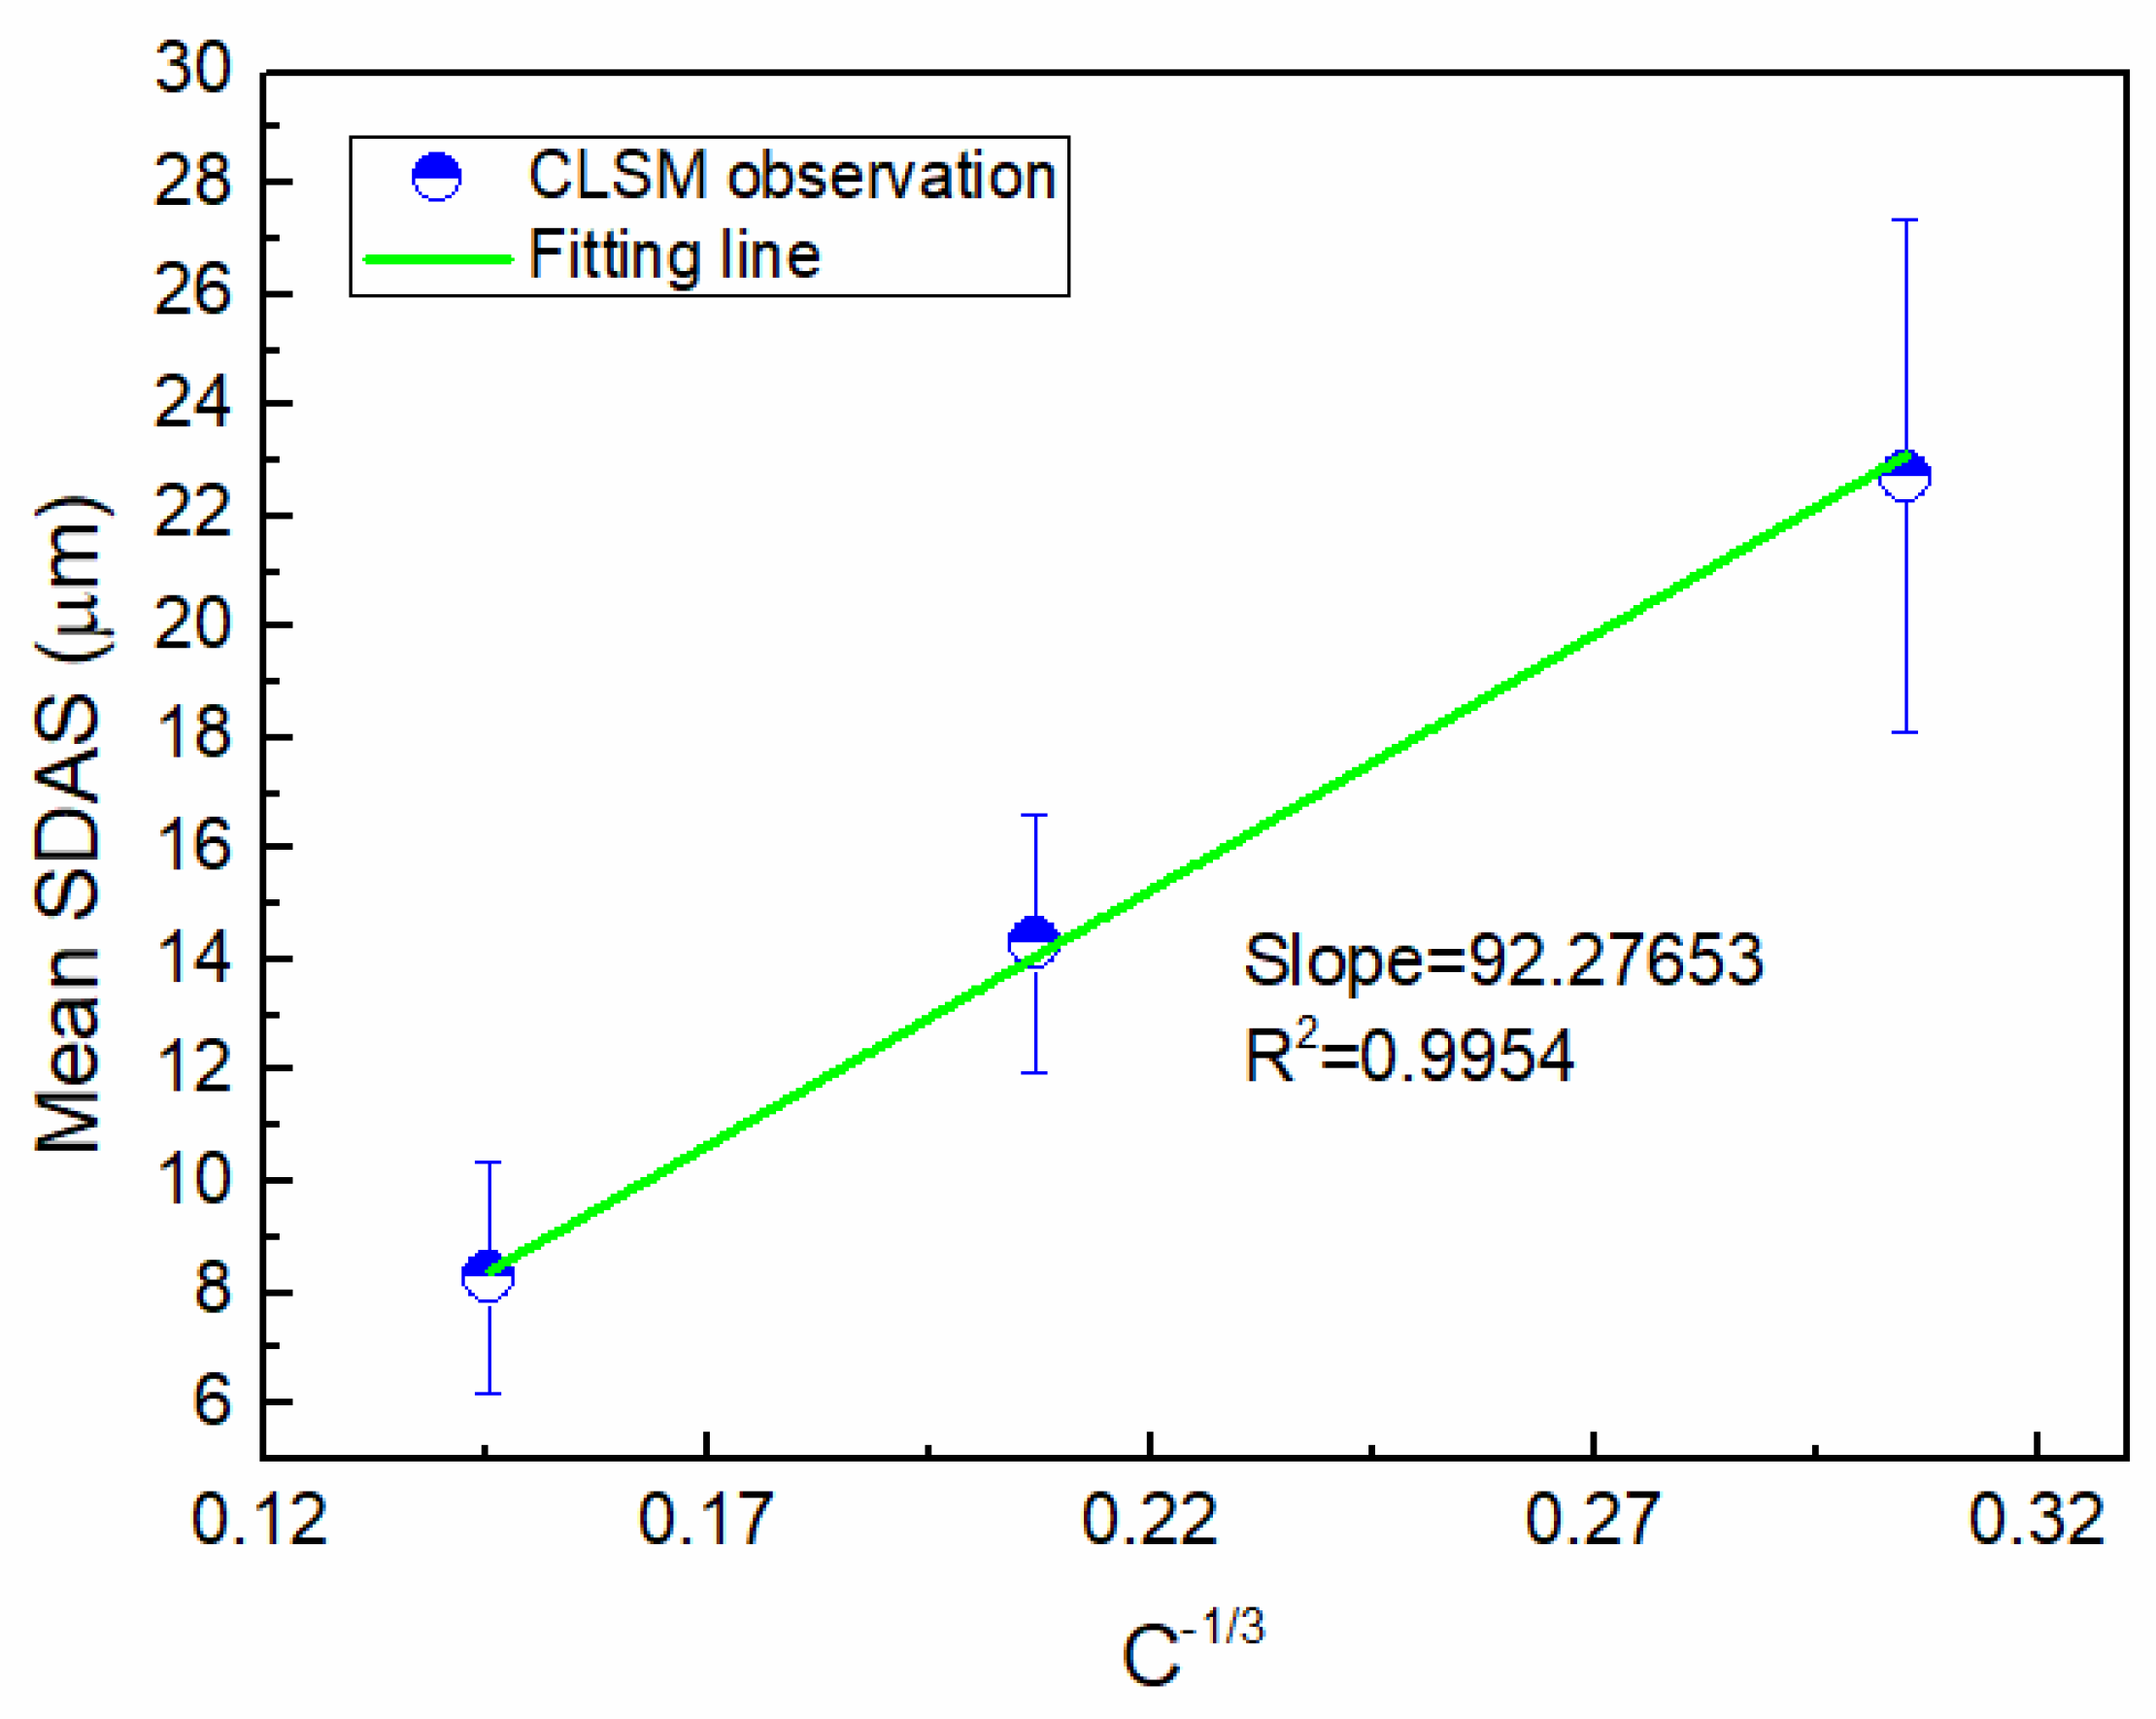
The average SDAS in the sample was measured (Table 1), indicating that the SDAS decreased with increasing cooling rates. It is widely accepted that the dendrite arm spacing is a function of the cooling rate. Secondary dendrite arm spacing SDAS (λ2, µm) can be described in the form of [28,29]: , where k is the alloy constant, and C is the cooling rate. There is a linear relationship between λ2 and C−1/3, and the slope can be calculated. Figure 12 shows the result of linear regression. The slope was calculated to be approximately 47.16 µm °C/min1/3. Thus, the prediction formula of secondary dendrite spacing was established within the range of the cooling rate studied for Cu-20wt%Fe:

Table 1.
Mean values of SDAS measured in different cooling rate samples.
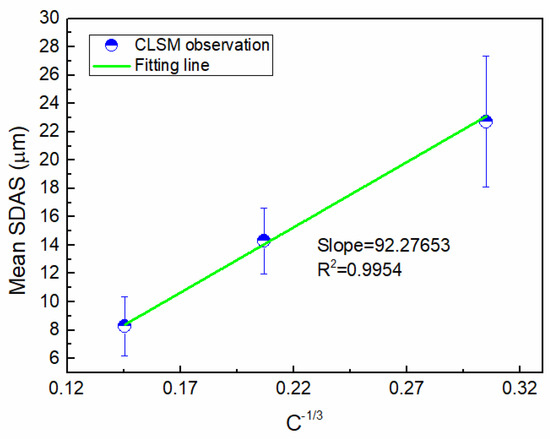
Figure 12.
The result of linear regression.
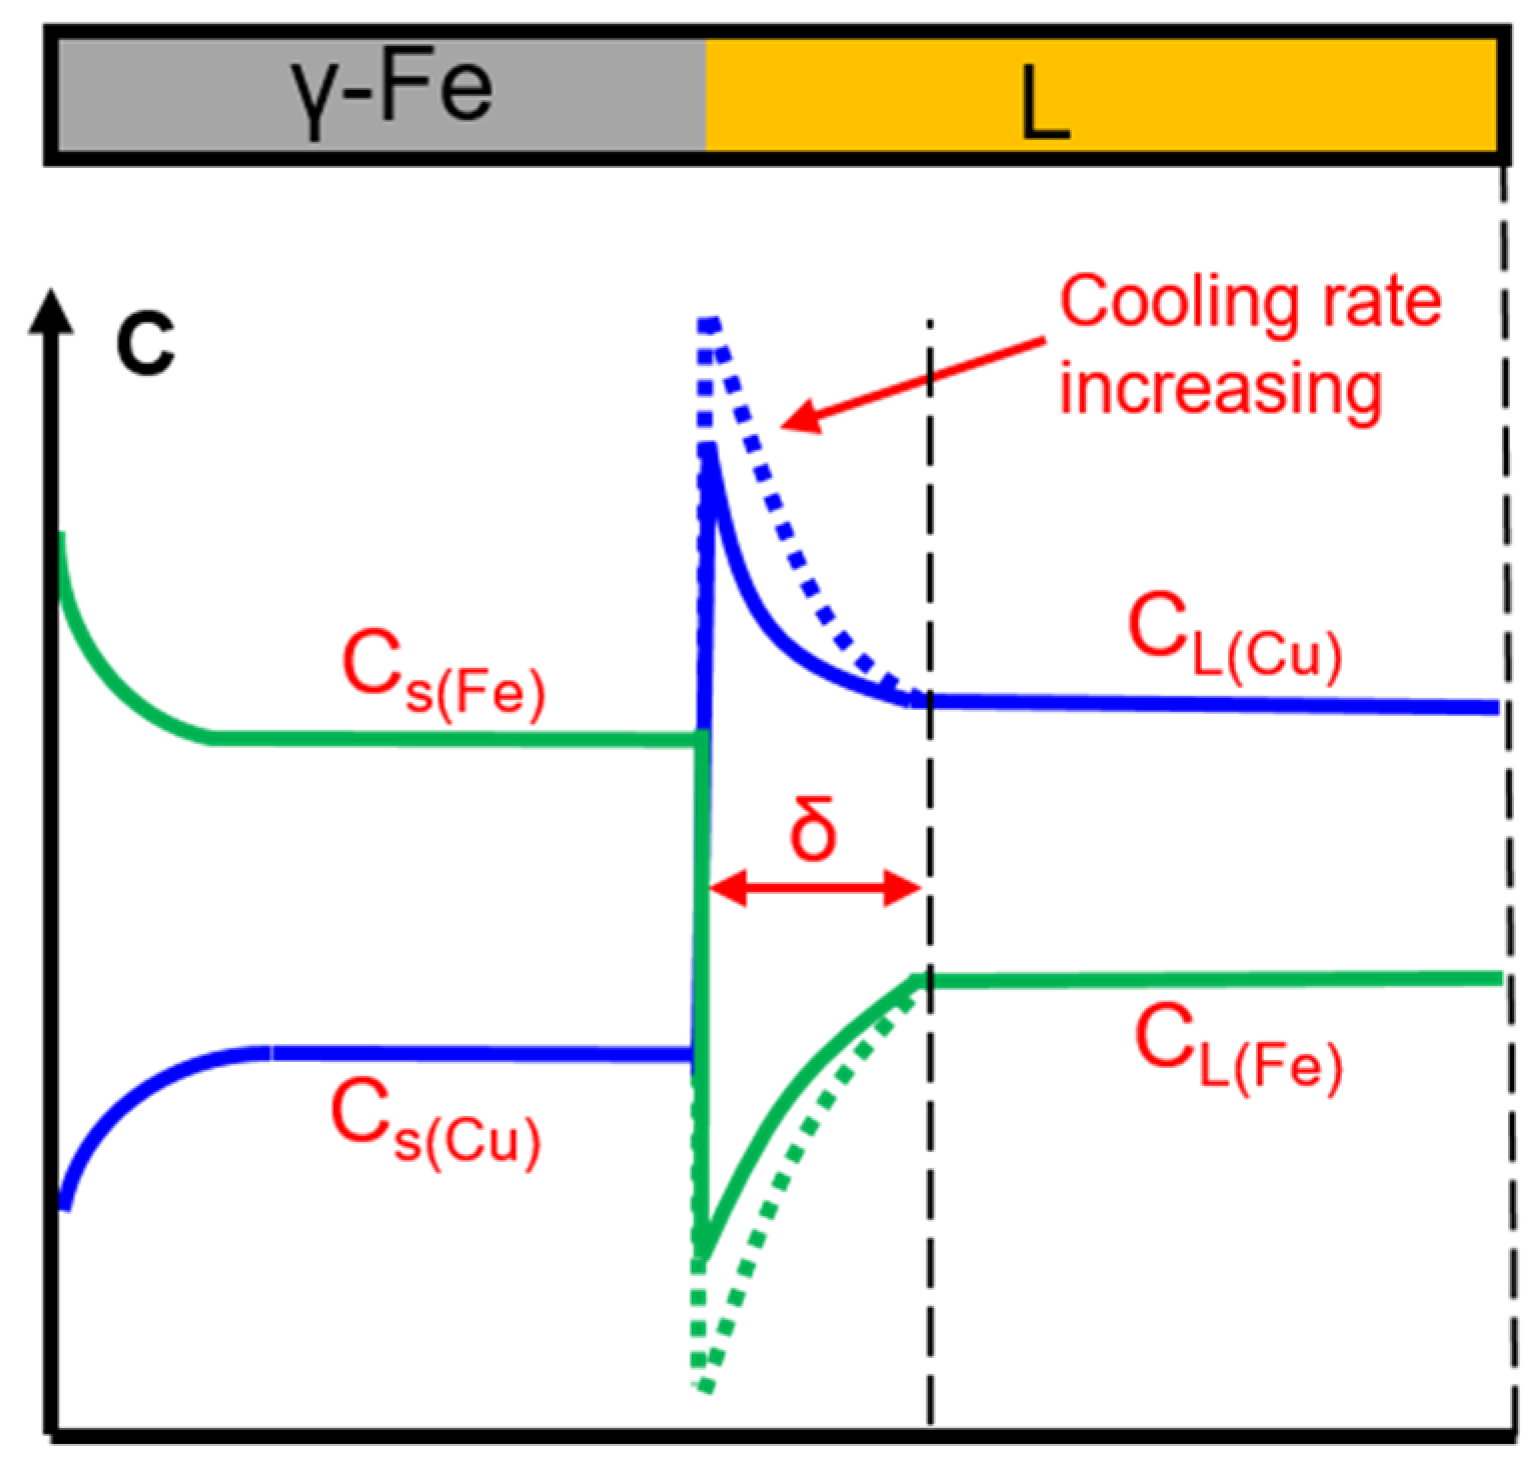
During the solidification process, the morphology of the solid–liquid interface is related to the temperature field, solute diffusion field, and interface energy efficiency. Solute diffusion plays an important role in dendrite growth. During the solidification of Cu-Fe alloy, when the γ-Fe phase is separated from the liquid phase, the Cu atoms will be continuously discharged from the solid–liquid interface because K0(Cu) < 1. In order to continue the growth of the γ-Fe phase, Fe atoms in the distant liquid must diffuse to the front of the solidifying interface, and simultaneously, the surplus Cu atoms need to diffuse into the liquid at the solidifying interface. The insufficient diffusion of Fe and Cu atoms at the front of the solidifying interface led to a concentration gradient at the solid/liquid interface, as shown in Figure 13. For Cu-Fe alloys, the diffusion of Fe atoms to the solid–liquid interface will form a Fe-rich solute layer at the front of the solid/liquid interface, causing undercooling. The greater the cooling rate, the shorter the diffusion time of the solute at the solidification interface, resulting in a larger concentration gradient across the L/γ-Fe interface.
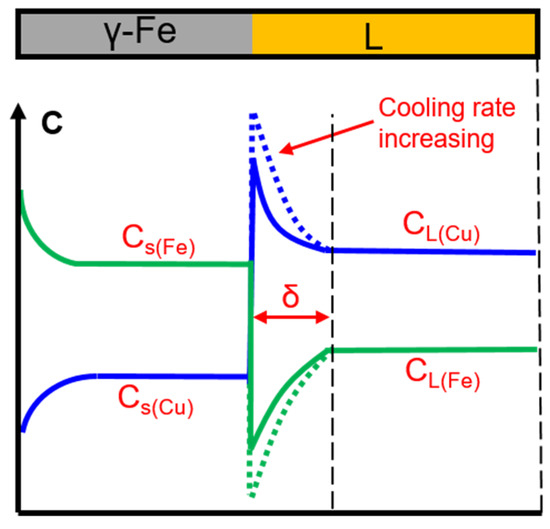
Figure 13.
Schematic of the near-equilibrium solidification.
Rutter and Tiller et al. [30] believed that constitution undercooling in the liquid phase produced at the front of the solid–liquid interface can cause instability of the solidification flat interface and form cellular, dendritic crystal structures.
where GL is the temperature gradient, υ is the growth rate, mL is the slope of the liquid line, k0 is the solute redistribution coefficient, DL is the solute diffusion coefficient, and C0 is the original alloy composition. It can be seen from Equation (2) that the constitutional undercooling is mainly affected by the temperature gradient DL, the dendritic growth rate v, and the thickness of the diffusion layer δN. In the actual solidification process, the solute distribution is affected by the cooling rate. This effect is expressed by the effective solute distribution coefficient (ke). The effective solute redistribution coefficient can be calculated using Equation (3) based on the theory of Burton [31].
where, CS* is the solid concentration at the solid–iquid interface in the solid phase and δN is the diffusion length scale. CS* can be obtained using Equation (4).
If CS* is equal to C0, Equations (2) and (4) can be simplified as Equations (5) and (6) [31].
where fS* is the critical solid fraction, and ke is the effective solute redistribution coefficient. The critical solid fraction (fS*) is the solidification fraction, and the (fS*)2 can be considered as the proportion of the microstructure in the 2-D plane [24]. Thus, fS* is calculated using the area ratio of the solidified structure, and then ke is obtained.
Assuming mL, DL, and C0 are constant in the experiment, the degree of constitutional undercooling can be determined using GL/(υ·ke). The value of GL and υ can be obtained by observation and analysis of in situ experiments. The determination method of the temperature gradient is similar to that in [32]. Due to the fact that the size of the CLSM experimental sample is small, assuming that the temperature change in the experimental crucible is timely with cooling, the temperature at the front of the solid–liquid interface is the measured temperature of the thermocouple in the crucible. Thus, the temperature gradient of the dendrite can be obtained according to the advancing distance of the solid–liquid interface at different times. The GL/(υ·ke) values at different cooling rates are shown in Figure 10. It can be observed that the GL/(υ·ke) value gradually increases with an increasing cooling rate, which means that the degree of constitutional undercooling increases with the cooling rate increasing. A larger constitutional undercooling can enhance the disturbance force of the solid–liquid interface. Therefore, the complexity of dendrite morphology increases as the constitutional undercooling increases [33]. When the cooling rate increased from 0.3 °C/s to 1.5 °C/s, the cellular dendrites at the front of the solidifying interface gradually transformed into a dendrite structure. The increased cooling rate led to constitutional undercooling, the interface concentration gradient increased, the solidification rate was accelerated, and the diffusion time was shortened, which led to the delayed diffusion of Fe from the liquid to the solidifying interface. Finally, the growth of the primary γ-Fe phase is inhibited, resulting in a decrease in the volume fraction of the Fe phase produced by precipitation.
4. Conclusions
Microstructural evolution of the γ-Fe phase during solidification was studied in the Cu-20wt%Fe alloy. The main conclusions are as follows:
- During the solidification process of the Cu-20Fe alloy, the remelting of primary γ-Fe dendrites was directly observed by CLSM. Moreover, the γ-Fe dendrites were fragmented due to remelting, and thus, the grain structure of the Fe phase may be improved by external forces within the remelting stage.
- The morphology of γ-Fe dendrites was significantly affected by the cooling rate. The dendritic morphology of γ-Fe on the interface changed from a cellular-like structure to a typical finer and longer dendritic structure as the cooling rate increased from 0.3 °C/s to 5.0 °C/s. The growth rate of the γ-Fe dendrite tip has a parabolic relationship with time, ν = 45.8 × t−0.34, where the temperatures were between 1286.5 and 1282.8 °C at the cooling rate of 0.3 °C/s. The growth rate also exhibits a parabolic relationship with time at cooling rates of 1.5 °C/s, where ν = 69 × t−0.13, and 5.0 °C/s, where ν = 40.1 × t−0.28. The dendrite tip growth rate at the solid–liquid interface increased with the cooling rate.
- The volume fractions of the Fe phase in samples cooled at 0.3, 1.5, and 5.0 °C/s were 16.58, 11.13, and 5.32%, respectively, showing a gradual decrease with an increase in the cooling rate. The prediction formula of SDAS for the Cu-20wt%Fe alloy within the studied cooling rate range was established as .
- The degree of constitutional undercooling was calculated in combination with the analysis of the sample data. The dendrite morphology becomes more complex as the constitutional undercooling increases. Simultaneously, the growth of the primary γ-Fe phase was inhibited by insufficient diffusion of Fe and Cu at the solidification front, resulting in a decrease in the volume fraction of the Fe phase in the samples.
Author Contributions
Writing—original draft, investigation and editing, J.G.; Funding acquisition and project administration, D.L. and J.Z. All authors have read and agreed to the published version of the manuscript.
Funding
This work was financially supported by the Major Scientific and Technological R&D Projects of Jiangxi Province (Grant No. 20212AAE01003 and 20224BBE52002), the Jiangxi Academy of Sciences (Grant No. 2020-YYB-16) and the Key R&D Projects of Jiangxi Province (Grant No. 20224BBE51047).
Data Availability Statement
Not applicable.
Conflicts of Interest
The authors declare no conflict of interest.
References
- Wang, M.; Jiang, Y.; Li, Z.; Xiao, Z.; Lei, Q. Microstructure evolution and deformation behaviour of Cu-10wt%Fe alloy during cold rolling. Mater. Sci. Eng. A 2021, 801, 140379. [Google Scholar] [CrossRef]
- Yuan, D.; Xiao, X.; Luo, X.; Wang, H.; Han, B.; Liu, B.; Yang, B. Effect of multi-stage thermomechanical treatment on Fe phase evolution and properties of Cu-6.5 Fe-0.3 Mg alloy. Mater. Charact. 2022, 185, 111707. [Google Scholar] [CrossRef]
- Liu, S.; Jie, J.; Guo, Z.; Yue, S.; Li, T. A comprehensive investigation on microstructure and magnetic properties of immiscible cu-Fe alloys with variation of Fe content. Mater. Chem. Phys. 2019, 238, 121909. [Google Scholar] [CrossRef]
- Zhang, P.; Lei, Q.; Yuan, X.; Sheng, X.; Li, Y.; Li, Z. Microstructure and mechanical properties of a cu-Fe-Nb alloy with a high product of the strength times the elongation. Mater. Today Commun. 2020, 25, 101353. [Google Scholar] [CrossRef]
- Jo, H.R.; Kim, J.T.; Hong, S.H.; Kim, Y.S.; Park, H.J.; Park, W.J.; Park, J.M.; Kim, K.B. Effect of silicon on microstructure and mechanical properties of Cu-Fe alloys. J. Alloys Compd. 2017, 707, 184–188. [Google Scholar] [CrossRef]
- Hong, S.I. Copper-iron filamentary microcomposites. Adv. Eng. Mater. 2001, 3, 475–479. [Google Scholar] [CrossRef]
- Biselli, C.L.; Morris, D.G. Microstructure and strength of Cu-Fe in situ composite obtained from prealloyed Cu-Fe powders. Acta Met. Mater. 1994, 42, 163–176. [Google Scholar] [CrossRef]
- Verhoeven, J.D.; Chueh, S.C.; Gibson, E.D. Strength and conductivity of in situ Cu-Fe alloys. J. Mater. Sci. 1989, 24, 1748–1752. [Google Scholar] [CrossRef]
- Hodge, W.; Happe, R.A.; Gonser, B.W. High strength copper-silver, copper-iron, and copper-iron-chromium wire. Wire Wire Prod 1951, 26, 1033–1038. [Google Scholar]
- Spitzig, W.A.; Trybus, C.L.; Verhoeven, J.D. Metal Matrix Composites: Processing and Interfaces; Everett, R.K., Arsenault, R.J., Eds.; Academic Press: New York, NY, USA, 2009. [Google Scholar]
- Gao, H.; Wang, J.; Shu, D.; Sun, B. Effect of Ag on the microstructure and properties of Cu-Fe in situ composites. Scr. Mater. 2005, 53, 1105–1109. [Google Scholar] [CrossRef]
- Fernee, H.; Nairn, J.; Atrens, A. Precipitation hardening of Cu-Fe-Cr alloys part I Mechanical and electrical properties. J. Mater. Sci. 2001, 36, 2711–2719. [Google Scholar] [CrossRef]
- Sun, B.; Gao, H.; Wang, J.; Da, S. Strength of deformation processed Cu-Fe-Ag in situ composites. Mater. Lett. 2007, 61, 1002–1006. [Google Scholar] [CrossRef]
- Li, Y.; Yi, D.Q.; Zhang, J.B. Comparative study of the influence of Ag on the microstructure and mechanical properties of Cu-10Fe in situ composites. J. Alloys Compd. 2015, 647, 413–418. [Google Scholar] [CrossRef]
- Song, J.S.; Hong, S.I. Strength and electrical conductivity of Cu-9Fe-1.2Co filamentary microcomposite wires. J. Alloys Compd. 2000, 311, 265–269. [Google Scholar] [CrossRef]
- Zhang, J.T.; Cui, X.C.; Wang, Y.H. Liquid phase separation in immiscible Cu-Fe alloys. Int. J. Cast Met. Res. 2017, 31, 87–92. [Google Scholar] [CrossRef]
- Sun, X.; Hao, W.; Geng, G.; Ma, T.; Li, Y. Solidification microstructure evolution of undercooled Cu-15wt.%Fe alloy melt. Adv. Mater. Sci. Eng. 2018, 6, 6304518. [Google Scholar]
- Wu, Y.; Wang, W.; Chang, J.; Wei, B. Evolution kinetics of microgravity facilitated spherical macrosegregation within immiscible alloys. J. Alloys Compd. 2018, 763, 808–814. [Google Scholar] [CrossRef]
- Luo, S.B.; Wang, W.L.; Chang, J.; Xia, Z.C.; Wei, B. A comparative study of dendritic growth within undercooled liquid pure Fe and Fe50Cu50 alloy. Acta Mater. 2014, 69, 355–364. [Google Scholar] [CrossRef]
- Sohn, I.; Dippenaar, R. In-situ observation of crystallization and growth in high-temperature melts using the confocal laser microscope. Metal. Mater. Trans. B 2016, 47, 2083–2094. [Google Scholar] [CrossRef]
- Cheng, B.I.; Guo, Z.P.; Litottl, E.; Grant, P.S. Quantification study on dendrite fragmentation in solidification process of alluminum alloys. Acta Met. Sin. 2015, 51, 677–684. [Google Scholar]
- Wang, S.; Kang, J.; Guo, Z.; Lee, T.L.; Zhang, X.; Wang, Q.; Deng, C.; Mi, J. In situ high speed imaging study and modelling of the fatigue fragmentation of dendritic structures in ultrasonic fields. Acta Mater. 2018, 165, 388–397. [Google Scholar] [CrossRef]
- Kurz, W.; Fisher, D.J. Fundamentals of Solidification; Trans Tech Publications: Zurich, Switzerland, 1998. [Google Scholar]
- Edvardsson, T.; Fredriksson, H.; Svensson, I. A study of the solidification process in low-carbon manganese steels. Met. Sci. J. 2013, 10, 298–306. [Google Scholar] [CrossRef]
- Wilson, H.W. On the velocity of solidification and viscosity of super-cooled liquids. J. Phy. Chem. 1900, 50, 238–250. [Google Scholar] [CrossRef]
- Frenkel, J. Note on a relation between the speed of crystallization and viscosity. Phisik. Zeit. Sowjetunion 1932, 1, 498–510. [Google Scholar]
- Brito, C.; Nguyen-Thi, H.; Mangelinck-Noël, N.; Cheung, N.; Spinelli, J.E.; Garcia, A. Cellular-to-dendritic and dendritic-to-cellular morphological transitions in a ternary Al-Mg-Si alloy. IOP Conf. Ser. Mater. Sci. Eng. 2019, 529, 012018. [Google Scholar] [CrossRef]
- Kurz, W.; Fisher, D.J. Dendrite growth at the limit of stability: Tip radius and spacing. Acta Met. 1981, 29, 11–20. [Google Scholar] [CrossRef]
- Glicksman, M.E. Principles of Solidification: An Introduction to Modern Casting and Crystal Growth Concepts; Springer: Berlin/Heidelberg, Germany; Wiley: Hoboken, NJ, USA, 2010. [Google Scholar]
- Tiller, W.A.; Jackson, K.A.; Rutter, J.W.; Chalmers, B. The redistribution of solute atoms during the solidification of metals. Acta Met. 1953, 1, 428–437. [Google Scholar] [CrossRef]
- Burton, J.A.; Prim, R.C.; Slichter, W.P. The distribution of solute in crystals grown from the melt. Part I. theoretical. J. Chem. Phys. 1953, 21, 1987–1991. [Google Scholar] [CrossRef]
- Phelan, D.; Reid, M.; Dippenaar, R. Kinetics of the peritectic reaction in an Fe-C alloy. Mater. Sci. Eng. A 2008, 477, 226–232. [Google Scholar] [CrossRef]
- Cao, J.; Hou, Z.; Guo, D.; Guo, Z.; Tang, P. Morphology characteristics of solidification structure in high-carbon steel billet based on fractal theory. J. Mater. Sci. 2019, 54, 12851–12862. [Google Scholar] [CrossRef]
Disclaimer/Publisher’s Note: The statements, opinions and data contained in all publications are solely those of the individual author(s) and contributor(s) and not of MDPI and/or the editor(s). MDPI and/or the editor(s) disclaim responsibility for any injury to people or property resulting from any ideas, methods, instructions or products referred to in the content. |
© 2023 by the authors. Licensee MDPI, Basel, Switzerland. This article is an open access article distributed under the terms and conditions of the Creative Commons Attribution (CC BY) license (https://creativecommons.org/licenses/by/4.0/).

