Abstract
Notch characteristics significantly affect the fatigue performance of engineered components, for which the stress gradient effect is worth careful consideration. The traditional stress gradient analysis method based on the Coffin–Manson equation does not take into account the stress gradient influence range regarding the definition of the stress gradient correction factor, nor the high-stress gradient region, which has a greater influence on fatigue life. To address the aforementioned problems, a new notch fatigue life model is proposed in this paper. First, the stress–strain field at the root of the notch is analyzed to define the depth of stress gradient influence, following which the influence of the low-stress gradient region is reduced by a weighting function in the calculation of the stress gradient correction factor. Finally, to validate the method, three sets of experimental data, including TC4, GH4169, and EN8B, were used and compared with three other models. The results demonstrate that the predicted lifetimes of the new model are all within a 2-fold dispersion band, and the prediction ability is better than that of the other three models.
1. Introduction
In engineering applications, mechanical components are usually designed with different types of notches, including holes, fillets, and grooves, to meet various functional requirements. The discontinuity of the transition of such geometries can cause stress concentration in structural members, and their stress concentration areas will generate complex stress–strain fields under stress conditions. In addition, almost all mechanical component fatigue failures originate from the notch’s root, with a complex stress–strain field distribution [1,2]. In these regions, there are significant stress gradients, and it has been verified that results tend to be conservative when fatigue life is predicted by considering the parameters at the danger point in a single way [3], due to the presence of the stress gradient effect. At the microscopic level, the stress gradient is a key factor affecting crack initiation, crack extension, and eventually, fatigue fracture. Resulted from stress concentration, the material units at the root surface of the notch yield quickly under the external load, while the internal material units subjected to lower stress levels still underpin the whole area, thus slowing down the fatigue crack and expansion and retarding the process of fatigue failure [4].
As studies on fatigue life accumulate, researchers have recognized that the stress gradient effect has an important influence on fatigue life [5]. Meanwhile, various theories and methods of notched fatigue analysis based on stress gradients have been developed, including the theory of critical distance (TCD) [6,7], in addition to the volumetric method [8] based on stress field strength [9] and methods based on weighted parameters. Liao et al. [10] discussed different coupling orders of critical surface and critical distance concepts and established a generalized optimal procedure for the fatigue life prediction of notched specimens. Liu [11] proposed the stress gradient modified critical distance method by introducing the weight function of the relative stress gradient into the conventional critical distance theory. In engineering applications, the Coffin–Manson model is the widely adopted fatigue model because of its convenience and simplicity, as it only requires the hazard point strain parameters and four material parameters to predict the fatigue life. Based on the Coffin–Manson model, many researchers as well as scholars have proposed a modified Coffin–Manson model, taking into consideration the stress–strain field at the danger point and the influence of stress gradient effects [12,13,14,15].
However, the conventional method of stress gradients investigation defines the stress gradient influence range in terms of the radius of the notch root and subsequently defines the stress gradient correction factor, while neglecting the stress–strain distribution in the notch. The reason behind this is that different notch shapes of the same notch radius will result in different stress–strain fields at the root of the notch, and the range of the region that determines the stress gradient correction factor is bound to differ. A large number of studies [16,17,18] have corroborated that the fatigue life of notched parts is related to the stress gradient and stress–strain field near the root of the notch, so the stress gradient correction factor should be determined by the stress–strain field in a certain area of the root of the notch. Therefore, it is inconsequential to define the stress gradient correction factor by the radius of the notch, and the stress gradient correction factor should consider the stress–strain field distribution in the range near the root of the stress gap. At the same time, it has been shown that the high-stress gradient region has a significantly more significant effect on fatigue life [19], while the conventional fatigue models overlook the effect of different stress gradient regions on fatigue life.
In summary, the range of stress gradient influence and the high-stress region have a large impact on the fatigue life of structural components. However, there is a lack of an effective method to evaluate the fatigue life of components in engineering practice by considering the influence of both the range of stress gradient and the high-stress region. Therefore, in order to accurately assess the fatigue life of notched components, a new fatigue life prediction model based on the traditional model is established in this paper by incorporating the depth of stress gradient influence and the weight coefficient. In particular, four models are compared in Section 3, and the results show that the predicted life of the new model is better than that of the other 3 models.
2. Gradient Analysis Method Considering the Stress
Notched components and structural details, which include geometric configurations such as holes, fillets, chamfers, etc., are essential to satisfy various functions. In metal fatigue analysis, notch effects are an integral part of the reliability assessment of engineering structures. In terms of macro-micro damage, the irregular distribution of stresses and stress gradients affects crack sprouting, crack extension, and fatigue fracture phenomena in notched parts. Specifically, notches of different shapes will exhibit different stress–strain distributions under external loads. Therefore, the stress gradient in the damage zone is closely related to fatigue life. Initially, early fatigue analysis studies were always regarded as conservative in that the effect of stress gradients in the fatigue damage zone was neglected. To compensate for this, various notch fatigue analysis methods later introduced stress gradients to explain the notch effect [20,21]. Furthermore, many researchers have applied other parameters to characterize the effect of notch and size on fatigue strength, such as notch radius r, stress concentration factor Kt, fatigue notch factor Kf, high-stress volume Vh, etc. Although these characteristic parameters have been used in many applications, the key factor is the stress gradient over the fatigue damage zone, which derives from macro-micro damage analysis materials and damage mechanics. Notch fatigue failure is induced by uneven stress gradients in notched specimens, which contributes to crack sprouting, or even fatigue fracture. Therefore, attention should be paid to the effect of the stress gradient on the delayed expansion of fatigue cracks induced by overload.
In the first subsection of this paper, the causes of the stress gradient effect are analyzed at the macroscopic and microscopic levels, respectively, and a fatigue model centered on notch support is introduced. The second subsection presents a conventional fatigue life method focusing on the stress gradient. In the third subsection, the limitations of the conventional stress gradient fatigue life method are discussed, apart from which the notch stress–strain field is analyzed, the stress gradient influence depth is defined, and a weight function is added to characterize the contribution degree of the stress gradient. Notably, a new notch fatigue analysis method is also proposed in this section.
2.1. Stress Gradient Effect Review
At the macroscopic level, stress concentrations occur in the region of notches or other geometric discontinuities when the specimen is loaded. Geometrically induced stress concentrations result in a non-uniform stress field in the affected region, with the highest values usually occurring at the surface and decreasing from the surface to the interior. While the regions near the surface quickly reach yield strength and may therefore, develop plastic strain, the low-stress regions inside still support the structure, thus delaying the process of fatigue crack initiation and fatigue failure. At the microscopic level, as shown in Figure 1, the crack first starts in a grain at a free surface stress concentration site and then extends into the next grain. When the crack expands into some adjacent grains, the constraint on the slip displacement increases due to the influence of the adjacent grains, and the “grain boundary effect” appears in some materials. The “grain boundary effect” refers to the situation when the crack extension rate decreases as the crack tip approaches the grain boundary, and the crack nucleation always occurs within a few grains of the material, whereas the crack always extends inward along the danger point [22]. At the same time, fatigue cracking is hindered by nearby grains, which slow down the crack, thus affecting the fatigue damage evolution process at the danger point. This is the reason why the crack life of notched specimens under cyclic loading is higher than the predicted value of the maximum stress or strain [23].
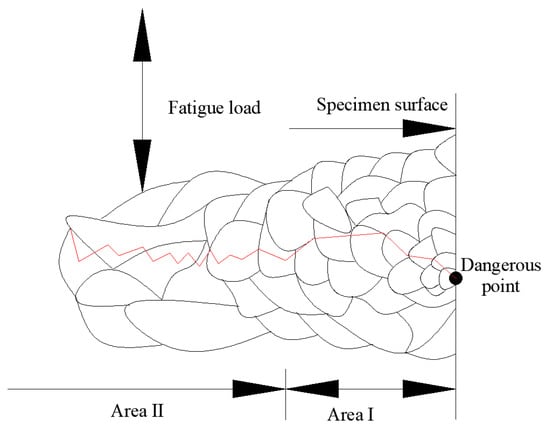
Figure 1.
Crack extension process.
Proposed in the 1950s [24,25], the classical stress gradient method establishes that the fatigue life of a member is influenced not only by the maximum stress, but also by the support factor so that the effective stress derived from the maximum stress and the support factor play a crucial role in fatigue life. The method is developed using the linear elastic stress analysis and is based on the calculation of the stress gradient at the root of the notch by the following:
With G* as the stress gradient at the root of the notch, and σ(x) as the distribution of stress along the x path. As shown in Figure 2, the maximum stress occurs at the point x = 0.
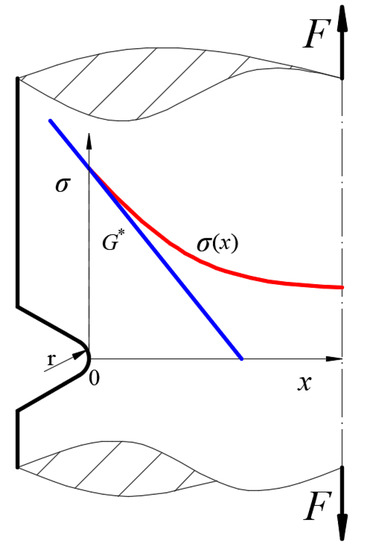
Figure 2.
Stress distribution of the notch.
The distribution of the stress gradient merely pertains to the shape of the notch, while the stress σ is linearly related to the load F. To eliminate the influence of load F on the stress gradient G and also to facilitate the comparison of stress gradients of notches of different shapes, the relative stress gradient χ is proposed, as shown in Equation (2).
In the model proposed by Mäde et al. [14], the introduction of the notch support factor model for fatigue life prediction considering Kt and Kf showed good performance, and the predicted fatigue life was in agreement with the experimental data. The notch support factor nχ = Kt/Kf = σmax/(Kf ·σns) can be obtained. nχ is adopted to describe the notch support effect in the form of 1 + A; A and kχ are material constants fitted experimentally, and the expression for the relative stress gradient of the notch χ* is:
By coupling Equation (3) with probabilistic size effect correction, Mäde et al. modified the Coffin–Manson equation [26] by taking into account the notch effect (Mäde’s model, for short), which has shown acceptable life predictions:
Nevertheless, apply the function nχ = 1 + A(χ*)kχ is never a one-size-fits-all solution for every case. Similar formulae should be appropriately applied to different materials. Moreover, since the Coffin–Manson equation consists of two terms, the elastic and plastic parameter terms, respectively, the Coffin–Manson equation is applicable to low-cycle, rather than high-cycle, fatigue, in which the elastic condition is dominant.
2.2. Stress Gradient and Average Stress Correction Method
The mean stress has shown a significant effect on both deformation and fatigue behaviors. According to the mean stress correction issue, a general mean stress correction model developed to estimate the fatigue life Nf under nonzero leads to the stress condition expression:
where σar denotes an equivalent fully reversed stress amplitude that leads to the same fatigue life under the combination (σa–σm) or a specified stress ratio R; σa and σm are the stress amplitude and mean stress, respectively; and C and α are material constants.
Moreover, Walker [27] (1970) introduced an exponential parameter γ into the product of maximum stress and stress amplitude as
The literature [28] compared four widely used models to evaluate the effect of average stress, and the Walker average stress life prediction model can obtain better life prediction accuracy because it contains an adjustable γ term (as shown in Equation (7)) which, combined with the Coffin–Manson equation, can be written as a paradigm (as shown in Equation (8)).
where Nw is the equivalent fully reversed fatigue life that is obtained from different stress ratios.
Based on the notched stress field distribution, Wang et al. [13] defined a stress gradient influence factor Y using the integration of the stress field distribution function and developed a fatigue life method for notched components considering the stress gradient sum, which achieved better results in the fatigue life prediction of TC4, as well as in the fatigue life prediction of turbine discs [12].
The defined stress gradient influence factor is shown in Figure 3.
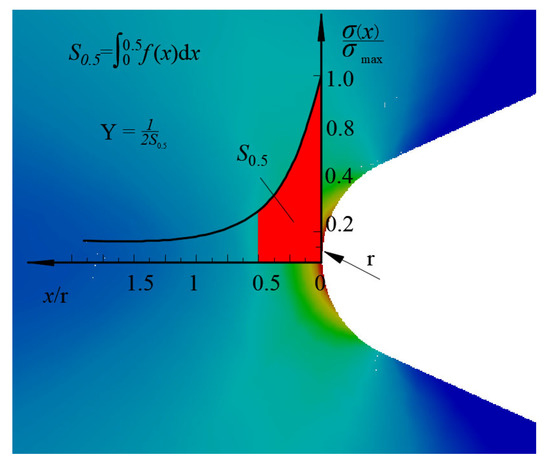
Figure 3.
Definition of stress gradient factor.
The literature [12] defines a stress gradient factor Y:
where f(x) is the stress normalization curve.
Taking into account the stress influence factor (referred to as the Wang model), the fatigue life correction equation is obtained by combining the Coffin–Manson equation, which shows the stress gradient correction in equation [29]:
where m is the stress gradient influence index, the relationship between the fatigue life and m is:
where A and B are material constants fitted by the experiments.
2.3. Formatting of Mathematical Components
In a notched fatigue life prediction model considering stress gradients, the stress gradient correction factor is usually determined by the stress–strain field in a certain region at the maximum stress point, which can be defined as the stress gradient influence range. In conventional models, this range is generally defined in terms of the radius r of the root of the notch. For the same notch shape, this definition follows the above rule. However, for the same notch radius and different notch shapes, the stress–strain field is bound to show different distributions. As shown in Figure 4, for the three typical notched specimens, the distribution of the relative stress gradient at the notch is compared in Figure 5 for the same notch radius (containing three cases with notch radii equal to 0.2 mm, 0.6 mm, and 1 mm). It can be seen from Figure 5 that when the range is defined as the radius of the root of the notch, the three notched specimens a, b, c the relative stress gradient distribution is somewhat different, and the stress gradient influence range of the three notched specimens must be different. As mentioned, it is not reasonable to use a geometric parameter, such as the notch radius r, to define the range. Therefore, the stress gradient correction factor should consider the stress–strain field distribution in the range near the maximum stress point.
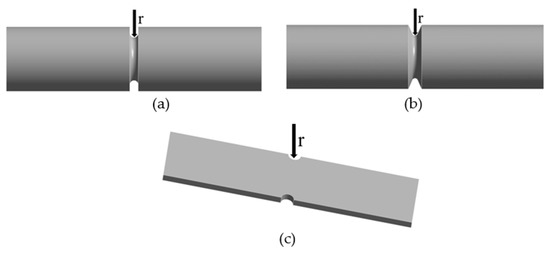
Figure 4.
Notched specimens (a) cylindrical specimen with a U-notch; (b) cylindrical specimen with a V-notch; (c) plate specimen with a U-notch.
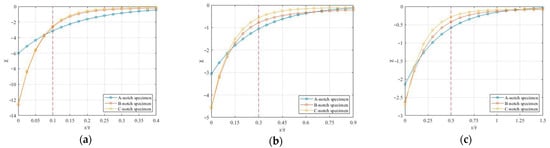
Figure 5.
Notched specimen relative stress gradient (a) r = 0.2 mm; (b) r = 0.6 mm; (c) r = 1 mm (elastic–plastic conditions).
The stress gradient effect arises because of the support of the low-stress region to the high-stress region. For a smooth specimen with stress distribution σ(x) ≡ σns and relative stress gradient distribution χ(x) ≡ 0, there is no gradient effect. Ideally, we can define the region Ω containing all relative stress gradients near the notch that are nonzero as the stress gradient influence range. However, even for the ideal semi-infinite plane, the range defined by a relative stress gradient equal to 0 is not achievable because the relative stress gradient cannot be taken to be 0 at any point. Moreover, if a critical relative stress gradient value is included to define the region, the model cannot be applied to smooth specimens or specimens with low maximum relative stress gradients (since their internal stress gradients tend to be 0). To solve this problem, this paper targets the point where the stress is equal to the nominal stress; to define the influence range, the region above the nominal stress is the influence range of the stress gradient Lχ, The schematic diagram is shown in Figure 6. For smooth specimens, the range is 0 because the stress in the cross-section is equal to the nominal stress everywhere, while for non-smooth specimens, the maximum stress is inevitably higher than the nominal stress, so there must be a stress point on its stress curve, as the nominal stress point is shown in the diagram. By this definition, the stress gradient correction model of any notched specimen can be represented by a model.
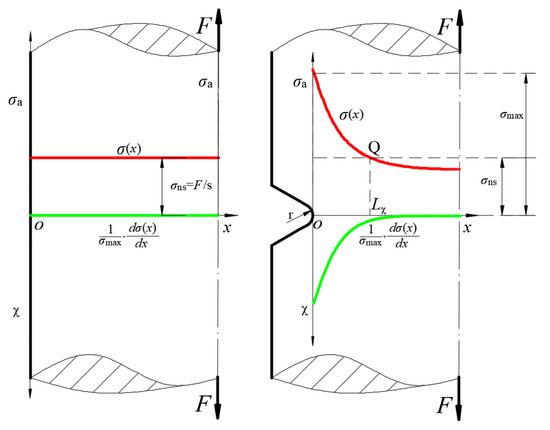
Figure 6.
Definition of the range of influence of the stress gradient.
From the perspective of the mechanism of fatigue damage, the accumulation of fatigue damage of the material does not take place at a certain point at the root of the notch, as shown in Figure 1. The accumulation of fatigue damage is not only related to the maximum stress–strain at the root of the notch, but also the stress–strain field. Different stress gradients at each location contribute differently to the onset of fatigue cracking. The weight function φ(x) physically characterizes the degree of contribution to the peak stress at any point. In general, the stress–strain concentration at the root of the notch is the most severe [30,31], while:
- (1)
- If φ(0) = 1, the maximum stress at the root of the notch has the greatest effect on the occurrence of fatigue cracking.
- (2)
- If 0 ≤ φ(x) ≤1, then φ(x) is a generalized monotonically decreasing function of x.
- (3)
- When the relative stress gradient χ = 0, φ(x) = 1, it means that for smooth or fully yielded specimens, the appearance of fatigue cracks is the same at all points in the damage zone.
For isotropic materials, the stress distribution is only related to the notch geometry; therefore, φ(x) is only related to the notch geometry. There are various specific forms regarding φ(x), and here, the following form is taken [11].
The stress gradient influence range Lχ is normalized to the x-axis, and a weight function φ(x) is introduced to characterize the degree of stress gradient contribution at each point by considering the corresponding stress gradient contribution; a redefined stress gradient influence factor Yχ is obtained, and its calculated expression is shown in Equations (15)–(18).
where g(x’) is the weight function normalized curve and fχ(x’) is the modified stress normalized curve.
Based on Wang’s model and Equation (12), a new fatigue model is obtained:
In this new model, mχ is the stress gradient influence index, and hence, the relationship between fatigue life and mχ is given by:
where H and D are the constants obtained by fitting the fatigue test data.
3. Model Validation and Comparison
3.1. Materials and Experiments
In this section, three experimental datasets for TC4 [32], GH4169 (650 °C) [29], and EN3B [33] are investigated with notched specimen schematics for the three materials corresponding to A, B, and C of Figure 7, respectively. The triple test is a stress-controlled uniaxial tensile test, and the criterion for fatigue life is the complete fracture of the material. Table 1 illustrates the detailed dimensions of the specimens used for preliminary evaluation of the modified model proposed in Equation (19) and the results of a comparison with the other three models [14,15,16]. In addition, special attention was paid to the coverage and completeness of the dataset selected for model validation. Specific fatigue test results for different stress ratios from room temperature to high-temperature, low circumference fatigue states were used for model validation, as follows. The material properties of the three experimental datasets according to the cyclic stress–strain relationship shown in the equation are shown in Table 2, and the fatigue test data are listed in Table 3, Table 4 and Table 5, which can be analyzed based on the original regression results in the literature.
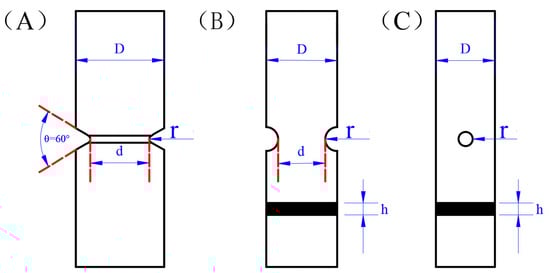
Figure 7.
Notched fatigue specimens ((A) TC11; (B) GH4169; (C) EN8B).

Table 1.
Notched specimen size parameters.
Table 2.
Material properties.
Table 3.
Fatigue test data of TC4 alloy under loadings, data from [32].
Table 4.
Fatigue test data of GH4169 alloy under loadings, data from [29].
Table 5.
Fatigue test data of EN3B alloy under loadings, data from [33].
3.2. Finite Element Analysis (FEA)
Because the finite element method is designed for deformed bodies with arbitrary complex geometries, its accurate mechanical information under the action of complex external forces is obtained completely, so ANSYS FE software is chosen to analyze the elasticity and plasticity of the notched specimen, a 6-sided mesh is selected, and the network at the notch is encrypted.
When loading the specimen, one end is fixed, while the load is applied to the other end. In order to analyze the iso-effectiveness distribution at the root of the notch, the notched specimen is cut along the working surface to give the iso-effectiveness distribution on the working surface. To extract the stress parameters, the path from the root of the notch to the center of specimen A was used as an example to extract the equipotential force values of this path, as shown in Figure 8. The root of the notch is the maximum stress point, i.e., the failure point.
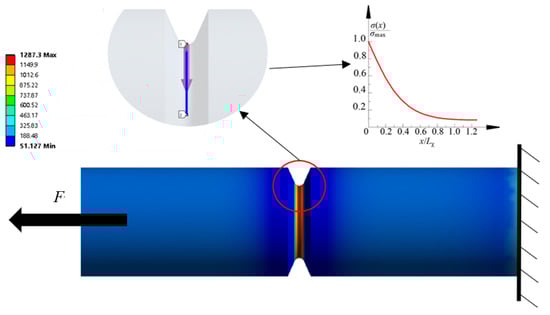
Figure 8.
Schematic diagram of stress gradient parameter extraction.
Based on the above analysis process, the extracted equivalent force distribution, with normalization, is shown in Figure 9.
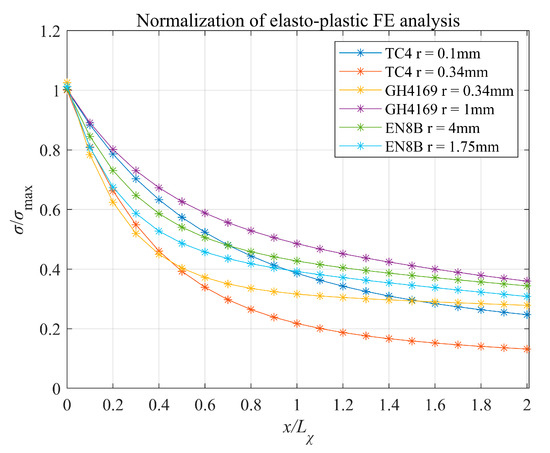
Figure 9.
Normalized stress gradient distribution.
The root of the notch can cause high stress gradients due to uneven stress distribution, resulting in plastic deformation in a certain area of the notch surface, which can affect the stress distribution at the notch. However, the area of plastic strain is small, most of the area is still in elastic strain, and the amount of plastic strain is small compared to the elastic strain, which is still the dominant strain. The difference between the stress distribution obtained by the elastic–plastic analysis and that obtained by the elastic analysis is small, so the effect of plastic strain on the modified stress gradient influence factor is negligible.
3.3. Model Calibration and Validation
In this paper, three fatigue models considering stress gradients, i.e., the Mäde [14], Wang [13], and Kμ [15] models, are compared with the proposed model, and its efficacy is validated. The comparison results are presented in Figure 10. Figure 10a represents the comparison between the tested lives and the predicted lives by using (a) Mäde’s model, (b) Wang’s model, (c) the Kμ model, and (d) the proposed model. The x-axis in the figure is the test value, the y-axis shows the predicted values, and the closer the data points are to the diagonal line, the better the predicted results are proved.
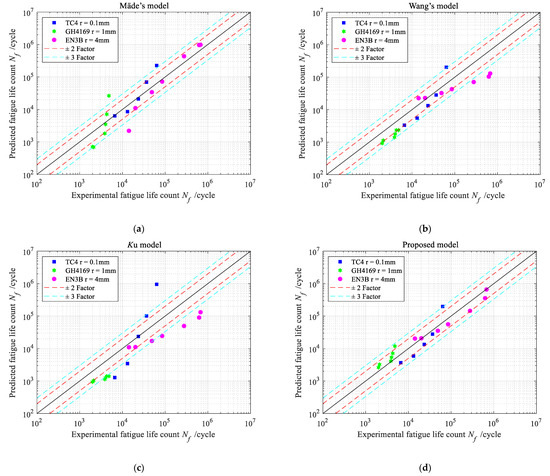
Figure 10.
A comparison between tested lives and predicted lives using (a) Mäde’s model, (b) Wang’s model, (c) the Ku model, and (d) the proposed model.
As can be seen from Figure 10, the newly proposed model (Figure 10d) shows good prediction accuracy, with the predicted values all within the two-fold dispersion band. The Mäde model (Figure 10a), the Wang model (Figure 10b), and the Kμ model (Figure 10c) also exhibit good prediction accuracy. Most of the predicted values are within the 3-fold dispersion band, but there are few points outside the 3-fold dispersion band.
Statistical methods are used to characterize the prediction errors of the 4 notch fatigue life prediction models and to quantitatively analyze their predictive capabilities. The strengths and weaknesses of the models can be judged visually by plotting the prediction error box line diagram, which is calculated as follows [34]:
With Perror as the standard prediction error, Nf,p as the predicted lifetime, and Nf,e as the experimental lifetime.
The prediction results of the four models are plotted as probability error box line plots, as shown in Figure 11. In the probability error box, the horizontal line represents the median, the height of the box represents the size of the standard deviation, and the data points with “+” represent the outliers in the sample data, respectively. If the data in the box is closer to zero, it indicates that the model has better prediction accuracy and reliability.
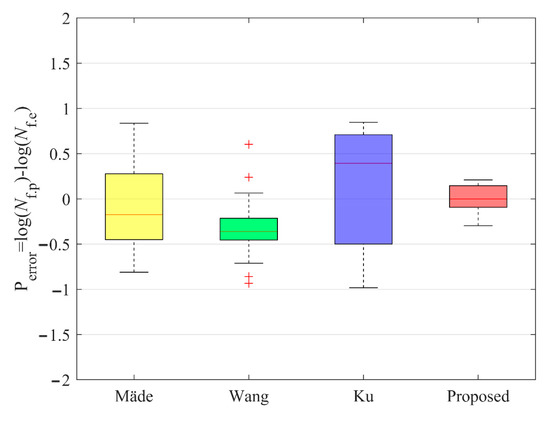
Figure 11.
Box plot of model prediction errors.
Figure 11 shows that the prediction error of the new fatigue model is small, and its mean, standard deviation, and maximum/minimum values are relatively close to zero. This indicates that the mean prediction error of the new fatigue model is small, and the prediction accuracy is good. By contrast, the mean, standard deviation, and maximum/minimum values of Mäde’s model, Wang’s model, and the Kμ model are all larger than zero, which indicates that the prediction error is larger and more dispersed. In summary, the quantitative analysis of the prediction errors of the four models by statistical methods showed that the new models have high prediction accuracy and small prediction errors, the “+” in the graph indicates an outlier.
4. Conclusions
In this paper, based on the traditional stress gradient fatigue model, considering the problems of the traditional model, a new fatigue life prediction model for notched parts is established by analyzing the distribution of the stress–strain field at the root of the notch, defining the depth of the stress gradient influence, and considering the degree of contribution of the stress gradient at each point; the main research results are as follows.
- In the notch fatigue life prediction model considering stress gradient, the stress gradient correction factor is determined by the stress–strain field in the range near the root point of the notch. The notch of different shapes will show different stress–strain distribution under external load, when the radius of the notch root of the specimen is the same, the range to determine the stress gradient correction factor will be different, so it is not reasonable for the traditional fatigue model to determine the stress gradient correction factor by the radius of the notch root.
- The stress–strain field of the notched specimen was analyzed and the depth of stress gradient influence was defined. Considering that the relative stress gradient at each point is different, which means that the stress gradient at different points in the fatigue damage process has different effects on the fatigue damage, a weight function φ(x) is introduced to characterize the degree of contribution of the stress gradient at each point. A new stress gradient influence factor is obtained. Finally, a new fatigue life prediction model for notched components is developed by combining it with the Coffin–Manson equation.
- The comparative analysis of the prediction results with the experimental results shows that the new proposed model has a high prediction accuracy, with most points located in the binary dispersion region, confirming the poor prediction accuracy of the Mäde, Wang, and Kμ models. Statistical analysis shows that among the average prediction errors of the four models, the new model has the smallest dispersion, and the prediction results are relatively stable, while the prediction results of the Mäde, Wang, and Kμ models show a large dispersion.
Author Contributions
Y.T.: Conceptualization, Data curation, Methodology, Validation, Writing-original draft; Y.S.: Conceptualization, Funding acquisition, Methodology, Writing-reviewand editing; G.Y.: Funding acquisition, Validation; Y.N.: Formal analysis, Validation. All authors have read and agreed to the published version of the manuscript.
Funding
Sichuan Science and Technology Program (20826041D4254).
Institutional Review Board Statement
Not applicable.
Informed Consent Statement
Not applicable.
Data Availability Statement
Not applicable.
Conflicts of Interest
The authors declare no conflict of interest.
Nomenclature
| r | notch radius |
| Kt | stress concentration factor |
| Kf | fatigue notch factor |
| Vh | high stress volume |
| G* | notch root stress gradient |
| σ(x) | stress distribution curve |
| χ | relative stress gradient |
| σmax | maximum stress |
| nx | notch support factor |
| χ* | relative stress gradient of the notch χ* |
| σns | nominal stress |
| εa(x) | strain distribution curve |
| σ’f | fatigue strength coefficient |
| ε’f | fatigue ductility coefficient |
| b | fatigue strength exponent |
| c | fatigue ductility exponent |
| Nf | number of cycles to failure |
| σar | equivalent fully reversed stress amplitude |
| σa | stress amplitude |
| σm | mean stress |
| R | stress ratio |
| γ | Walker equation paramete |
| Nw | equivalent fully reversed fatigue life |
| Y | stress gradient influence factor |
| f(x′) | normalized stress curve |
| S0.5 | area enclosed by the normalized curve |
| m | stress gradient impact index |
| Lχ | stress gradient impact depth |
| φ(x) | weighting factor |
| g(x′) | normalized weight coefficient |
| fχ(x′) | modified normalized curve |
| Sχ | area enclosed by the modified normalized curve |
| Yχ | modified stress gradient impact factor |
| mχ | modified stress gradient impact index |
| E | modulus of elasticity |
| ν | Poisson’s ratio |
| σb | yield strength |
| Perror | standard prediction error |
| Nf,p | predicted lifetime |
| Nf,e | experimental lifetime. |
References
- Niu, X.; Zhu, S.-P.; He, J.-C.; Liao, D.; Correia, J.A.; Berto, F.; Wang, Q. Defect tolerant fatigue assessment of AM materials: Size effect and probabilistic prospects. Int. J. Fatigue 2022, 160, 106884. [Google Scholar] [CrossRef]
- Branco, R.; Costa, J.; Berto, F.; Antunes, F. Fatigue life assessment of notched round bars under multiaxial loading based on the total strain energy density approach. Theor. Appl. Fract. Mech. 2018, 97, 340–348. [Google Scholar] [CrossRef]
- Leitner, M.; Vormwald, M.; Remes, H. Statistical size effect on multiaxial fatigue strength of notched steel components. Int. J. Fatigue 2017, 104, 322–333. [Google Scholar] [CrossRef]
- Liao, D.; Zhu, S.; Correia, J.A.; De Jesus, A.M.; Berto, F. Recent advances on notch effects in metal fatigue: A review. Fatigue Fract. Eng. Mater. Struct. 2020, 43, 637–659. [Google Scholar] [CrossRef]
- Filippini, M. Stress gradient calculations at notches. Int. J. Fatigue 2000, 22, 397–409. [Google Scholar] [CrossRef]
- Taylor, D. Geometrical effects in fatigue: A unifying theoretical model. Int. J. Fatigue 1999, 21, 413–420. [Google Scholar] [CrossRef]
- Tanaka, K. Engineering formulae for fatigue strength reduction due to crack-like notches. Int. J. Fract. 1983, 22, R39–R46. [Google Scholar] [CrossRef]
- Adib-Ramezani, H.; Jeong, J. Advanced volumetric method for fatigue life prediction using stress gradient effects at notch roots. Comput. Mater. Sci. 2007, 39, 649–663. [Google Scholar] [CrossRef]
- Yao, W.; Xia, K.; Gu, Y. On the fatigue notch factor, Kf. Int. J. Fatigue 1995, 17, 245–251. [Google Scholar] [CrossRef]
- Liao, D.; Zhu, S.-P.; Qian, G. Multiaxial fatigue analysis of notched components using combined critical plane and critical distance approach. Int. J. Mech. Sci. 2019, 160, 38–50. [Google Scholar] [CrossRef]
- Wang, R.; Liu, H.; Hu, D.; Li, D.; Mao, J. Evaluation of notch size effect on LCF life of TA19 specimens based on the stress gradient modified critical distance method. Fatigue Fract. Eng. Mater. Struct. 2018, 41, 1794–1809. [Google Scholar] [CrossRef]
- Shi, L.; Wei, D.S.; Wang, Y.R. Fatigue life prediction of turbine disk based on stress gradient. J. Aerosp. Power 2013, 28, 1236–1242. [Google Scholar]
- Wang, Y.R.; Li, H.X.; Yuan, S.H.; Wei, D.S.; Shi, L. Method for notched fatigue life prediction with stress gradient. J. Aerosp. Power 2013, 28, 1208–1214. [Google Scholar]
- Mäde, L.; Schmitz, S.; Gottschalk, H.; Beck, T. Combined notch and size effect modeling in a local probabilistic approach for LCF. Comput. Mater. Sci. 2018, 142, 377–388. [Google Scholar] [CrossRef]
- Zhao, H.; Liu, J.; Hua, F.; Ran, Y.; Zi, R.; Li, B. Multiaxial fatigue life prediction model considering stress gradient and size effect. Int. J. Press. Vessel. Pip. 2022, 199, 106884. [Google Scholar] [CrossRef]
- Zhong, B.; Wang, Y.; Wei, D.; Zhang, K.; Wang, J. Multiaxial fatigue life prediction for powder metallurgy superalloy FGH96 based on stress gradient effect. Int. J. Fatigue 2018, 109, 26–36. [Google Scholar] [CrossRef]
- Furushima, T.; Manabe, K.-I.; Alexandrov, S. Size effects on free surface roughening and necking behavior of metal thin sheets using inhomogeneous finite element material model. AIP Conf. Proc. 2013, 1567, 460–463. [Google Scholar] [CrossRef]
- Lin, Y.; Jiang, X.-Y.; Shuai, C.-J.; Zhao, C.-Y.; He, D.-G.; Chen, M.-S.; Chen, C. Effects of initial microstructures on hot tensile deformation behaviors and fracture characteristics of Ti-6Al-4V alloy. Mater. Sci. Eng. A 2018, 711, 293–302. [Google Scholar] [CrossRef]
- Shang, D.G.; Wang, D.K.; Li, M.; Yao, W.X. Method of local stress-strain fieid intensity for random fatigue life prediction. Chin. J. Mech. Eng. 2002, 38, 67–70. [Google Scholar] [CrossRef]
- Gates, N.; Fatemi, A. Notch deformation and stress gradient effects in multiaxial fatigue. Theor. Appl. Fract. Mech. 2016, 84, 3–25. [Google Scholar] [CrossRef]
- Mei, J.; Xing, S.; Vasu, A.; Chung, J.; Desai, R.; Dong, P. The fatigue limit prediction of notched components–A critical review and modified stress gradient based approach. Int. J. Fatigue 2020, 135, 105531. [Google Scholar] [CrossRef]
- Zhou, J. Fatigue Life and Reliability Analysis of Aero-Angine Turbine Blades. Ph.D. Thesis, University of Electronic Science and Technology of China, Chengdu, China, 2019. [Google Scholar]
- Zhu, S.-P.; Ye, W.-L.; Correia, J.A.; Jesus, A.M.; Wang, Q. Stress gradient effect in metal fatigue: Review and solutions. Theor. Appl. Fract. Mech. 2022, 121, 103513. [Google Scholar] [CrossRef]
- Bollenrath, F.; Troost, A. Wechselbeziehungen zwischen Spannungs- und Verformungsgradient. Arch. Für Das Eisenhüttenwesen 1950, 21, 431–436. [Google Scholar] [CrossRef]
- Peterson, R.E. Notch sensitivity. In Metal Fatigue; Sines, G., Waisman, J.L., Eds.; McGraw-Hill: New York, NY, USA, 1959; pp. 293–306. [Google Scholar]
- Manson, S.S. Fatigue: A complex subject—Some simple approximations. Exp. Mech. 1965, 5, 193–226. [Google Scholar] [CrossRef]
- Forman, R.G.; Kearney, V.E.; Series Engle, R.M., Jr. Cracks, A Fortran IV Digital Computer Program for Crack Propagation Analysis; AFFDL0TR-70-107; Air Force Flight Dynamics Laboratory: Wright Patterson AFB, Dayton, OH, USA, 1970. [Google Scholar]
- Dowling, N.E. Mean Stress Effects in Stress-Life and Strain-Life Fatigue. SAE Tech. Pap. 2004, 32, 1004–1019. [Google Scholar] [CrossRef]
- Wang, J.L.; Wei, D.S.; Wang, Y.R.; Zhong, B. High-temperature LCF life estimation based on stress gradient effect of notched GH4169 alloy specimens. Fatigue Fract. Eng. Mater. Struct. 2017, 40, 1640–1651. [Google Scholar] [CrossRef]
- Shang, D.; Wang, D.; Li, M.; Yao, W. Local stress–strain field intensity approach to fatigue life prediction under random cyclic loading. Int. J. Fatigue. 2001, 23, 903–910. [Google Scholar] [CrossRef]
- Zeng, Y.; Li, M.; Zhou, Y.; Li, N. Development of a new method for estimating the fatigue life of notched specimens based on stress field intensity. Theor. Appl. Fract. Mech. 2019, 104, 102339. [Google Scholar] [CrossRef]
- Liao, D.; Zhu, S.-P.; Correia, J.A.; De Jesus, A.M.; Calçada, R. Computational framework for multiaxial fatigue life prediction of compressor discs considering notch effects. Eng. Fract. Mech. 2018, 202, 423–435. [Google Scholar] [CrossRef]
- Susmel, L.; Taylor, D. An Elasto-Plastic Reformulation of the Theory of Critical Distances to Estimate Lifetime of Notched Components Failing in the Low/Medium-Cycle Fatigue Regime. J. Eng. Mater. Technol. 2010, 132, 021002. [Google Scholar] [CrossRef]
- Gan, L.; Wu, H.; Zhong, Z. Use of an energy-based/critical plane model to assess fatigue life under low-cycle multiaxial cycles. Fatigue Fract. Eng. Mater. Struct. 2019, 42, 2694–2708. [Google Scholar] [CrossRef]


Disclaimer/Publisher’s Note: The statements, opinions and data contained in all publications are solely those of the individual author(s) and contributor(s) and not of MDPI and/or the editor(s). MDPI and/or the editor(s) disclaim responsibility for any injury to people or property resulting from any ideas, methods, instructions or products referred to in the content. |
© 2023 by the authors. Licensee MDPI, Basel, Switzerland. This article is an open access article distributed under the terms and conditions of the Creative Commons Attribution (CC BY) license (https://creativecommons.org/licenses/by/4.0/).