Review

In Situ Observation of Solidification and Crystallization of Low-Alloy Steels: A Review

1
Key Laboratory for Ferrous Metallurgy and Resources Utilization of Ministry of Education & Hubei Provincial Key Laboratory for New Processes of Ironmaking and Steelmaking, Wuhan University of Science and Technology, Wuhan 430081, China
2
KTH Royal Institute of Technology, Department of Materials Science and Engineering, Brinellvägen 23, SE-100 44 Stockholm, Sweden
3
Key Laboratory of Electromagnetic Processing of Materials (Ministry of Education), School of Metallurgy, Northeastern University, Shenyang 110819, China
*
Author to whom correspondence should be addressed.
Metals 2023, 13(3), 517; https://doi.org/10.3390/met13030517
Submission received: 31 December 2022 / Revised: 1 March 2023 / Accepted: 2 March 2023 / Published: 3 March 2023
(This article belongs to the Special Issue Advances in High-Strength Low-Alloy Steels)

Abstract

:
Crystallization during the solidification process of steels is of vital importance for controlling the quality of final products. This paper summarizes the in situ characterization research activities of crystallization behaviors of low-alloy steels during the solidification process. The results obtained using high-temperature confocal laser scanning microscope (HT-CLSM) are critically reviewed, and other relevant methodologies, i.e., either classical method using differential scanning calorimetry (DSC) or large-scale facility (LSF), are also briefly mentioned. The evolution of the crystallization front from a planar to a cellular and further to a dendritic one, and subsequential microstructure evolutions, i.e., delta-ferrite (δ) formation from the liquid, austenite (γ) transformation and decomposition, are mainly discussed. The current review aims to highlight the state-of-the-art research outputs obtained by the novel in situ characterization techniques, and the obtained knowledge aims to shed light on the further development of the quality low-alloy steel products by controlling the processing and structure correlation.

1. Introduction

Crystallization during solidification is a process where the metallic atoms are transferred from the disordered liquid state to the more ordered solid state. It is also known that the crystallization rate is controlled by thermodynamics and mainly kinetics. These mechanisms could provide information regarding the movements of the atoms during the rearrangement [1,2]. During the crystallization of liquid metals, a variety of different morphologies could be observed, and the most frequently found structures are different types of dendrites. It is known that dendrites are tree-like structures of crystals growing as the liquid metal solidifies, with the shape produced by faster growth along energetically favorable crystallographic directions [3]. However, faceted crystals with different morphologies are also commonly seen, and a transition between faceted crystals and dendritic ones could also be observed.
In order to investigate the crystallization process associated with the microstructure evolution in metallic materials, in situ experimental studies are needed, since these types of measurements can provide ‘real-time’ information for the crystallization and microstructure evolution. Firstly, thermal analysis, i.e., differential thermal analysis (DTA) and/or differential scanning calorimetry (DSC) [4,5,6,7], are classical methods to determine the evolution of the temperature of crystallization, latent heat and/or specific heat during the cooling from the liquid. Exact examples of DSC analysis for low-alloy steels can be seen in Ref. [7]. DTA/DSC is a direct and effective method to detect the crystallization from the liquid; however, this method does not provide direct microstructure information corresponding to different solidification conditions, so the post-characterization of the solidified samples is needed. However, the post-microstructure analysis of the samples after rapid quenching sometimes cannot be identical to the ‘real-time’ process directly. According to this limitation, high-temperature confocal laser scanning microscope (HT-CLSM), also sometimes termed laser-scanning confocal microscope (LSCM), was established by Shibata and Emi [8] over two decades ago. It is an in situ observation device of phase evolution including crystallization in metals and silicates, utilizing an infra-red (IR) halogen heating lamp onto the surface of samples.
In their pioneering research paper, Shibata, Emi and co-workers utilized HT-CLSM to directly observe the growth and morphology evolution of crystals (planar to cellular, cellular to dendritic) in Fe-C binary melt [9], microstructure evolution during solidification (liquid (L) to delta-ferrite (δ), and δ to austenite (γ)) during solidification [10,11,12], inclusion agglomeration in the melt and its motion at the liquid/solid interface [13,14,15], heat transfer and crystallization process of continuous casting mold flux [16,17], etc. Subsequently, Dippenaar and co-workers [18,19,20,21,22,23,24,25,26,27,28] made major contributions to the in situ characterizations of crystallization as well as microstructure evolution (e.g., Widmanstätten ferrite transformation) in iron-based alloys; in particular, they developed a so-called concentric solidification methodology. For this method, the formation of the meniscus could be eliminated and the large area of observation is available at a high-resolution level by HT-CLSM [19,27,28]. In recent years, various research efforts have been made to investigate the inclusion motion behaviors in liquid steels [29,30,31,32], oxide dissolution in the steelmaking slags [33,34,35,36], mold flux crystallization [37,38,39,40], oxidation of steel surface [41,42], etc. Especially oxide metallurgy [43,44,45,46], a novel solution to utilize the fine inclusion to improve the mechanical properties of heat-affected zone of low-alloy steels weldment, has utilized HT-CLSM [47,48,49,50,51,52,53,54] and its combinational methodologies (e.g., CLSM + DSC [55], CLSM+ synchrotron high energy X-ray diffraction (SHEXRD) [56,57], etc.) to performed comprehensively parametric kinetic studies to understand the influences of inclusion composition, size, alloying elements, grain size, cooling rate, etc. on intragranular acicular ferrite formation. In addition, Pistorius and co-workers [58,59] have investigated the mass transfer and temperature distribution in HT-CLSM samples. Besides the steel research activities, the HT-CLSM technique has also investigated the incipient melting phenomenon between metallic cluster and the matrix of various Al-alloys [60,61,62], martensite formation in high entropy alloys during cooling [63], solidification behavior in undercooled Pd-Cu-Ni-P alloy [64], inclusion formation in Ni-Ti alloy [65], crystallization of synthetic coal-petcoke slag mixtures [66], etc. However, these activities of other materials are not the focus of this review paper.
The primary aim of this work is to summarize the application of the HT-CLSM technique to investigate the crystallization behavior of low-alloy steels during the solidification process, although other related research issues are also mentioned. Specifically, in Section 2, HT-CLSM instrumentation information and the particular design used for casting and solidification research are briefly described. In Section 3, in situ observation research activities of morphology transition between planar, cellular and dendritic crystals are summarized. Furthermore, the microstructure evolution between δ and γ related to the peritectic reaction will be critically discussed, based on the HT-CLSM findings. In addition, the subsequent γ to α transformation will be briefly discussed. In Section 4, the focus moving to the other characterization techniques other than HT-CLSM, e.g., the classical method using DTA/DSC, and the state-of-the-art method using electromagnetic levitation will be concisely summarized, while pros and cons of different methodologies will be provided. This paper aims to summarize the metallurgical and methodology knowledge regarding the in-situ characterization of the solidification process of low-alloy steels from open literatures, mainly published in the most recent two decades. This overview is believed to contribute to the further development of crystallization research in high-performance metallic materials, considering both material science and experimental methodology perspectives.

2. Brief Description of Experimental Apparatus for In Situ Characterization

2.1. Instrumentation of a High-Temperature Confocal Laser Scanning Microscope

High-temperature confocal laser scanning microscopy (HT-CLSM) is an in situ direct observation device for crystallization, solidification and phase transformation at high temperatures for materials, e.g., metals, ceramics including slag and flux, etc. The prepared sample is positioned in a crucible which is placed on s holding plate where a thermocouple is attached. The sample can be heated by utilizing a halogen infrared heating lamp, and it is placed at the focal point of the infrared beam, which is reflected by the gold coating ellipsoidal chamber. The image of the sample surface could be detected due to the contrast difference obtained from the He-Ne scanning laser beam. It normally has a power of about 1.5 mW, in the red, blue and violet wavelength range. Subsequently, the image can be constructed in a three-dimensional plot with a small Z-direction depth. The actual image of this facility as well as the working principle is shown in Figure 1. Detailed descriptions of instrumentation and working principle can be found in Refs. [29,67,68].
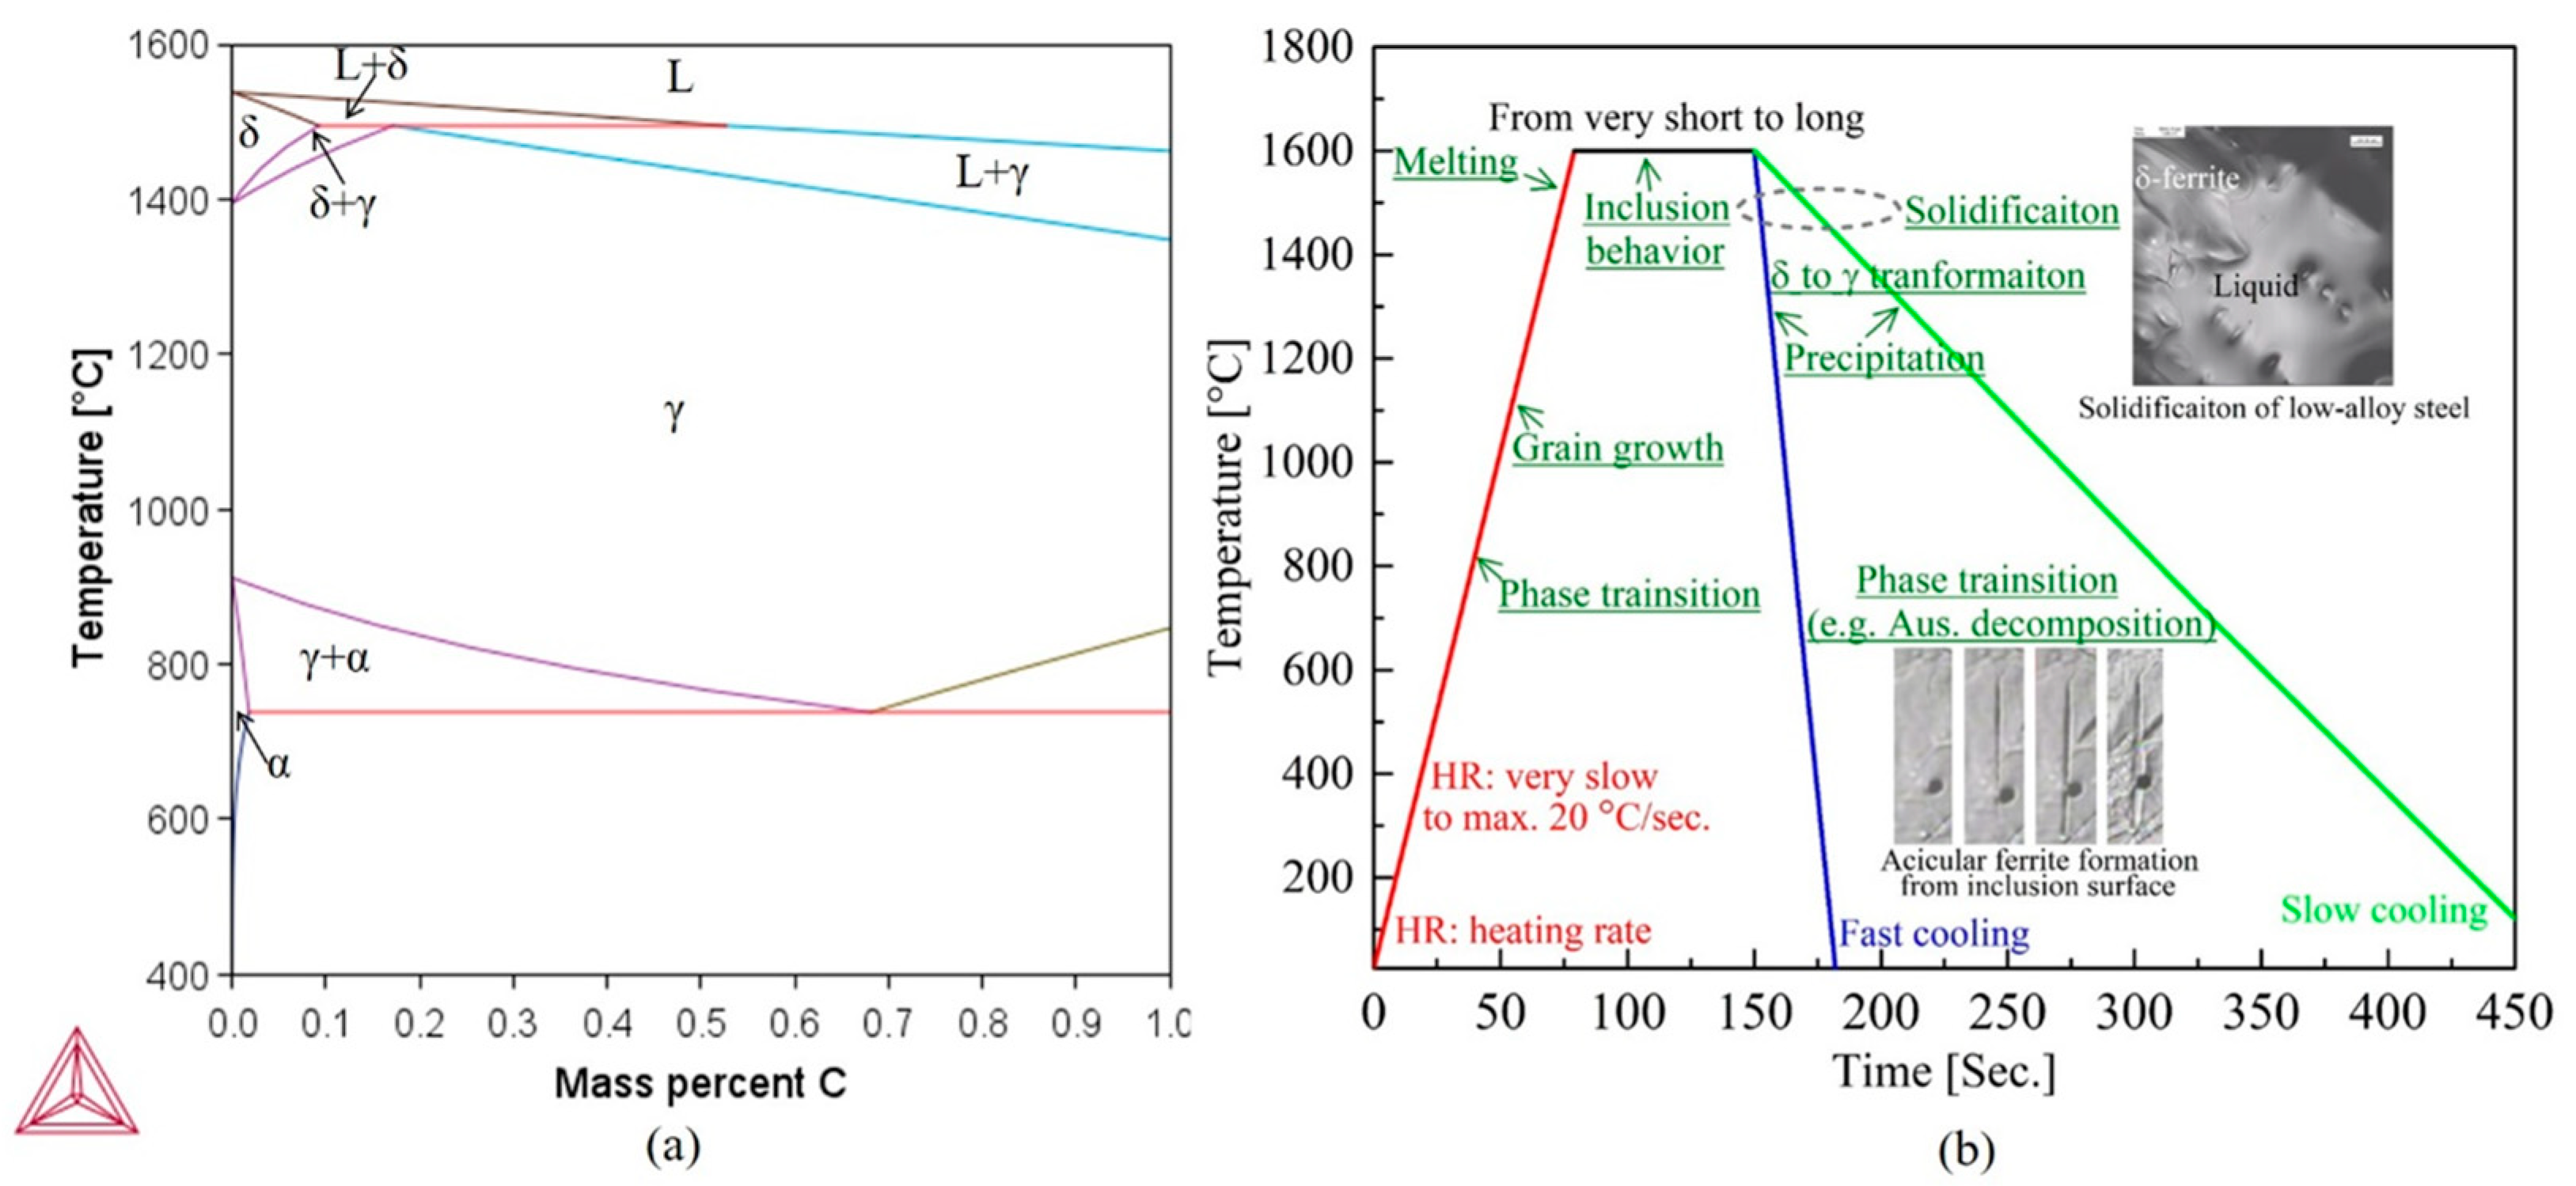
Reid et al. [19] firstly reviewed the development history of HT-CSLM and made a detailed description of the advantages and limitations of HT-CSLM by comparing it with other established techniques to study the microstructural development at high temperatures, such as X-ray transmission experimental techniques, directional solidification studies, high temperature transmission electron microscopy and thermionic transmission microscopy. To the authors’ best knowledge, HT-CLSM can achieve a maximum temperature as high as 1700 °C (1973 K) in principle, and provide a heat rate up to approximately 20 °C/s (1200 °C/min). Rapid cooling is also available at a certain high temperature range (mainly liquid and solidification temperature) with a maximum rate of 50 °C/s (3000 °C/min) by injecting the He gas into the chamber. According to these capabilities, HT-CLSM can be utilized in quite comprehensive applications in different issues in metallurgy. According to the Fe-C binary phase diagram calculated by Thermo-Calc 2022b [69] with TCFE12 database [70] and presented in Figure 2a, a schematic illustration of heat and cooling rates could achieve and the potential application field at each temperature range using HT-CLSM is presented in Figure 2b. Considering low-carbon low-alloy steel grade, transformations from α to γ, and subsequently, γ to δ could be observed during heating, no matter whether slow or fast heating, and finally, the melting (including incenting) will be observed. The holding time could vary at any temperature due to different research aims. For instance, if holding at the austenitization temperature range, e.g., 950 to 1200 °C, grain growth kinetics could be investigated; holding at the liquid temperature (normally 1550 to 1600 °C for low-alloy steels) could observe inclusion motion behaviors, etc. Furthermore, the cooling process is another important step using HT-CLSM, and the chamber could be cooled from very slow to relatively fast. Figure 2b shows a slow cooling curve of 5 °C/s (green line) and a fast cooling curve of 50 °C/s (blue line) as the representative values. However, the real case is not limited to this range. Solidification occurs from the finishing of liquidus temperature, so a temperature range between approximately 1500 to 1400 °C is of high interest for crystallization research. When the temperature moves to a lower range, δ to γ transformation as well as precipitate (TiN, MnS, etc.) nucleation occurs at relatively high temperature ranges, normally between 1450 and 1200 °C; finally, the austenite decomposition referring to different types of α-ferrite formation could be observed. In summary, HT-CLSM could provide a full temperature range for different aims of steel research, the following content focuses on the crystallization and microstructure of low-alloy steels during solidification.

2.2. Special Design of Instrumentation for Solidification Research

2.2.1. Concentric Solidification Technique

In the conventional HT-CLSM technique, observation of crystallization behaviors in the high-temperature melt is one of the vital application fields [10,11,12]. However, a meniscus on the sample surface will form due to the liquid phase in contact with solid materials, the crucible walls and the gas atmosphere (mainly Ar). Thus, the presence of it leads to difficulty to identify the interface between crystalline and the melt. The meniscus in particular occurs in the early stage of solidification and limits the observation resolution of the solid and liquid interface. In order to overcome this problem, a concentric solidification technique has been developed by Dippenaar and co-workers [19,71]. For this technique, a large-sized specimen (10 mm in diameter) with a thin thickness (250 μm) is one of the key parameters. A schematic illustration of overviewing this technique is presented in Figure 3. According to Griesser and Dippenaar [71], the focal point radius of maximum temperature was approximately 1 mm. In this case, a radial thermal gradient could be applied to this large and thin specimen surface, and careful control of the specimen geometry, heating rate and maximum temperature could allow us to form a liquid pool only in the center of the specimen; in this case, the crystallization at the liquid/solid interface during the solidification could be observed clearly. A comparison of the in situ observation images using the conventional HT-CLSM method influenced by the meniscus on the resolution as well as using the concentric solidification technique has been presented in Ref. [19]. Since the specimen is very thin, the observation of crystallization can be considered as the representative of bulk materials but not only the surface phenomenon. It is very important to use a very thin specimen (e.g., no more than 250 μm [19,71]) to stabilize the melting pool in the thicker specimen. Practically, we tried to use a bit thicker sample to create this type of melting pool, which could occasionally be successful; however, the stability of the ‘pool’ is not good, and easily collapses by increasing the maximum temperature. This is due to the fact that the formation of the ‘pool’ is related to the thermal distribution of specimens in different dimensions [18]. With the increase of specimen thickness, conductive heat flow from the center to the edge could be increased; thus, this could prevent the formation of a thermal gradient [19]. Furthermore, a few modifications for this technique have been continuously made. For instance, an automatic video processing software (SolTrack [72]) has been developed to automatically determine the fractions of different microstructures during solidification. The reproducibility of this method has also been verified [71].
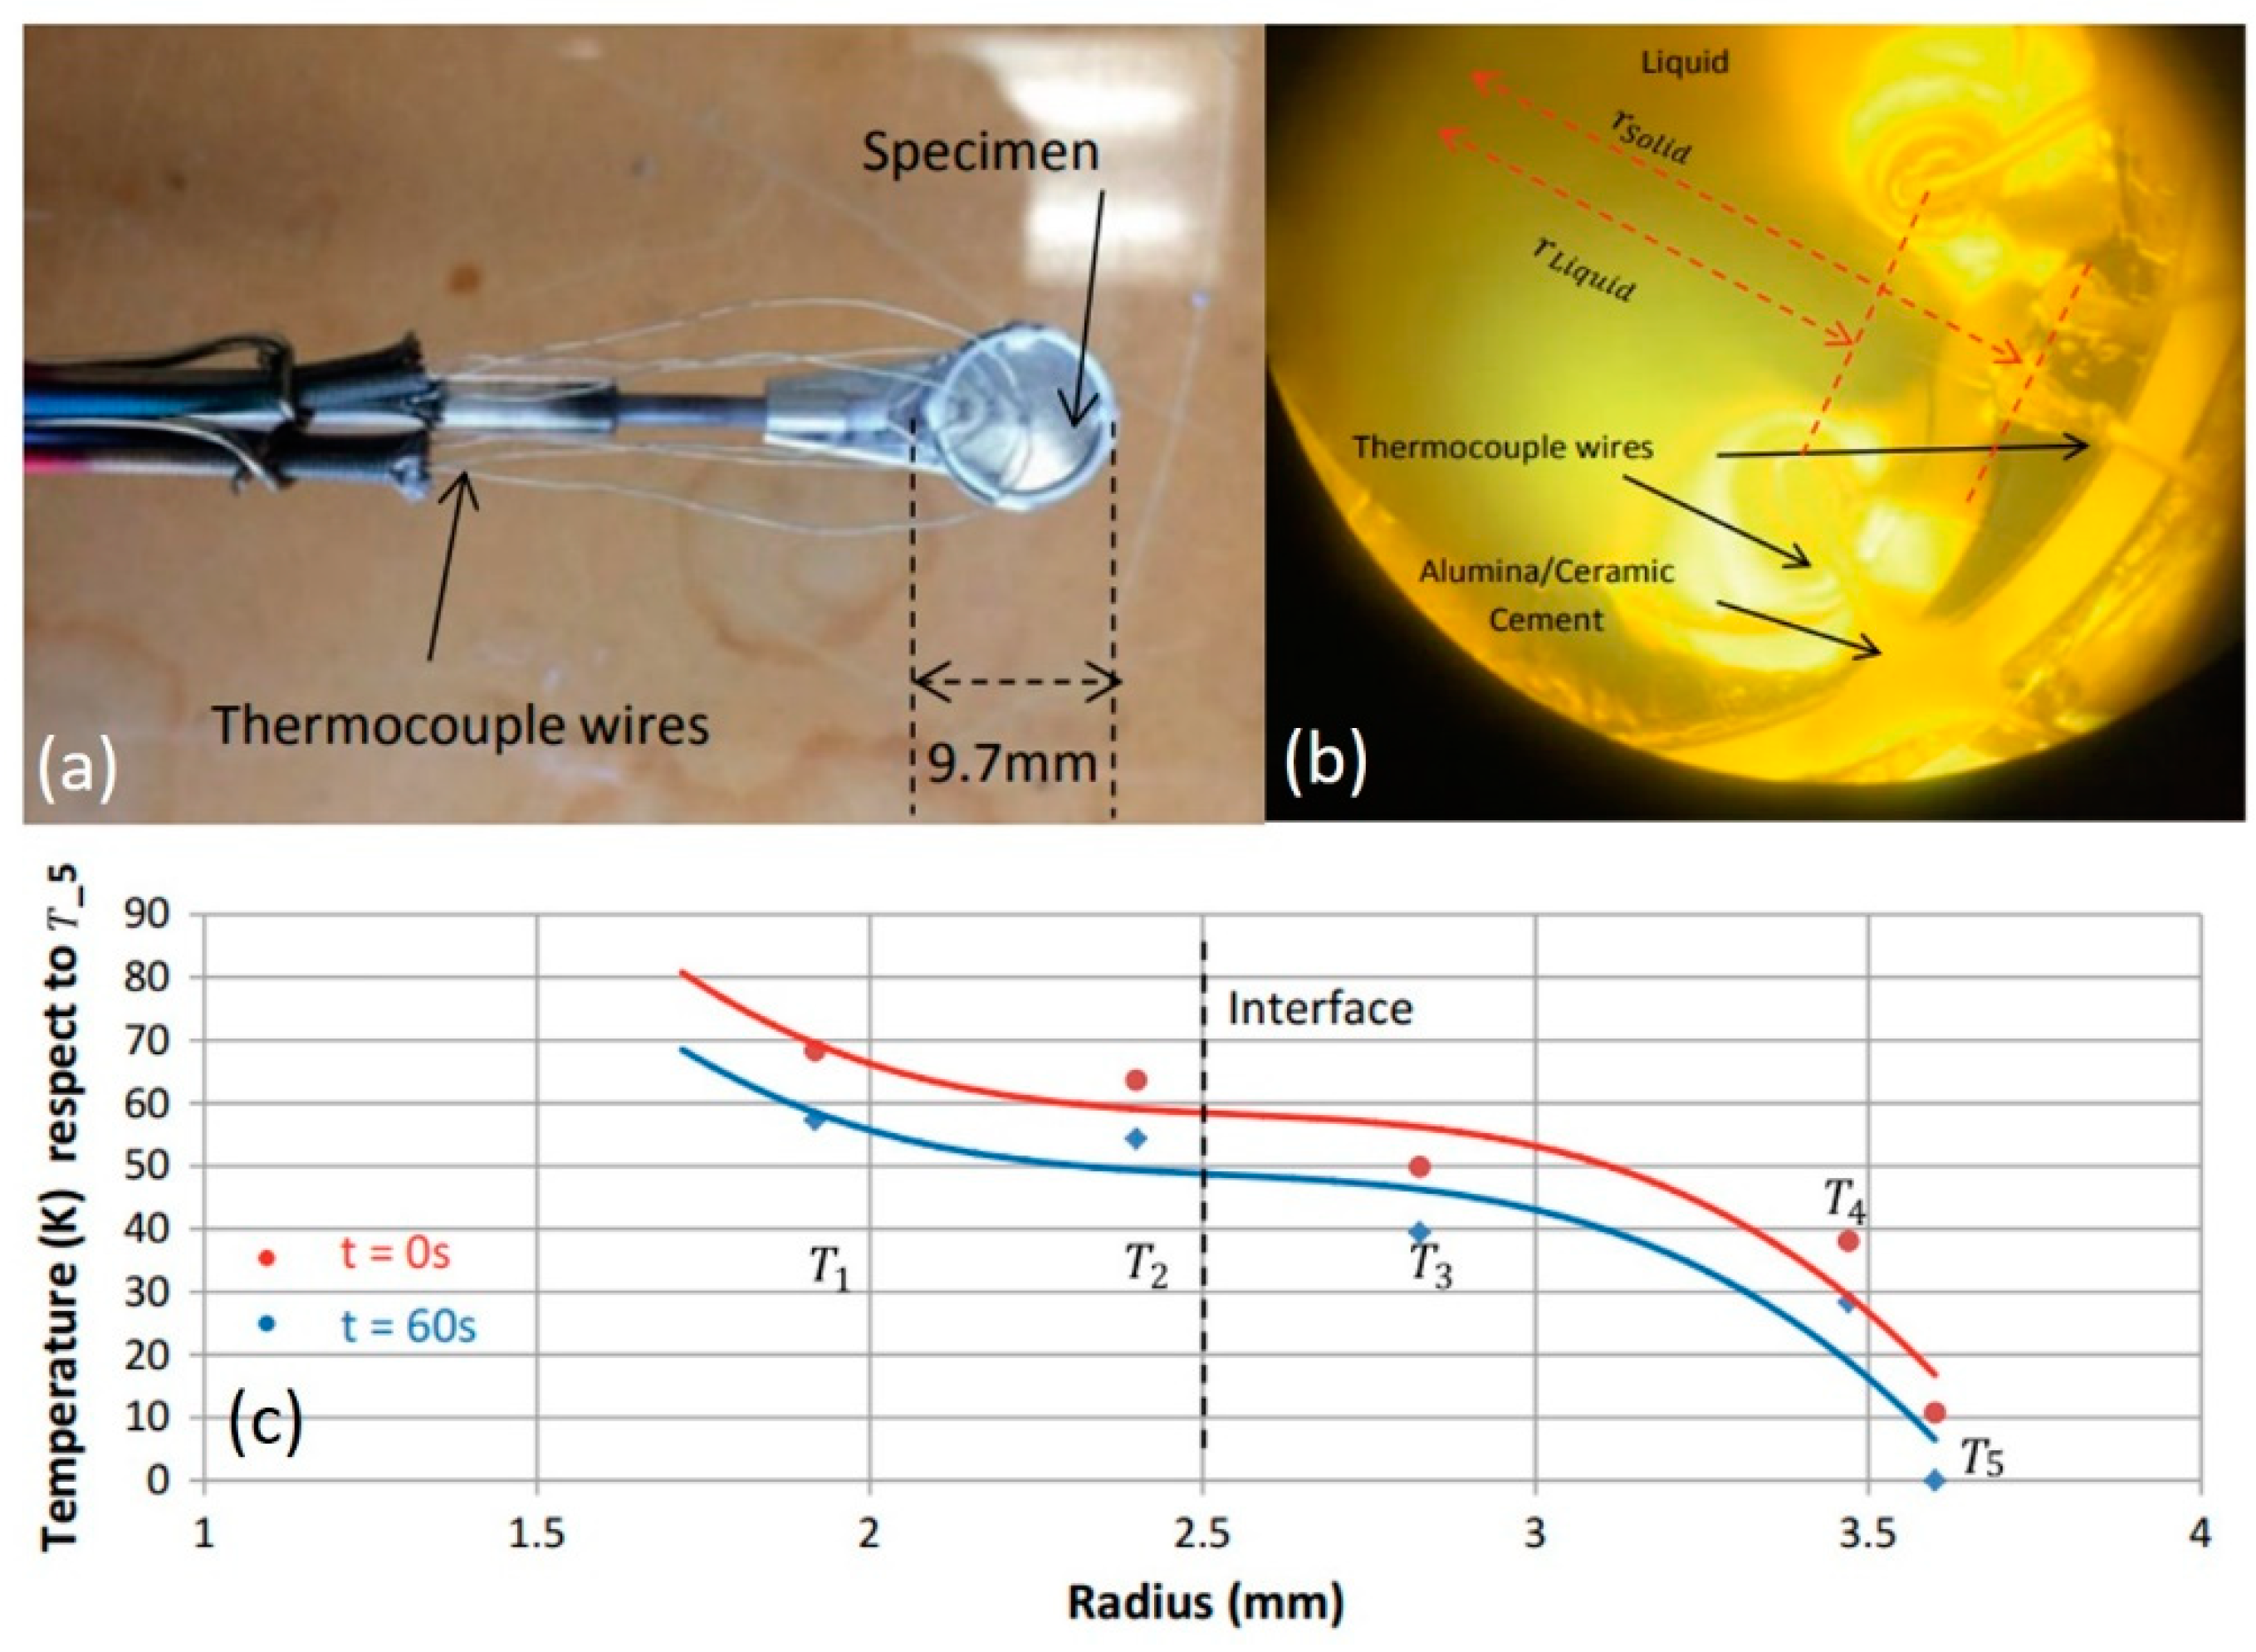
Temperature measurement during rapid solidification is another key issue for solidification research. Very recently, Liyanage et al. [27] successfully evaluated the temperature distribution with rapid cooling rates. Macro pictures of the experimental set-up are shown in Figure 4a,b. It is seen that a few thermocouples were spot welded separately in the center as well as other locations in the radial direction on the specimen surface to measure temperature distribution during solidification. To measure the liquid phase temperature, the separate thinner thermocouple wires are welded to the crucible. It was reported that the surface tension of the melt enables the thermocouple wires to be suspended in the melting pool [27]. Figure 4c shows the temperature distribution at different locations in the radial direction. Two cases of experimental measurements, i.e., on-set (t = 0 sec, solid dots) and 60 s after solidification with a 10 K/min cooling rate (t = 60 sec, diamond points), are presented, and solid curves represent a polynomial fitting result using Equation (1):
T(rm) = −31.621 × r3 + 242.24 × r2 − 623.52 × r + 597.35
In this figure, the Y-axis represents the difference of the measured temperatures at each location compared with the temperature node, which is close to the edge (marked as T5). Based on this measurement, it can be seen that the temperature close to the center of the specimen surface is approximately 60 °C higher than that at the edge. Based on this type of measurement, the temperature gradient (unit: K/mm) with each cooling rate could be further determined and the temperature at the solid/liquid interface at each cooling condition could be calculated; for details, see Ref. [27].
In addition, a special device was developed by Yan et al. [73] to enable the addition of alloys into the liquid iron to simulate the alloying and deoxidation processes during the secondary metallurgy process. The inclusion formation, growth and interaction with the melt could be investigated in situ.

2.2.2. Combinational Approach

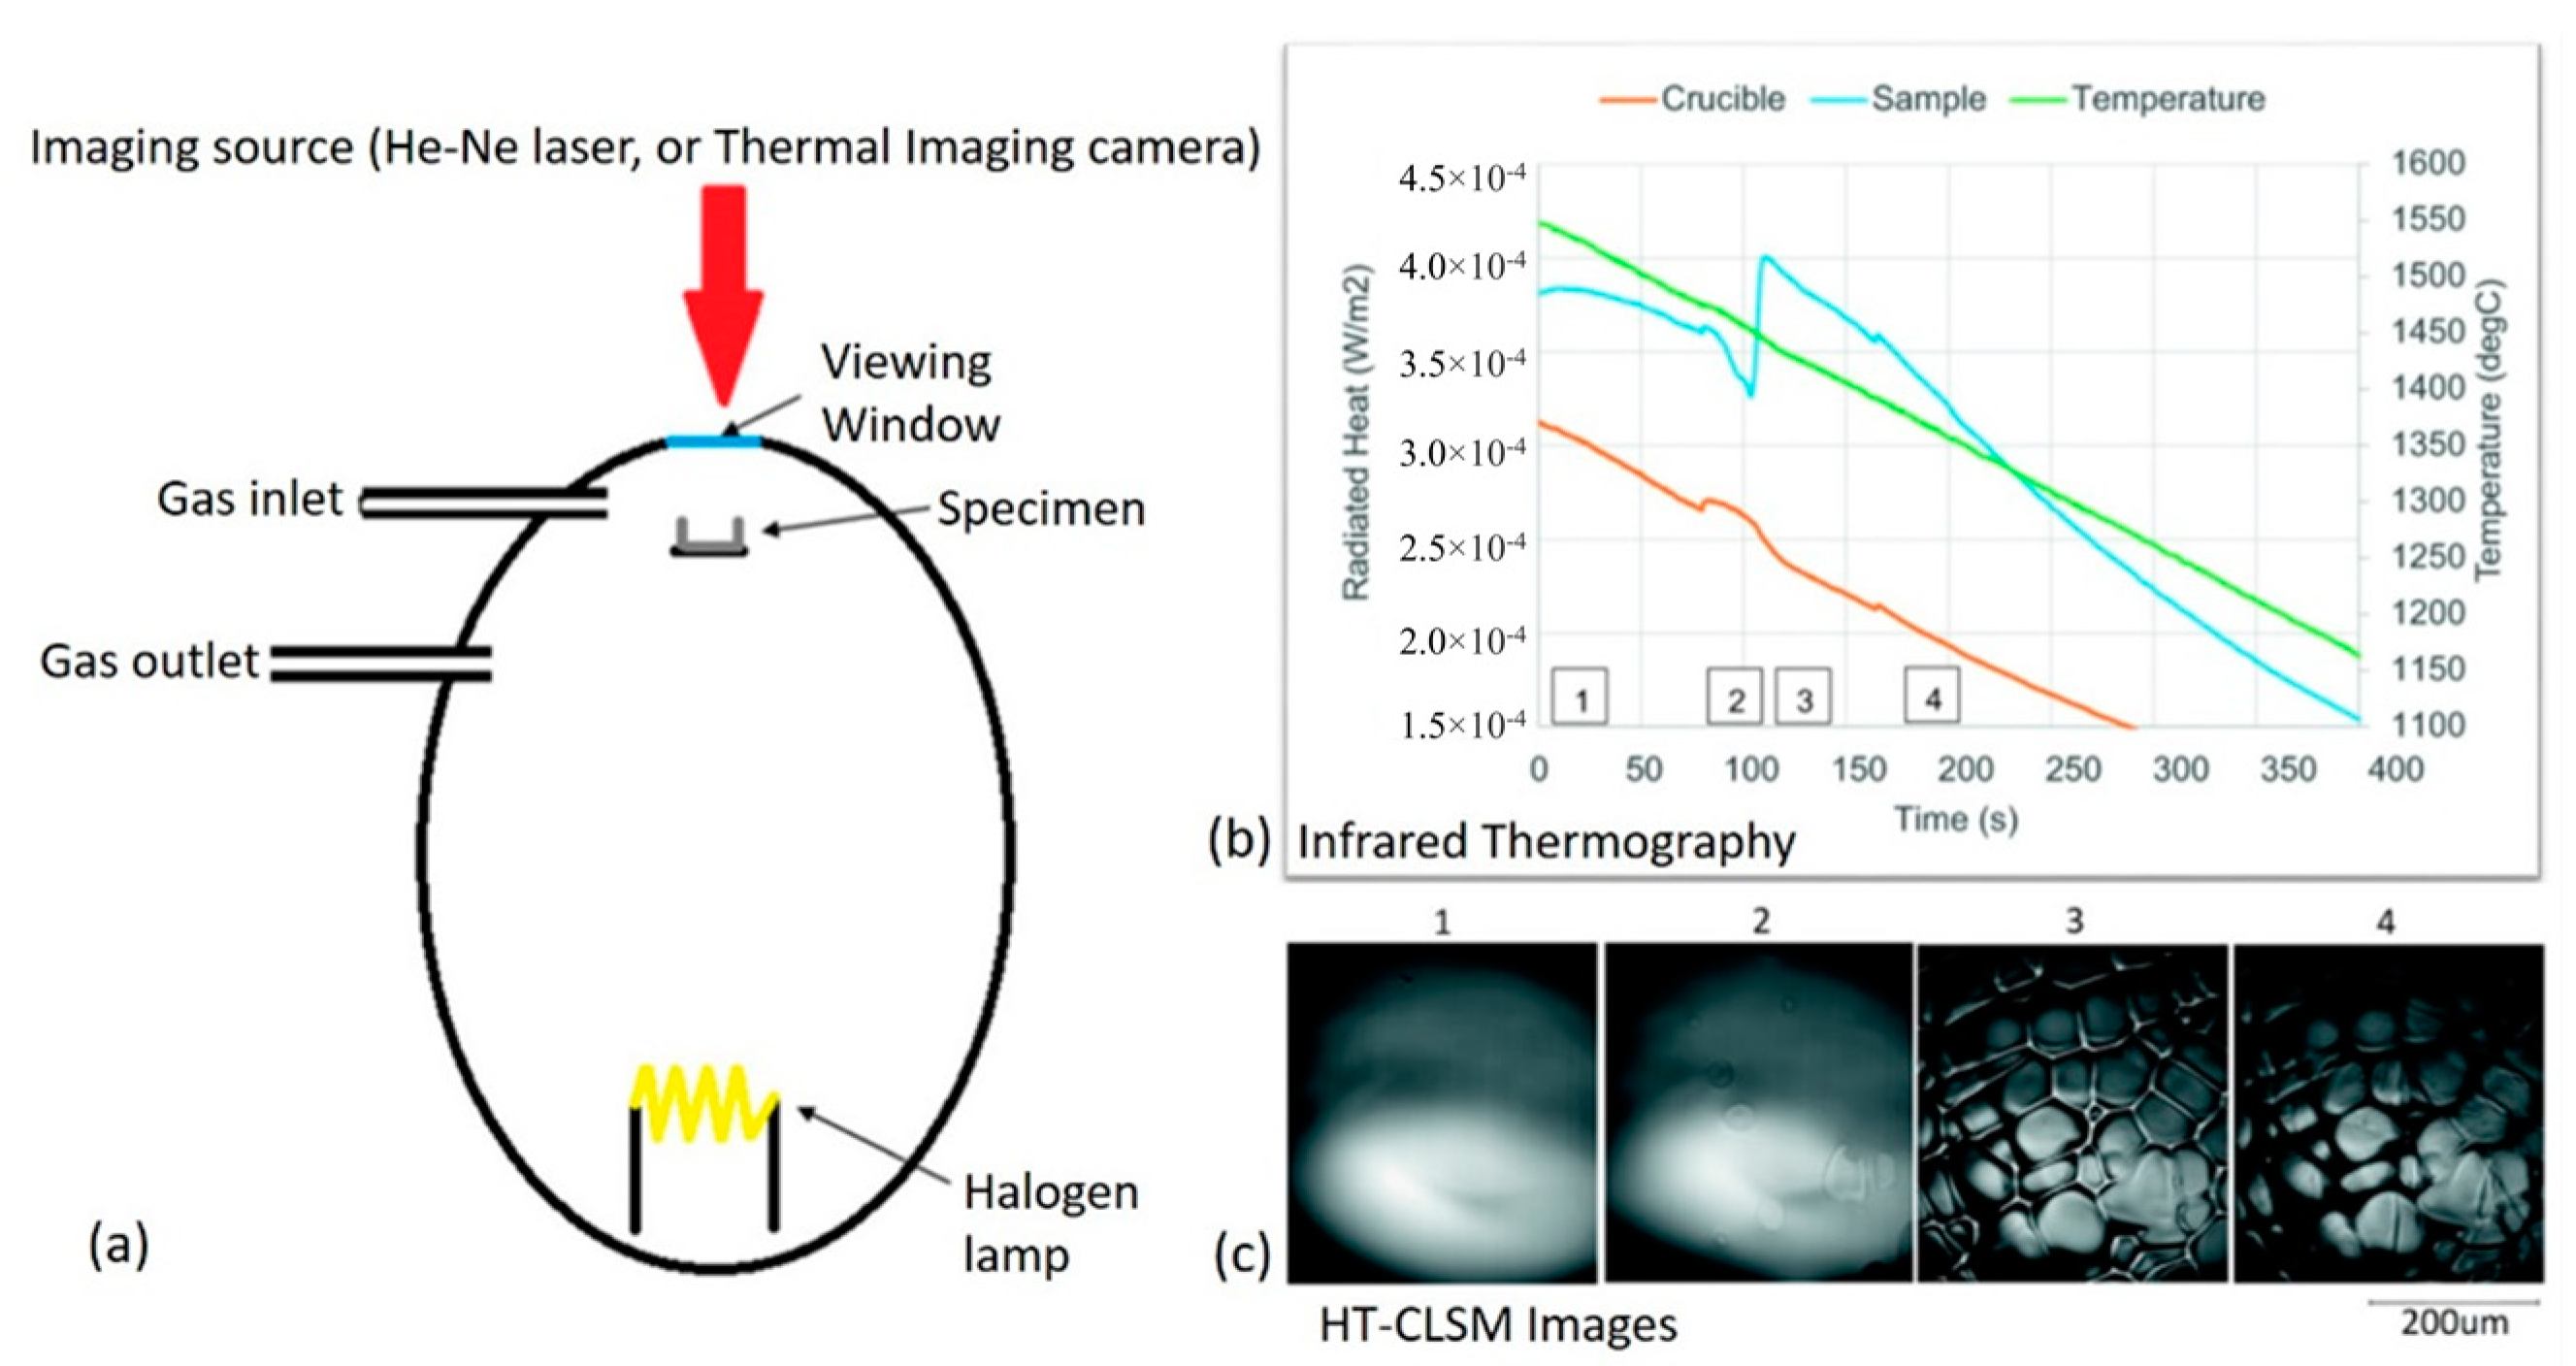
HT-CLSM could utilize the topographical and contrast differences between e.g., liquid/solid phase, grain boundaries, etc. to identify different microstructures during solidification. However, it mainly detects surface evolution. In order to understand the transformation of the bulk materials, other characterization methods using either X-ray or thermal analysis are needed. For instance, HT-CLSM in a combination of DTA/DSC has been used to obtain the comprehensive microstructure features for the solidification process [6,74] as well as post-heat treatment [55]. Utilizing this combinational method, both the crystallization imaging during solidification could be observed, and phase transition temperature as well as heat flow could be detected quantitatively. However, the drawback is two measurements are running separately; the difference in sample geometry and instrumentation (e.g., thermocouple position, cooling rate and atmosphere, crucible, etc.) is not identical, which inevitably leads to the mismatch for the two methods. Subsequently, Slater and co-workers [75] made a contribution to switch the laser head with the infrared thermographer in HT-CLSM, so both the structure evolution imaging as well as the radiated heat could be obtained from the same sample with the identical cooling condition. A schematic illustration of the experimental set-up and typical results of low-alloy steel solidification with a 1 °C/s cooling are shown in Figure 5a–c. Even if this method holds better identical conditions of sample feature, process parameters, etc., the imaging of the crystallization process as well as the radiated heat is still not obtained simultaneously.
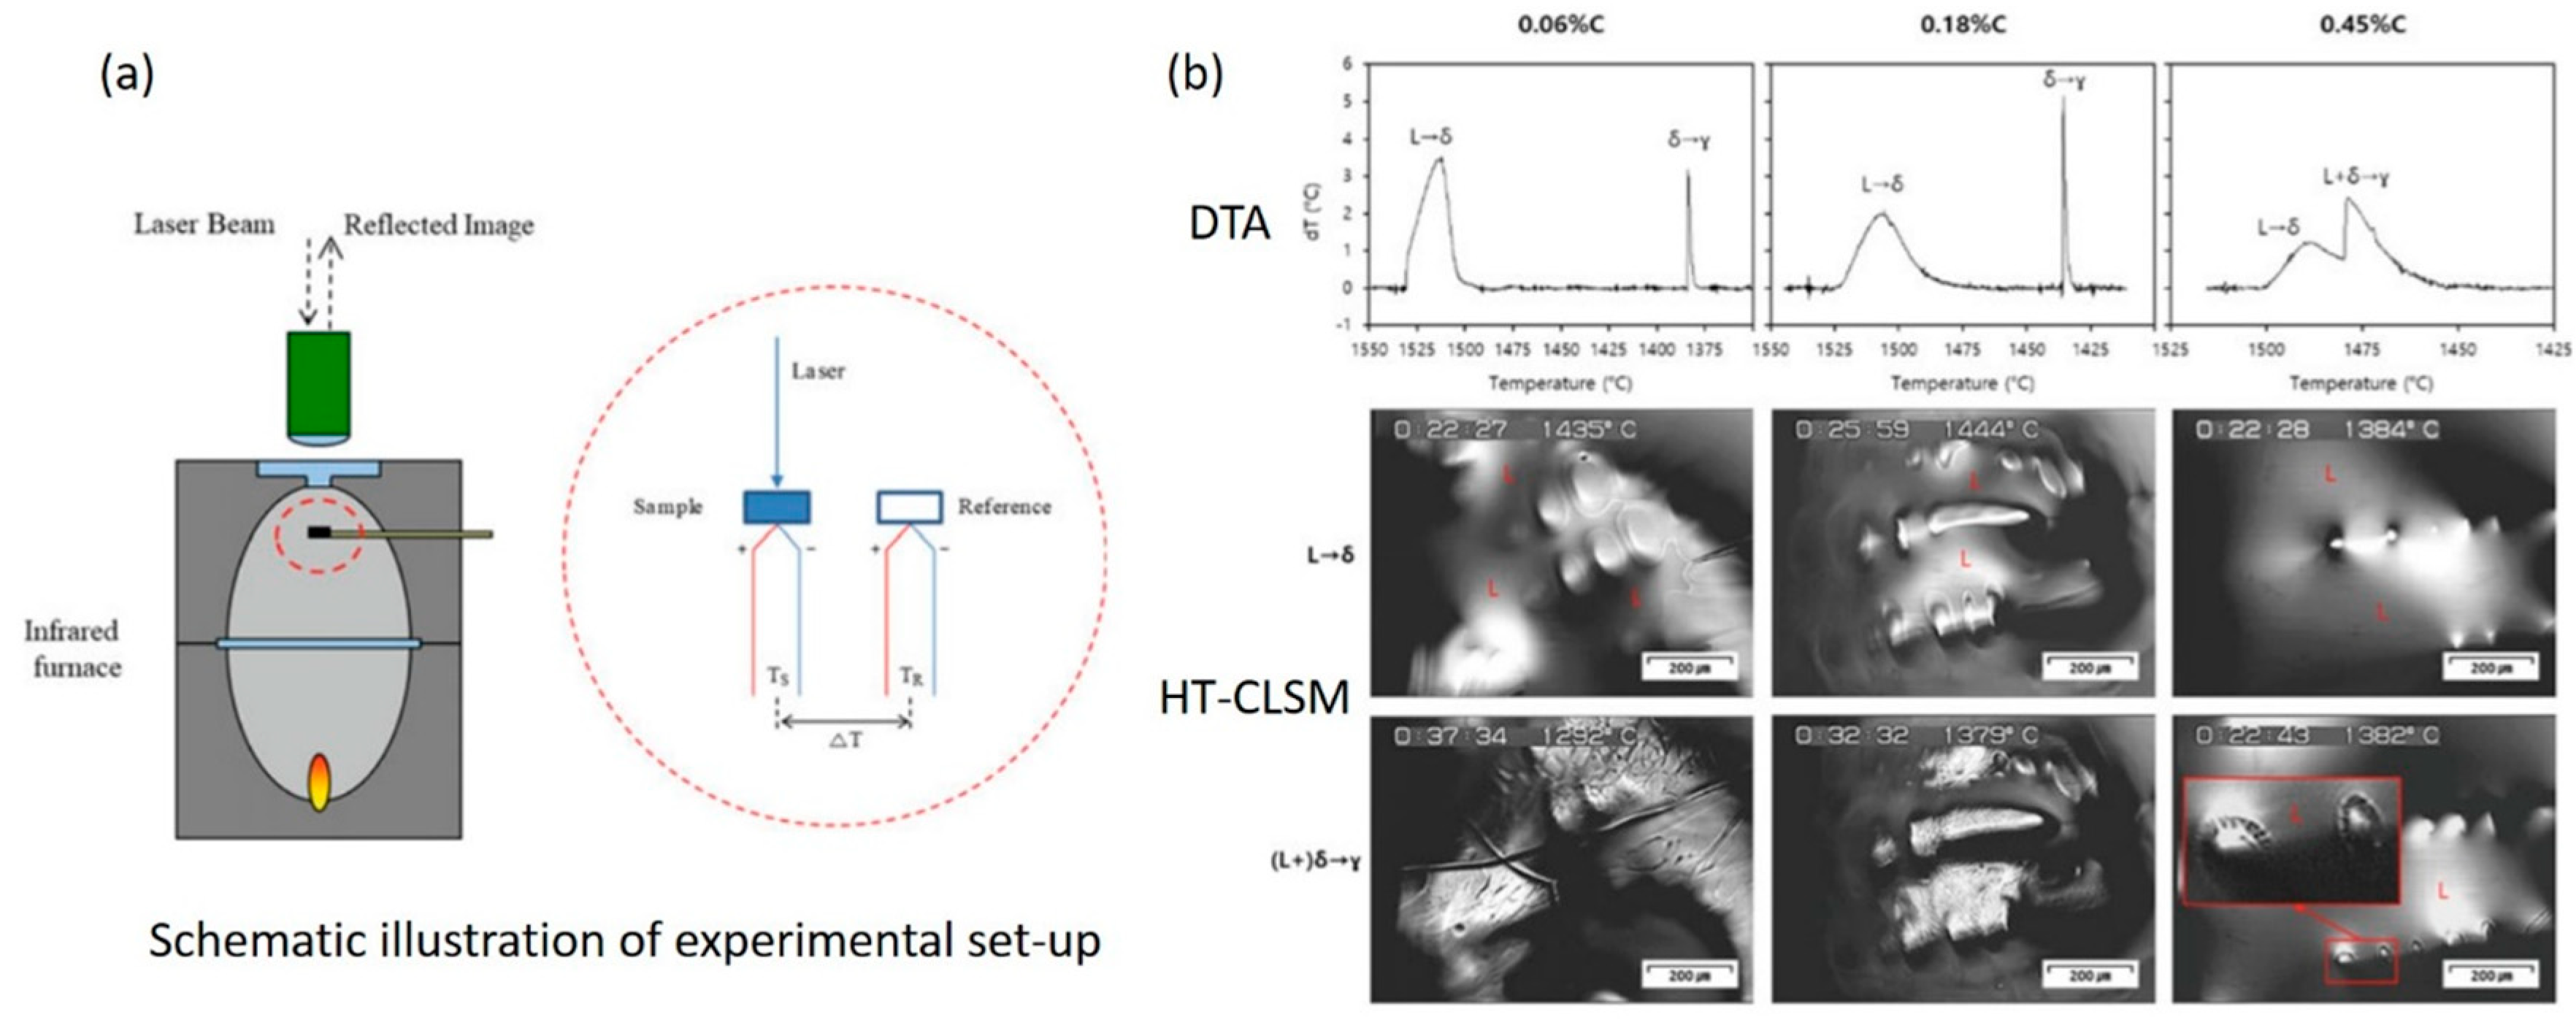
To further overcome the ‘mismatch’ limitation using two characterization methods, Phelan et al. [76] developed a combinational method incorporating high temperature confocal microscope and differential thermal analysis, the so-called HTCM-DTA. DTA carriers for sample and reference materials has functioned into the HT-CLSM chamber. During the HT-CLSM measurement, DTA signals can be obtained at the same time, and the abovementioned ‘mismatch’ limitation could be solved. The schematic illustration of this set-up as well as the typical DSC and HT-CLSM results of different Fe-C alloys solidification are shown in Figure 6 [28]. It is seen that for the Fe-0.06% C alloy, reactions of L→δ and δ→γ occur separately, and no peritectic transition is found. This can be seen in both DTA and HT-CLSM results, since they run simultaneously. Alternatively, the peritectic transition is clearly found in the alloy with higher carbon content (i.e., Fe-0.45% C).
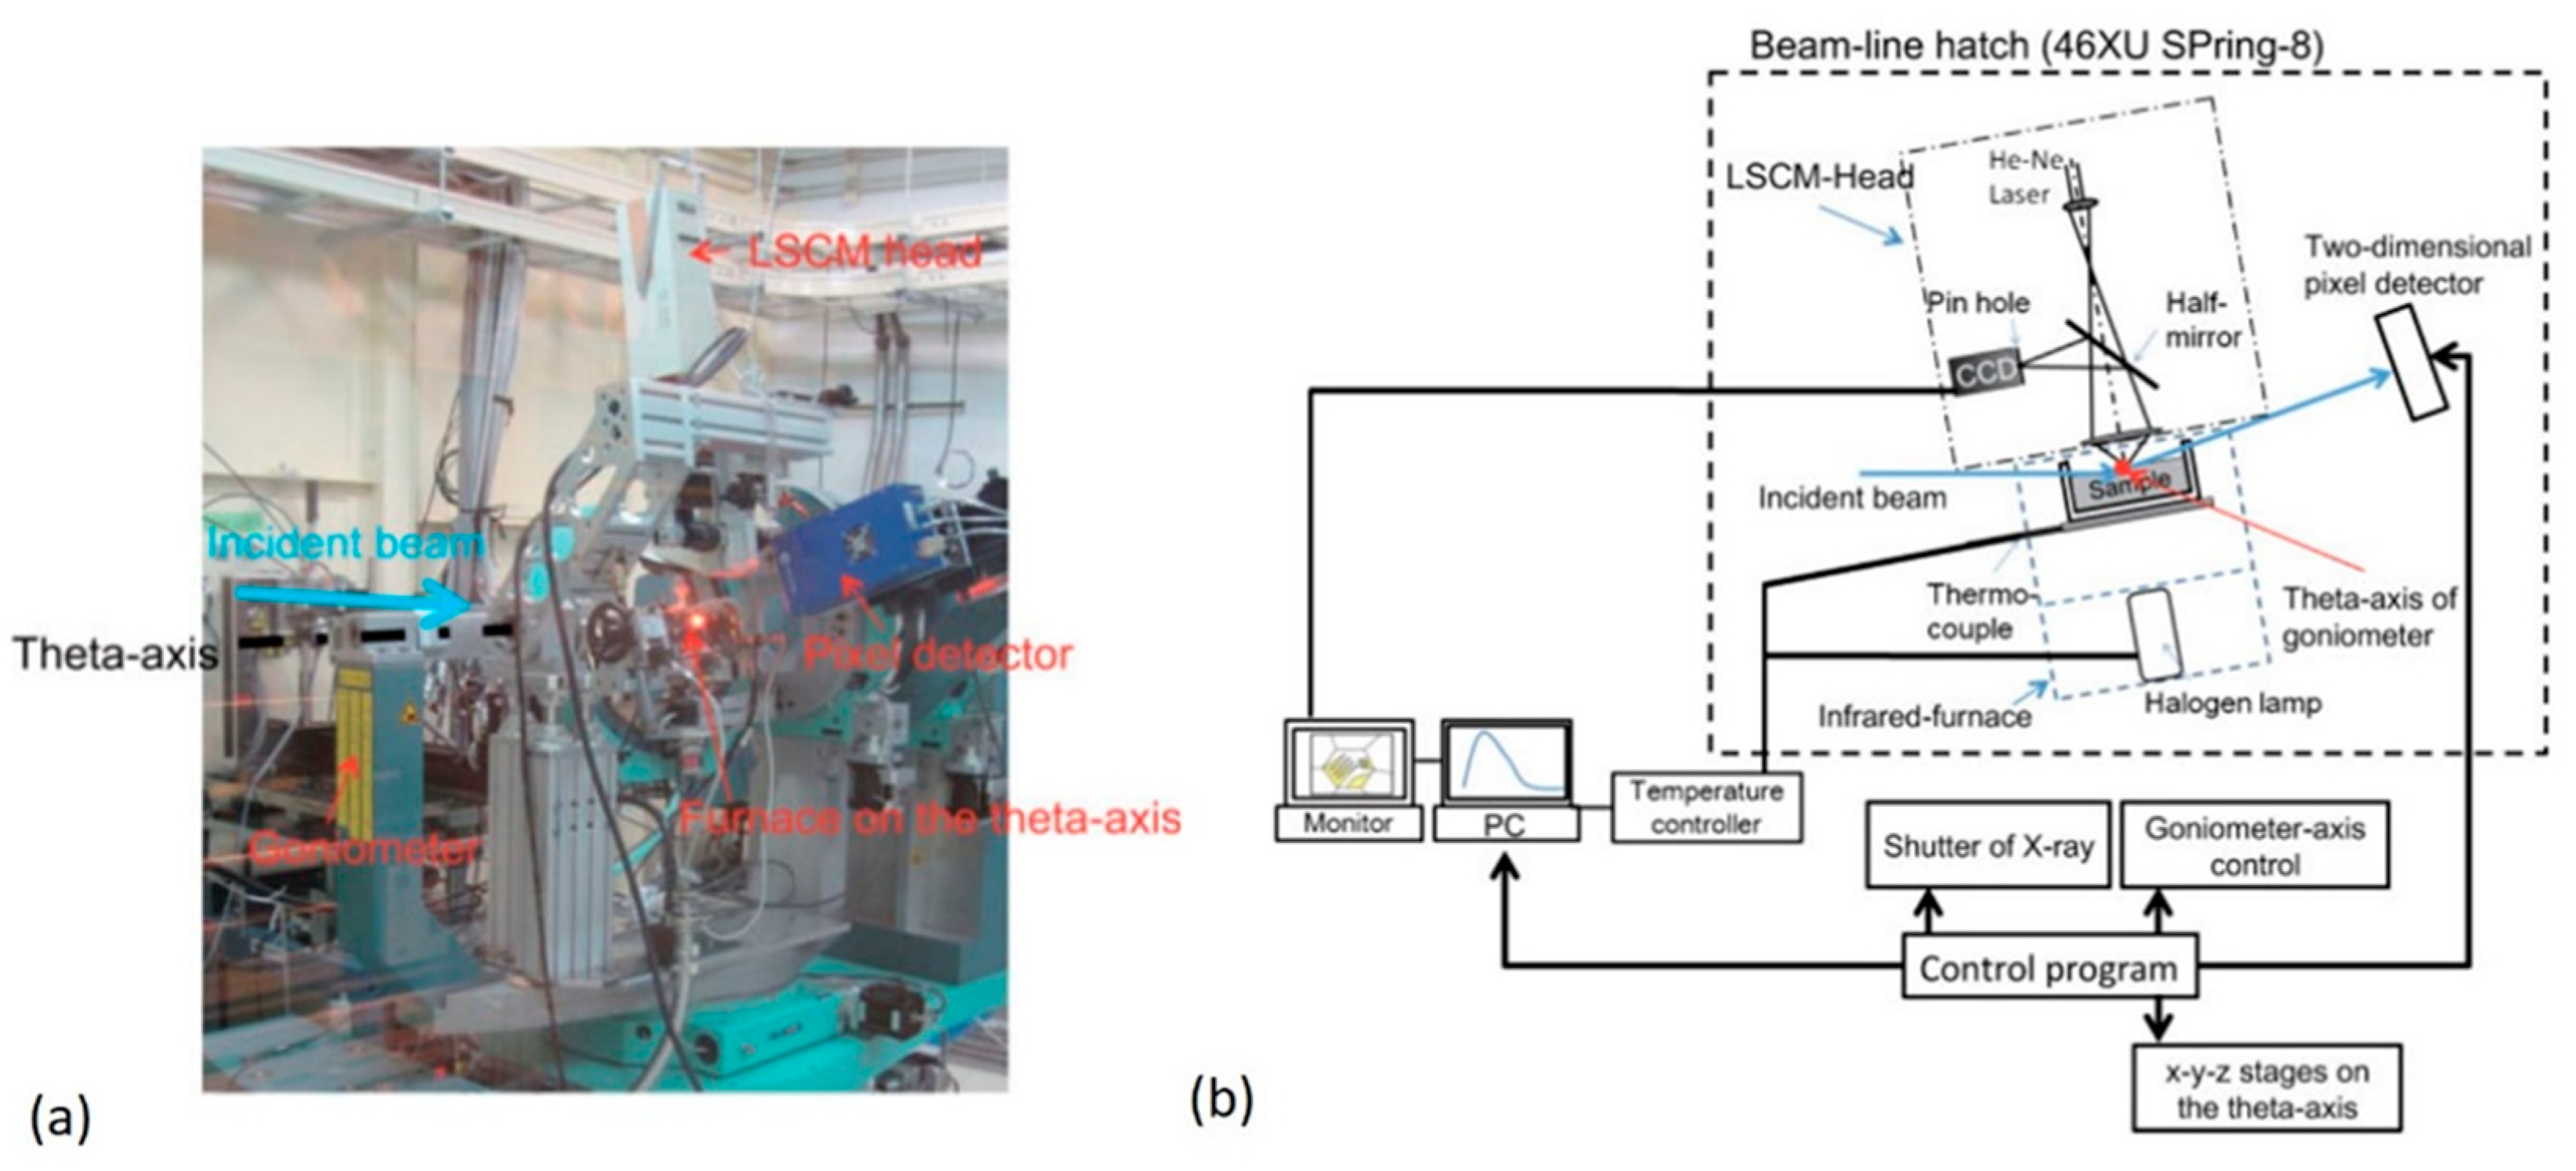
Besides the conventional methods, e.g., DTA/DSC, the state-of-the-art large-scale facility (LSF) has developed rapidly for bulk material analysis using the synchrotron or neutron sources. It is known that synchrotron radiation is a kind of electromagnetic radiation taking place in the case of when high energy electrons are forced to accelerate perpendicular to their velocity [77]. Recently, synchrotron X-rays have become much more popular due to their high brilliance. It is about more than one billion times higher than the in-house X-rays. Komizo and Terasaki [57,78] have combined the HT-CLSM with synchrotron high energy X-ray diffraction (SHEXRD) to directly observe the morphological evolution as well as the simultaneous identification of microstructures during a welding simulation condition. Figure 7 shows an actual photo of the experimental set-up on the SPring-8 (46XU beamline) as well as the schematic illustration of the working principle. It is seen that the infrared furnace is located on the h-axis of a goniometer situated within the hatch of the beamline. In this combinational facility, the head of HT-CLSM is also set by fitting the h-axis; see Figure 7a. Furthermore, the detector of a two-dimensional (2D) pixel is located on the 2 h axis. The ultra-bright X-ray (incident beam) could be penetrated into the furnace. Thus, the diffraction patterns could be recorded by the pixel detector with a time-resolved high resolution. At the same time, microstructural evolutions during cooling could be in situ observed by HT-CLSM. Details of the instrumentation can be seen in Refs. [57,78]. According to the above description, this combinational approach could effectively utilize two facility advantages and provide microstructure evolution imaging as well as in situ phase identification using the exactly identical sample and heating and cooling thermal cycles. However, this technique needs to incline the HT-CLSM chamber including the specimen crucible, and to the authors’ experience, it is not easy to perform the research for liquid metal, but it would be no problem to identify the solid-state phase transformations. Transformations δ→γ, γ→α, etc. during cooling from solidification or welding could be detected. Besides the HT-CLSM + SHEXRD technique, synchrotron X-rays have more frequently been applied for physical metallurgy as well as additive manufacturing research, in combination with other in situ characterization techniques, e.g., quenching dilatometer. However, these are not the focus of this work, and details can be seen elsewhere [79,80].

3. Crystallization and Microstructure Evolution during Solidification by HT-CLSM

3.1. In Situ Observation of Crystallization during Solidification of Low-Alloy Steels

The transition between planar, cellular and dendritic crystals from the melt during the solidification process is one of the key research issues. During the solidification process, many different types of crystal morphologies could be formed. In various kinds of alloys, including steels, faceted crystals could be formed at low cooling rates, while dendrites are formed at high cooling rates.
The first HT-CLSM facility is developed to study the planar-to-cellular and cellular-to-dendritic transformations during the solidification of the Fe-C alloys dating back to over two decades ago. HT-CLSM is ideally suited to differentiate the morphologies of the solidification structure in an undercooled steel melt due to its clear contrast between grains and grain boundaries as well as topographical differences.
Chikama et al. [9] first applied the HT-CLSM technique to directly observe the dynamics of crystal growth in Fe-C alloy melts. To overcome the difficulties in distinguishing the solid phase from the surrounding melt caused by thermal radiation, a laser beam was utilized to provide a higher illumination intensity. They reported that Fe-0.83 mass % C alloy melt was subjected to γ-solidification mode and it exhibited distinct planer to cellular and then to dendritic, whereas Fe-0.2 mass % C alloy melt undergo a δ-solidification and the growth of δ crystals took place in a cellular configuration. The formation of γ-austenite phase caused the formation of perturbations at the solid/liquid interface developing into cells followed by preferred growth of some distinct cells which grew on adjacent columnar cells. It was also reported that the liquid/δ interface became unstable as a result of the transition from planar to cellular morphology at high cooling rates [26].
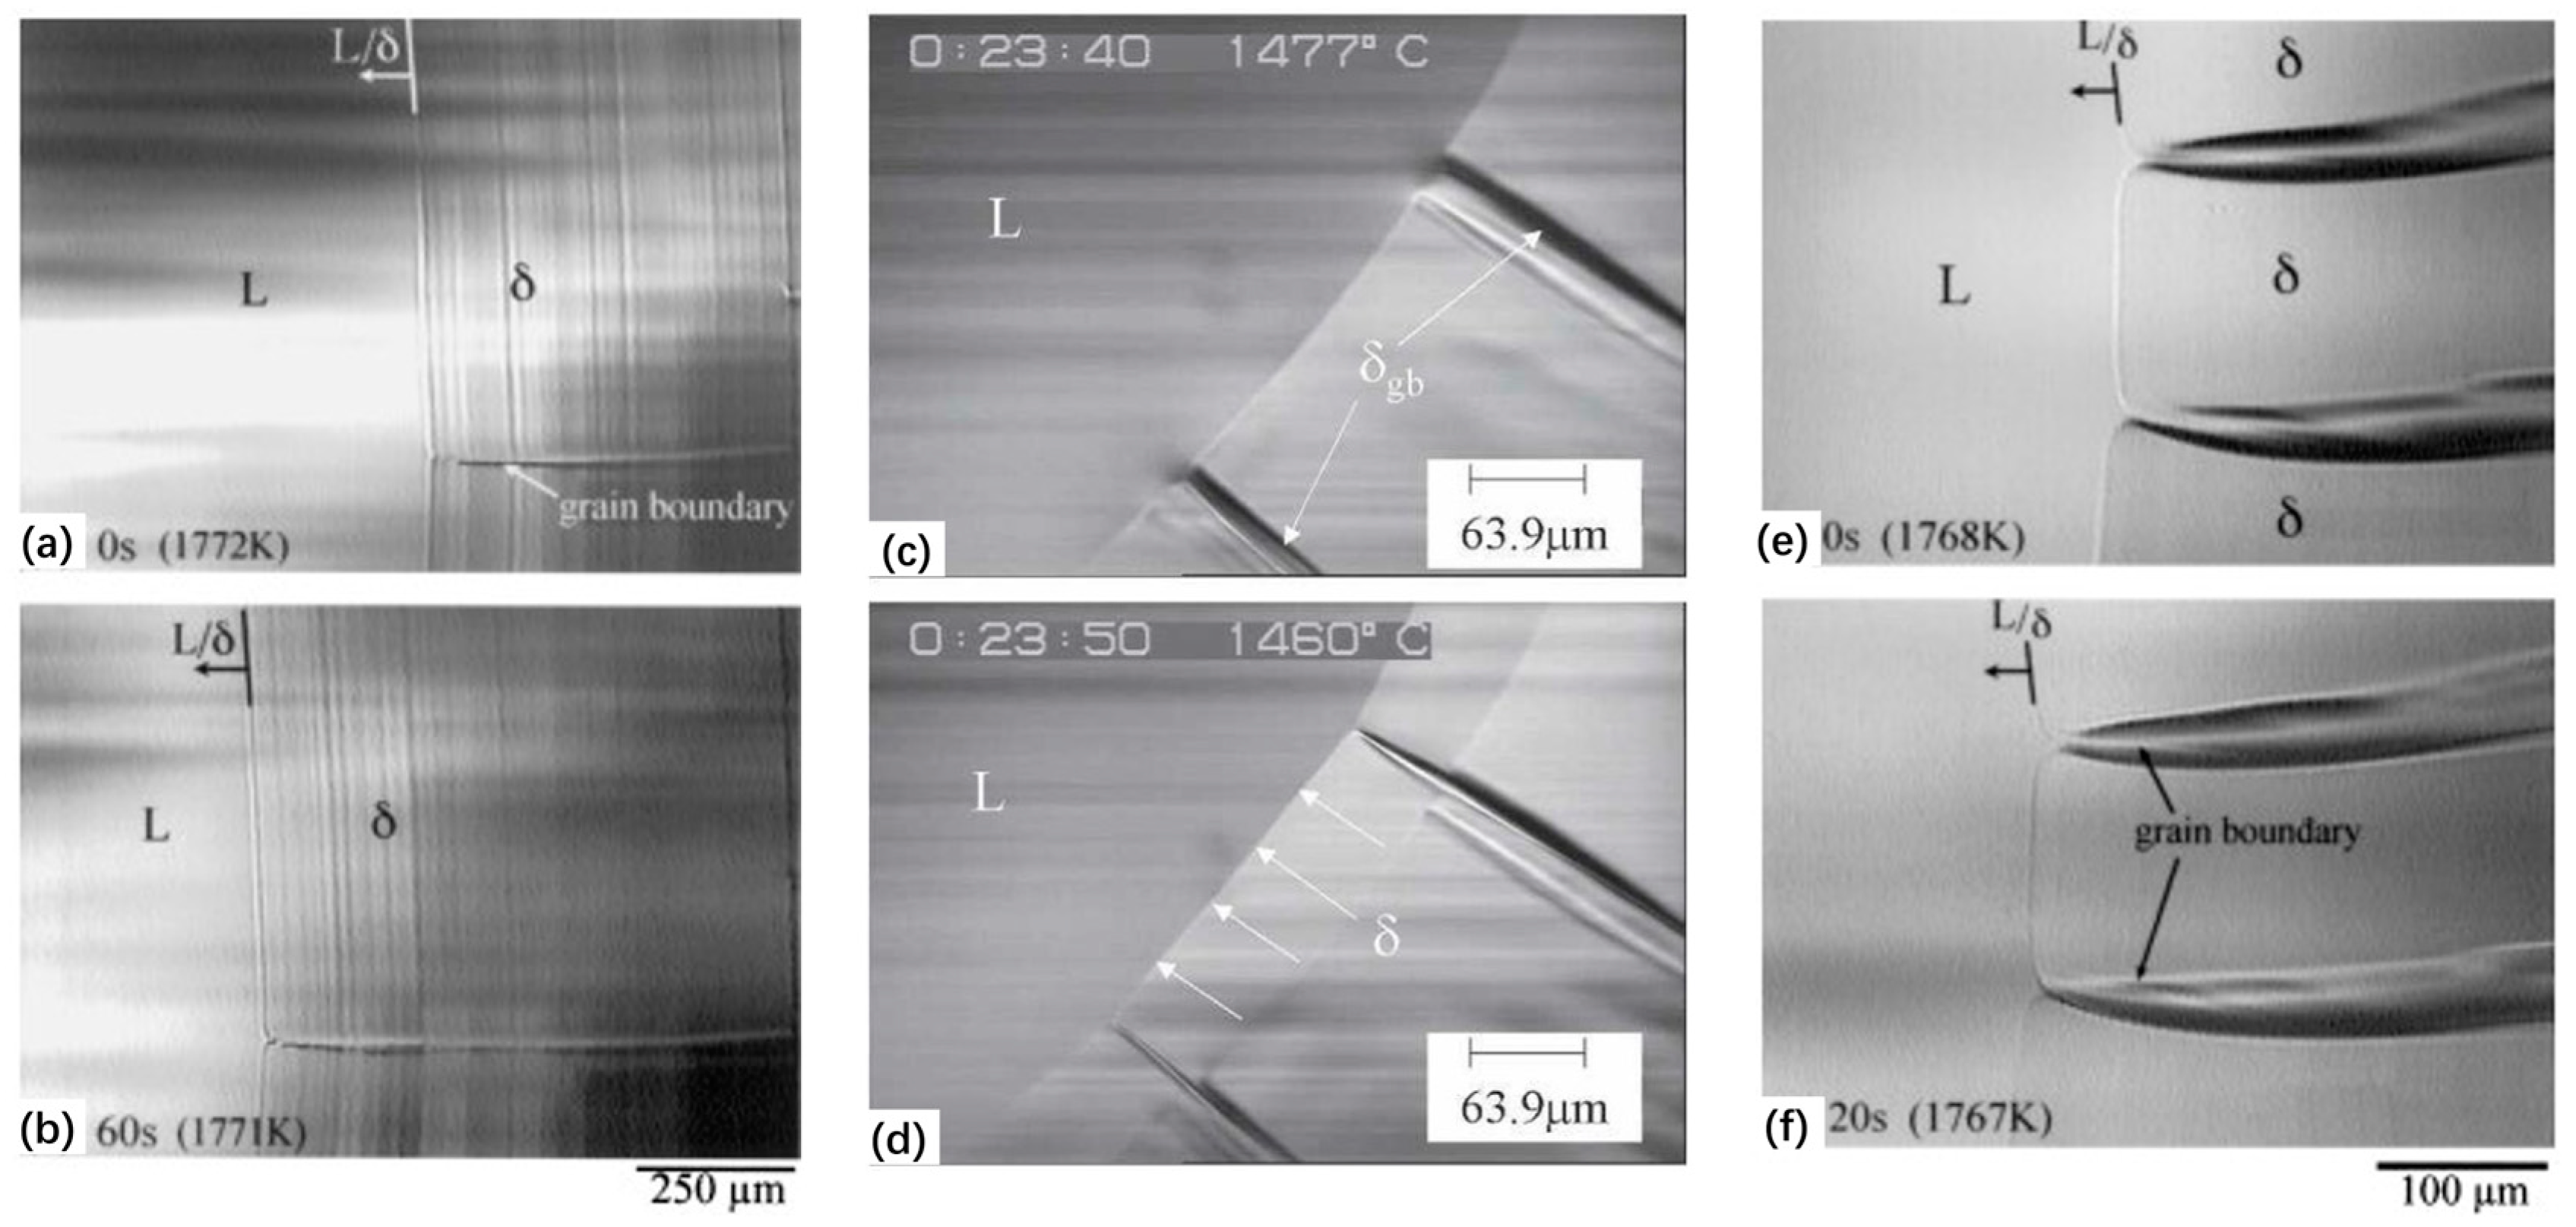
Except for the effect of steel composition, temperature gradient (G) can also affect the crystal morphology [10]. The planar and cellular growth of δ crystals under different temperature gradients are presented in Figure 8. As can be seen that planar δ crystals formed when the liquid was solidified from the cool end of the crucible (right-hand side) and grew directionally from the right-hand side to the left-hand side at a G = 22 K/mm (Figure 8a,b). A similar planar L/δ interface was observed in a Fe-0.18% C steel at a cooling rate of 100 K/min. On the other hand, cellular δ crystals grew at G = 4.3 K/mm, as shown in Figure 8c,d.
In general, depending on the temperature gradient/solidification velocity (G/V) ratio and nucleation conditions, a variety of microstructures, i.e., cellular, planar, bands and eutectic-like structures, can result from peritectic solidification.

3.2. Microstructure Evolution from Delta-Ferrite to Austenite in Low-Alloy Steels

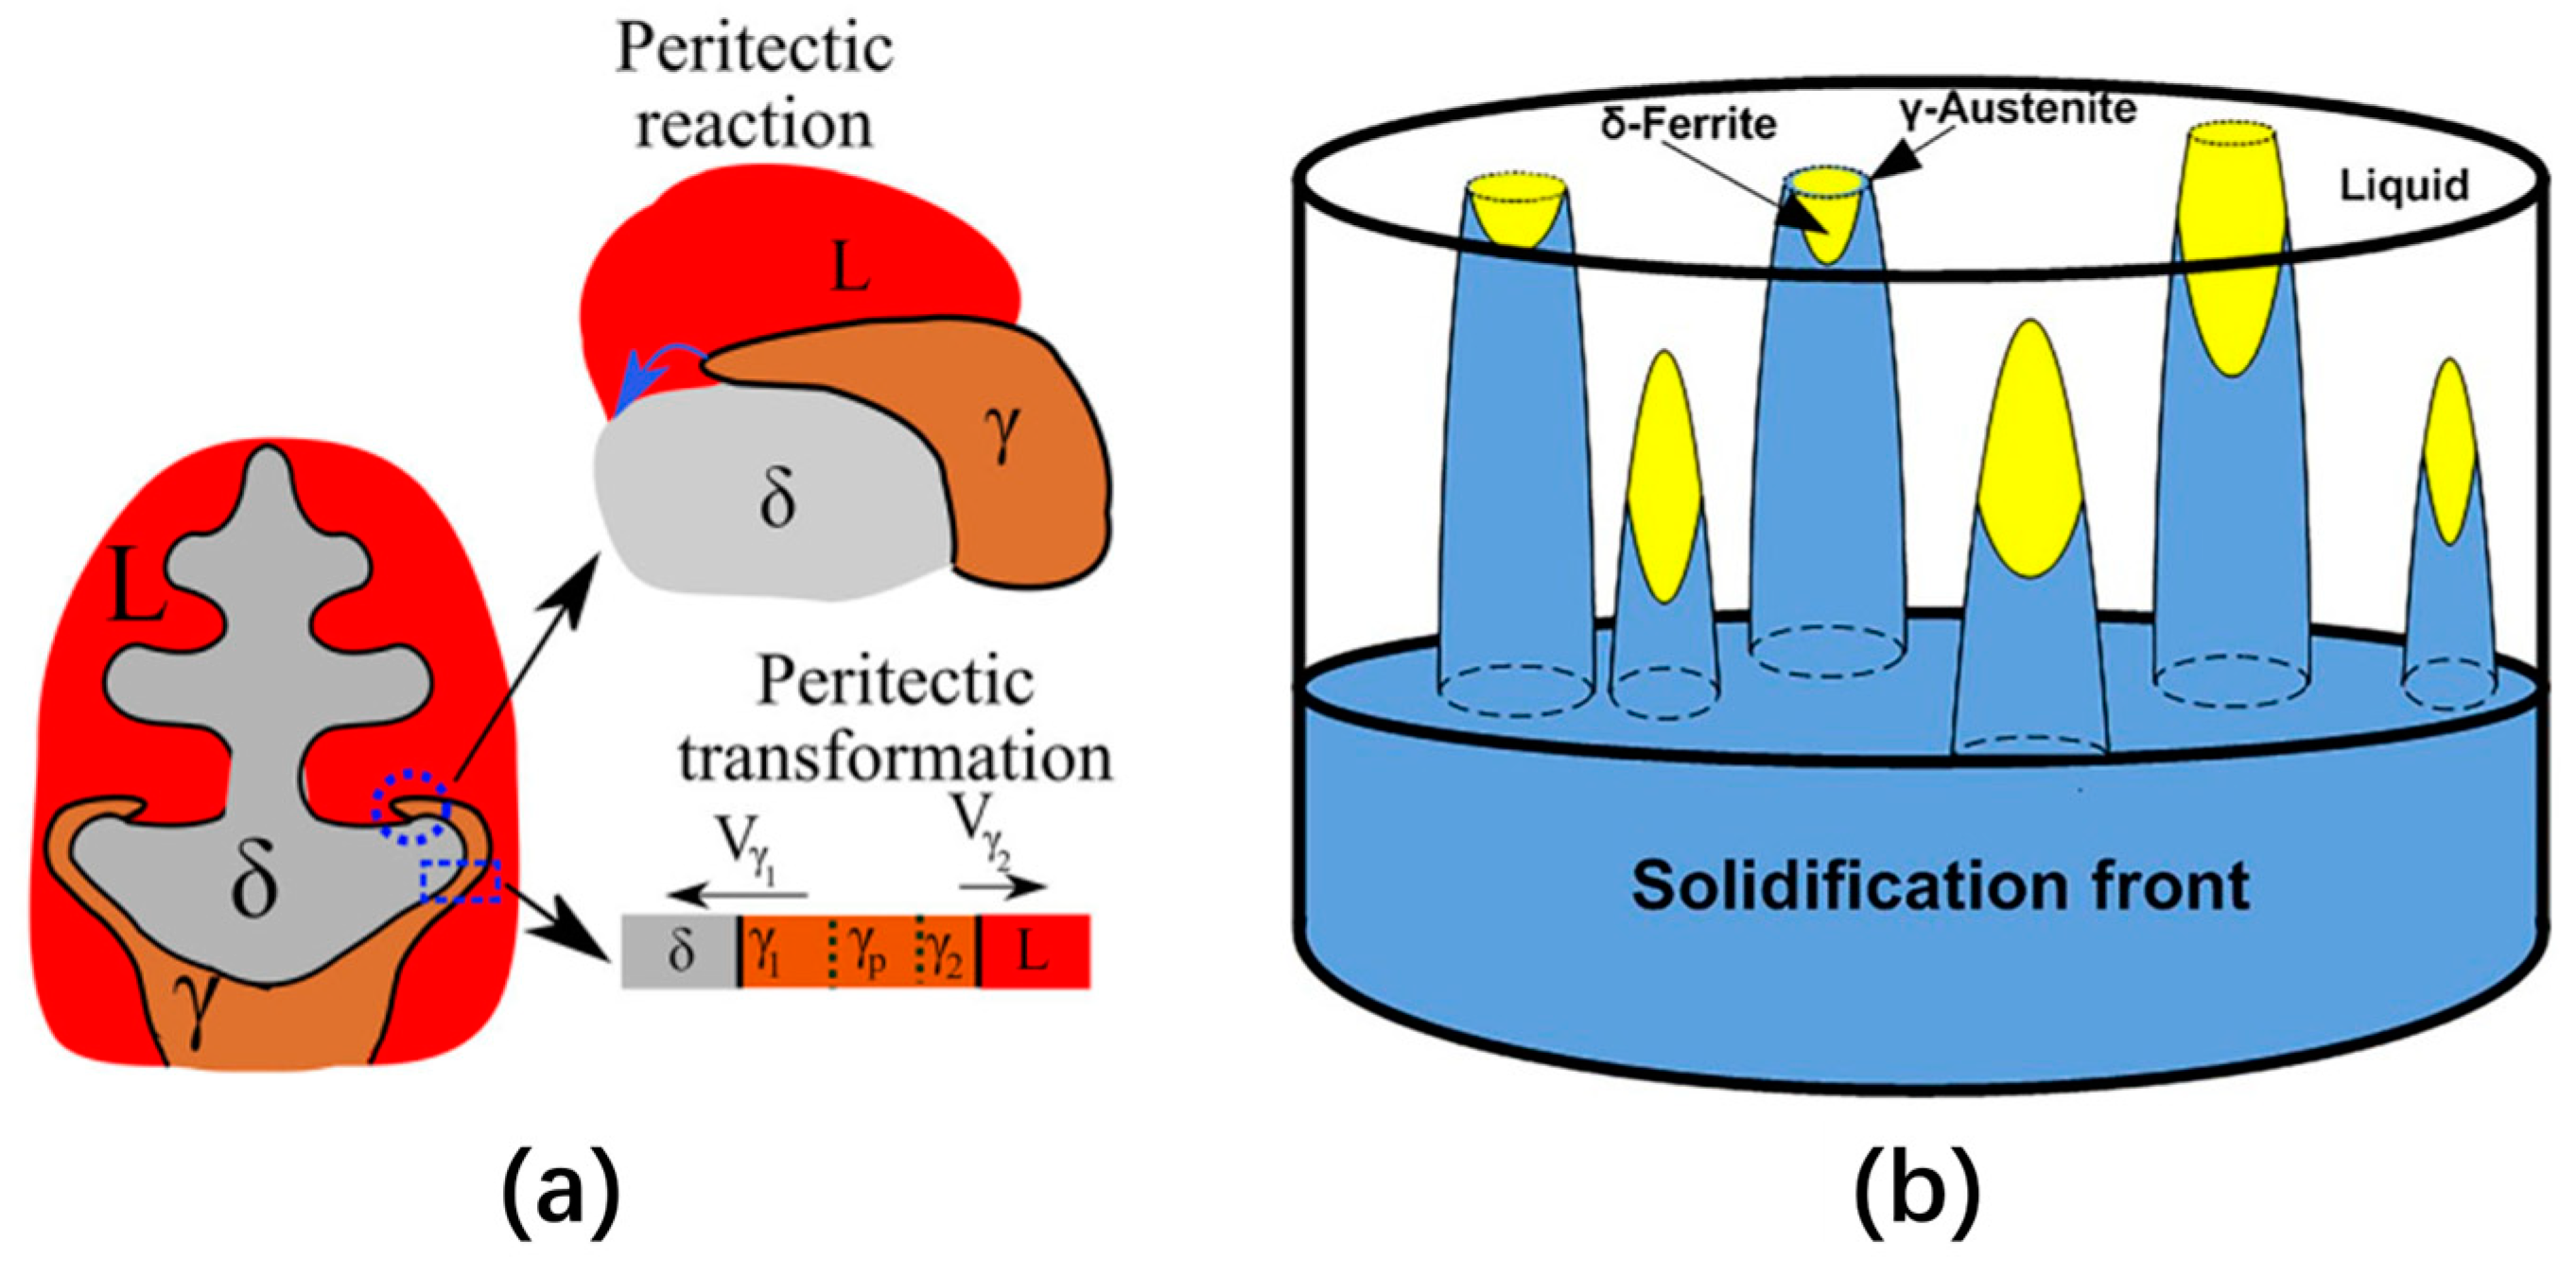
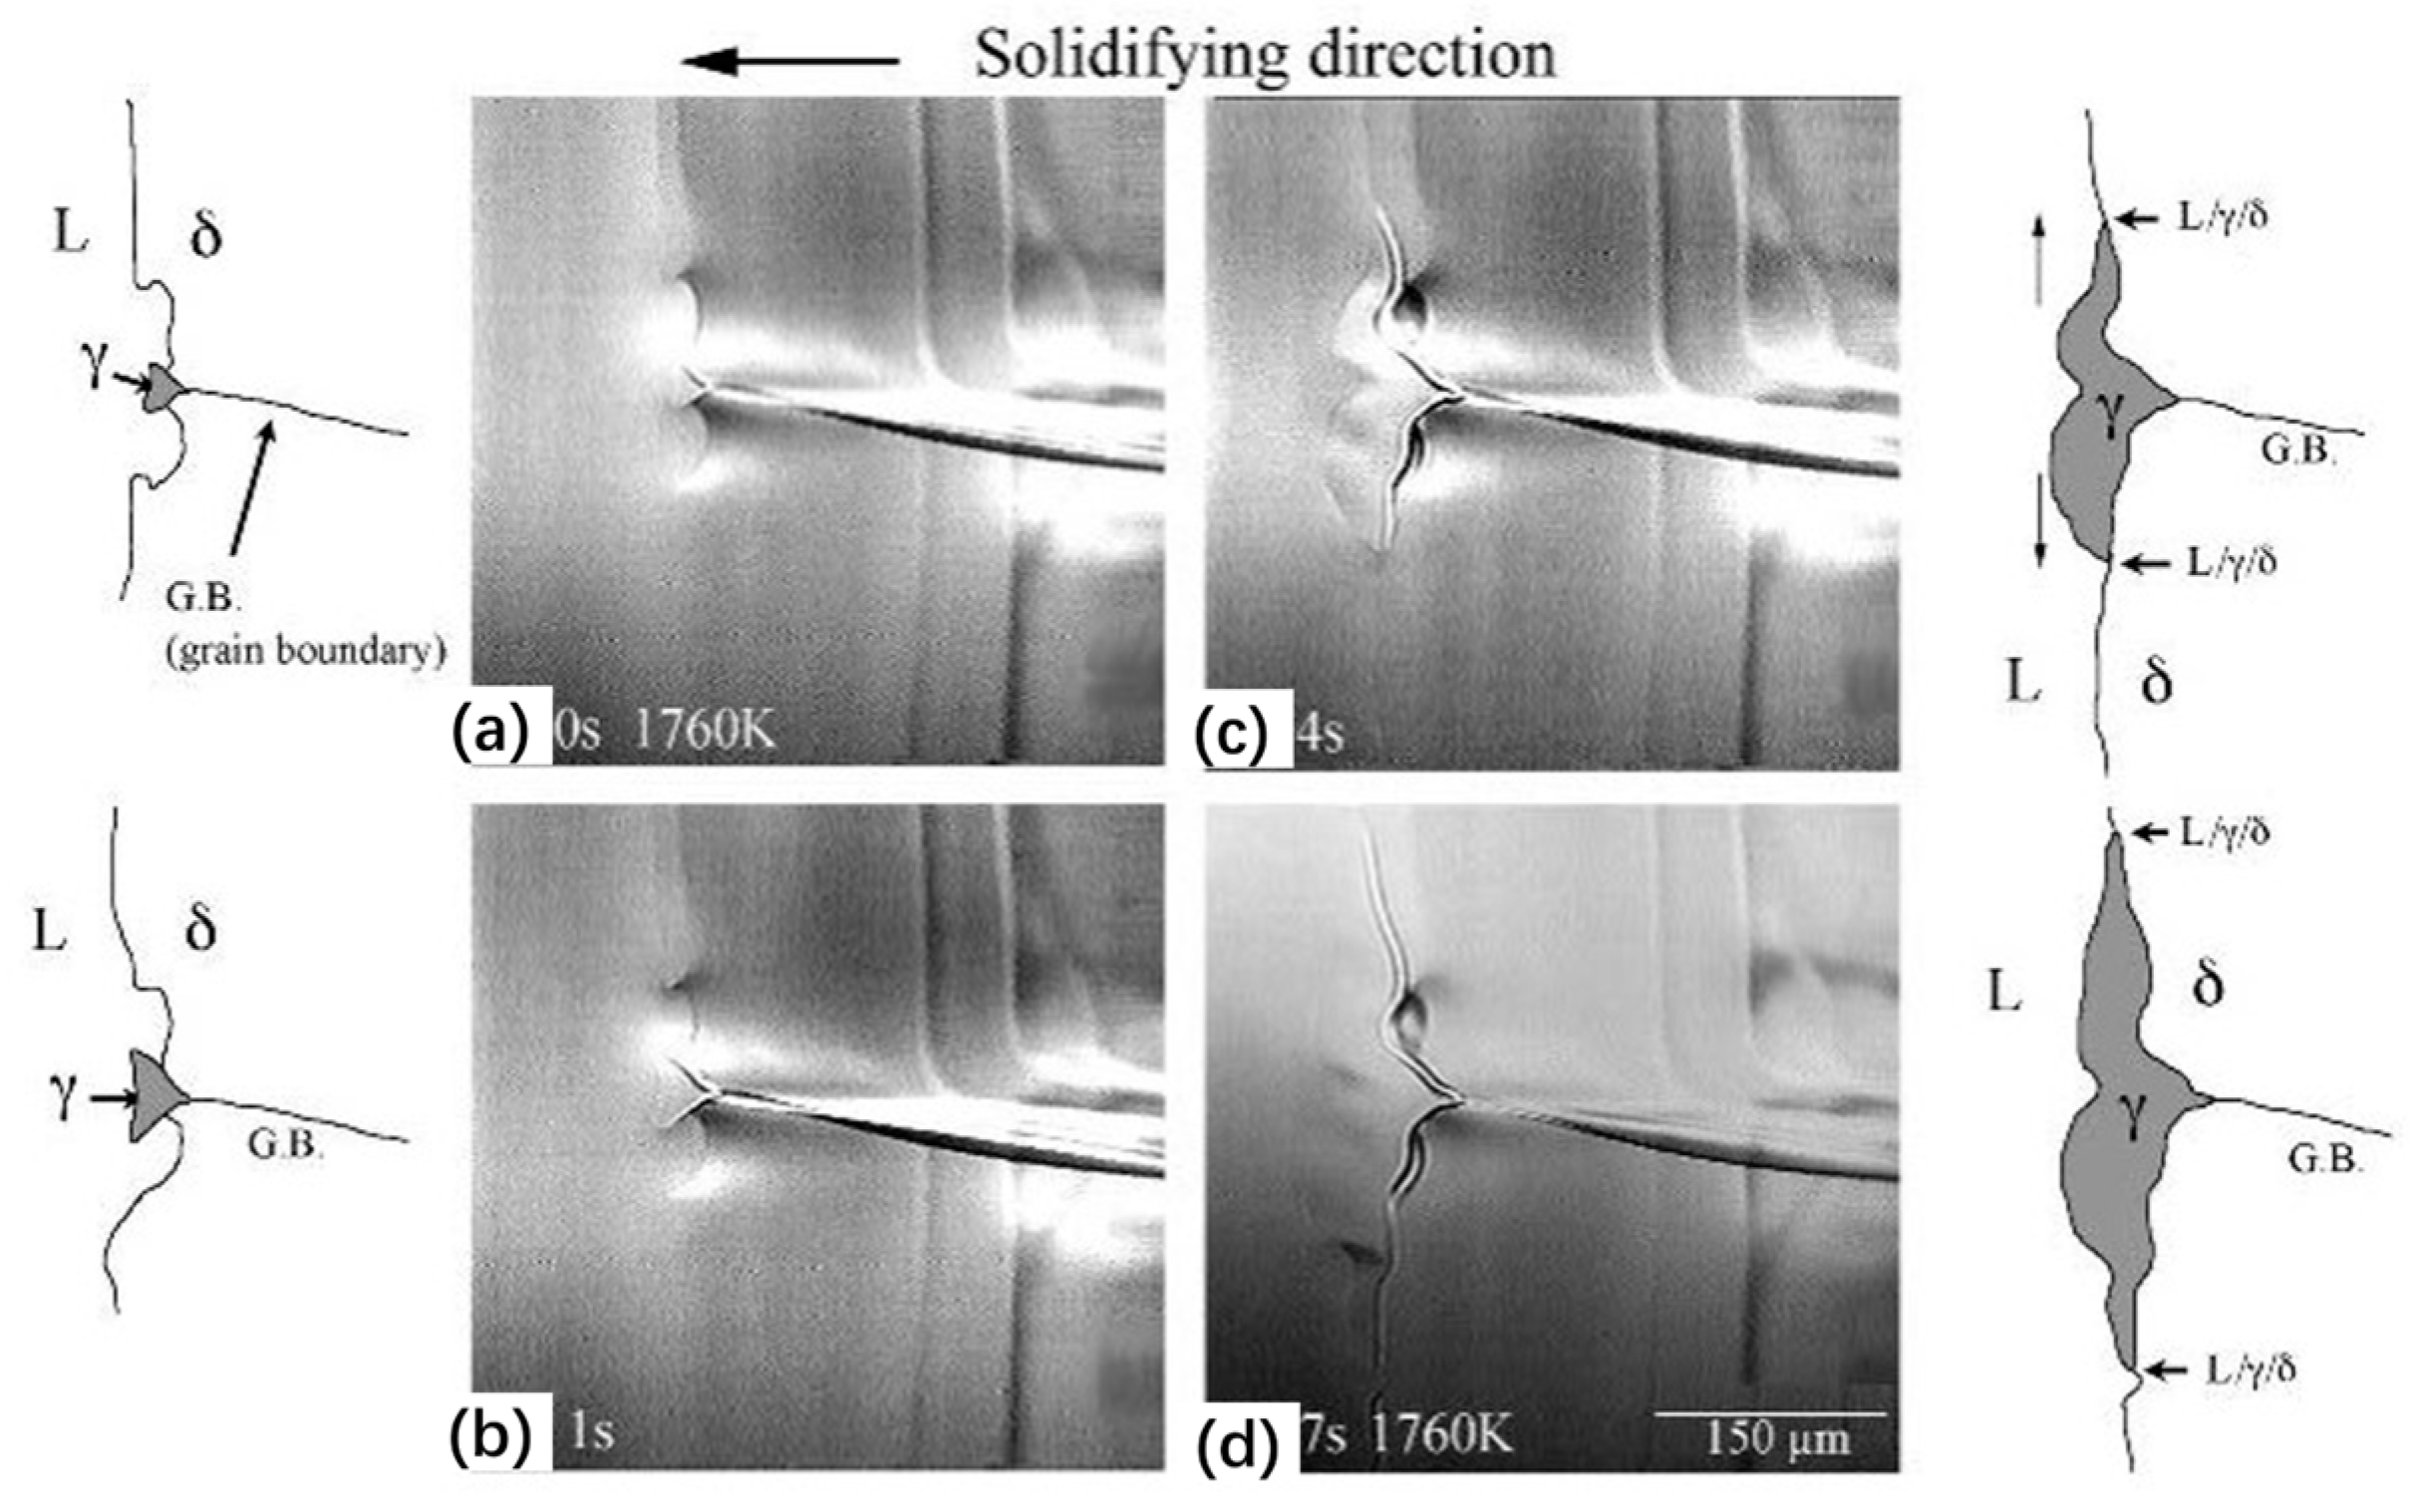
As we know, the primary δ-ferrite phase reacts with residual liquid (L) to produce a γ-austenite phase by peritectic solidification, which is one of the most commonly observed phenomena in low-alloy steels. Generally, the solidification occurs in two distinct stages involving the peritectic reaction (L + δ→γ) followed by the peritectic transformation (δ→γ) [10,81]. It is an extremely complex and challenging phase transformation to study either experimentally or mathematically. The mechanism of the peritectic solidification is illustrated in Figure 9a, where a partial rim forms at the L/δ interface boundary and wrinkles, and thereafter, an austenite layer grows along the L/δ interface by the advance of the L/γ/δ triple point, and finally, the γ-austenite encircles the δ-ferrite, driven by liquid super-saturation. Once the reaction is completed and all the L/δ interface is covered by γ, the δ→γ transformation starts. The peritectic transformation starts by thickening of the austenite layer immediately behind the tip of this advancing γ platelet, where it proceeds on two fronts, growing into both the liquid on one side of the platelet and the δ interior on the other [82,83]. Due to the peritectic reaction and transformation during the solidification of steels, significant volumetric contraction during the solid-state transformation of δ-ferrite to γ-austenite can lead to the detachment of the solidifying shell from the mold wall [84], which can cause cracks and break-outs of steel products. Steels that undergo the peritectic reaction are the most difficult to produce with respect to surface quality, especially at high casting speeds [18,85].
It is, therefore, perhaps most important to understand the iron-based alloys solidified in non-equilibrium processes. Conventional microstructure characterization after the solidification by quenching experimental cannot reveal the rate of the reaction. Techniques need to be developed for the in situ study of high-temperature phase transformations by HT-CLSM, which provides the ability to capture solidification processes in real-time, as well as observe and measure the morphology and kinetics of phase transformations. This technique can record the phase formation and transformation on the melt surface, which is illustrated in Figure 5b. The heat is extracted at the sample bottom, and thus, the melt gradually solidifies from the bottom to the top surface. Table 1 shows a comprehensive summary of HT-CLSM applications for the crystallization behaviors during the solidification process of low-alloy steels.
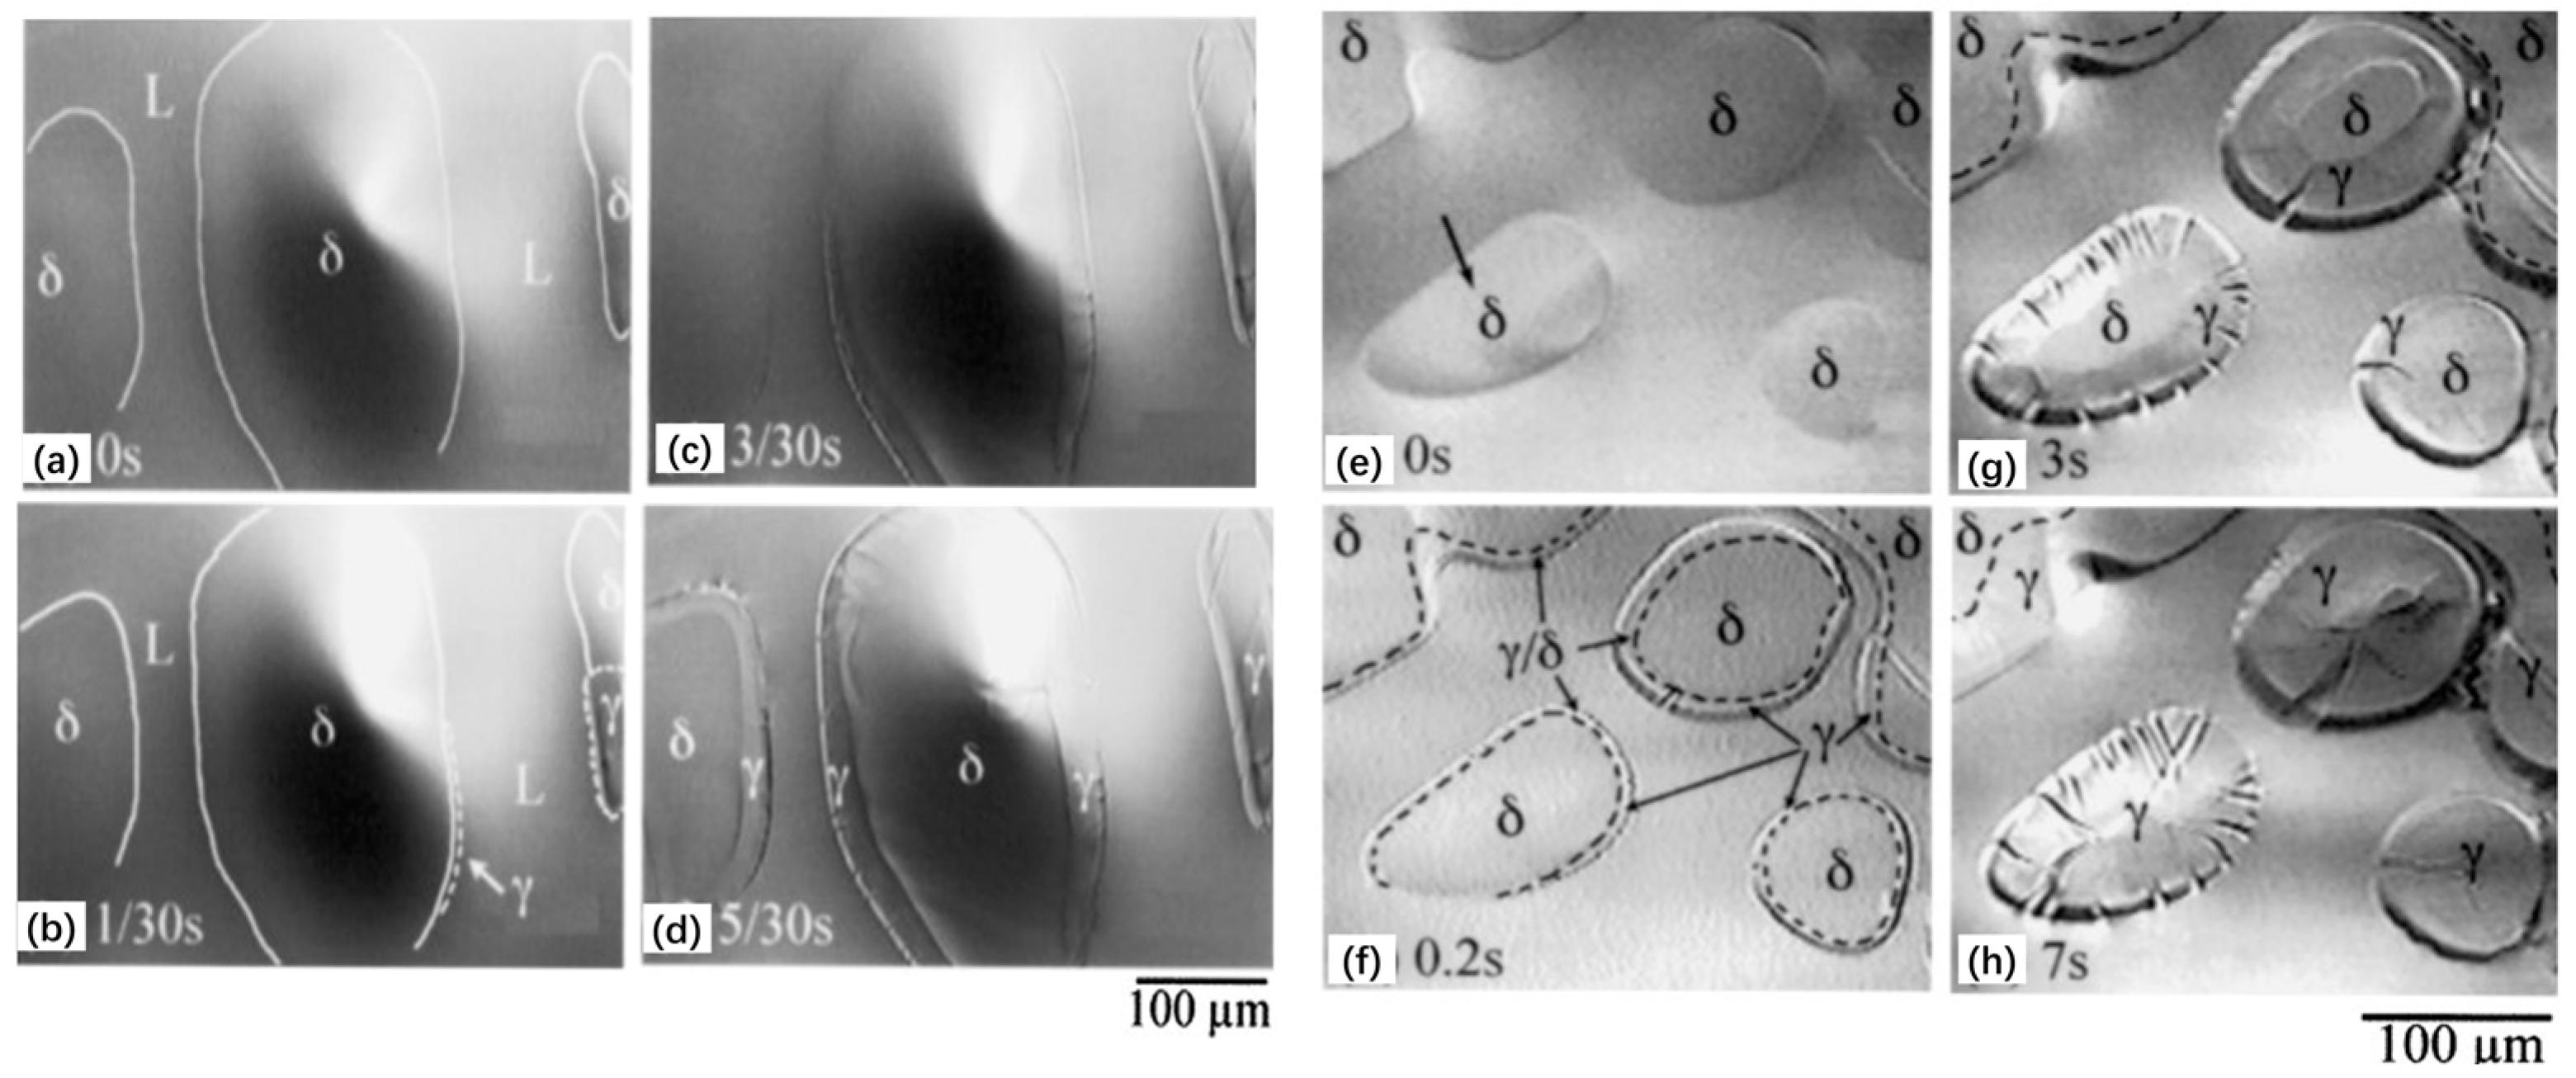
Shibata et al. [10] made significant contributions by providing new insights into the progress of the solidification of peritectic grade steels using the HT-CLSM technique. It should be noticed that the rates of the peritectic reaction and transformation were too fast, and low cooling rates were more recommended for the in situ observation. Figure 10 shows the typical peritectic reaction and transformation during solidification in Fe-0.14 wt pct C and also during isothermal holding in Fe-0.42 wt pct C steels. The results showed that elliptic island-like δ crystals firstly formed in liquid at the specimen surface at 1492 °C. Thereafter, γ austenite nucleated on δ-ferrite grain boundaries at the L/δ growth front and a thin layer of γ then progressed at a high rate along the L/δ interface (the peritectic reaction). Following the separation of solid δ-ferrite from the liquid by this thin layer of austenite, the γ austenite grew into the liquid and back into δ-ferrite, respectively (the peritectic transformations) (Figure 10a–d). The clear peritectic reaction and transformation can be observed during the isothermal holding process of Fe-0.42 wt pct C steel (Figure 10e–h). In addition, the γ phase at L/δ boundary grew much faster toward δ than toward L in both steels. They concluded that the growth of γ observed during peritectic transformations in Fe-0.42 wt pct C steel could be predicted by carbon-diffusion models. This finding is consistent with the mechanism reported by Kerr et al. [81], who proposed that the high rate of the peritectic reaction could be ascribed to the higher rate of diffusion of carbon in the liquid phase. Moreover, Ohno et al. [93] also reported the carbon diffusion-controlled mechanism of the peritectic reaction in carbon steel by means of quantitative phase-field modeling. However, the peritectic reaction was not controlled by diffusion of carbon but by either a massive transformation or solidification of γ phase direct from the liquid in Fe-0.14 mass pct C steel. This was different from those obtained by Matsuura et al. [94], who reported the reaction was controlled by diffusion of carbon, and by Fredriksson [95], who reported that it was controlled by the concentration difference.
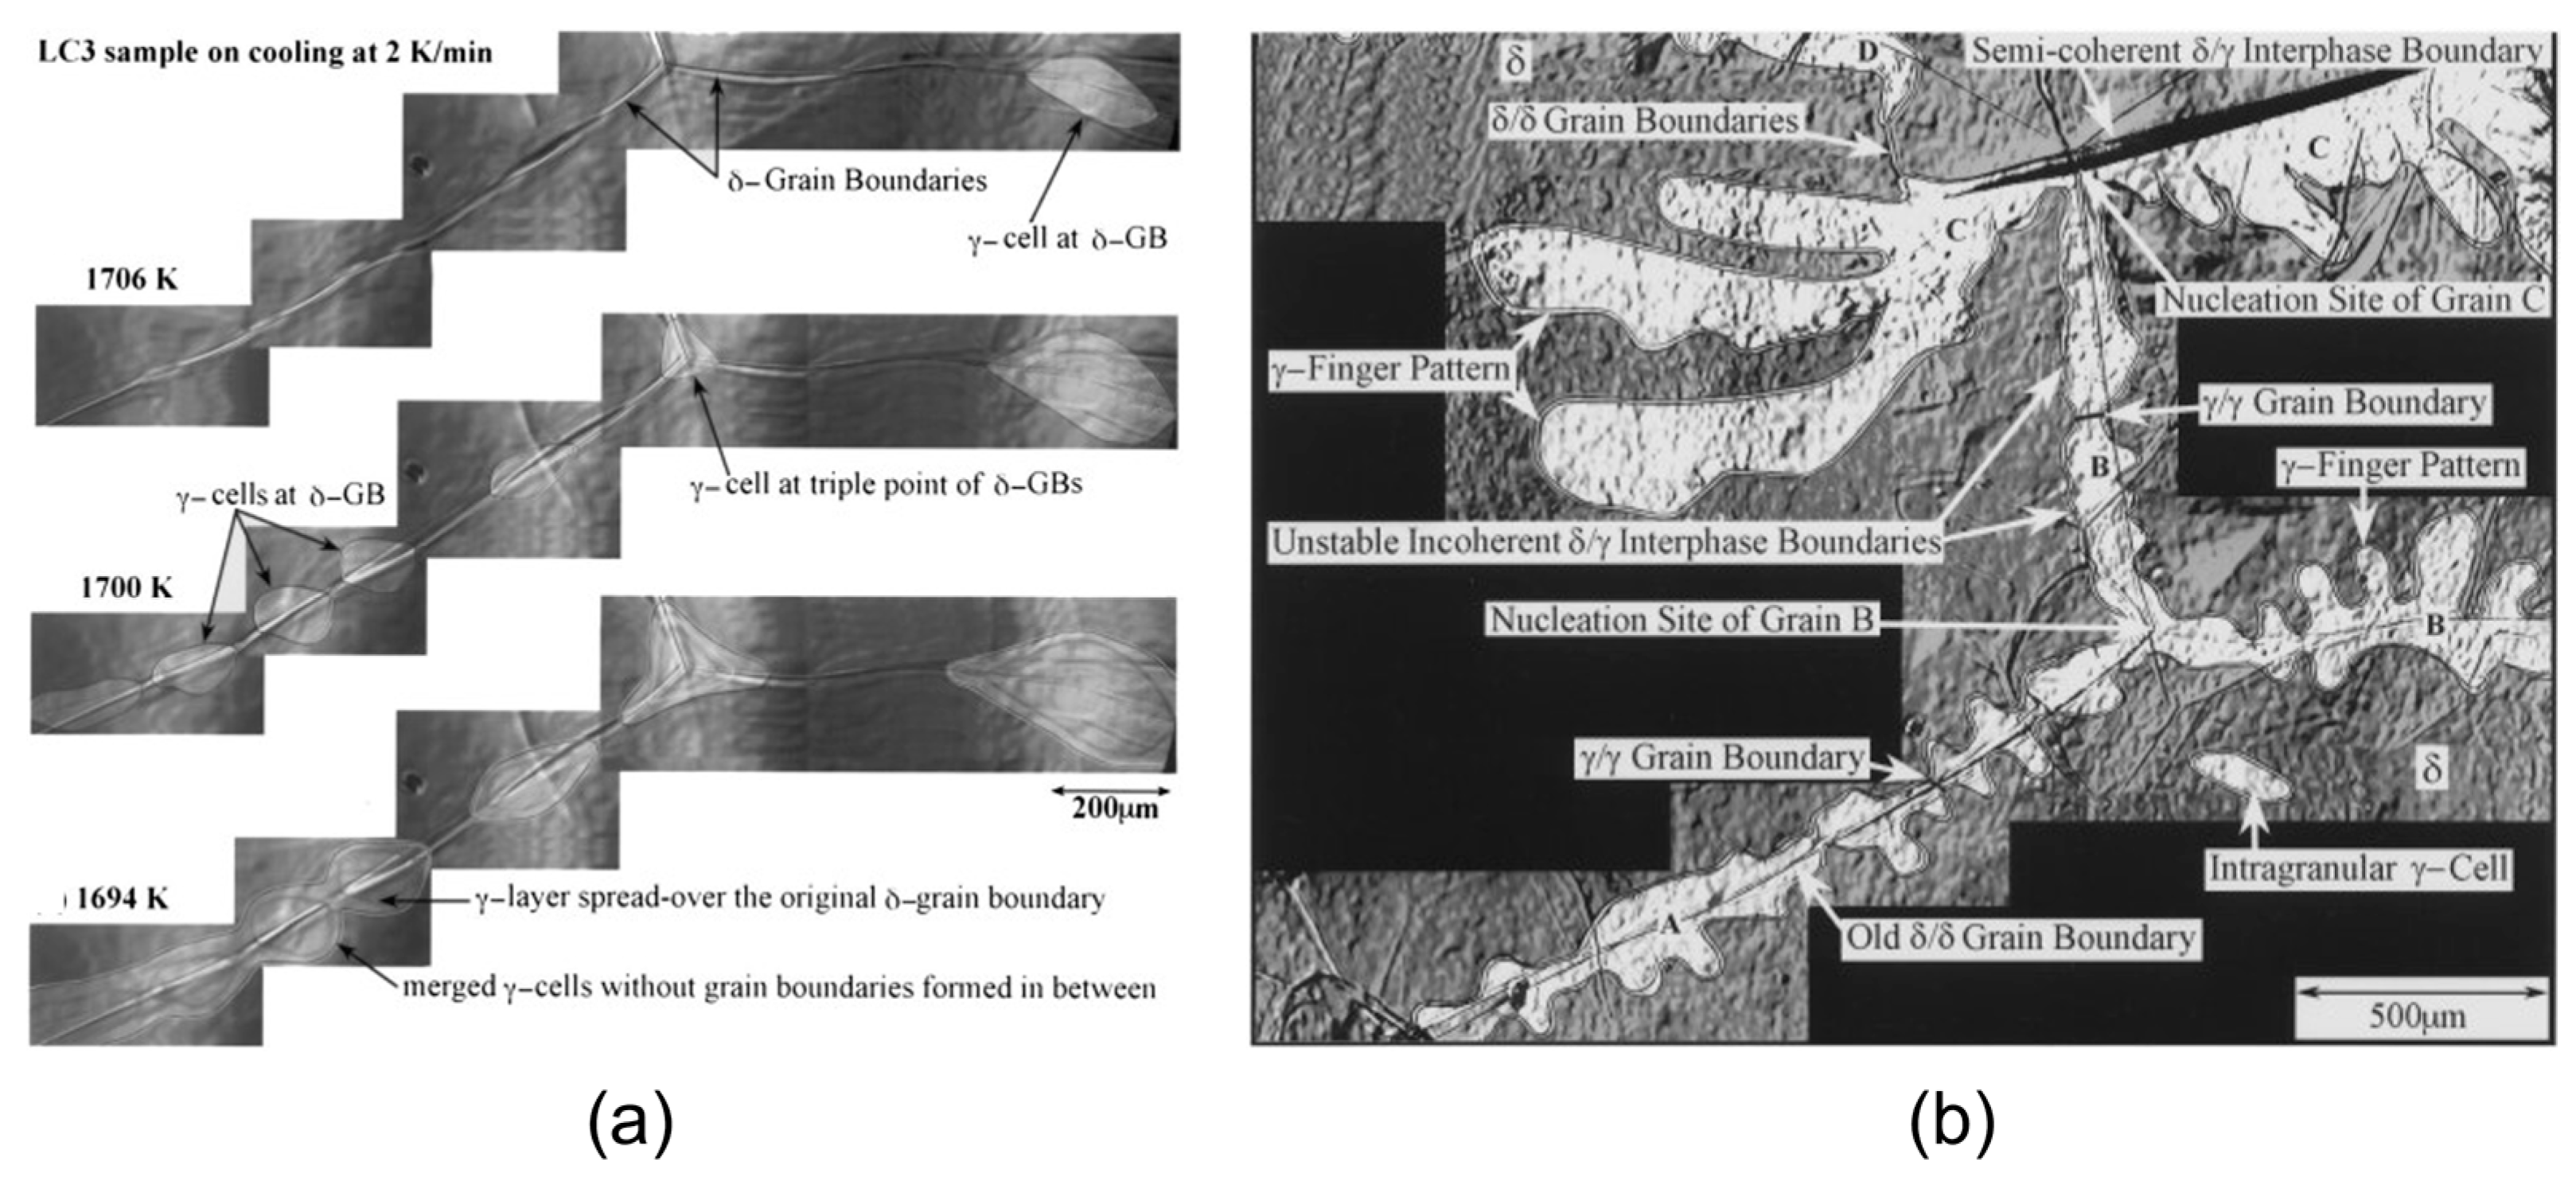
The propagation of the γ phase was also briefly described by Shibata et al. [10], and this phenomenon was systematically analyzed by Yin et al. [12,87]. Figure 11 shows the nucleation and growth of the γ phase in the δ-matrix during the δ→γ transformation process. It was found that the appearance of the γ-phase in the δ-matrix at the very beginning of the δ→γ transformation was always observed like cells at the triple point of δ-GBs (TP cell) or at δ-GBs (GB-cell) on the sample surface when critical supercooling was small at a low cooling rate. On further cooling, the cell grew along the δ-GB, and the number of γ-cells in δ-GBs increased (Figure 11a). After the nucleation of the γ-grain at the TP of δ-GBs, the growth of the γ-grain was always observed quicker at the δ-GB on cooling. The initial γ-grains had a strong tendency to spread over the whole δ-GBs and form a thin layer on both sides of the original δ-GB at a low degree of supercooling (<7 °C). At a higher supercooling, this process became much faster, i.e., almost all of the δ-GBs were covered by four large γ-grains (Figure 11b). Additionally, near-round g-cells were also observed, denoted as intragranular cells, and were frequently observed at higher supercooling. Moreover, the transformation process of γ→δ during heating was also analyzed, and it was found that the γ/δ interphase boundary was always observed in planar morphology when moving at a normal speed, which cannot be affected by the degree of the superheating, grain size of the δ-phase and diffusion field.
One of the interesting observations they made was that a growing planar δ/γ interface can degenerate into an unstable growth morphology, as shown in Figure 11b. They proposed that this morphological development could be explained by the application of the Mullins-Sekerka type stability analysis [96]. Phelan et al. [22] made an attempt to further investigate the morphology of the δ to γ phase transition, the results are presented in Figure 12. They reported that a network of sub-boundaries had formed within the δ-ferrite grain. Additionally, their formations were closely related to the steel compositions, where sub-boundaries were extremely faint and difficult to observe as reported by Yin et al. [87]. Here, γ grew preferentially along the δ-ferrite grain boundaries, forming a type of “film”, and the subsequent growth of γ was preferentially along the δ-ferrite sub-boundaries. Moreover, the presence of the sub-boundaries can explain the generation of intragranular austenite islands that merge with the grain boundary austenite.
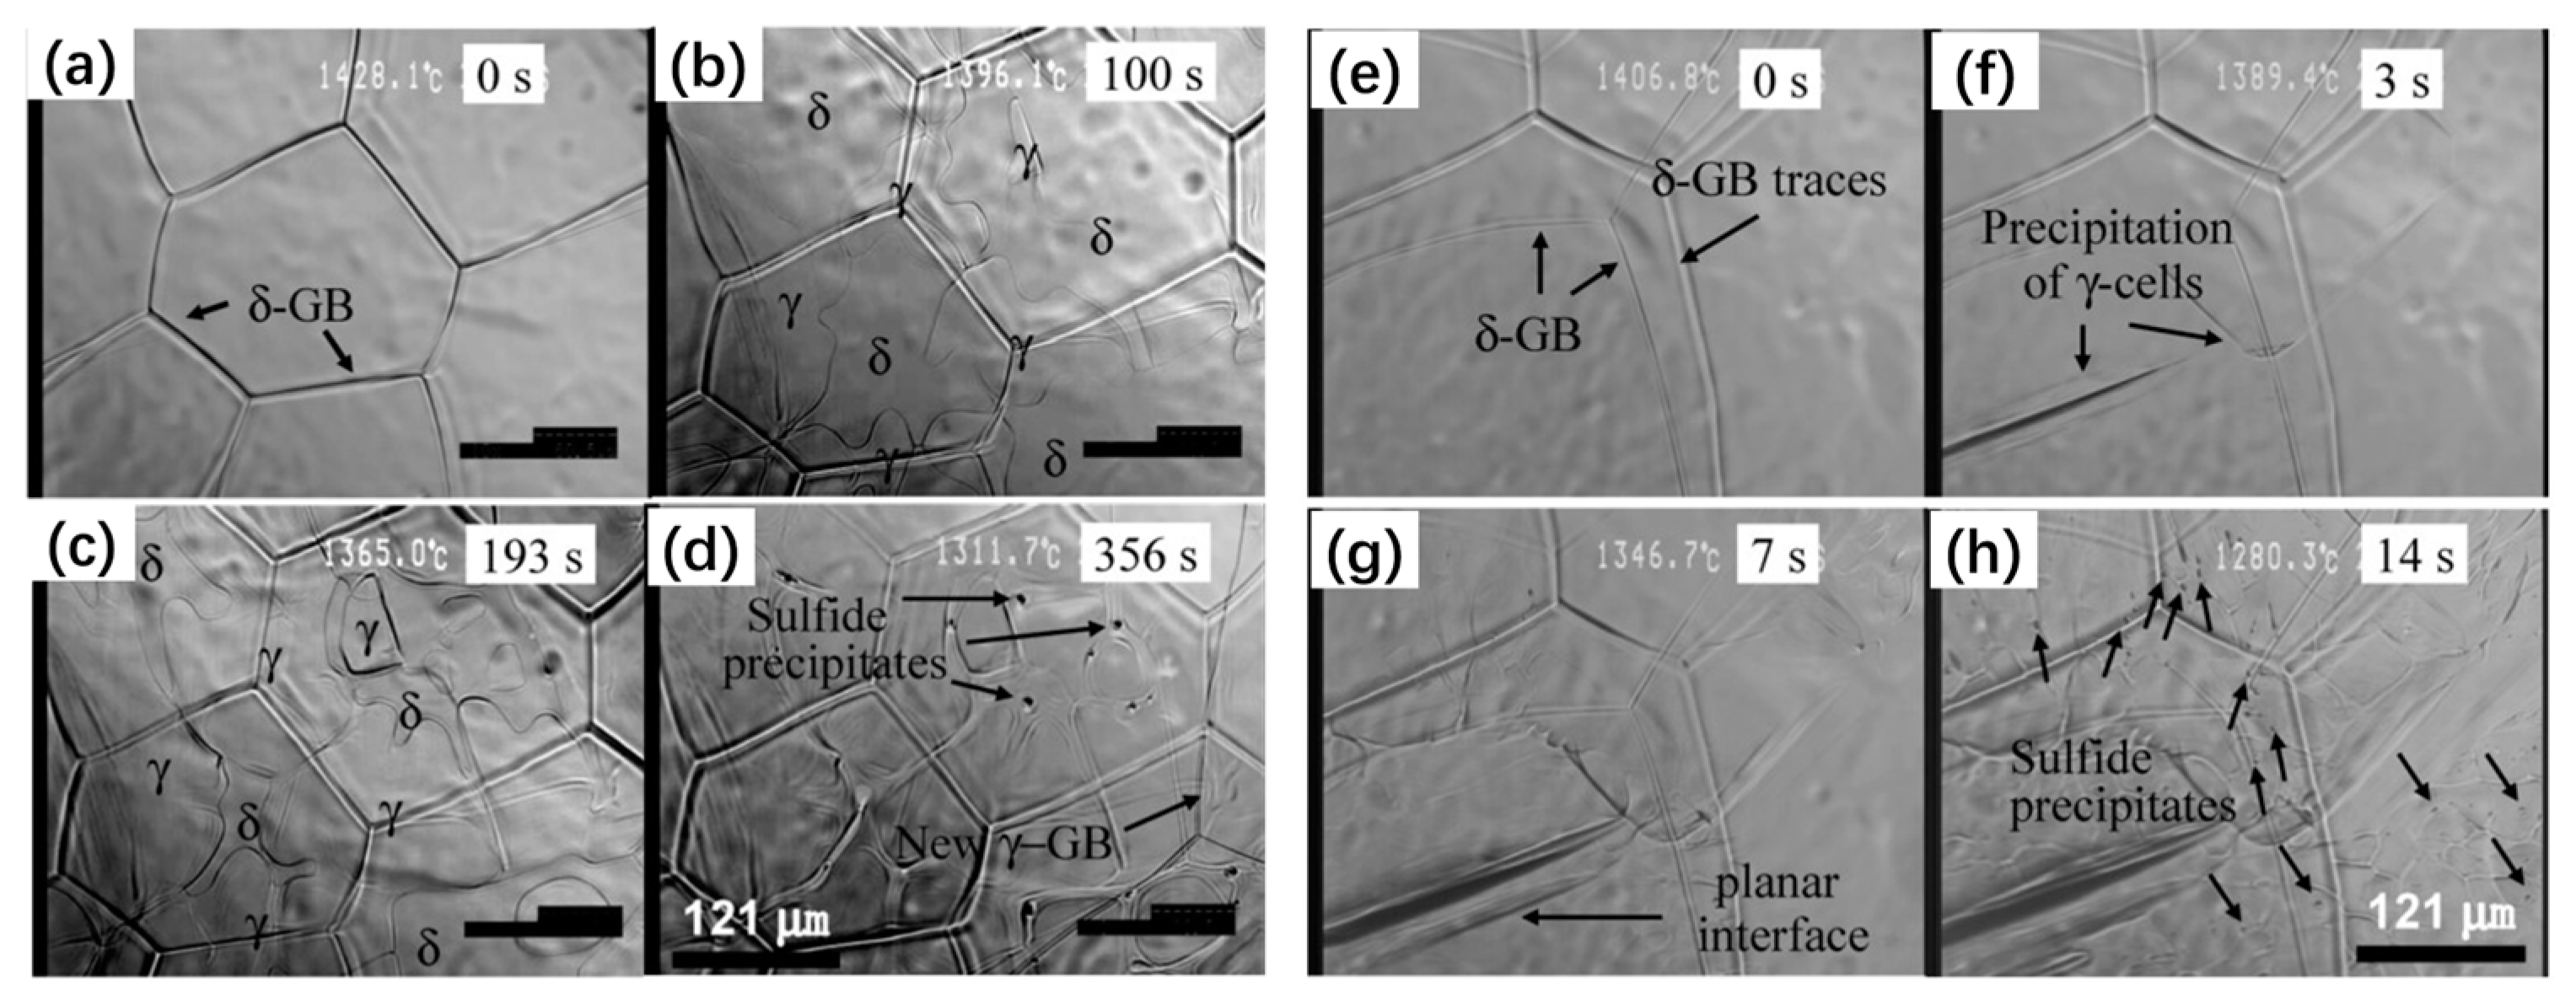
Nucleation, growth and morphology of the precipitate phase during the phase transformation of metals and alloys are all considered to be primarily controlled by interfacial free energy between the precipitate and matrix. When an incoherent secondary phase precipitates at a matrix phase, the interfacial free energy can be calculated after measuring the dihedral angle at a triple point when the system reached equilibrium. Therefore, Yin et al. [12] also successfully applied the HT-CLSM technique to measure the dihedral angles at triple points under quasi-equilibrium in low-carbon steels. It was found that the temperature did not affect the dihedral angle. In addition, the interfacial free energy of the incoherent γ/δ interphase boundary can be reduced greatly by increasing sulfur in low-carbon steels. The obtained interfacial free energy of δ/γ interface boundary was 0.45 J/m2 and 0.6 J/m2 in this low-carbon steel and a Fe-Ni alloy, respectively [88]. Similarly, the effect of phosphorus and cooling rates on the δ→γ transformation in low-carbon steels was studied by Liu et al. [89]. They reported that the δ →γ transformation started at a lower temperature in the high-phosphorus steel, and the transformation process was clearly slower than that in the low-phosphorus steel, especially in the last stage of the transformation process. Moreover, they claimed this was due to the redistribution of phosphorus from the γ phase to the δ phase. The δ→γ transformation processes at low and high cooling rates are presented in Figure 13. In the case of a slow cooling rate (0.33 °C/s), the γ-cells appeared first from the triple points of the δ-ferrite grain boundaries (hereafter abbreviated as δ-GBs) with a trihedral shape, then with a dihedral shape from the δ-GBs and followed by spreading with finger-like patterns. The speed of spreading along the δ-GBs was usually quicker than that of growing into the δ-ferrite matrix, which agreed with the description by Yin et al. [12,87] and Reid et al. [19,97]. Conversely, at a high cooling rate (10 °C/s), the γ-cells appeared first from the δ-GBs with sword-like patterns, and spread sharply into both sides of the initial δ grain boundary. The undercooling for the δ →γ transformation increased with the cooling rate.
Except for the low-carbon steels, Fe-Ni alloys are also known to have a peritectic range of around 4 to 5 at. pct Ni. Pioneering contributions were made earlier by Fredriksson and Stjerndahl [98], who predicted the rates of peritectic reaction and peritectic transformation in Fe-Ni alloys. Arai was the first to apply the HT-CLSM device to observe in situ the real-time lateral growth of γ during the unidirectional solidification of Fe-Ni alloys in a rectangular crucible [99]. This was followed by McDonald and Sridhar [88], who investigated the peritectic reaction rate of a hypo peritectic Fe-4.2 mass pct Ni alloy and a hyper peritectic 4.7 mass pct Ni alloy in more detail, and they reported that two stages of the peritectic transition involving the liquid phase could be observed—the reaction, where γ grew along the δ-ferrite/liquid boundary, and the direct solidification of γ in liquid. It was found that, for both the hypo peritectic and hyper peritectic alloys, the reaction rate increased with increased undercooling, and the solidification rate was found to be a function of local-temperature gradients rather than undercooling. Some austenite precipitated directly out of the liquid ahead of the solid/melt interface at larger undercooling. This was due to the fact that the bulk melt was experiencing a greater ∆Tundercooling (hence, driving force) than the solid/liquid interface. Moreover, heat transfer controlled the final stage of the peritectic transition, namely, the solidification of austenite.
Later, Arai et al. [11] further studied the peritectic reaction and transformation in Fe-Ni alloys; they found that the Fe-3.67 mass pct Ni alloy solidified as planar primary δ, and transformed into γ during cooling and the γ phase grew in cellular morphology toward the L/δ interface. In the Fe-5.10 mass pct Ni alloy, the γ phase was observed to form mostly at a triple point of liquid and a δ/δ-grain boundary at the early stage of the peritectic reaction. The γ phase continued to develop until it covered all the liquid/δ interface while it increased its thickness toward both liquid and δ. The typical growth of γ phase at L/δ interface in the early stages of the peritectic reaction in this alloy is shown in Figure 14. Further cooling resulted in the rapid preferred growth of phase along δ/δ-grain boundaries. These characteristics are quite similar to those that have been observed previously for the hyper peritectic Fe-0.42 mass pct C alloy by Shibata et al. [10] and the hypo peritectic and hyper peritectic Fe-Ni alloys by McDonald and Sridhar [88]. However, γ grew about 10 times faster in liquid than the δ phase during the peritectic transformation stage, which was opposite to the results reported in previous works [10]. The Fe-5.25 mass pct Ni alloy solidified in many cases as the stable γ phase, but in some cases with the metastable δ phase as the primary phase. The metastable δ phase underwent a peritectic reaction, with the lateral growth of γ along the L/δ boundary, and transformed into cellular γ very rapidly. The measured lateral growth rate (peritectic reaction) increased from 30 to 145 µm/s with an increasing cooling rate, which was much smaller than that in Fe-C alloy. It was attributed to the much smaller diffusivity of Ni in the Fe-Ni alloy compared to C in the Fe-C alloy. A similar phenomenon was observed by Griesser et al. [91], who clearly showed that the γ phase was located predominately in the δ-phase in Fe-C system, whereas the growth of γ phase mainly occurred in the liquid phase in the Fe-Ni system, respectively.
Although the HT-CLSM technique has been widely applied for the in situ investigation of liquid-solid, solid-solid transformations during the solidification of alloys and steels, it also has its limitations as the formation of a pronounced meniscus in liquid metals, which results in a localized region of brightness, and therefore, caused a limited field of view. In addition, the HT-CLSM can only observe the surface phenomena of the sample. Hence, whether the observations on the sample surface can represent the bulk sample is unknown. In order to overcome these limitations, Reid et al. and co-authors [19,21,90] firstly improved the in situ HT-CLSM observation by using the concentric solidification technique, which has been described in detail in Section 2.2.1. The most notable advantage compared to the conventional HT-CLSM is that it has minimized the curvature resulting from the meniscus effect, which resulted in the ability to have good focus across a solid-liquid interface and almost equal light intensity. Additionally, observations on the sample surface are likely to be representative of bulk behavior due to the fact that the very thin sample is used in the concentric solidification technique and the temperature gradient in the thickness direction of the sample can be negligible.
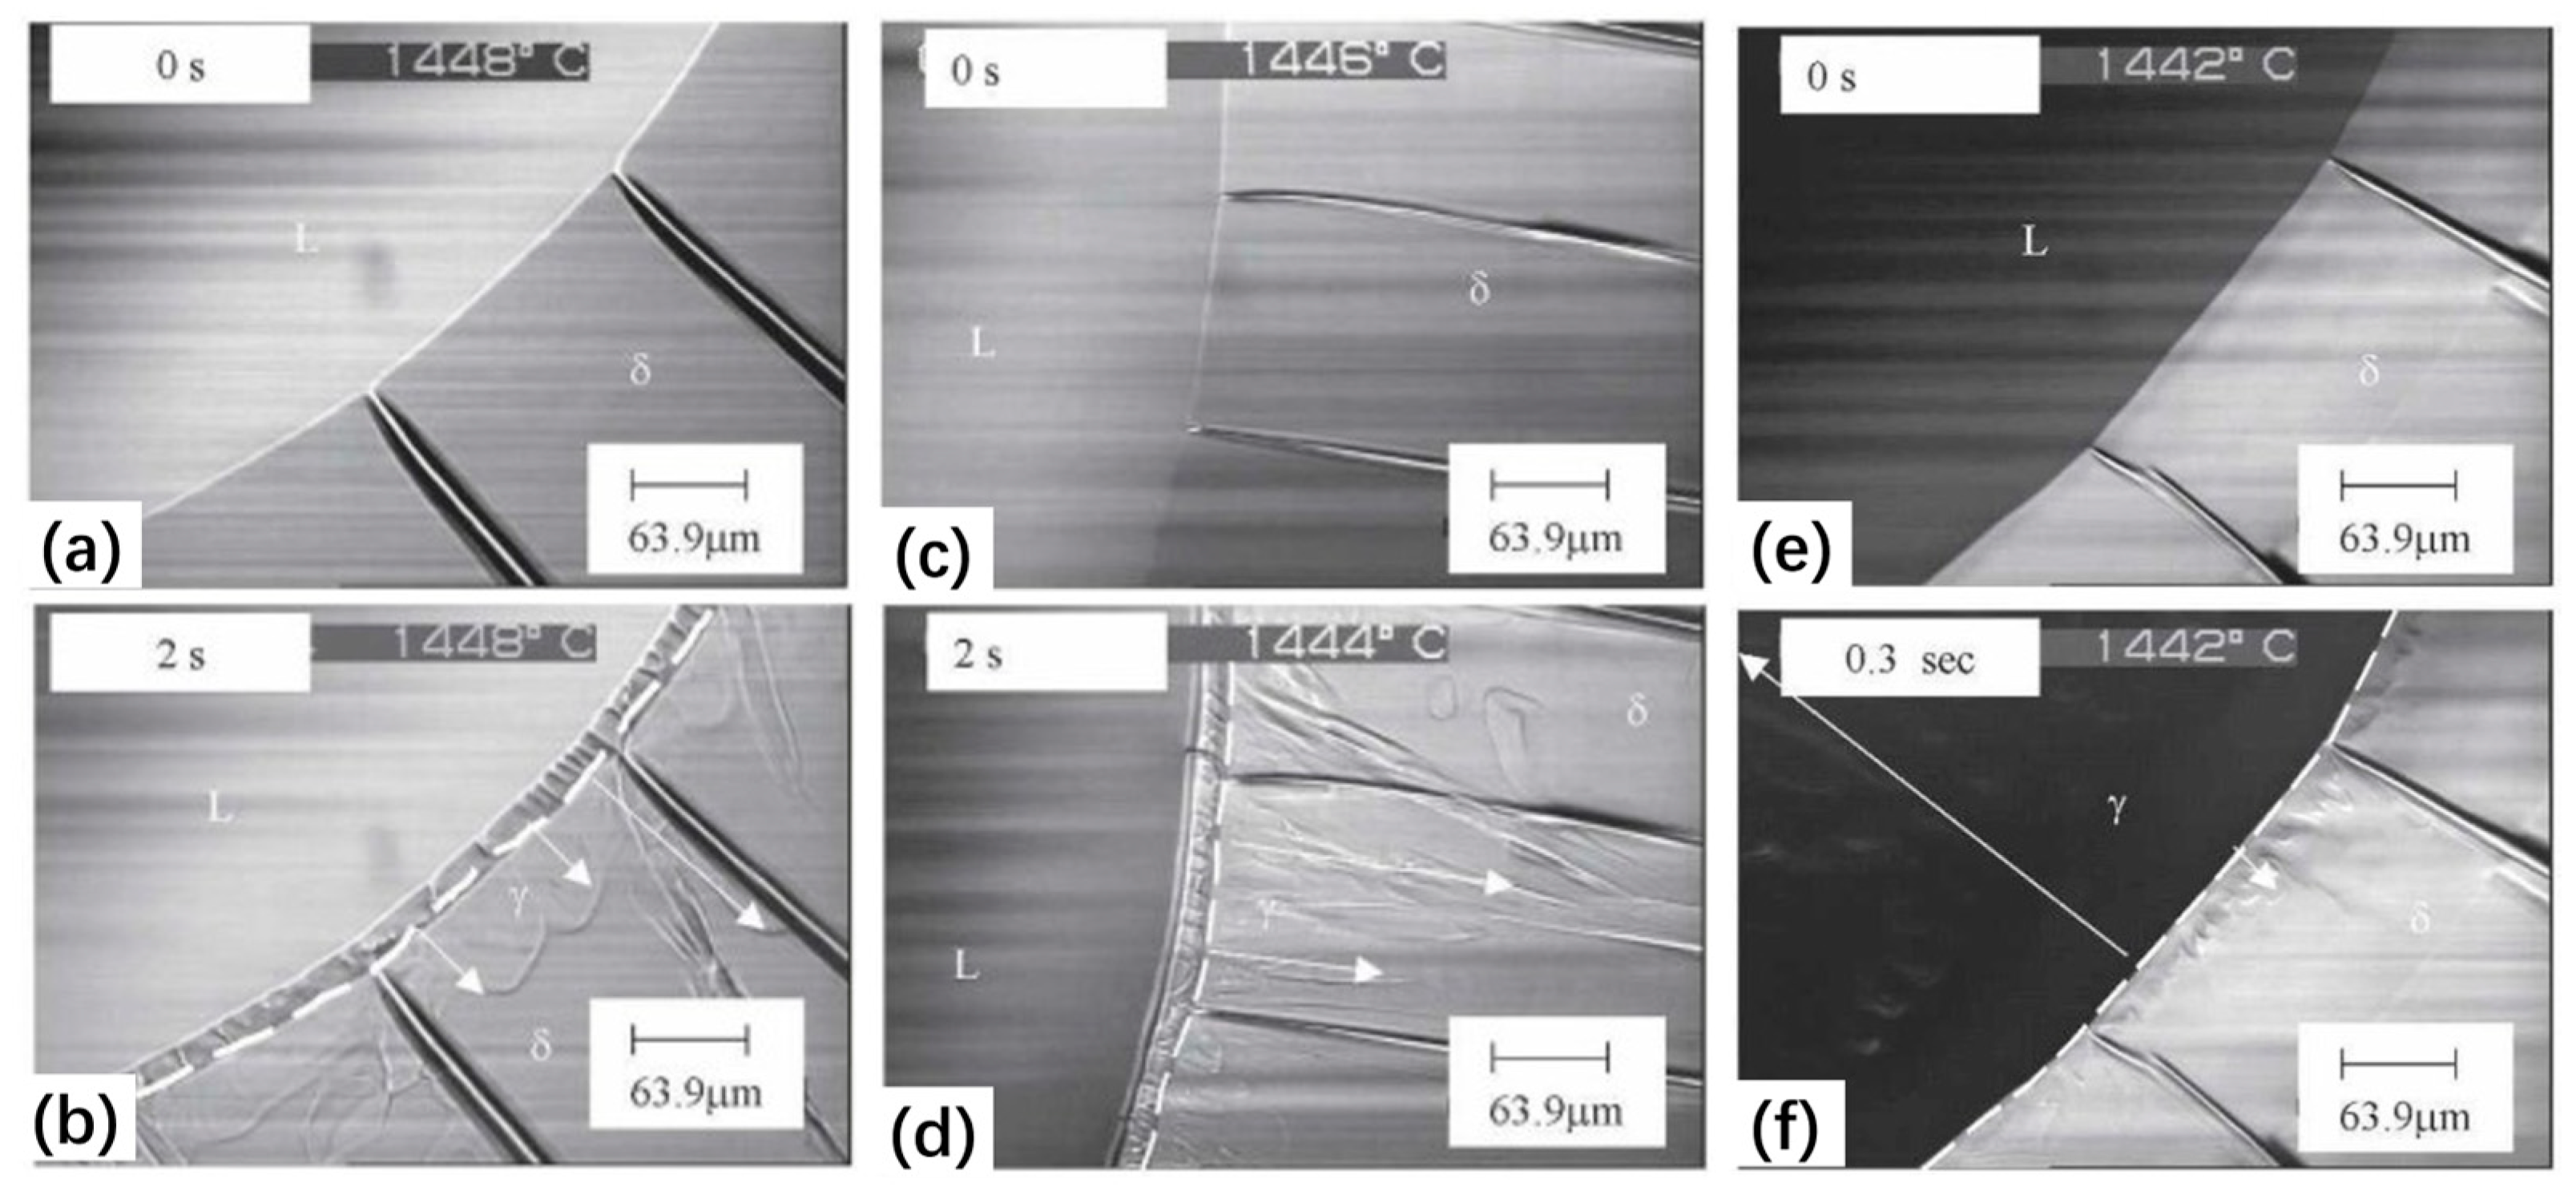
Using this technique, the peritectic transformation rate as a function of cooling rate can be determined to a high degree of accuracy. Phelan et al. [21,90,100] systematically studied the role of cooling rate on the kinetics of the peritectic phase transformation in a Fe-C alloy. The typical observations of peritectic reaction and transformation under different cooling rates are shown in Figure 15. It can be seen that the L/δ interface had a planar morphology at both cooling rates of 10 K/min and 50 K/min. γ grew along the L/δ interface and the irregular γ/δ interface morphology was observed. The increased cooling rate resulted in an increased growth velocity of γ. A further increase in the cooling rate to 100 K/min was observed; the difference from the previous two cases was that the γ increase in the liquid phase was greater than that in the δ phase. The growth of the γ/δ interface occurred at a higher rate than the L/γ interface at a low cooling rate (10 K/min). However, the growth of γ at the L/γ interface showed a higher rate at the high cooling rate of 100 K/min. The increased cooling rate contributed to the larger concentration gradient in the liquid at the interface, which led to increased flux carbon in the liquid and resulted in a higher L/γ interface propagation velocity.
In addition, they firstly reported the re-melting of the δ phase ahead of the γ tip when the γ phase grew along the L/δ interface. It was generally accepted that the growth of γ during the peritectic reaction was determined by the rate of carbon diffusion in the liquid metal ahead of the growing interface. However, the remelting of δ phase played a crucial role in determining the kinetics of the peritectic reaction in the present study. In this case, they reported that the δ-ferrite ahead of the γ tip was melted by the latent heat release of γ solidification and immediately mixed with the liquid to form new γ. Therefore, they proposed a new mechanism that the peritectic reaction was controlled by the rate of heat dissipation released by the growing γ-austenite along the L/δ interface, rather than carbon diffusion.
Utilizing the newly developed concentric solidification technique, the nucleation behaviors of a newly forming intermediate phase by using the peritectic phase transition in Fe–C and Fe–Ni alloys were studied by Griesser et al. [23,24,91]. The effect of carbon content, alloy additions, cooling rate and the fraction of the primary δ phase that solidified before the peritectic reaction on the peritectic reaction and transformation were systematically analyzed. They reported that higher initial temperature led to a higher fraction of primary solidified δ, which, in turn, led to an increased rate of the subsequent peritectic phase transformation due to the higher thermodynamic driving force for the formation of γ. In addition, the occurrence of massive transformations under high nucleation undercooling was due to the fact that the Gibbs energy of the product phase was smaller than that of the parent phase for the same composition. This is the first time the reason for the massive transformation was clarified, which has also been observed in previous works [10,11]. They reported three different models which can clearly describe how the undercooling can affect the peritectic transformation, as shown in Figure 16. The peritectic reaction in a Fe-0.43% C steel occurred close to the equilibrium peritectic temperature with an undercooling of 2 K and a fraction of primary δ-ferrite of 0.23. Therefore, it resulted in the peritectic transformation with a planar interface morphology, which was related to a diffusion-controlled mechanism. Under the condition of undercooling of 3 K and the fraction of primary δ-ferrite of 0.81 in a Fe-0.18% C steel, it resulted in a higher driving force for the formation of γ and the peritectic transformation with a cellular/dendritic morphology, which was also related to a diffusion-controlled mechanism. With the increase of undercooling to 22 K, the fraction of primary δ-ferrite increased to 0.98 in a Fe-0.1 mass pct C steel. This led to a very steep concentration gradient of carbon in the δ-phase at the L/δ interface, and subsequently, led to the quick massive transformation from δ into γ. With the increase of undercooling, the situation became far from equilibrium. Similarly, the solidification behavior of steels with different carbon contents and cooling rates was compared by Moon et al. [26]. They found that the initial velocity of the liquid/δ interface decreased as the cooling rate decreased and the overall solute element content of steel increased in all steels. The increased cooling rate reduced the rate of solute diffusion into the liquid.
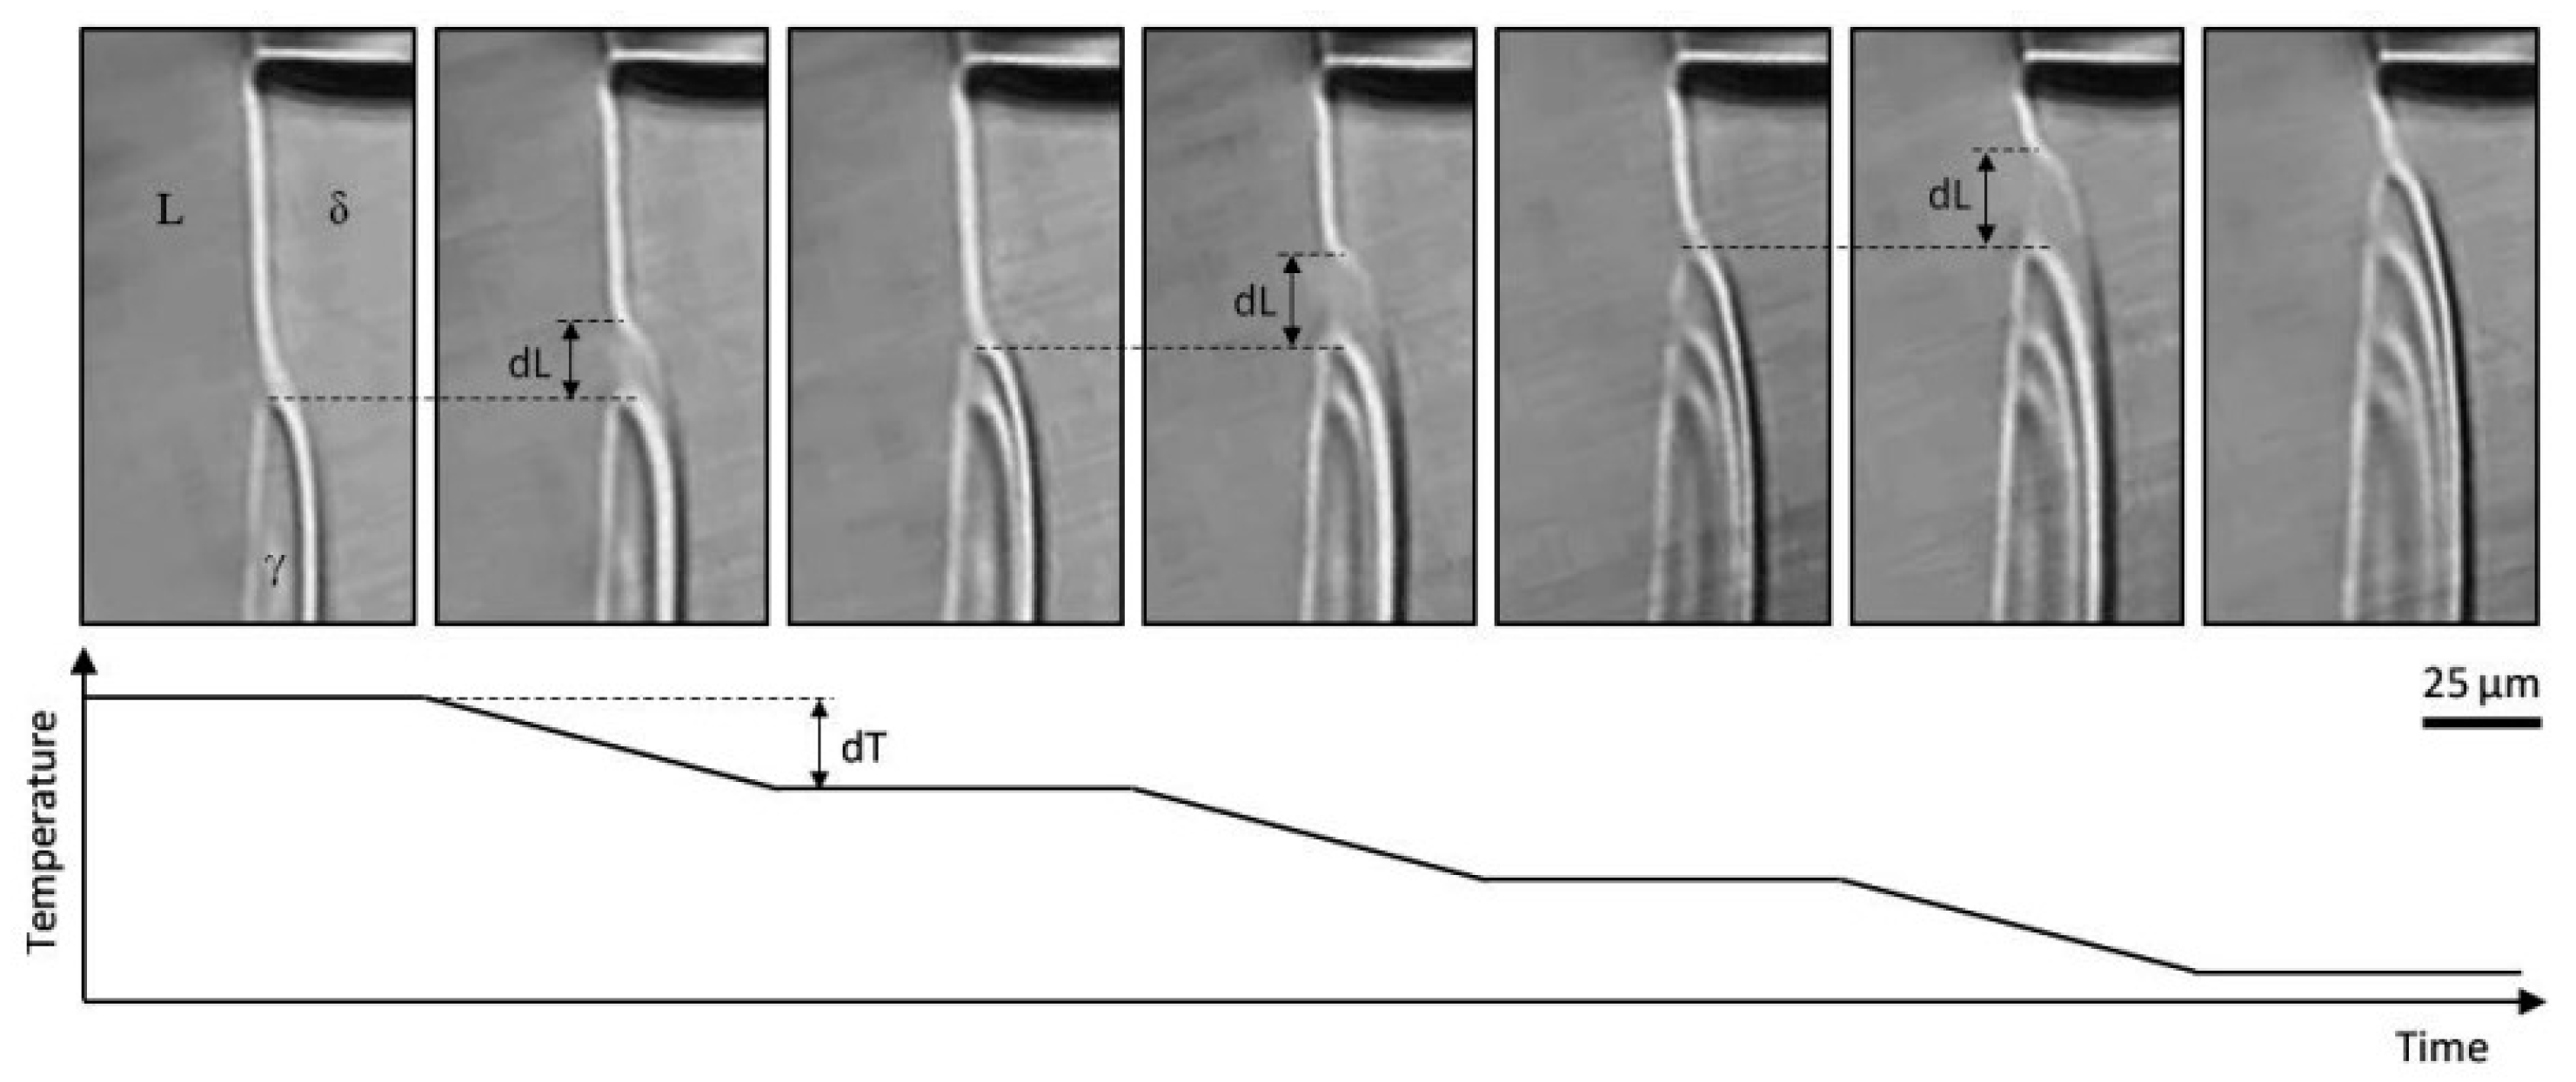
According to the above discussions, the mechanism of peritectic transformation varied with the equilibrium conditions. Therefore, a further study was conducted by the same group when the peritectic phase transition was very close to equilibrium conditions [91]. The remelting behavior of δ in front of the triple point L/γ/δ was observed during the peritectic reaction. This behavior was firstly investigated by the small incremental growth of γ caused by a small drop in temperature, as shown in Figure 17. It can be seen that when the temperature slightly decreased by dT, some amount of δ was remelted, while γ remained in a stationary position. Thereafter, the γ phase continued to grow into the re-melted gap when a certain length of dL of δ was remelted. The remelting behavior was also reported by other researchers [90,101], and they explained this by the dissipation of the latent heat of fusion released during the growth of the γ phase. However, this mechanism cannot be applied when the γ phase remained at a stationary position during the remelting of δ. Therefore, the solute diffusion mechanism was proposed to explain the remelting of δ.
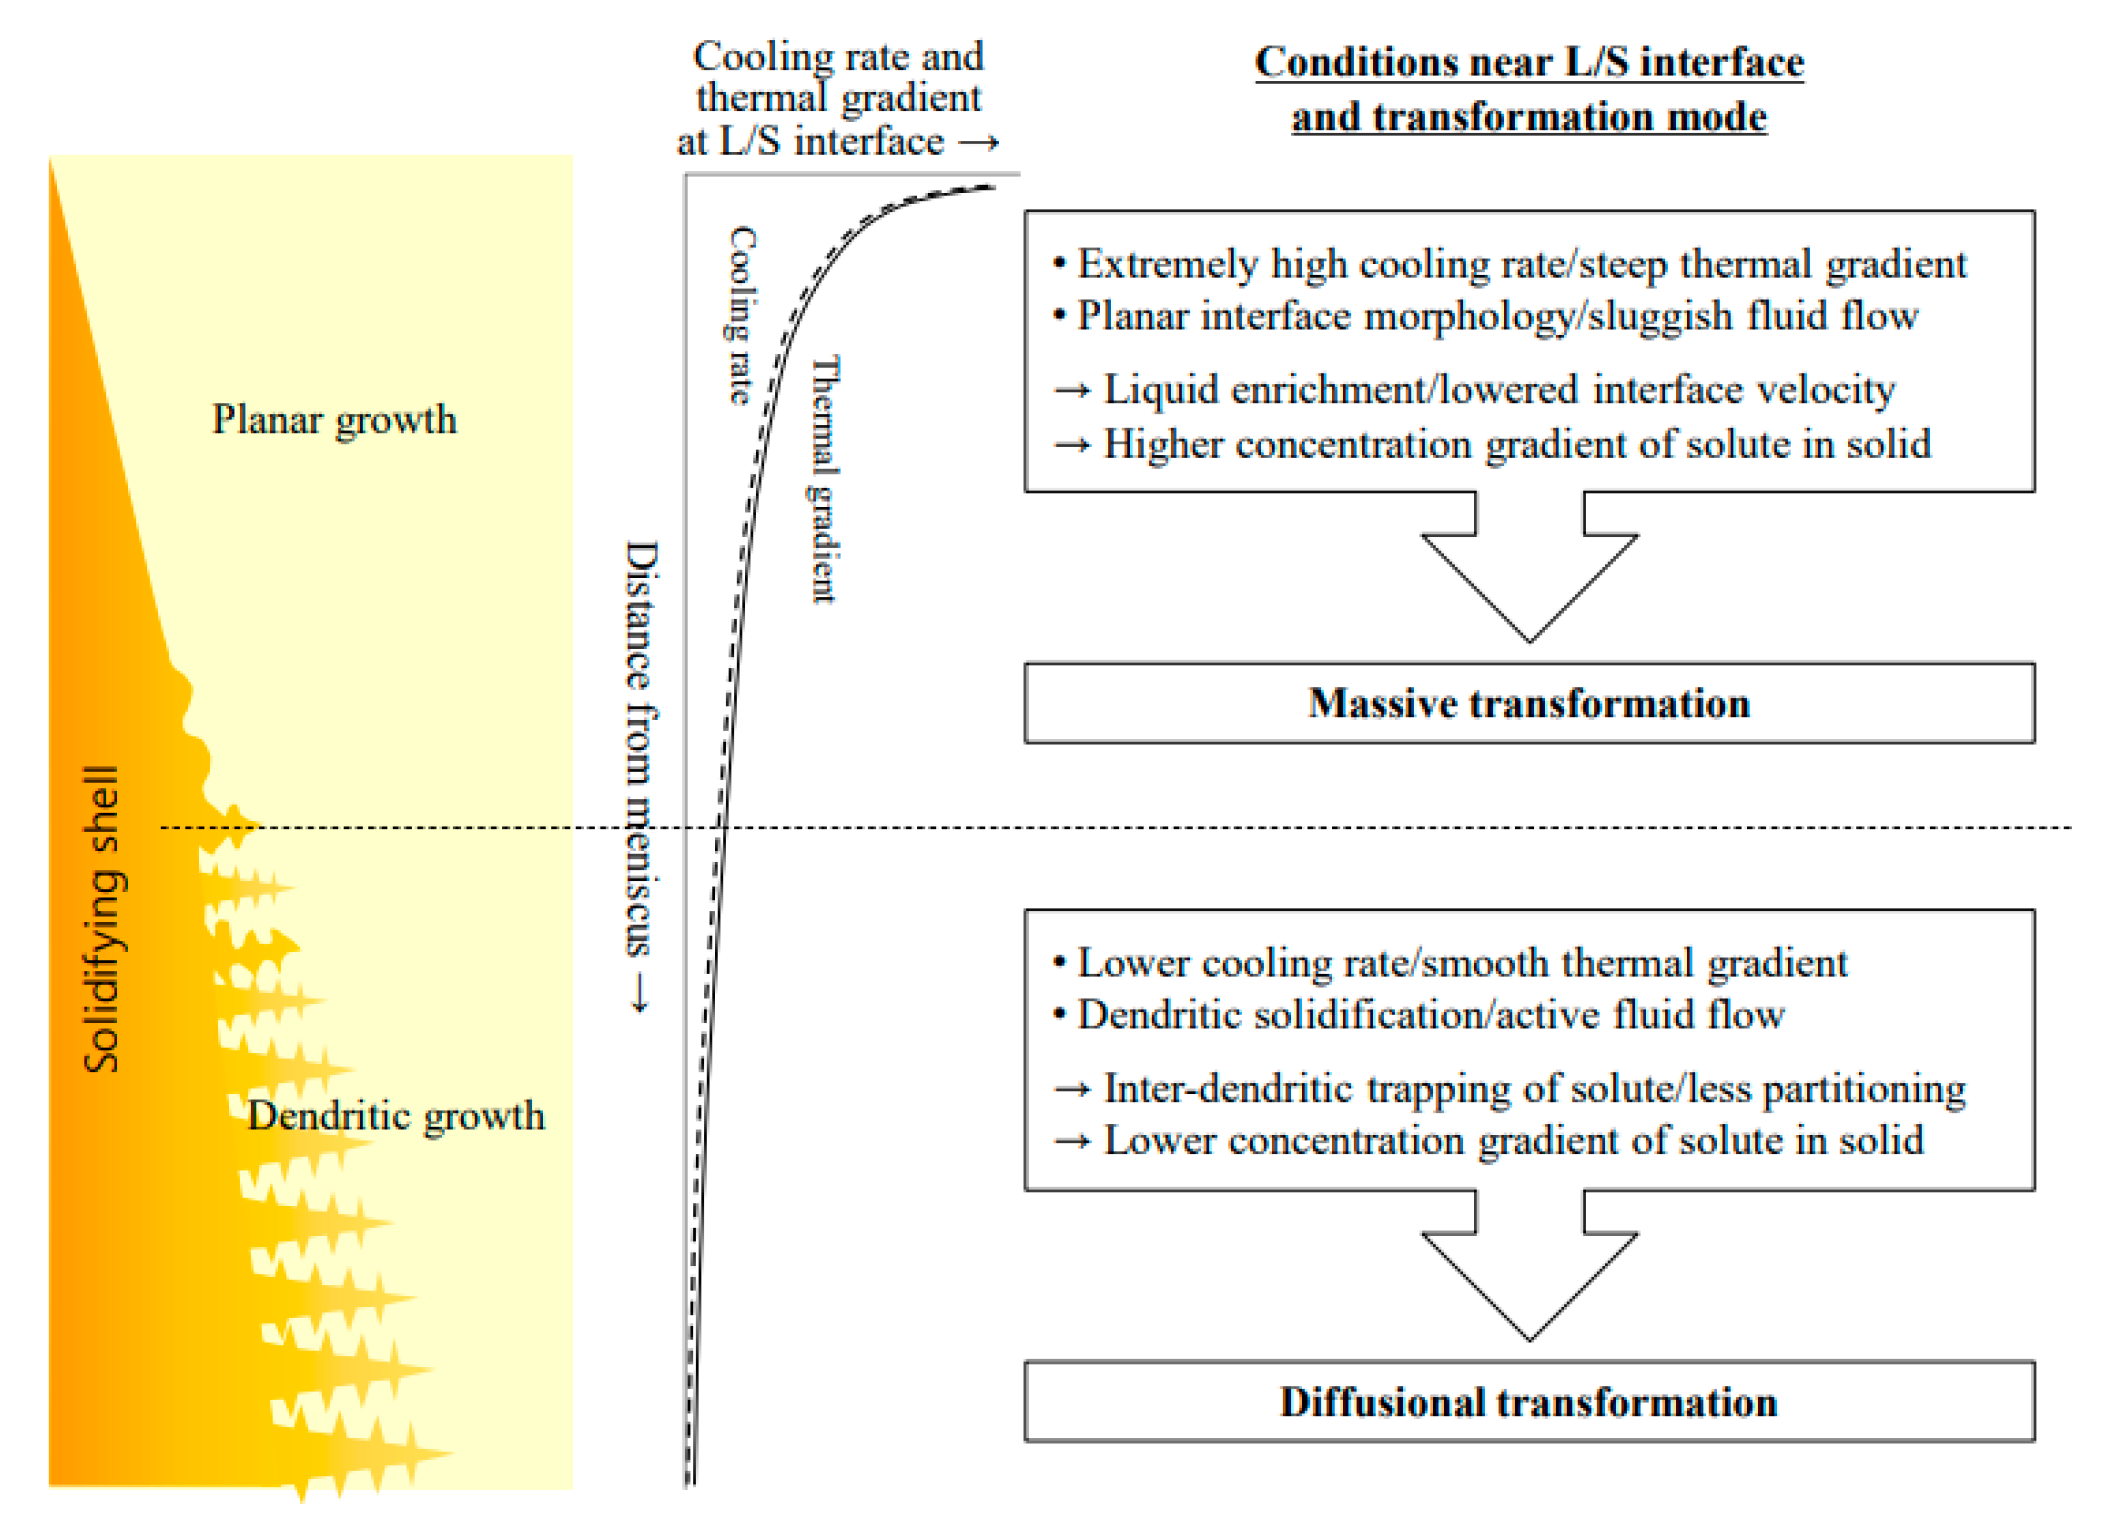
Based on their experimental finds, they oncluded that the peritectic reaction and transformation can be explained by a diffusion-controlled mechanism and the peritectic transformation is strongly influenced by the solute diffusivity in the γ phase under an equilibrium condition. Moreover, the solidification occurring close to equilibrium conditions was in agreement with classical nucleation theory (CNT) predictions. However, upon non-equilibrium solidification and in the presence of solute concentration gradients in the parent phase(s), the nucleation of an intermediate phase was strongly influenced by atomic mobility, and thus, must not be neglected in modern nucleation theory. Therefore, they concluded that the peritectic transformation can occur either with diffusion-controlled transformation or massive-like transformation, which was dependent on the local nucleation undercooling. These findings clarified, for the first time, the much-debated underpinning reason for the occurrence of massive phase transformations during solidification processing at large nucleation undercooling. Combining these findings and nucleation theory, Moon et al. [26] summarized two different peritectic transformation models, as shown in Figure 18. It should be noted that the solidifying steel shell within a continuous casting mold was also plotted. High cooling rate and steep thermal gradients occurred at the liquid/solid interface, which resulted in a higher solute concentration gradient in the solid phase. Therefore, the liquid/solid interface would grow in a planar model, and the massive type of peritectic transformation can happen, which led to an uneven shell formation and an increased risk of casting defects in the mold. In the lower part of the mold, the cooling rate and the thermal gradient are lower, which results in a dendritic structure at the liquid/solid interface. Under these conditions, peritectic transformation follows a diffusion-controlled model and a thin steel shell of even thickness would form. In this case, under lower casting speeds, the defects of steel decreased; however, the plant productivity decreased, which was not conductive and economical for the long term.
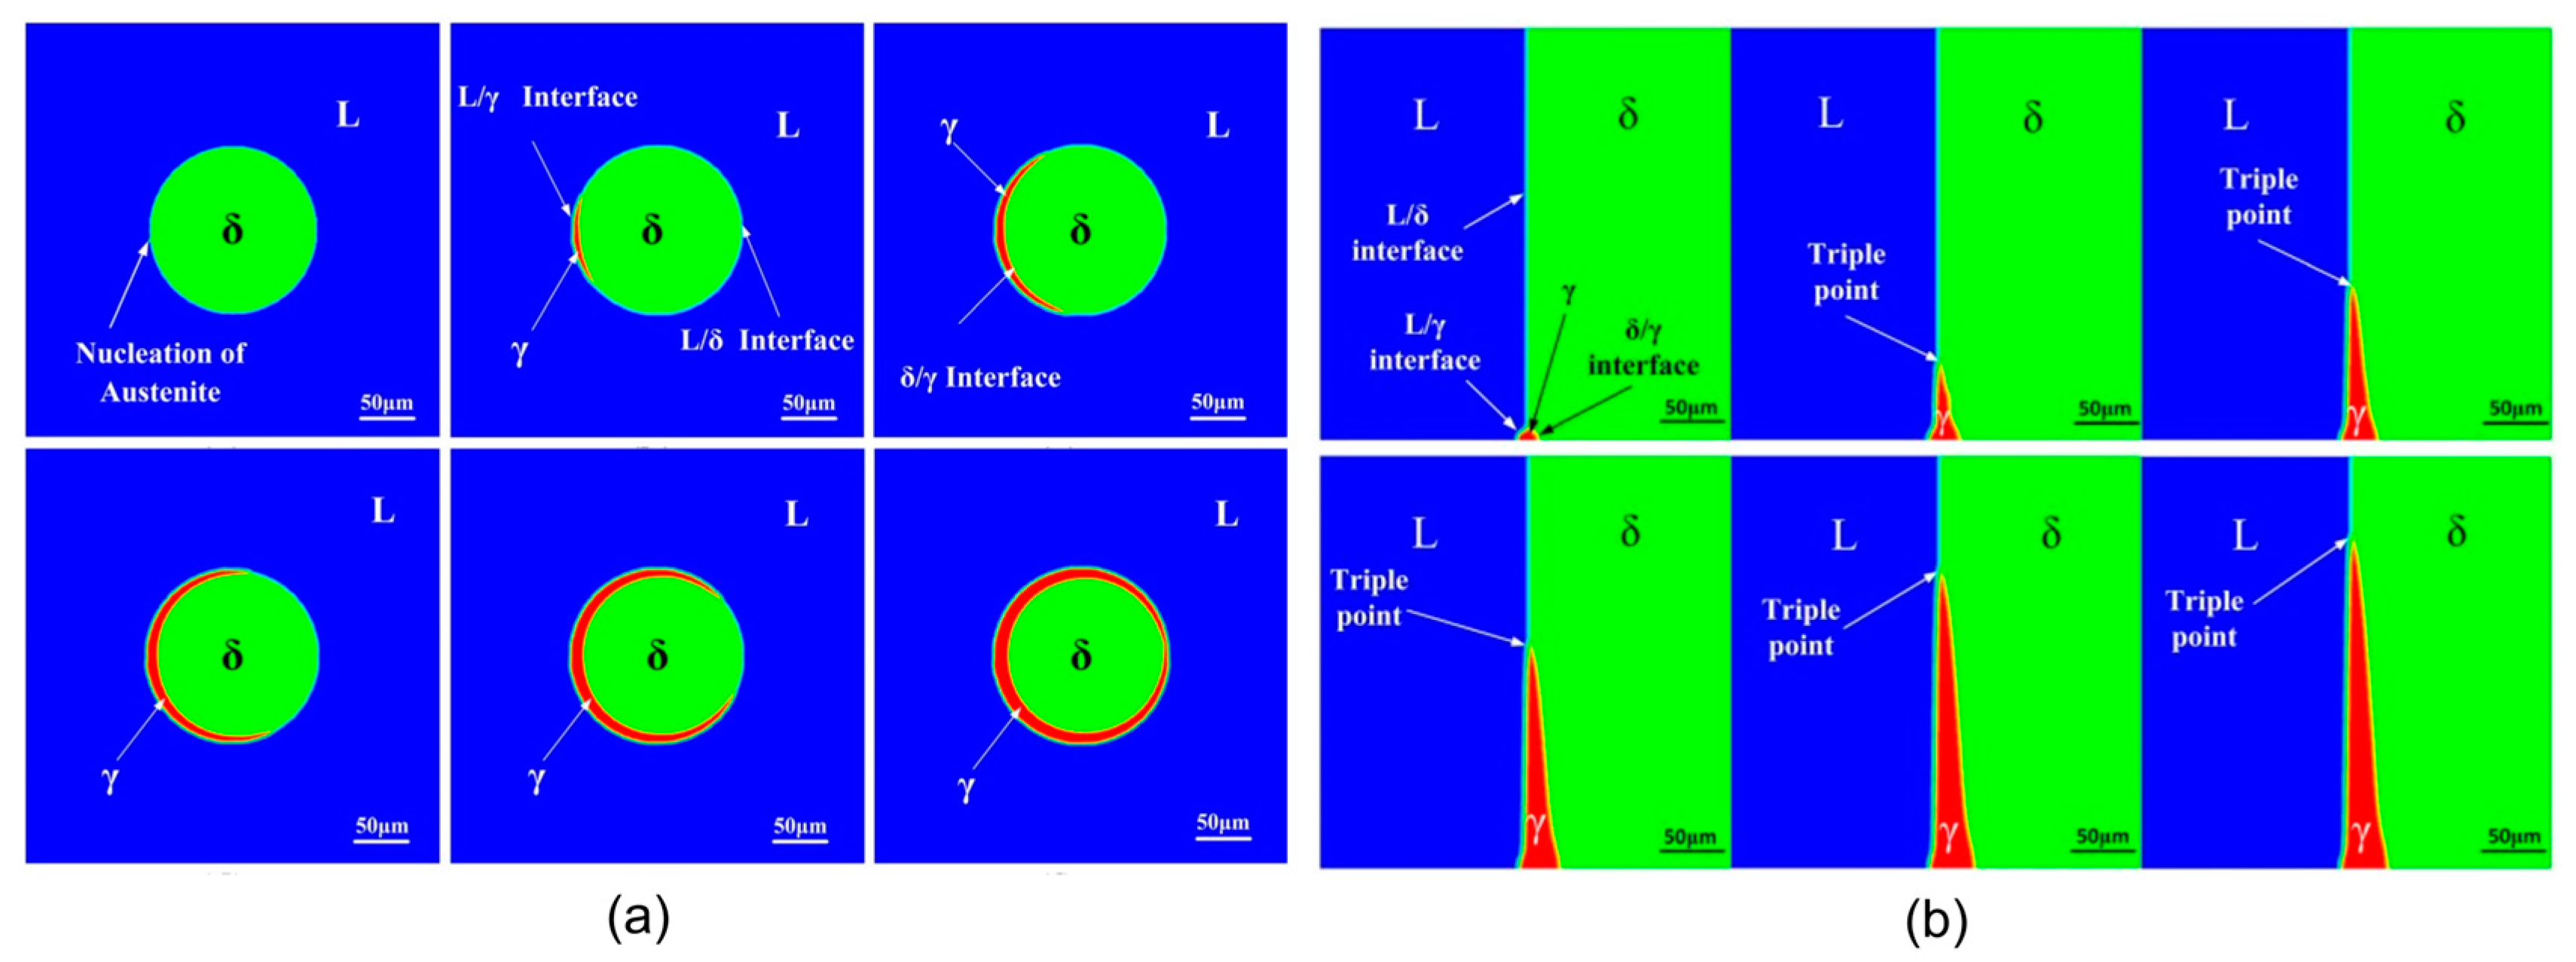
Except for the direct observation of the solidification process by HT-CLSM, the phase field modeling method has also been widely adopted to predict the complicated transport phenomena and phase transformation during the solidification process of melt [22,86,100]. Phelan et al. [22,100] first applied the modeling method to simulate the sub-boundaries formations within the δ-ferrite grain. γ grew along sub-boundaries as well as grain boundaries were observed, which showed good agreement with the experimental results. Luo et al. [86] applied both in situ experiments and multiphase field modeling to investigate the peritectic solidification of low-carbon steel. The simulation results are presented in Figure 19a, and the γ-austenite nucleation and growth can be clearly predicted. Besides, the calculated propagation speed of the L/γ/δ triple point was similar to the measured one in the experimental results, which indicated that the modeling method was capable of predicting the peritectic reaction. Moreover, the L/γ/δ triple point motion was also predicted; as shown in Figure 19b, γ-austenite gradually grew with the L/γ/δ triple point motion along the L/δ interface and the curved boundaries induced by the remelting of d phase formed close to the L/γ/δ triple point, which was also observed by Griesser et al. [91]. The prediction results also showed that the advancing velocities of L/γ/δ triple point, L/γ interface and γ/δ interface increase with the increase of the cooling rate and undercooling.

3.3. Subsequent Microstructure Evolution during Austenite Decomposition in Low-Alloy Steels

The subsequent solid-state phase transformations, the decomposition of austenite plays a critical role in controlling the microstructure of steels. A range of phases can be formed due to the decomposition of austenite depending on the cooling rate, carbon content in steels. One example of the decomposition of austenite is shown in Figure 20. Widmanstäten ferrite close to the outside edge of the specimen firstly formed during the austenite decomposition. Additionally, it grew towards the center of the specimen, one pearlite nucleated and grew from the bottom left-hand corner and a second pearlite grew from the top of the image ahead of the Widmanstäten ferrite plate.
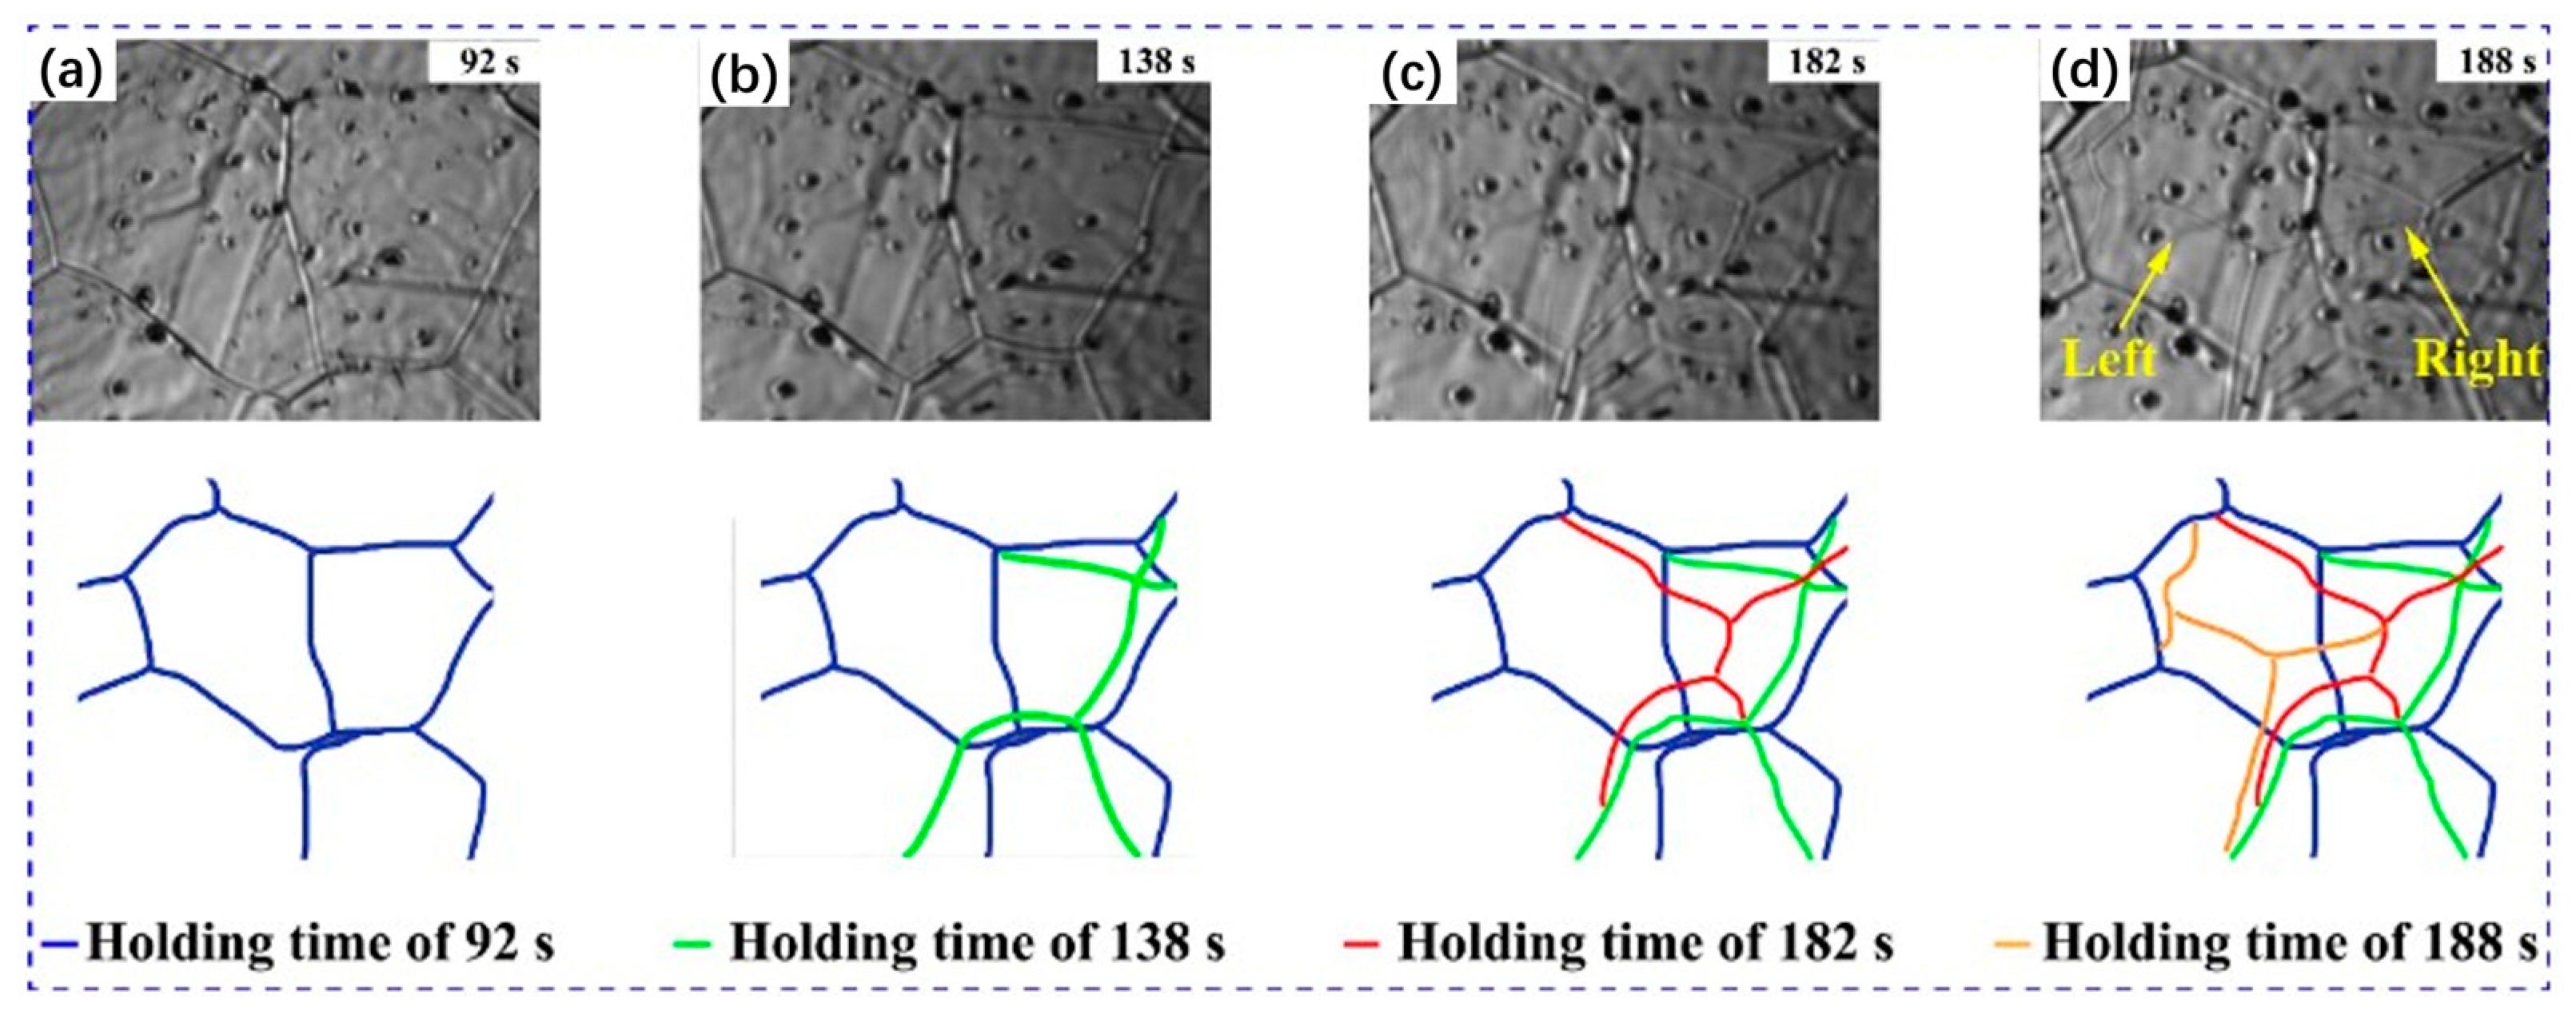
Recently, the static recrystallization behaviors and microstructure evolution of micro-alloyed slabs during the heavy reduction process were studied by combinations of HT-CLSM and electron backscatter diffraction (EBSD) [102]. The recrystallization grain evolution during the holding process after high-temperature compression was clearly observed by HT-CLSM, as shown in Figure 21. They found that stored deformation energy provided the driving force for the recrystallization process, which, in turn, consumed dislocations to stabilize the microstructure.

4. Other In Situ Characterization Methodologies Used for the Crystallization of Low-Alloy Steels

The previous section has mainly focused on the application of HT-CLSM technique for the investigation of solidification behavior in low-alloy steels, which is related to the observation of sample surface perturbations as a result of phase transformation phenomena on the microscopic level. In addition to the HT-CLSM observations, conventional thermal analysis techniques, such as differential thermal analysis (DTA) and differential scanning calorimetry (DSC), were commonly used for characterizing the steels mainly during heating and cooling. The DSC method was conducted based on the enthalpy change during phase transformations in steel. Detailed information about the DSC measurement can be found elsewhere [5,103]. Wielgosz and Kargul [7] used the DSC method to investigate the peritectic reaction during the solidification of steels. They reported that the temperature of the peritectic phase transition can be slightly affected. Three different DSC peaks upon heating and two distinct DSC peaks upon solidification were observed. However, the temperature of the γ to δ transformation during heating can hardly be measured due to the small enthalpy change. This is due to the fact that DSC method can only provide the thermal data of the sample, while the details of the different phases cannot be obtained. In addition, the DSC curves have shown difference to the equilibrium phase diagram due to the slow cooling rate compared to cooling conditions during the continuous casting process [104]. Therefore, only the DSC result cannot fully explain the exact γ to δ transformation, and additional observation should be conducted. Thus, some researchers have started to combine HT-CLSM and DSC to get a better insight into the solidification of peritectic steels [5,6,74,92,105,106,107].
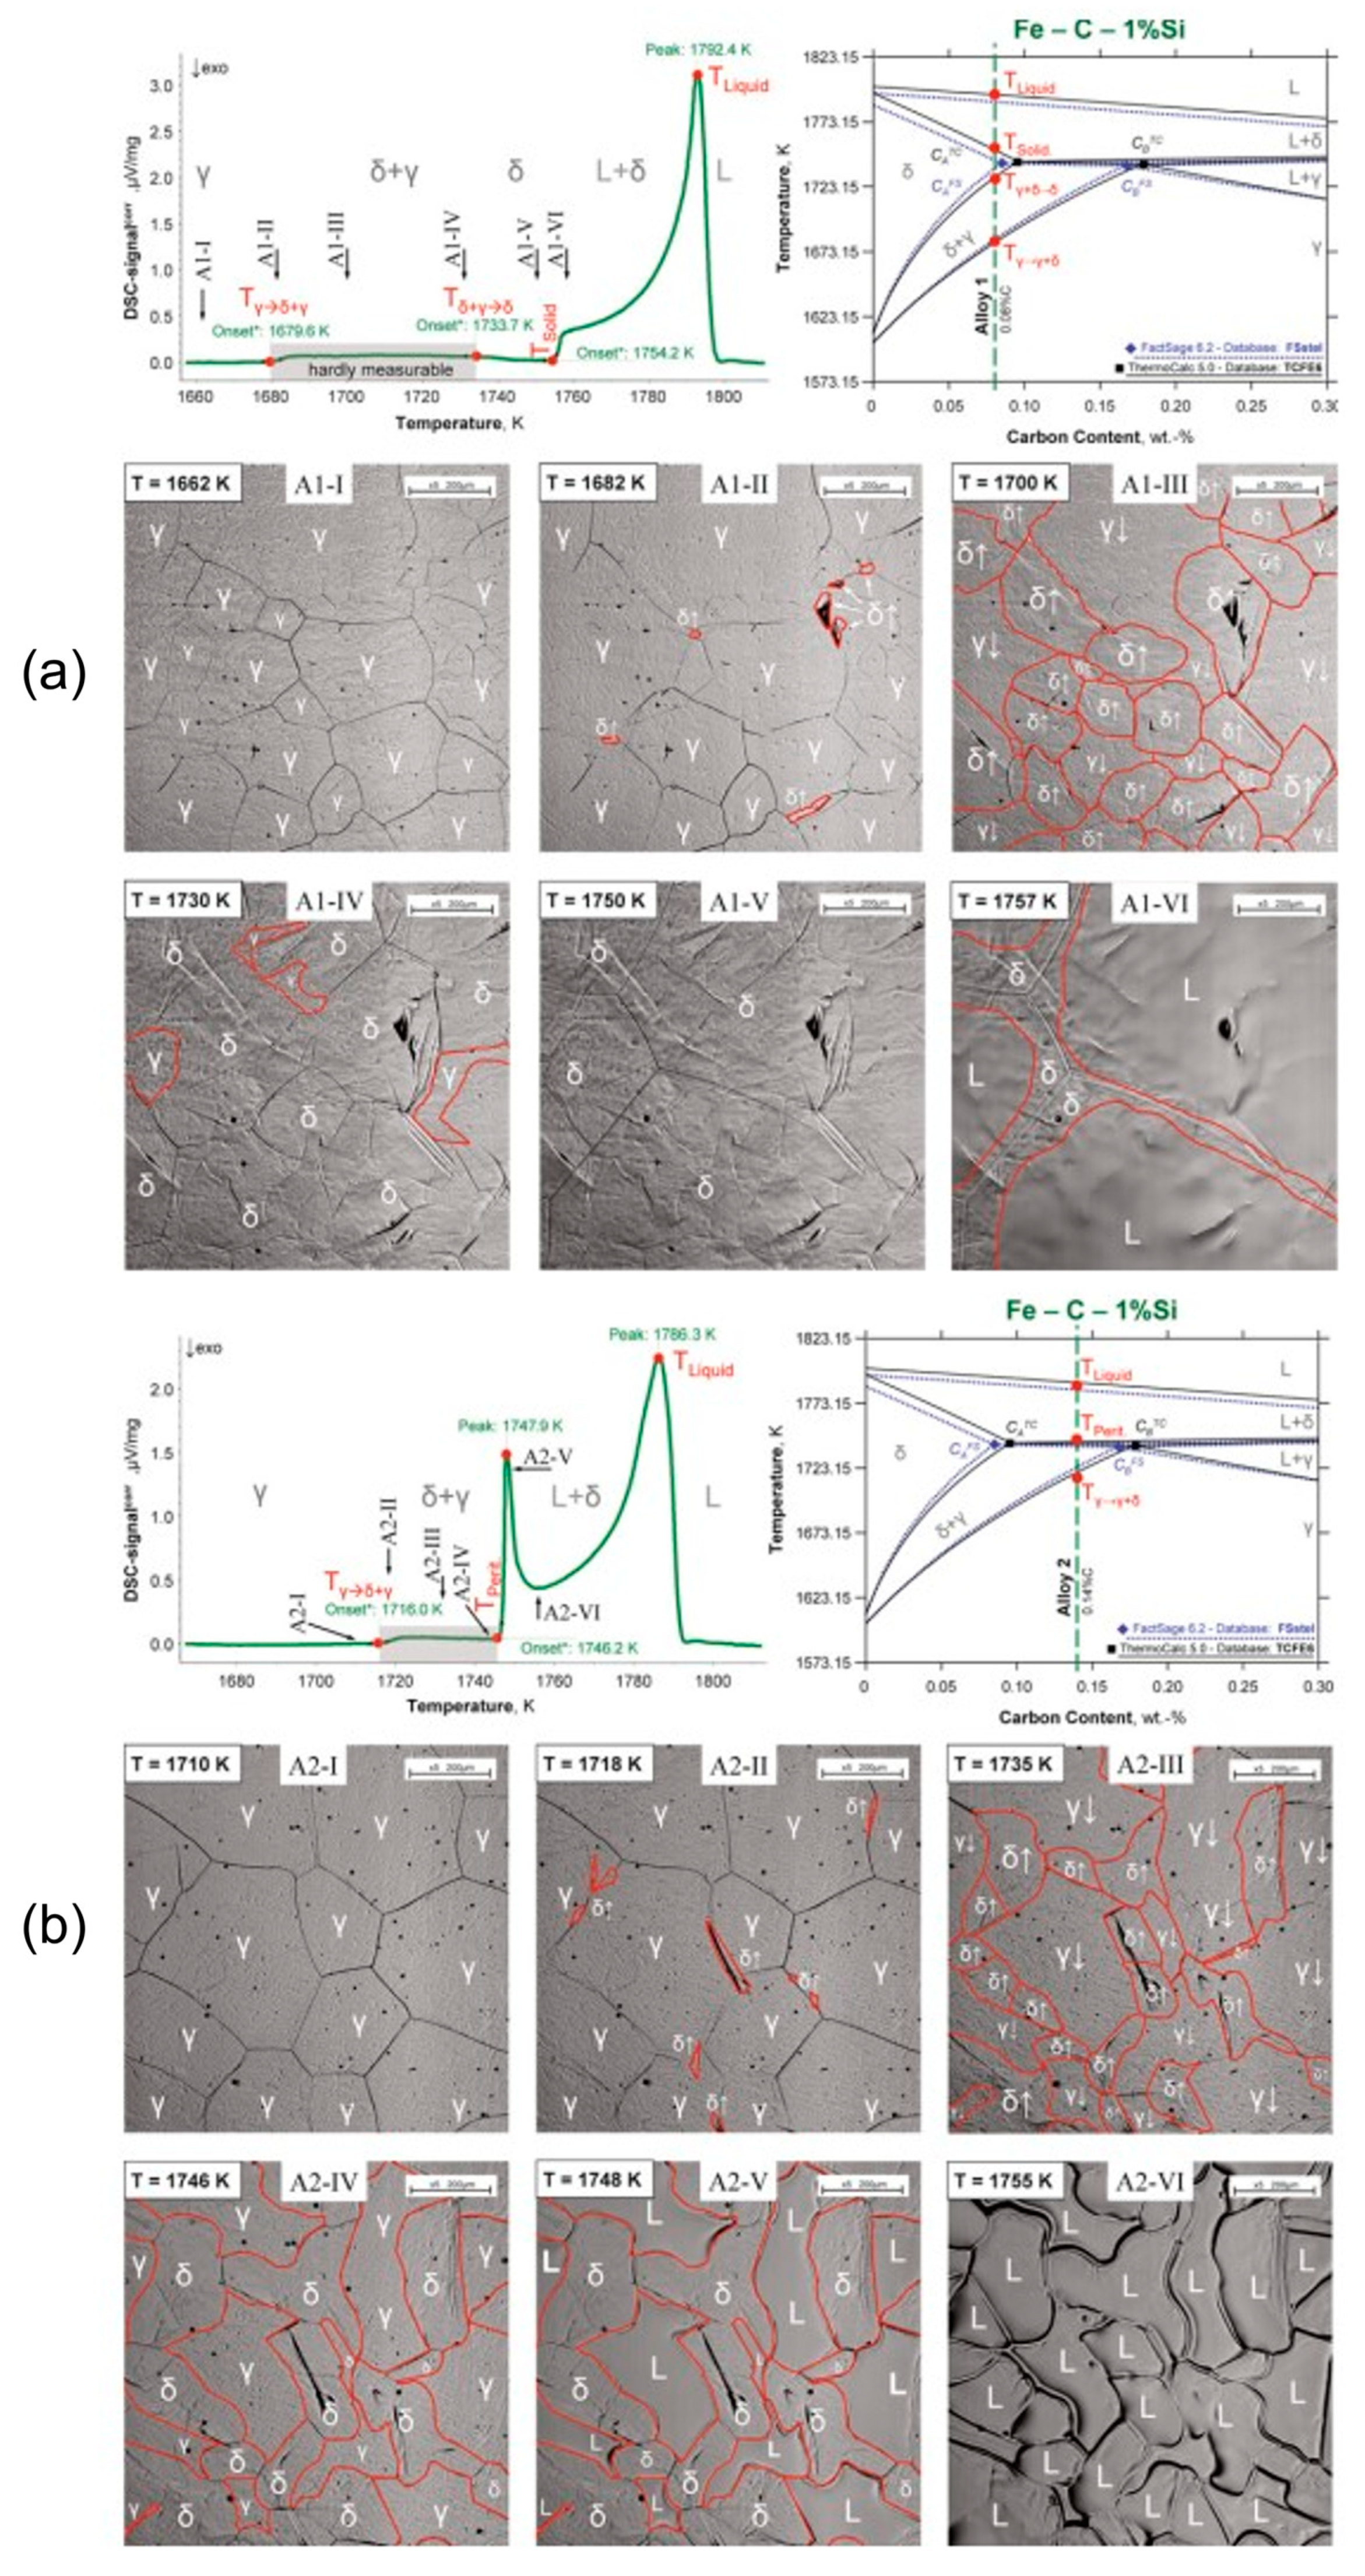
The typical DSC and HT-CLSM results in Fe-0.08% C-1% Si and Fe-0.14% C-1% Si alloys are shown in Figure 22 [5]. It can be seen that a small increase of heat flow was observed in the DSC signals at 1679.65 K (1406.5 °C), which should be correct with the γ to δ transformation. In this case, HT-CLSM was particularly useful for the observation of the δ formation at the γ grain boundaries and triple points as shown in sub-image A1-II (Figure 22a). Upon further heating, the phase fraction of the δ phase increased, while the γ phase fraction decreased. The liquidus temperature can be clearly obtained by DSC results; however, it cannot be obtained by the HT-LSCM method due to the steel droplet formation. DSC measurements can provide more clear information of the solidus, peritectic and liquidus temperatures and also the transformation sequence during steel heating. Moreover, the HT-CLSM technique can prove direct evidence of the phase transformation, which can be complementary to the DSC results. By combining the two methods, we obtain the transformation sequence of γ→γ + δ→L + δ→L in the Fe-0.08% C-1% Si alloy and γ→L + γ→L + δ→L in the Fe-0.14% C-1% Si alloy.
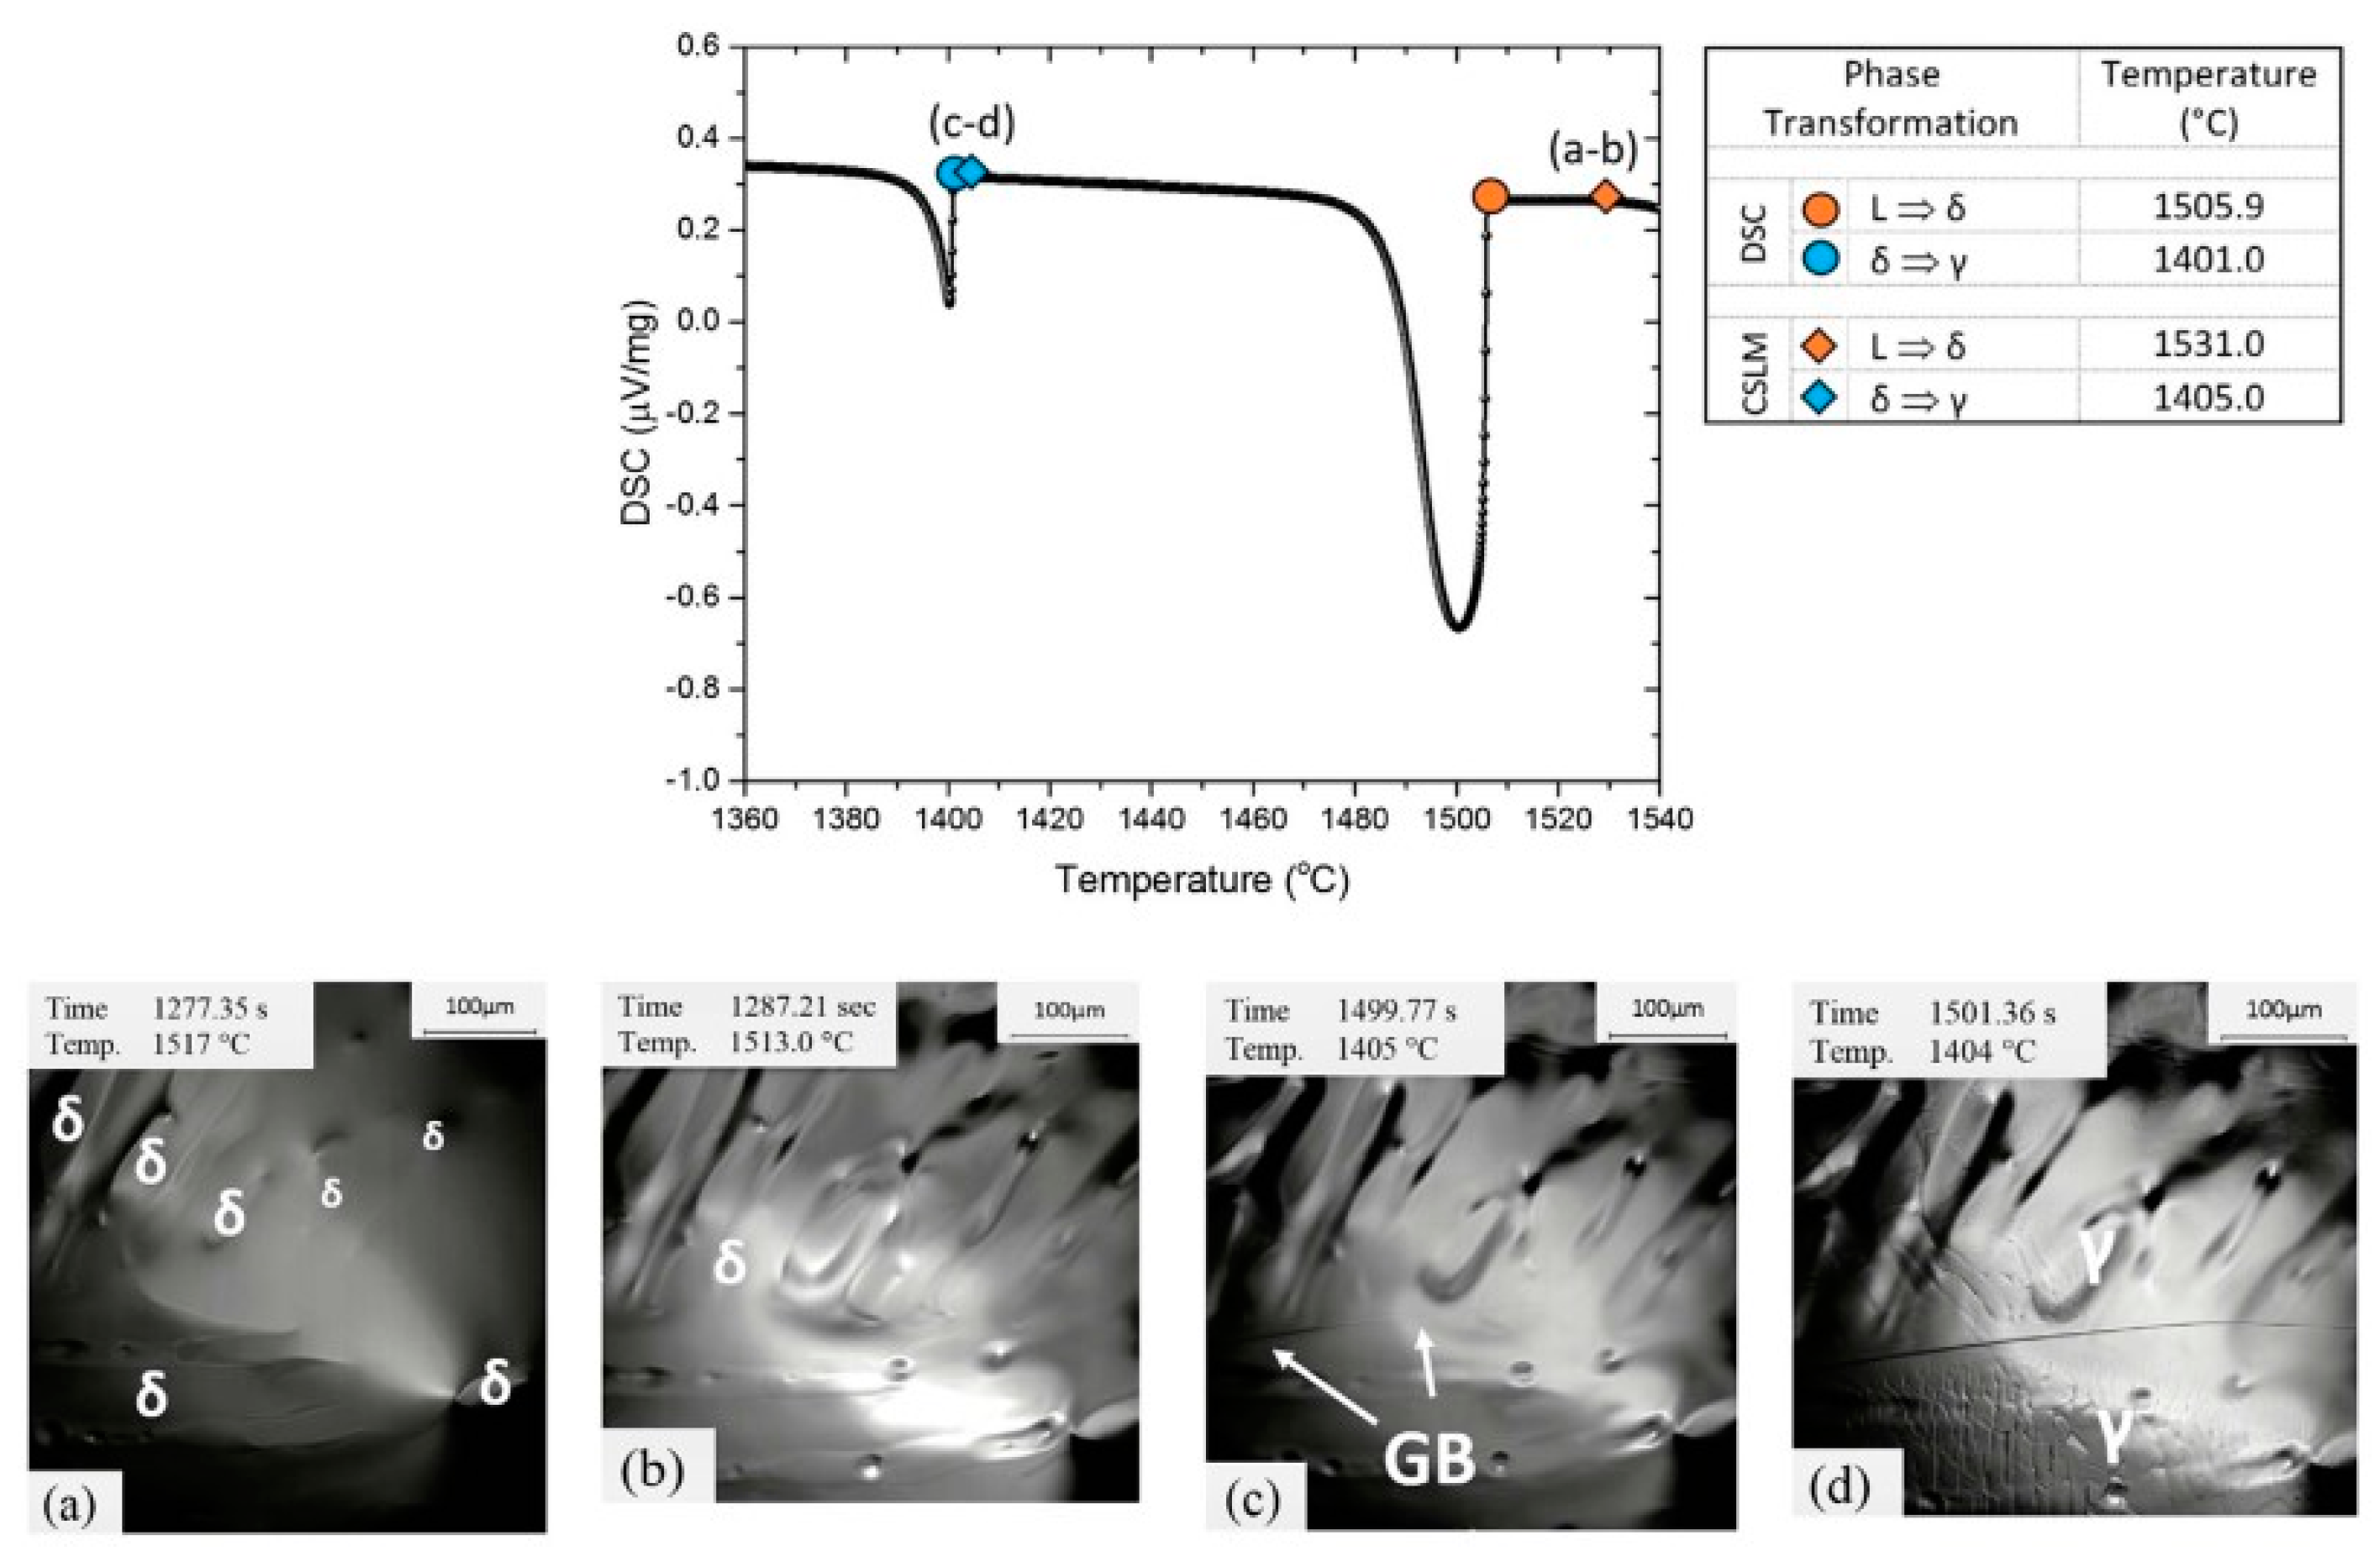
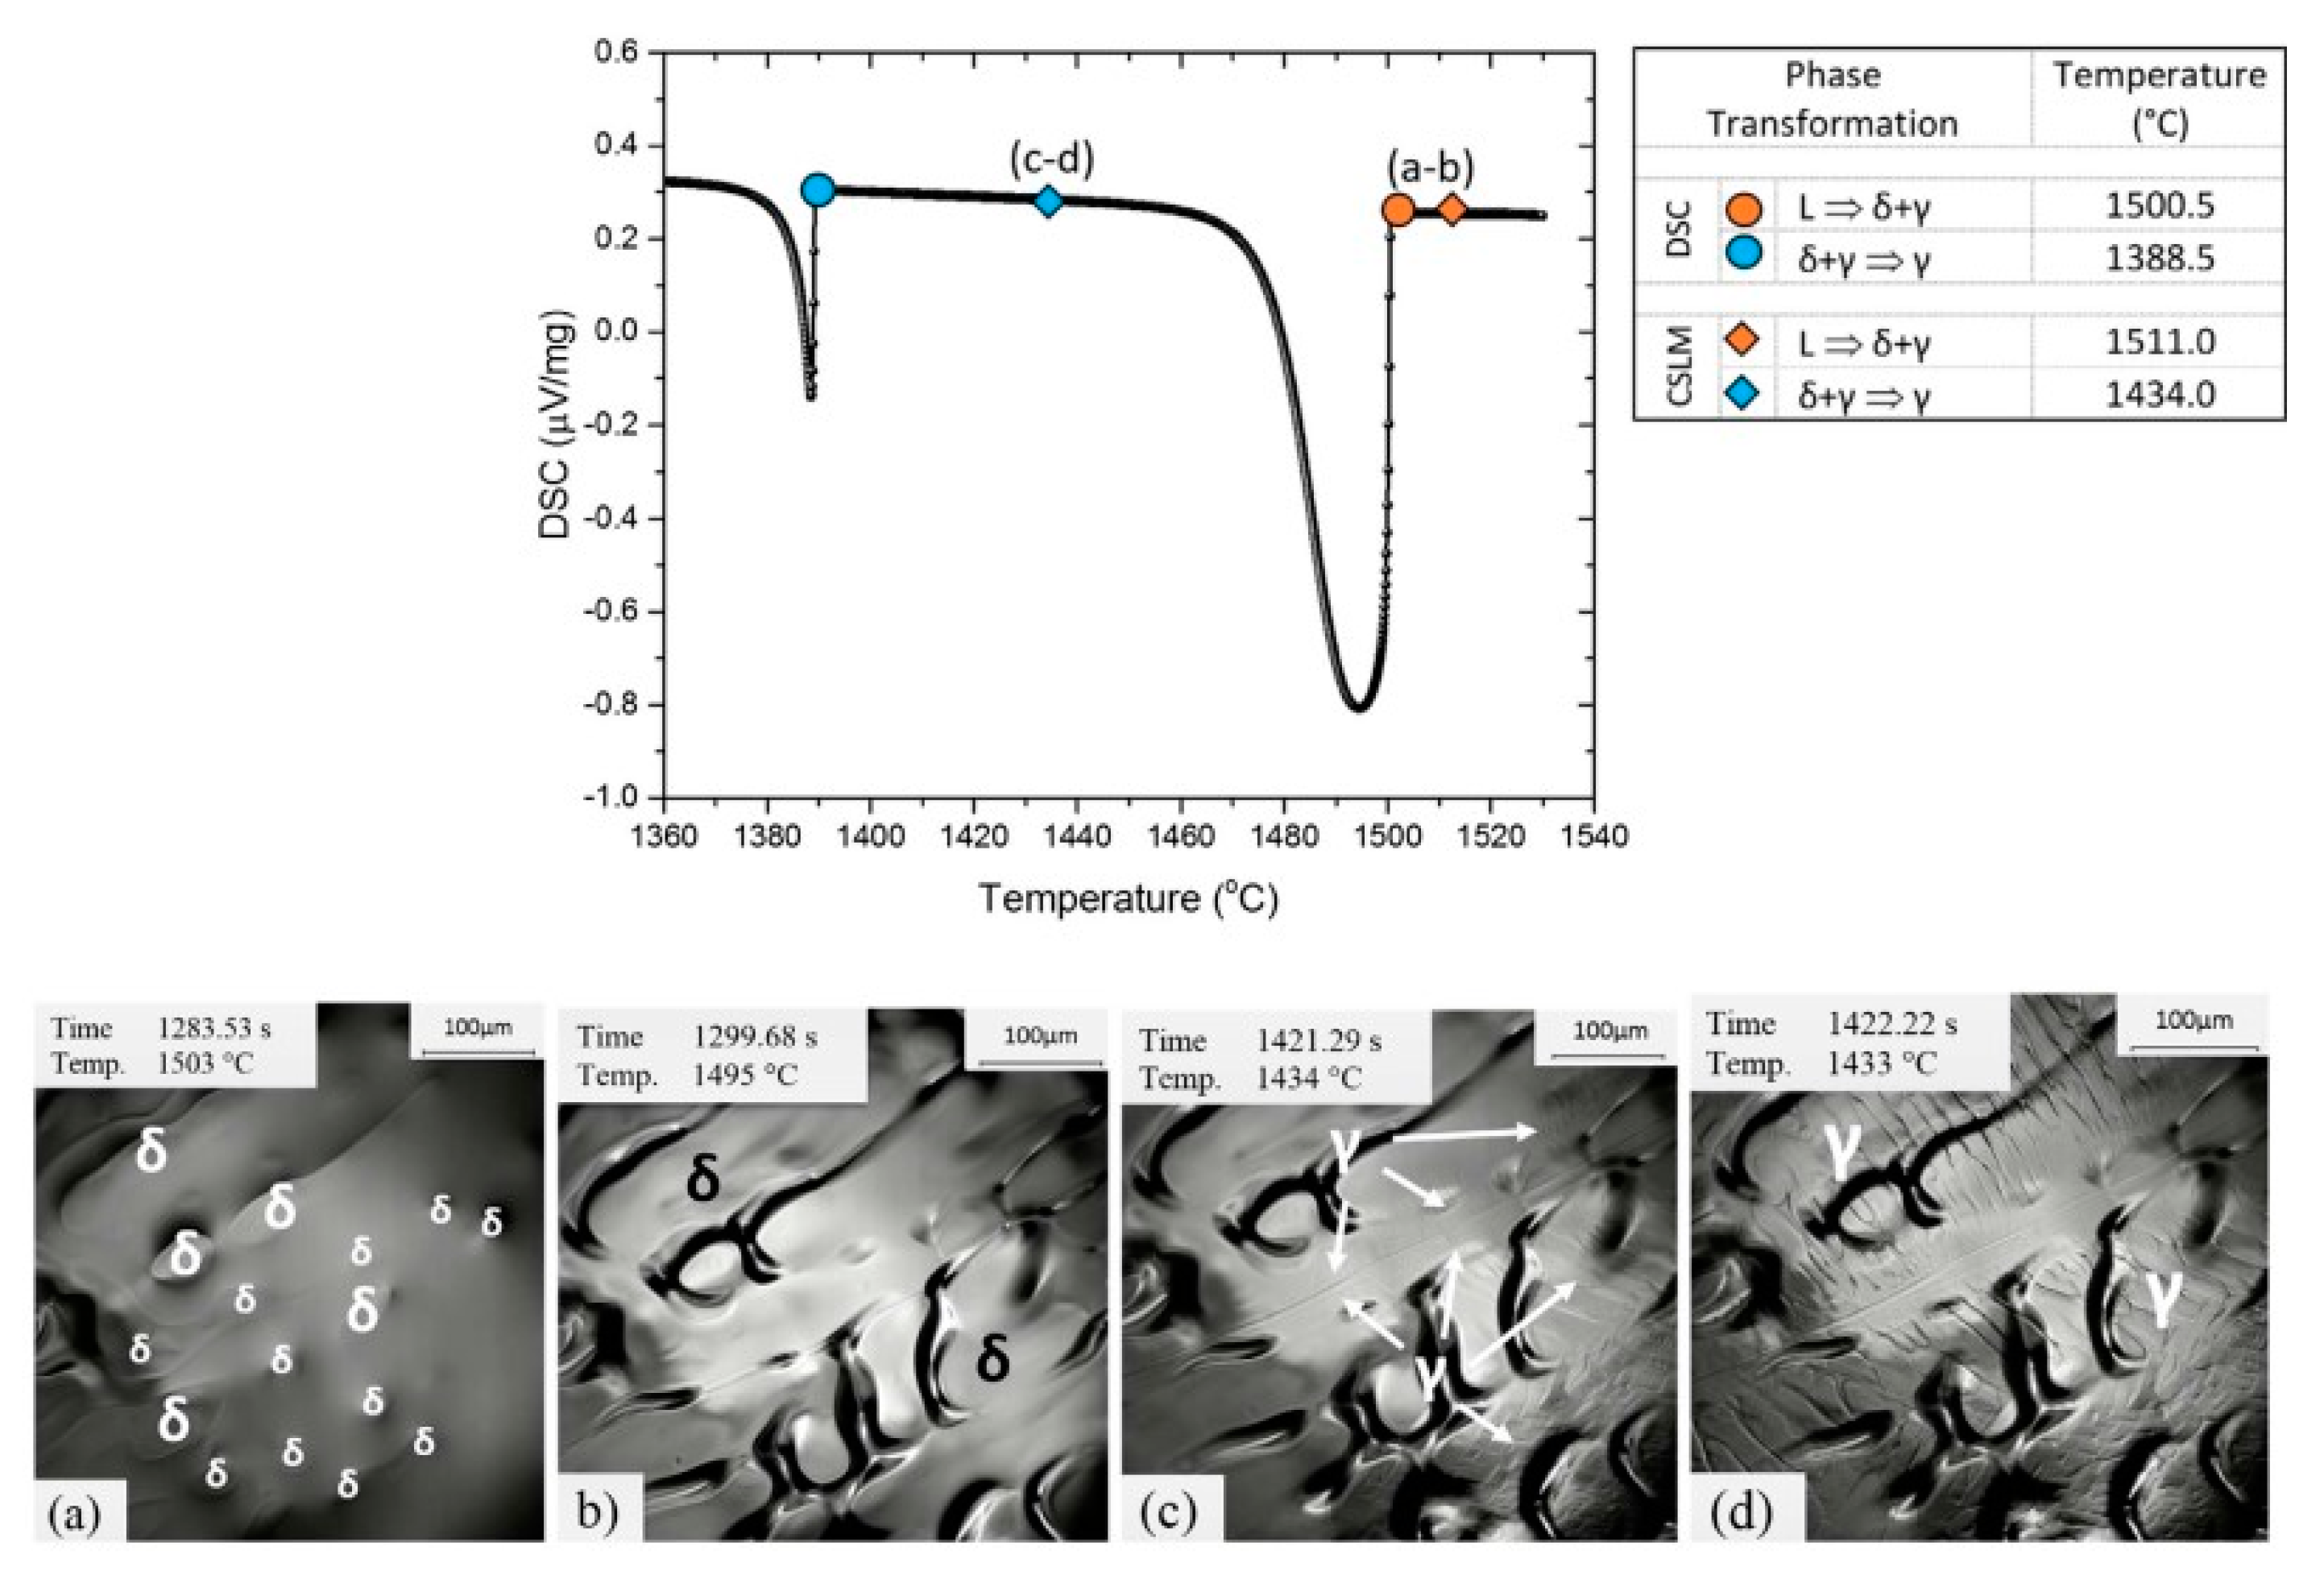
Hechu et al. [6] further studied the solidification behavior in peritectic steel by using DSC and HT-CLSM. The DSC cooling curves and HT-CLSM results in Fe-0.07% C and Fe-0.11% C steel are shown in Figure 23 and Figure 24, respectively. It can be seen that two peaks were observed in both steels. δ phase was observed to form in the liquid at 1531 °C and the liquid phase fully solidified at 1513 °C based on the HT-CLSM results (Figure 23a,b). The corresponding L→δ transformation temperature was 1506 °C measured by DSC. The δ→γ transformation finished in 1 s and the start transformation temperature was observed at 1405 °C, which was close to 1401 °C, as obtained by DSC. Similarly, δ phase started to form in liquid steel at 1511 °C and was followed by δ growth until the sample solidified completely at 1495 °C based on HT-CLSM results (Figure 24a,b). Upon further cooling, δ→γ transformation occurred at 1434 °C and it was completed within less than a second (Figure 24c,d). The second peak of the DSC curve was reported to relate to the peritectic reaction [5,7]; however, both DSC and HT-CLSM results showed that two steel samples solidified and stayed in the solid state for about 60–70 °C until the transformation of δ→γ started. Further investigation revealed the cause of the second peak, which correlated with the bulk transformation of the solute poor dendrite cores from δ to γ. In another work, Liu et al. [107] found three peaks during the cooling of micro-alloyed peritectic steel containing 0.11 wt% C, 1.37 wt% Mn and 0.11 wt% V and reported that the second peak was related to the peritectic reaction. Therefore, we can conclude that by combining the DSC with CSLM observations, phase transformation in peritectic steels can be explained more comprehensively.
Reviewing previous work, the DSC and HT-CLSM were conducted separately to validate each other. However, the deviations can be present between different measurements because of the randomness of nucleation events during the solidification of steels even under the same cooling rate and the same atmospheric condition. To further overcome the contradiction between DSC and HT-CLSM, Moon et al. [28] made an improvement and they used an in-house built DTA, incorporated spatially into an HT-CLSM, which combines two techniques into a single apparatus. Through this new technique, they were able to obtain DTA signals at exactly the same instant in situ observations by HT-CLSM, which was more pronounced compared to other works [5,107].
Another method which is widely used to characterize the solidification behavior of metals is electromagnetic levitation. It is used to melt reactive metal samples in a containerless manner while imposing varied conditions of induced convection within the molten droplets. Basically, it was developed by using the electromagnetic force due to the alternating magnetic field [108,109] and by using the electrostatic force [110]. The phase nucleation and solidified microstructure can be significantly affected by the melt flow, while the electromagnetic levitation method enables the melt without convection [111]. Besides, various physical phenomena associated with the degree of undercooling achieved prior to solidification may be studied using this method. Currently, it has been successfully applied to carbon steel [112], stainless steel [113], Fe-10 at%Ni alloy [114], MoSiBTiC alloy [115], CuCo alloy [116], FeCu alloy [117], Fe-Cr-Ni alloy [118] and high entropy alloys [119,120,121]. However, the applications of electromagnetic levitation for the investigation of solidification behavior in low-alloy steels are quite few. Future work can be conducted to systematically study the effect of undercooling on phase transformation in low-alloy steels by using the electromagnetic levitation method.

5. Conclusions

Peritectic reactions and transformations of steel during continuous casting can lead to uneven steel shell formation and reduced heat transfer from the solidified shell to the mold, which often cause surface defects. The solidification behavior of low-alloy steels, especially the peritectic reaction and transformation, studied by using the HT-CLSM technique, are systematically reviewed. Factors affecting the crystallization, cooling rate, alloying addition, supercooling degree and initial melting temperature are discussed. The development of HT-CLSM to concentric solidification technique, and further combining HT-CLSM and DTA/DSC are discussed, and a comprehensive comparison is made. Different peritectic reaction and transformation mechanisms, depending on the supercooling degrees and cooling rates, are reported and compared. This paper attempts to review the main recent experimental and mathematical efforts directed at the understanding of microstructure evolution during the solidification of low-alloy steel.

Author Contributions

Conceptualization, W.M. and Q.W.; data curation, Y.W.; methodology, investigation, preparation for the original draft, Y.W. and W.M.; manuscript review and editing, funding acquisition, project administration and submission, W.M. and Q.W. All authors have read and agreed to the published version of the manuscript.

Funding

W. Mu would like to acknowledge the financial support from the Swedish Foundation for Strategic Research (SSF) Strategic Mobility Grant (SM22-0039), VINNOVA Mobility Grant (2022-01216) and Jernkontoret. The Swedish Foundation for International Cooperation in Research and Higher Education (STINT, IB2022-9228) is acknowledged by W. Mu and Q. Wang for supporting the collaboration activities between KTH (Sweden) and Northeastern University (China). The NSFC Grant for Excellent Young Scientist Program (project name: Intelligent Inclusion Metallurgy) is also acknowledged. Y. Wang thanks the Key Laboratory for Ferrous Metallurgy and Resources Utilization of the Ministry of Education and the Hubei Provincial Key Laboratory for New Processes of Ironmaking and Steelmaking (No. FMRUlab-22-1) for supporting his research. The KTH Royal Institute of Technology is acknowledged for supporting the open access fee.

Institutional Review Board Statement

Not applicable.

Informed Consent Statement

Not applicable.

Data Availability Statement

The data presented in this study are available on request from the corresponding author.

Conflicts of Interest

The authors declare that they have no known competing financial interest or personal relationship that could have appeared to influence the work reported in this paper.

References

  1. Fredriksson, H. Solidification mechanisms. A study of the crystallization process in metal alloys. Scand. J. Metallurgy 1991, 20, 43–49. [Google Scholar]
  2. Fredriksson, H.; Åkerlind, U. Materials Processing during Casting; Wiley Online Library: Hoboken, NJ, USA, 2006; Volume 210. [Google Scholar]
  3. Jernkontoret (The Swedish Steel Producers’ Association). A Guide to the Solidification of Steels; Ljungberg Truckeri AB: Södertälje, Sweden, 1977; pp. 5–54. [Google Scholar]
  4. Bernhard, M.; Presoly, P.; Bernhard, C.; Hahn, S.; Ilie, S. An Assessment of Analytical Liquidus Equations for Fe-C-Si-Mn-Al-P-Alloyed Steels Using DSC/DTA Techniques. Metall. Mater. Trans. B 2021, 52, 2821–2830. [Google Scholar] [CrossRef]
  5. Presoly, P.; Pierer, R.; Bernhard, C. Identification of Defect Prone Peritectic Steel Grades by Analyzing High-Temperature Phase Transformations. Metall. Mater. Trans. A 2013, 44, 5377–5388. [Google Scholar] [CrossRef]
  6. Hechu, K.; Slater, C.; Santillana, B.; Clark, S.; Sridhar, S. A novel approach for interpreting the solidification behaviour of peritectic steels by combining CSLM and DSC. Mater. Charact. 2017, 133, 25–32. [Google Scholar] [CrossRef]
  7. Wielgosz, E.; Kargul, T. Differential scanning calorimetry study of peritectic steel grades. J. Therm. Anal. Calorim. 2015, 119, 1547–1553. [Google Scholar] [CrossRef] [Green Version]
  8. Shibata, H.; Emi, T. Confocal scanning laser microscope technique to in-situ observe phase transformations and behaviors of nonmetallic inclusions and precipitates in metals at elevated temperatures. Materia 1997, 36, 809–813. [Google Scholar]
  9. Chikama, H.; Shibata, H.; Emi, T.; Suzuki, M. “In-situ” real time observation of planar to cellular and cellular to dendritic transition of crystals growing in Fe–C alloy melts. Mater. Trans. JIM 1996, 37, 620–626. [Google Scholar] [CrossRef] [Green Version]
  10. Shibata, H.; Arai, Y.; Suzuki, M.; Emi, T. Kinetics of peritectic reaction and transformation in Fe-C alloys. Metall. Mater. Trans. B 2000, 31, 981–991. [Google Scholar] [CrossRef]
  11. Arai, Y.; Emi, T.; Fredriksson, H.; Shibata, H. In-situ observed dynamics of peritectic solidification and δ/γ transformation of Fe-3 to 5 at. pct Ni alloys. Metall. Mater. Trans. A 2005, 36, 3065–3074. [Google Scholar] [CrossRef]
  12. Yin, H.; Emi, T.; Shibata, H. Determination of free energy of δ-ferrite/γ-austenite interphase boundary of low carbon steels by in-situ observation. ISIJ Int. 1998, 38, 794–801. [Google Scholar] [CrossRef] [Green Version]
  13. Yin, H.; Shibata, H.; Emi, T.; Suzuki, M. “In-situ” observation of collision, agglomeration and cluster formation of alumina inclusion particles on steel melts. ISIJ Int. 1997, 37, 936–945. [Google Scholar] [CrossRef] [Green Version]
  14. Shibata, H.; Yin, H.; Emi, T. The capillary effect promoting collision and agglomeration of inclusion particles at the inert gas–steel interface. Philos. Trans. R. Soc. A Math. Phys. Eng. Sci. 1998, 356, 957–966. [Google Scholar] [CrossRef]
  15. Shibata, H.; Yin, H.; Yoshinaga, S.; Emi, T.; Suzuki, M. In-situ Observation of Engulfment and Pushing of Nonmetallic Inclusions in Steel Melt by Advancing Melt/Solid Interface. ISIJ Int. 1998, 38, 149–156. [Google Scholar] [CrossRef] [Green Version]
  16. Cho, J.W.; Emi, T.; Shibata, H.; Suzuki, M. Heat Transfer across Mold Flux Film in Mold during Initial Solidification in Continuous Casting of Steel. ISIJ Int. 1998, 38, 834–842. [Google Scholar] [CrossRef]
  17. Cho, J.W.; Shibata, H. Effect of solidification of mold fluxes on the heat transfer in casting mold. J. Non-Crystalline Solids 2001, 282, 110–117. [Google Scholar] [CrossRef]
  18. Dippenaar, R.J. Continuous Casting of Advanced Steels of Near-Peritectic Composition. Mater. Sci. Forum 2010, 654–656, 17–22. [Google Scholar] [CrossRef]
  19. Reid, M.; Phelan, D.; Dippenaar, R. Concentric Solidification for High Temperature Laser Scanning Confocal Microscopy. ISIJ Int. 2004, 44, 565–572. [Google Scholar] [CrossRef]
  20. Phelan, D.; Stanford, N.; Dippenaar, R. In situ observations of Widmanstätten ferrite formation in a low-carbon steel. Mater. Sci. Eng. A 2005, 407, 127–134. [Google Scholar] [CrossRef]
  21. Phelan, D.; Reid, M.; Dippenaar, R. Kinetics of the peritectic phase transformation: In-situ measurements and phase field modeling. Metall. Mater. Trans. A 2006, 37, 985–994. [Google Scholar] [CrossRef]
  22. Phelan, D.; Dippenaar, R. Instability of the Delta-ferrite/austenite Interface in Low Carbon Steels: The Influence of Delta-ferrite Recovery Sub-structures. ISIJ Int. 2004, 44, 414–421. [Google Scholar] [CrossRef] [Green Version]
  23. Griesser, S.; Reid, M.; Bernhard, C.; Dippenaar, R. Diffusional constrained crystal nucleation during peritectic phase transitions. Acta Mater. 2014, 67, 335–341. [Google Scholar] [CrossRef]
  24. Griesser, S.; Bernhard, C.; Dippenaar, R. Effect of nucleation undercooling on the kinetics and mechanism of the peritectic phase transition in steel. Acta Mater. 2014, 81, 111–120. [Google Scholar] [CrossRef]
  25. Niknafs, S.; Phelan, D.; Dippenaar, R. High-temperature laser-scanning confocal microscopy as a tool to study the interface instability during unsteady-state solidification of low-carbon steel. J. Microsc. 2013, 249, 53–61. [Google Scholar] [CrossRef] [PubMed]
  26. Moon, S.; Dippenaar, R.; Kim, S. The peritectic phase transition of steel during the initial stages of solidification in the mold. In Proceedings of the AISTech Conference, Cleveland, OH, USA, 4–7 May 2015. [Google Scholar]
  27. Liyanage, D.; Moon, S.C.; Du Toit, M.; Dippenaar, R. Quantitative Thermal Analysis of Solidification in a High-Temperature Laser-Scanning Confocal Microscope. In Advanced Real Time Imaging II; Springer: Berlin/Heidelberg, Germany, 2019; pp. 131–141. [Google Scholar] [CrossRef]
  28. Moon, S.-C.; Phelan, D.; Reid, M.; Griesser, S.; Liyanage, D.; Dippenaar, R. Development of HT-LSCM Techniques for the In Situ Study of the Peritectic Phase Transition. In TMS 2020 149th Annual Meeting & Exhibition Supplemental Proceedings; Springer: Berlin/Heidelberg, Germany, 2020; pp. 25–37. [Google Scholar] [CrossRef]
  29. Mu, W.; Dogan, N.; Coley, K.S. In Situ Observations of Agglomeration of Non-metallic Inclusions at Steel/Ar and Steel/Slag Interfaces by High-Temperature Confocal Laser Scanning Microscope: A Review. JOM 2018, 70, 1199–1209. [Google Scholar] [CrossRef]
  30. Mu, W.; Dogan, N.; Coley, K.S. In situ observation of deformation behavior of chain aggregate inclusions: A case study for Al2O3 at a liquid steel/argon interface. J. Mater. Sci. 2018, 53, 13203–13215. [Google Scholar] [CrossRef]
  31. Mu, W.; Xuan, C. Agglomeration Mechanism of Complex Ti-Al Oxides in Liquid Ferrous Alloys Considering High-Temperature Interfacial Phenomenon. Metall. Mater. Trans. B 2019, 50, 2694–2705. [Google Scholar] [CrossRef]
  32. Qiu, Z.; Malfliet, A.; Blanpain, B.; Guo, M. Capillary Interaction Between Micron-Sized Ce2O3 Inclusions at the Ar Gas/Liquid Steel Interface. Metall. Mater. Trans. B 2022, 53, 1775–1791. [Google Scholar] [CrossRef]
  33. Miao, K.; Haas, A.; Sharma, M.; Mu, W.; Dogan, N. In Situ Observation of Calcium Aluminate Inclusions Dissolution into Steelmaking Slag. Metall. Mater. Trans. B 2018, 49, 1612–1623. [Google Scholar] [CrossRef]
  34. Sharma, M.; Mu, W.; Dogan, N. In Situ Observation of Dissolution of Oxide Inclusions in Steelmaking Slags. JOM 2018, 70, 1220–1224. [Google Scholar] [CrossRef]
  35. Ren, C.; Zhang, L.; Zhang, J.; Wu, S.; Zhu, P.; Ren, Y. In situ observation of the dissolution of Al2O3 particles in CaO-Al2O3-SiO2 slags. Metall. Mater. Trans. B 2021, 52, 3288–3301. [Google Scholar] [CrossRef]
  36. Ren, Y.; Zhu, P.; Ren, C.; Liu, N.; Zhang, L. Dissolution of SiO2 inclusions in CaO-SiO2-based slags in situ observed using high-temperature confocal scanning laser microscopy. Metall. Mater. Trans. B 2022, 53, 682–692. [Google Scholar] [CrossRef]
  37. Wang, Z.; Sohn, I. A Review of In Situ Observations of Crystallization and Growth in High Temperature Oxide Melts. JOM 2018, 70, 1210–1219. [Google Scholar] [CrossRef]
  38. Yu, X.; Wen, G.H.; Tang, P.; Ma, F.J.; Wang, H. Behavior of Mold Slag Used for 20Mn23Al Nonmagnetic Steel During Casting. J. Iron Steel Res. Int. 2011, 18, 20–25. [Google Scholar] [CrossRef]
  39. Zhang, Z.T.; Wen, G.H.; Zhang, Y.Y. Crystallization behavior of F-free mold fluxes. Int. J. Miner. Metall. 2011, 18, 150–158. [Google Scholar] [CrossRef]
  40. Park, J.Y.; Ryu, J.W.; Sohn, I. In-situ Crystallization of Highly Volatile Commercial Mold Flux Using an Isolated Observation System in the Confocal Laser Scanning Microscope. Metall. Mater. Trans. B 2014, 45, 1186–1191. [Google Scholar] [CrossRef]
  41. Wang, Y.; Sridhar, S. Reoxidation on the Surface of Molten Low-Carbon Aluminum-Killed Steel. Steel Res. Int. 2005, 76, 355–361. [Google Scholar] [CrossRef]
  42. Wang, Y.; Sridhar, S. The effect of gas flow rate on the evolution of the surface oxide on a molten low carbon Al killed steel. J. Mater. Sci. 2005, 40, 2179–2184. [Google Scholar] [CrossRef]
  43. Takamura, J.I.; Mizoguchi, S. Roles of oxides in steels performance. In Proceedings of the Sixth International Iron and Steel Congress, 21–26 October 1990; Iron and Steel Institute of Japan: Tokyo, Japan, 1990. [Google Scholar]
  44. Koseki, T.; Thewlis, G. Overview inclusion assisted microstructure control in C–Mn and low alloy steel welds. Mater. Sci. Technol. 2005, 21, 867–879. [Google Scholar] [CrossRef]
  45. Mu, W.; Jönsson, P.G.; Nakajima, K. Recent Aspects on the Effect of Inclusion Characteristics on the Intragranular Ferrite Formation in Low Alloy Steels: A Review. High Temp. Mater. Process. 2017, 36, 309–325. [Google Scholar] [CrossRef]
  46. Mu, W.; Mao, H.; Jönsson, P.G.; Nakajima, K. Effect of Carbon Content on the Potency of the Intragranular Ferrite Formation. Steel Res. Int. 2016, 87, 311–319. [Google Scholar] [CrossRef]
  47. Zhang, D.; Terasaki, H.; Komizo, Y.-I. In situ observation of the formation of intragranular acicular ferrite at non-metallic inclusions in C–Mn steel. Acta Mater. 2010, 58, 1369–1378. [Google Scholar] [CrossRef]
  48. Mu, W.; Shibata, H.; Hedström, P.; Jönsson, P.G.; Nakajima, K. Ferrite Formation Dynamics and Microstructure Due to Inclusion Engineering in Low-Alloy Steels by Ti2O3 and TiN Addition. Metall. Mater. Trans. B 2016, 47, 2133–2147. [Google Scholar] [CrossRef]
  49. Zou, X.-D.; Sun, J.-C.; Zhao, D.-P.; Matsuura, H.; Wang, C. Effects of Zr addition on evolution behavior of inclusions in EH36 shipbuilding steel: From casting to welding. J. Iron Steel Res. Int. 2018, 25, 164–172. [Google Scholar] [CrossRef]
  50. Loder, D.; Michelic, S.K.; Mayerhofer, A.; Bernhard, C. On the Capability of Nonmetallic Inclusions to Act as Nuclei for Acicular Ferrite in Different Steel Grades. Metall. Mater. Trans. B 2017, 48, 1992–2006. [Google Scholar] [CrossRef] [Green Version]
  51. Wan, X.-L.; Wu, K.-M.; Huang, G.; Wei, R.; Cheng, L. In situ observation of austenite grain growth behavior in the simulated coarse-grained heat-affected zone of Ti-microalloyed steels. Int. J. Miner. Metall. Mater. 2014, 21, 878–885. [Google Scholar] [CrossRef] [Green Version]
  52. Liu, Y.; Wan, X.; Li, G.; Wang, Y.; Zheng, W.; Hou, Y. Grain refinement in coarse-grained heat-affected zone of Al–Ti–Mg complex deoxidised steel. Sci. Technol. Weld. Join. 2019, 24, 43–51. [Google Scholar] [CrossRef]
  53. Yao, H.; Ren, Q.; Yang, W.; Zhang, L. In Situ Observation and Prediction of the Transformation of Acicular Ferrites in Ti-Containing HLSA Steel. Metall. Mater. Trans. B 2022, 53, 1827–1840. [Google Scholar] [CrossRef]
  54. Loder, D.; Michelic, S.K.; Mayerhofer, A.; Bernhard, C.; Dippenaar, R.J. In situ observation of acicular ferrite formation using HT-LSCM: Possibilities, challenges and influencing factors. In Proceedings of the Materials Science and Technology Conference and Exhibition, Columbus, OH, USA, 4–8 October 2015. [Google Scholar]
  55. Mu, W.; Shibata, H.; Hedström, P.; Jönsson, P.G.; Nakajima, K. Combination of in situ microscopy and calorimetry to study austenite decomposition in inclusion engineered steels. Steel Res. Int. 2016, 87, 10–14. [Google Scholar] [CrossRef]
  56. Komizo, Y.I. In-situ Observation Techniques of Solidification and Phase Transformation during Welding. Trans. JWRI 2011, 40, 7–20. [Google Scholar]
  57. Komizo, Y.; Terasaki, H.; Yonemura, M.; Osuki, T. Development of in-Situ Microstructure Observation Techniques in Welding. Weld. World 2008, 52, 56–63. [Google Scholar] [CrossRef]
  58. Piva, S.P.T.; Tang, D.; Kumar, D.; Pistorius, P.C. Mass Transfer in High-Temperature Laser Confocal Microscopy. In TMS Annual Meeting & Exhibition; Springer: Berlin/Heidelberg, Germany, 2018; pp. 193–200. [Google Scholar] [CrossRef]
  59. Britt, S.T.; Pistorius, P.C. Investigation into the Temperature of Metallic High-Temperature Confocal Scanning Laser Microscope Samples. Metall. Mater. Trans. B 2022, 53, 2153–2165. [Google Scholar] [CrossRef]
  60. Lombardi, A.; Mu, W.; Ravindran, C.; Dogan, N.; Barati, M. In-situ investigation of incipient melting in a 319 type Al alloy using laser scanning confocal microscopy. Mater. Charact. 2018, 141, 328–337. [Google Scholar] [CrossRef]
  61. Lombardi, A.; Mu, W.; Ravindran, C.; Dogan, N.; Barati, M. Influence of Al2Cu morphology on the incipient melting characteristics in B206 Al alloy. J. Alloys Compd. 2018, 747, 131–139. [Google Scholar] [CrossRef]
  62. Andilab, B.; Ravindran, C.; Dogan, N.; Lombardi, A.; Byczynski, G. In-situ analysis of incipient melting of Al2Cu in a novel high strength Al-Cu casting alloy using laser scanning confocal microscopy. Mater. Charact. 2020, 159, 110064. [Google Scholar] [CrossRef]
  63. Wang, W.; Mu, W.; Hou, Z.; Sukenaga, S.; Shibata, H.; Larsson, H.; Mao, H. In-situ real time observation of martensite transformation in duplex fcc+hcp cobalt based entropic alloys. Materialia 2020, 14, 100928. [Google Scholar] [CrossRef]
  64. Kim, J.H.; Kim, S.G.; Inoue, A. In situ observation of solidification behavior in undercooled Pd–Cu–Ni–P alloy by using a confocal scanning laser microscope. Acta Mater. 2001, 49, 615–622. [Google Scholar] [CrossRef]
  65. Yamashita, F.; Wakoh, M.; Ishikawa, K.; Shibata, H. In Situ Observation of Nonmetallic Inclusion Formation in NiTi Alloys. Mater. Trans. 2017, 58, 1729–1734. [Google Scholar] [CrossRef]
  66. Nakano, J.; Sridhar, S.; Moss, T.; Bennett, J.; Kwong, K.-S. Crystallization of Synthetic Coal−Petcoke Slag Mixtures Simulating Those Encountered in Entrained Bed Slagging Gasifiers. Energy Fuels 2009, 23, 4723–4733. [Google Scholar] [CrossRef]
  67. Sohn, I.; Dippenaar, R. In-Situ Observation of Crystallization and Growth in High-Temperature Melts Using the Confocal Laser Microscope. Metall. Mater. Trans. B 2016, 47, 2083–2094. [Google Scholar] [CrossRef]
  68. Mu, W.; Hedström, P.; Shibata, H.; Jönsson, P.G.; Nakajima, K. High-Temperature Confocal Laser Scanning Microscopy Studies of Ferrite Formation in Inclusion-Engineered Steels: A Review. JOM 2018, 70, 2283–2295. [Google Scholar] [CrossRef] [Green Version]
  69. Andersson, J.-O.; Helander, T.; Höglund, L.; Shi, P.; Sundman, B. Thermo-Calc & DICTRA, computational tools for materials science. Calphad 2002, 26, 273–312. [Google Scholar] [CrossRef]
  70. TCS Steels/Fe-Alloys Database Version 12.0, (TCFE12), Stockholm, Sweden, December 2021. Available online: http://www.thermocalc.com/products-services/databases/ (accessed on 1 March 2023).
  71. Griesser, S.; Dippenaar, R. Enhanced Concentric Solidification Technique for High-Temperature Laser-Scanning Confocal Microscopy. ISIJ Int. 2014, 54, 533–535. [Google Scholar] [CrossRef] [Green Version]
  72. Griesser, S.; Pierer, R.; Reid, M.; Dippenaar, R. SolTrack: An automatic video processing software for in situ interface tracking. J. Microsc. 2012, 248, 42–48. [Google Scholar] [CrossRef]
  73. Yan, P.; Guo, M.; Blanpain, B. In Situ Observation of the Formation and Interaction Behavior of the Oxide/Oxysulfide Inclusions on a Liquid Iron Surface. Metall. Mater. Trans. B 2014, 45, 903–913. [Google Scholar] [CrossRef]
  74. Presoly, P.; Pierer, R.; Bernhard, C. Linking up of HT-LSCM and DSC measurements to characterize phase diagrams of steels. IOP Conf. Series: Mater. Sci. Eng. 2012, 33, 012064. [Google Scholar] [CrossRef]
  75. Slater, C.; Hechu, K.; Sridhar, S. Characterisation of solidification using combined confocal scanning laser microscopy with infrared thermography. Mater. Charact. 2017, 126, 144–148. [Google Scholar] [CrossRef]
  76. Phelan, D.; Moon, S.C.; Cuiuri, D.; Li, H.; Dippenaar, R. The development of HTCM-DTA for the study of solidification. In Proceedings of the 5th Decennial International Conference on Solidification Processing, Old Windsor, UK, 25–27 July 2017. [Google Scholar]
  77. Withers, P.J. Synchrotron X-ray diffraction. Pract. Residual Stress Meas. Methods 2013, 163–194. [Google Scholar] [CrossRef]
  78. Komizo, Y.; Terasaki, H. In situ time resolved X-ray diffraction using synchrotron. Sci. Technol. Weld. Join. 2011, 16, 79–86. [Google Scholar] [CrossRef]
  79. Lin, S.; Borggren, U.; Stark, A.; Borgenstam, A.; Mu, W.; Hedström, P. In-Situ High-Energy X-ray Diffraction Study of Austenite Decomposition During Rapid Cooling and Isothermal Holding in Two HSLA Steels. Metall. Mater. Trans. A 2021, 52, 1812–1825. [Google Scholar] [CrossRef]
  80. Ioannidou, C.; König, H.-H.; Semjatov, N.; Ackelid, U.; Staron, P.; Körner, C.; Hedström, P.; Lindwall, G. In-situ synchrotron X-ray analysis of metal Additive Manufacturing: Current state, opportunities and challenges. Mater. Des. 2022, 219, 110790. [Google Scholar] [CrossRef]
  81. Kerr, H.W.; Kurz, W. Solidification of peritectic alloys. Int. Mater. Rev. 1996, 41, 129–164. [Google Scholar] [CrossRef]
  82. Stefanescu, D.M. Microstructure Evolution during the Solidification of Steel. ISIJ Int. 2006, 46, 786–794. [Google Scholar] [CrossRef] [Green Version]
  83. Azizi, G.; Thomas, B.G.; Zaeem, M.A. Review of Peritectic Solidification Mechanisms and Effects in Steel Casting. Metall. Mater. Trans. B 2020, 51, 1875–1903. [Google Scholar] [CrossRef]
  84. Grill, A.; JK, B. Influence of Carbon Content on Rate of Heat Extraction in the Mould of a Continous-Casting Machine. In Ironmakg and Steelmakg; Maney Publishing: Leeds, UK, 1976; Volume 3, pp. 76–79. [Google Scholar]
  85. Emi, T.; Fredriksson, H. High-speed continuous casting of peritectic carbon steels. Mater. Sci. Eng. A 2005, 413–414, 2–9. [Google Scholar] [CrossRef]
  86. Luo, S.; Liu, G.; Wang, P.; Wang, X.; Wang, W.; Zhu, M. In Situ Observation and Phase-Field Modeling of Peritectic Solidification of Low-Carbon Steel. Metall. Mater. Trans. A 2020, 51, 767–777. [Google Scholar] [CrossRef]
  87. Yin, H.; Emi, T.; Shibata, H. Morphological instability of δ-ferrite/γ-austenite interphase boundary in low carbon steels. Acta Mater. 1999, 47, 1523–1535. [Google Scholar] [CrossRef]
  88. McDonald, N.J.; Sridhar, S. Peritectic reaction and solidification in iron-nickel alloys. Metall. Mater. Trans. A 2003, 34, 1931–1940. [Google Scholar] [CrossRef]
  89. Liu, Z.; Kobayashi, Y.; Yang, J.; Nagai, K.; Kuwabara, M. “In-situ” observation of the δ/γ phase transformation on the surface of low carbon steel containing phosphorus at various cooling rates. ISIJ Int. 2006, 46, 847–853. [Google Scholar] [CrossRef] [Green Version]
  90. Phelan, D.; Reid, M.; Dippenaar, R. Kinetics of the peritectic reaction in an Fe–C alloy. Mater. Sci. Eng. A 2008, 477, 226–232. [Google Scholar] [CrossRef]
  91. Griesser, S.; Bernhard, C.; Dippenaar, R. Mechanism of the Peritectic Phase Transition in Fe–C and Fe–Ni Alloys under Conditions Close to Chemical and Thermal Equilibrium. ISIJ Int. 2014, 54, 466–473. [Google Scholar] [CrossRef] [Green Version]
  92. Moon, S.-C.; Phelan, D.; Dippenaar, R. New insights of the peritectic phase transition in steel through in-situ measurement of thermal response in a high-temperature confocal microscope. Mater. Charact. 2021, 172, 110841. [Google Scholar] [CrossRef]
  93. Ohno, M.; Matsuura, K. Diffusion-controlled peritectic reaction process in carbon steel analyzed by quantitative phase-field simulation. Acta Mater. 2010, 58, 6134–6141. [Google Scholar] [CrossRef] [Green Version]
  94. Matsuura, K.; Itoh, Y.; Narita, T. A Solid-Liquid Diffusion Couple Study of a Peritectic Reaction in Iron-Carbon System. ISIJ Int. 1993, 33, 583–587. [Google Scholar] [CrossRef] [Green Version]
  95. Fredriksson, H.; Nylén, T. Mechanism of peritectic reactions and transformations. Met. Sci. 1982, 16, 283–294. [Google Scholar] [CrossRef]
  96. Mullins, W.W.; Sekerka, R.F. Stability of a Planar Interface During Solidification of a Dilute Binary Alloy. J. Appl. Phys. 1964, 35, 444–451. [Google Scholar] [CrossRef]
  97. Dippenaar, R.J.; Phelan, D.J. Delta-ferrite recovery structures in low-carbon steels. Metall. Mater. Trans. B 2003, 34, 495–501. [Google Scholar] [CrossRef] [Green Version]
  98. Fredriksson, H.; Stjerndahl, J. Solidification of iron-base alloys. Met. Sci. 1982, 16, 575–586. [Google Scholar] [CrossRef]
  99. Arai, Y. Master’s Thesis. Tohoku University, Sendai, Japan, 1998. [Google Scholar]
  100. Phelan, D.; Reid, M.; Dippenaar, R. Experimental and modeling studies into high temperature phase transformations. Comput. Mater. Sci. 2005, 34, 282–289. [Google Scholar] [CrossRef]
  101. Hillert, M. Solidification and Casting of Metals; The Metals Society: London, UK, 1979; p. 81. [Google Scholar]
  102. Wei, Z.-J.; Ji, C.; Chen, T.-C.; Zhu, M.-Y. In Situ Observations and Microstructure Evolution Behavior of Static Recrystallization of Microalloyed Continuous Casting Slabs in a Solidification End Reduction Process. Steel Res. Int. 2022, 93, 2100348. [Google Scholar] [CrossRef]
  103. Boettinger, W.J.; Kattner, U.R.; Moon, K.-W.; Perepezko, J.H. DTA and heat-flux DSC measurements of alloy melting and freezing. In Methods for Phase Diagram Determination; Elsevier: Amsterdam, The Netherlands, 2007; pp. 151–221. [Google Scholar] [CrossRef]
  104. Chattopadhyay, K.; Goswami, R. Melting and superheating of metals and alloys. Prog. Mater. Sci. 1997, 42, 287–300. [Google Scholar] [CrossRef]
  105. Bernhard, M.; Fuchs, N.; Presoly, P.; Angerer, P.; Friessnegger, B.; Bernhard, C. Characterization of the γ-loop in the Fe-P system by coupling DSC and HT-LSCM with complementary in-situ experimental techniques. Mater. Charact. 2021, 174, 111030. [Google Scholar] [CrossRef]
  106. Bernhard, M.; Presoly, P.; Fuchs, N.; Bernhard, C.; Kang, Y.-B. Experimental study of high temperature phase Equilibria in the Iron-rich part of the Fe-P and Fe-CP systems. Metall. Mater. Trans. A 2020, 51, 5351–5364. [Google Scholar] [CrossRef]
  107. Liu, T.; Long, M.; Chen, D.; Wu, S.; Tang, P.; Liu, S.; Duan, H.; Yang, J. Investigations of the peritectic reaction and transformation in a hypo-peritectic steel: Using high-temperature confocal scanning laser microscopy and differential scanning calorimetry. Mater. Charact. 2019, 156, 109870. [Google Scholar] [CrossRef]
  108. Egry, I. Structure and properties of levitated liquid metals. J. Non-Crystalline Solids 1999, 250–252, 63–69. [Google Scholar] [CrossRef]
  109. Cummings, D.L.; Blackburn, D.A. Oscillations of magnetically levitated aspherical droplets. J. Fluid Mech. 1991, 224, 395–416. [Google Scholar] [CrossRef]
  110. Yu, J.; Koshikawa, N.; Arai, Y.; Yoda, S.; Saitou, H. Containerless solidification of oxide material using an electrostatic levitation furnace in microgravity. J. Cryst. Growth 2001, 231, 568–576. [Google Scholar] [CrossRef]
  111. Watanabe, M.; Ozawa, S.; Fukuyama, H.; Tsukada, T.; Hibiya, T. Levitation Research in Japan. In Metallurgy in Space: Recent Results from ISS; Springer International Publishing: New York, NY, USA, 2022; pp. 235–260. [Google Scholar]
  112. Yasuda, H.; Yoshimoto, T.; Mizuguchi, T.; Tamura, Y.; Nagira, T.; Yoshiya, M. Effect of the Melt Flow on the Solidified Structure of Middle Carbon Steel by Means of the Levitation Method Using Alternating and Static Magnetic Fields. ISIJ Int. 2007, 47, 612–618. [Google Scholar] [CrossRef]
  113. Fukuyama, H.; Higashi, H.; Yamano, H. Normal spectral emissivity, specific heat capacity, and thermal conductivity of type 316 austenitic stainless steel containing up to 10 mass% B4C in a liquid state. J. Nucl. Mater. 2022, 568, 153865. [Google Scholar] [CrossRef]
  114. Yasuda, H.; Ohnaka, I.; Ishii, R.; Fujita, S.; Tamura, Y. Investigation of the Melt Flow on Solidified Structure by a Levitation Technique Using Alternative and Static Magnetic Fields. ISIJ Int. 2005, 45, 991–996. [Google Scholar] [CrossRef] [Green Version]
  115. Fukuyama, H.; Sawada, R.; Nakashima, H.; Ohtsuka, M.; Yoshimi, K. Study of solidification pathway of a MoSiBTiC alloy by optical thermal analysis and in-situ observation with electromagnetic levitation. Sci. Rep. 2019, 9, 15049. [Google Scholar] [CrossRef] [Green Version]
  116. Shoji, E.; Isogai, S.; Suzuki, R.; Kubo, M.; Tsukada, T.; Kai, T.; Shinohara, T.; Matsumoto, Y.; Fukuyama, H. Neutron computed tomography of phase separation structures in solidified CuCo alloys and investigation of relationship between the structures and melt convection during solidification. Scr. Mater. 2020, 175, 29–32. [Google Scholar] [CrossRef]
  117. Kobayashi, A.; Nagayama, K. Microstructure and Solidification Process of Fe-Cu Immiscible Alloy by Using Containerless Process. J. Jpn. Inst. Met. Mater. 2017, 81, 251–256. [Google Scholar] [CrossRef] [Green Version]
  118. Matson, D.M.; Fair, D.J.; Hyers, R.W.; Rogers, J.R. Contrasting Electrostatic and Electromagnetic Levitation Experimental Results for Transformation Kinetics of Steel Alloys. Ann. N. Y. Acad. Sci. 2004, 1027, 435–446. [Google Scholar] [CrossRef] [PubMed]
  119. Andreoli, A.F.; Shuleshova, O.; Witusiewicz, V.T.; Wu, Y.; Yang, Y.; Ivashko, O.; Dippel, A.C.; Zimmermann, M.V.; Nielsch, K.; Kaban, I. In situ study of non-equilibrium solidification of CoCrFeNi high-entropy alloy and CrFeNi and CoCrNi ternary suballoys. Acta Mater. 2021, 212, 116880. [Google Scholar] [CrossRef]
  120. Yan, P.; Chang, J.; Wang, W.; Zhu, X.; Lin, M.; Wei, B. Eutectic growth kinetics and microscopic mechanical properties of rapidly solidified CoCrFeNiMo0.8 high entropy alloy. Acta Mater. 2022, 237, 118149. [Google Scholar] [CrossRef]
  121. Andreoli, A.F.; Han, X.; Kaban, I. In situ studies of non-equilibrium crystallization of AlxCoCrFeNi (x = 0.3, 1) high-entropy alloys. J. Alloys Compd. 2022, 922, 166209. [Google Scholar] [CrossRef]
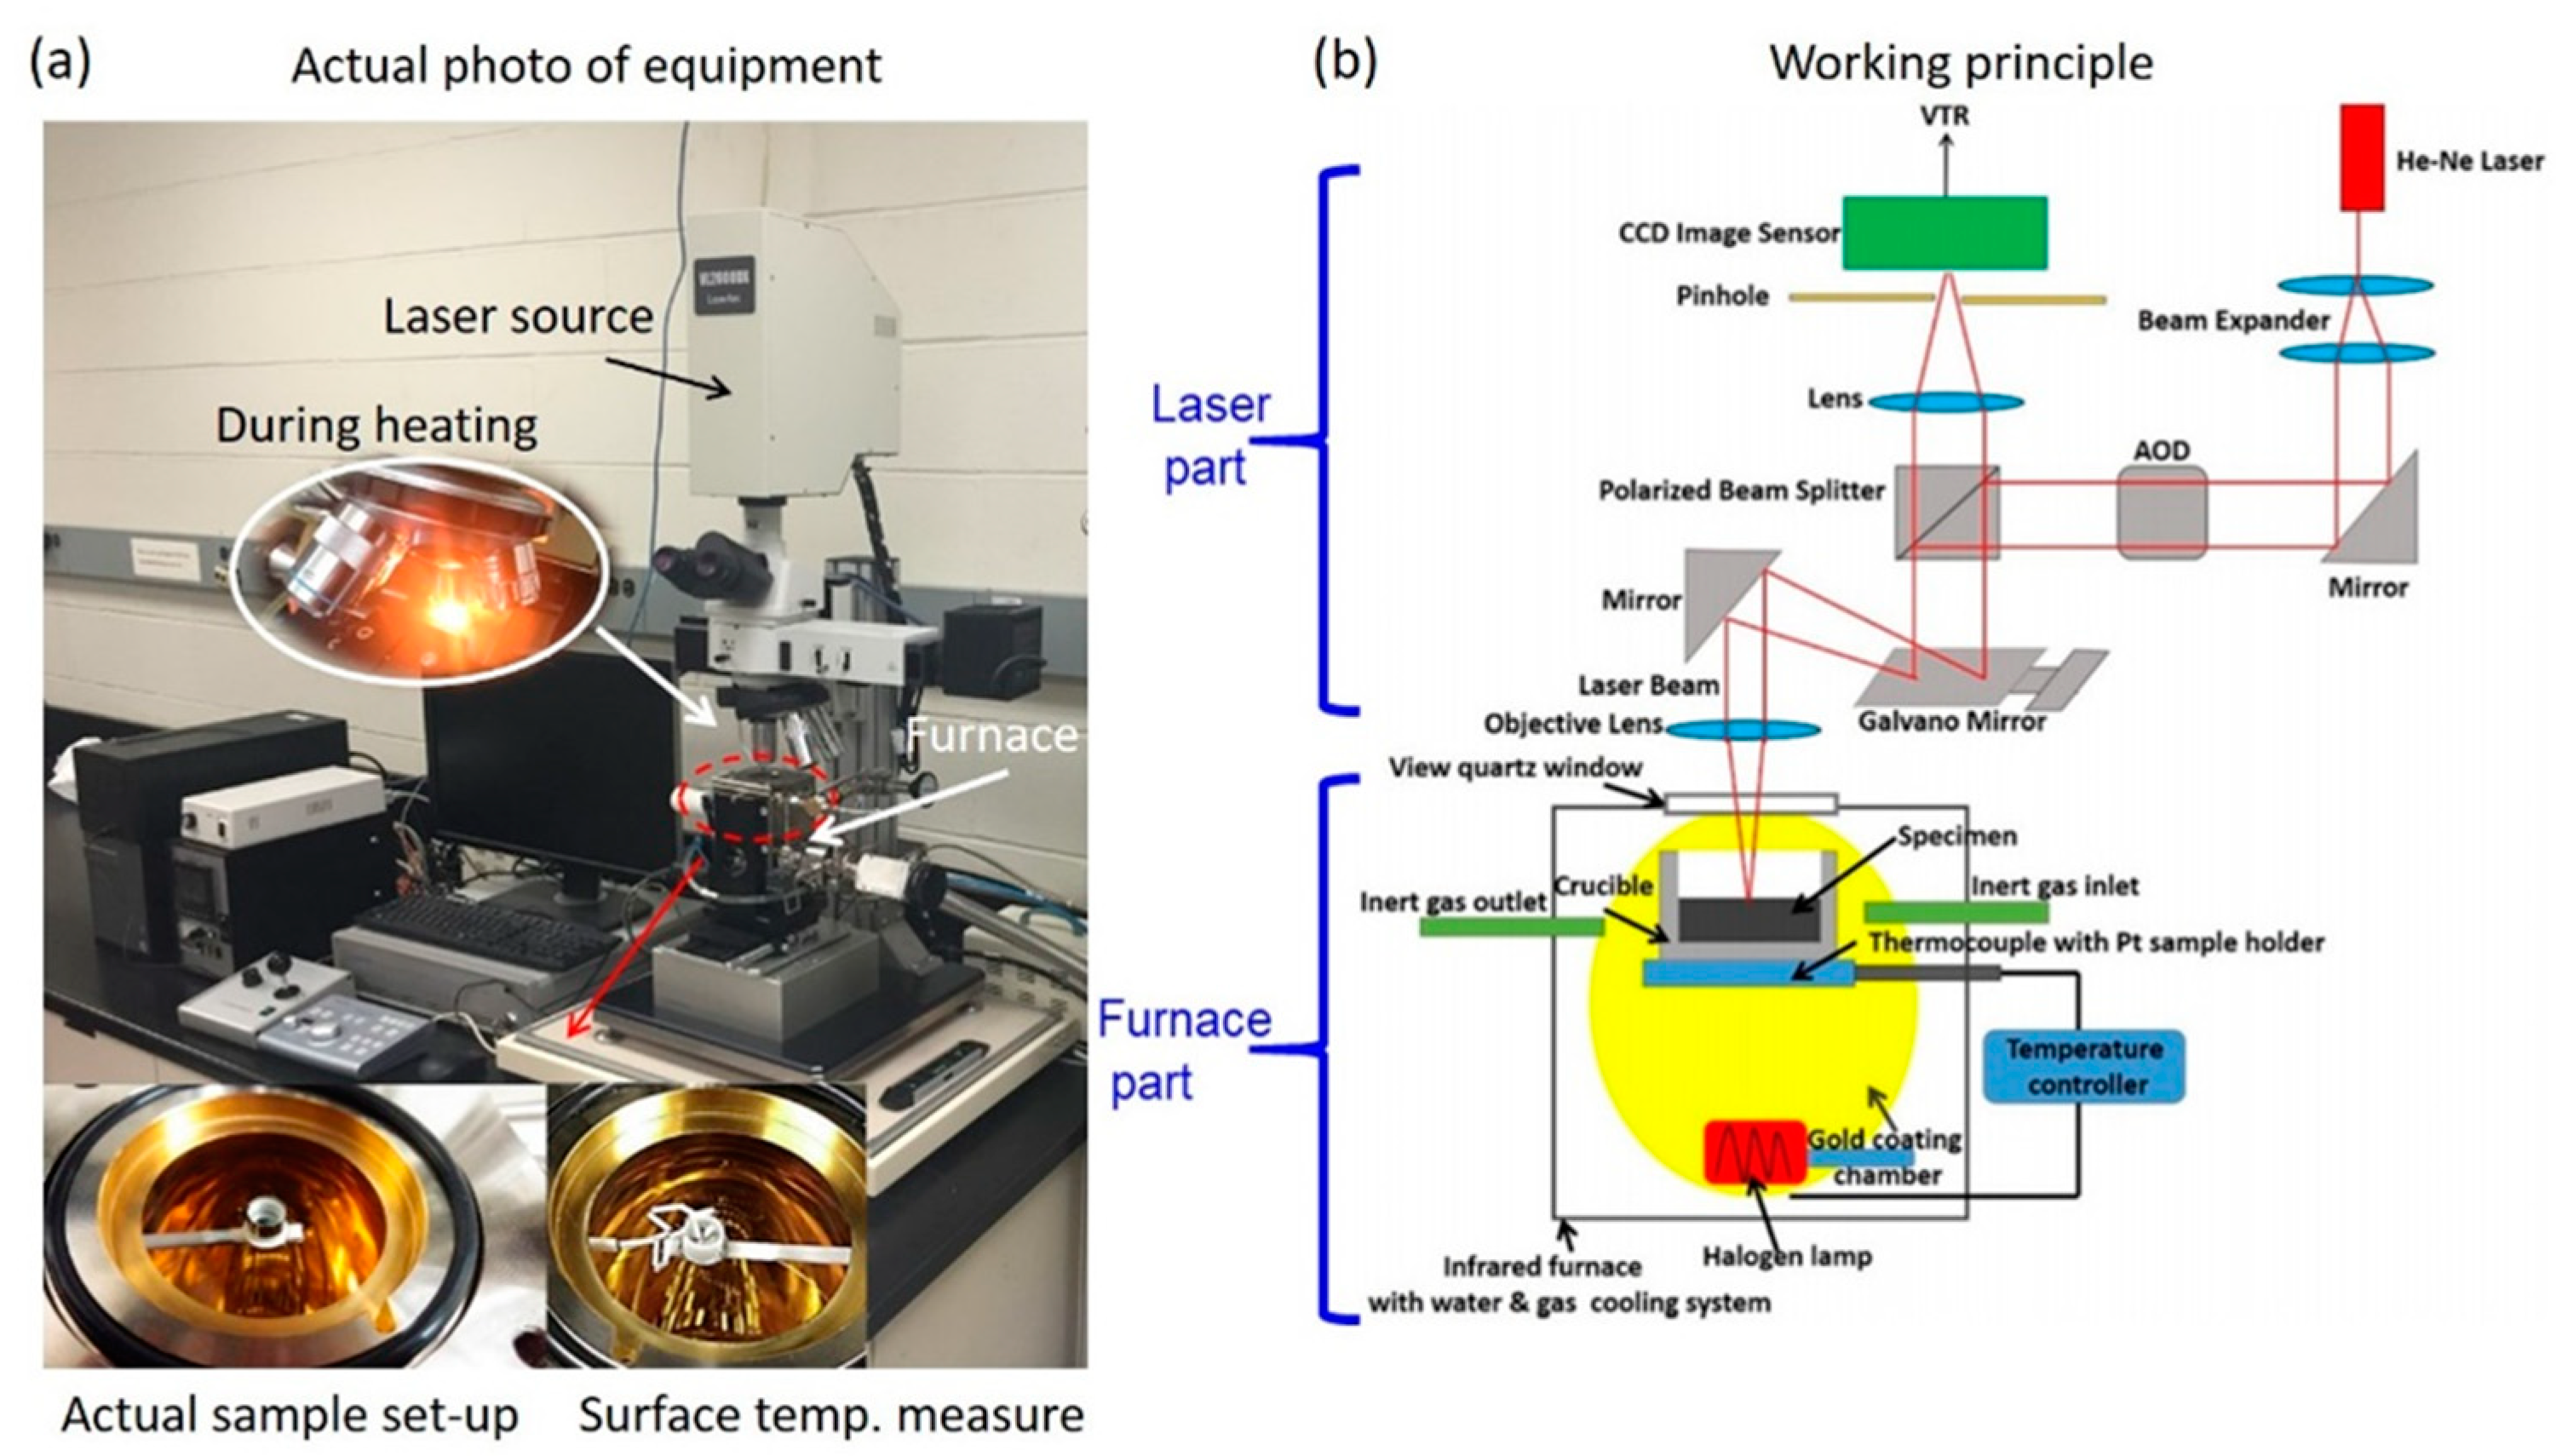
Figure 1. (a) Actual photo of the HT-CLSM equipment; (b) schematic illustration of its working principle, adapted images from Ref. [68] with permission.
Metals 13 00517 g001
Figure 2. (a) Fe-C binary phase diagram and (b) capability of temperature profile for low-alloy steel research using HT-CLSM.
Metals 13 00517 g002
Figure 3. Overview of concentric solidification technique, (a) the schematic illustration of sample and thermocouple set-up, (b) measurement of radiant beam diameter by the thermo-graphic paper and (c) microstructure evolution in different zones of the solidified specimen. Images adapted from Refs. [19,71] with permission.
Metals 13 00517 g003
Figure 4. (a) Actual picture of a specimen with a few thermocouples spot welded on different locations. (b) Image of the experimental proceeds with thermocouples for measuring the liquid temperature, which is glued to the edge of the sample holder. Here, alumina cement is used as the additional containment of movement. (c) Typical results of temperature distribution over the radial distance measured by different thermocouples. Images are taken from Ref. [27] with permission from Springer.
Metals 13 00517 g004
Figure 5. (a) Schematic illustration of the set-up of combined HT−CLSM with infrared thermography; (b) typical results of the radiated heat measured by the thermographer from the low−alloy steel sample with a 1 °C/s cooling; (b,c) HT−CLSM images with the same solidification condition. Reprinted from Ref. [75] with permission from Elsevier.
Metals 13 00517 g005
Figure 6. (a) Schematic illustration of the set-up of simultaneously combined DTA and HT−CLSM; (b) typical results. Reprinted from Ref. [28] with permission.
Metals 13 00517 g006
Figure 7. (a) Actual photograph of experimental set-up at 46XU beamline at SPring-8 in Japan; (b) Schematic illustration of the experimental set-up using HT-CLSM with time-resolved SHEXRD. Reprinted from Ref. [78] with permission.
Metals 13 00517 g007
Figure 8. Planar (ad) and cellular (e,f) growth of δ crystals in Fe-0.14 mass pct C alloy melt. Images adapted from Refs. [10,21] with permission.
Metals 13 00517 g008
Figure 9. Mechanism of peritectic solidification (a) and crystal growth in peritectic steel in HT-CLSM (b). Images adapted from Refs. [83,86] with permission.
Metals 13 00517 g009
Figure 10. Peritectic reaction and transformation (ad) of Fe-0.14 mass pct C steel during solidification and (eh) of Fe-0.42 mass pct C steel during solidification isothermal holding at 1492 °C, adapted image from Ref. [10] with permission.
Metals 13 00517 g010
Figure 11. Sequence of the growth of γ-triple-point cell and γ-grain boundary cells along δ-grain boundaries (a) and the morphological instability of γ/δ interphase boundaries during δ→γ transformation at a high supercooling of 11 K (b). Images adapted from Ref. [87] with permission.
Metals 13 00517 g011
Figure 12. Delta-ferrite sub-boundary microstructure (a) and preferential growth of austenite on a delta-ferrite sub-structure (b) and the completion of the transformation to austenite (c). Images adapted from Ref. [22] with permission.
Metals 13 00517 g012
Figure 13. Solid δ/γ transformation sequence at (ad) a low cooling rate and (eh) a high cooling rate. Images adapted from Ref. [89] with permission.
Metals 13 00517 g013
Figure 14. Growth of the γ phase at L/δ interface in the early stages of the peritectic reaction of the Fe-5.10% Ni alloy, (a) 0 s, (b) 1 s, (c) 4 s, (d) 7 s. Images adapted from Ref. [11] with permission.
Metals 13 00517 g014
Figure 15. Peritectic reaction and transformation in Fe-0.18% C alloy at a cooling rate of (a, b) 10 K/min, (c, d) 50 K/min and (e, f) 100 K/min. Images adapted from Ref. [21] with permission.
Metals 13 00517 g015
Figure 16. Three different modes of the peritectic phase transition observed during concentric solidification: (a) planar (diffusion-controlled), (b) coarse cellular/dendritic (diffusion-controlled) and (c) fine cellular/dendritic (massive-type of transformation). Images adapted from Ref. [24] with permission.
Metals 13 00517 g016
Figure 17. Incremental growth of γ by temperature decrease in a Fe-0.43% C alloy. Image adapted from Ref. [91] with permission.
Metals 13 00517 g017
Figure 18. Schematic diagrams of two distinct peritectic transformations in a solidifying steel shell within a continuous casting mold. Image adapted from Ref. [26] with permission.
Metals 13 00517 g018
Figure 19. Simulated peritectic reaction process (a) and the L/γ/δ triple-point motion along the L/δ interface during the peritectic reaction (b). Images adapted from Ref. [86] with permission.
Metals 13 00517 g019
Figure 20. Pearlite/Widmanstäten nucleation and growth after the decomposition of austenite in a 0.42% C steel, (a) Widmanstäten ferrite plates (W) grow from the bottom right-hand corner, (b) a pearlite colony (P) nucleates and grows from the bottom left-hand corner, (c) the first pearlite colony sweeps across the sample consuming austenite and isolating individual Widmanstäten ferrite plates, a second pearlite colony grows from the top of the image, (d) the Widmanstäten ferrite plate colony is trapped in-situ by the pearlite which continues to grow into the austenite. Images adapted from Ref. [19] with permission.
Metals 13 00517 g020
Figure 21. Schematic of recrystallization grain evolution with holding time obtained by HT-CLSM, (a) 92 s, (b) 138 s, (c) 182 s, (d) 188 s. Images adapted from Ref. [102] with permission.
Metals 13 00517 g021
Figure 22. DSC and HT-LSCM measurements of (a) Fe-0.08% C-1% Si and (b) Fe-0.14% C-1% Si. Images adapted from Ref. [5] with permission.
Metals 13 00517 g022
Figure 23. Combination of the DSC and CSLM results during the controlled cooling of 30 °C/min in the Fe − 0.07% C alloy sample, (a) δ phase formation, (b) the liquid phase fully solidified, (c) δ→γ transformation started, (d) δ→γ transformation finished. Images adapted from Ref. [6] with permission.
Metals 13 00517 g023
Figure 24. Combination of the DSC and CSLM results during the controlled cooling of 30 °C/min in the Fe-0.11% C alloy sample, (a) δ phase formation, (b) the liquid phase fully solidified, (c) δ→γ transformation started, (d) δ→γ transformation finished. Images adapted from Ref. [6] with permission.
Metals 13 00517 g024
Table 1. Summary of HT-CLSM activities for crystallization during solidification of low-alloy steels.
Authors (Year)Alloy SystemHighlighted Key FindingsRef.
Chikama et al. (1996)Fe-C (0.2, 0.83)growth of planner/cellular/dendritic transition[9]
Yin et al. (1998)Fe-C (0.04)free energy of γ/δ can be obtained by measuring the dihedral angle [12]
Yin et al. (1999)Fe-C (0.04)morphological instability of δ/γ interphase boundary was observed[87]
Shibata et al. (2000)Fe-C (0.14, 0.42)peritectic reaction and transformation of steels were firstly analyzed using HT-CLSM [10]
McDonald et al. (2003)Fe-Ni (4.3, 4.7)peritectic reaction increased with increased undercooling[88]
Phelan et al. (2004)Fe-C (0.06)γ grew preferentially along δ sub-boundaries[22]
Reid et al. (2004)Fe-C (0.17, 0.42)concentric solidification technique has been firstly reported[19]
Arai et al. (2005)Fe-Ni (3.7, 5.1, 5.3)initial stages of the peritectic transformation
have been clearly observed
[11]
Liu et al. (2006)Fe-Cthe effect of phosphorus and cooling rates on the δ→γ transformation was reported [89]
Phelan et al. (2006)Fe-C (0.18)the L/δ interface propagated at a higher velocity than the γ/δ interface at a higher cooling rate[21]
Phelan et al. (2008)Fe-C (0.18)a new mechanism that the peritectic reaction was controlled by the rate of heat dissipation released by the growing γ along the L/δ interface[90]
Presoly et al. (2013)Fe-C (0.08–0.25)phase transformation of steels during the heating process observed by DSC and HT-SLCM[5]
Griesser et al. (2014)Fe-C and Fe-Ni the dependency of the early nucleation process on
the presence of solute diffusion fields
of the newly forming cluster was firstly clarified
[23]
Griesser et al. (2014)Fe-C (0.1, 0.18, 0.43)three different modes of peritectic transformation were reported based on different undercooling conditions[24]
Griesser et al. (2014)Fe-C and Fe-Ni re-melting of δ during the peritectic reaction has been clearly observed[91]
Moon et al. (2015)Fe-C (0.05–0.44)potential countermeasures to avoid surface defects
during steel casting were proposed
[26]
Hechu et al. (2017)Fe-C (0.07, 0.11)solidification of peritectic steels was observed by DSC and HT-SLCM[6]
Luo et al. (2020)Fe-C (0.83)peritectic solidification has been clearly investigated by the phase modeling method[86]
Moon et al. (2021) Fe-C (0.06, 0.18, 0.45)a new technique was developed through a spatial combination of a DTA and an HT-CLSM[92]
Disclaimer/Publisher’s Note: The statements, opinions and data contained in all publications are solely those of the individual author(s) and contributor(s) and not of MDPI and/or the editor(s). MDPI and/or the editor(s) disclaim responsibility for any injury to people or property resulting from any ideas, methods, instructions or products referred to in the content.