Abstract
Morels (Morchella spp.) are wild edible mushrooms and are globally known for their high nutritional value. The current study aims at probing the heavy metal content in early emerging autumn-type Morchella galilaea that occurs exclusively in the irrigated plains of Charsadda, Pakistan. The identification of samples was conducted through morphology and internal transcribed spacer sequence (ITS) data. Atomic absorption spectrophotometer was employed to analyze the soil and M. galilaea samples for heavy metals including Mn, Ni, Pb, Zn, and Cu. The heavy metal content in soil samples was within the permissible limits of SEPA China and WHO, USA with few exceptions. The hymenophore (H) and fruiting bodies (FB) were also analyzed revealing these metals within the permissible limits set by WHO and SEPA. Further analysis indicated that heavy metal concentration in the fruiting body (FB) was higher compared to those in the hymenophore (H). The toxicological assessment revealed that the transfer factor (TF) was less than 1 with a significant difference (p < 0.05) among samples. The daily intake of metals and health risk index values for all samples were <1. Hence, the daily intake of M. galilaea harvested from the wild has no toxicological hazards to human health, especially in the heavy metal concentration.
1. Introduction
Many communities around the world consume wild edible morels for their delicious taste and high nutritional value. Morels contain high content of crude proteins, vitamins, carbohydrates, ash, fat, energy, and minerals with low-calorie content [1,2]. Hence, these are a rich source of carbohydrates and protein and nutritionally equivalent to the legumes and meat [3]. Morels being fungi, depend on dead organic matter and certain metals as micronutrients and macronutrients [4]. Wild morels can accumulate high concentrations of obnoxious metallic elements and metalloids e.g., cadmium, copper, lead, mercury, arsenic, and aluminum [5,6,7,8]. The accumulation of metals though varies in morel species [9], the soil type and climatic conditions do play a critical role.
Anthropogenic activities including industrial activities, composts, fly spare, and overutilization of natural raw material induces the mobilization of huge quantities of gas and silt pollutants. Inflowing into the atmosphere, water and soil, these impurities interrupt the balance of the environment [10,11,12,13]. Heavy metal contents accumulated in the fruiting body, hymenophore (stipe), and spores of morels may vary due to the very nature and differences in the translocation rate of metals [14]. Moreover, the substrate (soil in this case) contains numerous quantities of metals. These may be hazardous due to the noxiousness and natural tenacity [15,16]. Morels are omnipresent in nature and play a significant role in the forest ecosystem. These are amenably active in salvaging energy and nutrients through mycorrhizal synergies [17,18]. The dietary intake of metals through polluted food products is a key in heavy metals accumulation in human body, causing serious health issues [19,20,21]. According to literature even traces of heavy metals, may cause serious diseases, such as cardiovascular, kidneys, and bones besides their impact on children’s IQ [22,23]. The World Health Organization (WHO) has prescribed the maximum permissible concentrations of heavy metals in foodstuffs for evaluating their safety [24].
The hilly north of Pakistan is rich in wild edible morels which serve as a source of nutrients for local consumers and of income for the collector community [25,26], as an important component of their food and medicine. Morchella species (Morels) are the most used and traded edible mushrooms in these areas. The low-elevation agricultural sites in Charsadda, Pakistan also hold a rare type that emerges in autumn and winter (during December and January), identified as Morchella galilaea, a type originally described in the Middle East by Clowez (2012) and also reported [27]. With this collection in hand, the current study aims at assessing heavy metals (Cu, Pb, Ni, Mn, and Zn) accumulation in the hymenophore (stipe) and fruiting body (FB) of M. galilaea and the substrate it grows on from district Charsadda, Pakistan. To our knowledge, this has been a pioneer study-reporting occurrence of Morchella galilaea from low-elevation irrigated areas of Pakistan and investigating their heavy metal content.
2. Materials and Methods
2.1. Soil Analysis
Soil samples (200–300 g) were randomly collected from surface soil at 0–30 cm depth in triplicates through a stainless-steel auger with a grid sample pattern from each side of the selected zone (Table S1). Samples were stored at ambient temperature in LDPE bags (polythene) and brought to Plant Genetics and Genomics Laboratory, Quaid-i-Azam University Islamabad. The samples were air-dried, pulverized into a glowing powder, passed through a 2 mm mesh sieve (ISO), and stowed in LDPE polythene bags at 4 °C for further analysis [28]. The dried soil samples ca. 1 g were digested in 15 mL of aqua regia (HCL and HNO3 at 3:1) (Merck Germany, 99.99%). The samples were kept for 24 h and then heated on the hot plate (240–280 °C) until the brown fumes emerged. Further concentrated HClO4 (5 mL) was added and heated the solution to evaporate. The samples were filtered using Whatman filter paper No. 42 and the final volume was attuned to 50 mL with distilled-de-ionized water (Milli-Q water, Millipore, Saint Luis, MO, USA).
2.2. Sample Collection and Analysis
Morel samples were collected during December 2021 and January 2022 from the district of Charsadda (Table S2). The sites were located at 34°22′6.70″ N and 71°48′51.02″ E in the Khyber Pakhtunkhwa Province, Pakistan (Figure 1). The morel samples were found in sugarcane fields which were all irrigated. A total of 15 samples were collected from different locations and cleaned to remove the unwanted soil particles. The samples were then shade dried and preserved in paper bags for further analysis. The identification of samples was confirmed by considering morphological characters as well as through analysis of ITS sequences of DNA (obtained commercially) and compared with the existing sequences through BLASTn queries of NCBI GenBank.
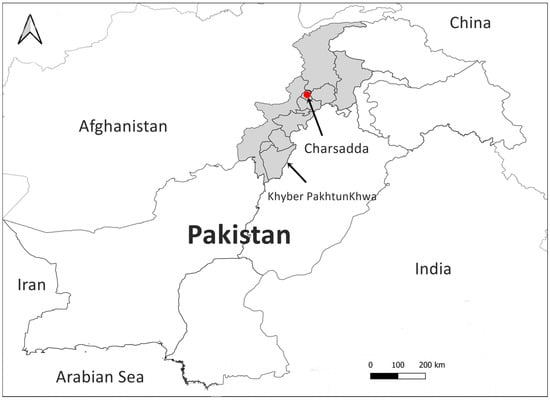
Figure 1.
Map of the study area Charsadda, Khyber Pakhtunkhwa (highlighted) Pakistan.
For heavy metals analysis, 0.5 g sample each of the fruiting body (FB) and hymenophore (H) of M. galilaea was added to a solution of 5:1:1 (HNO3, H2SO4, and HClO4 in the respective ratio) Merck Germany and incubated for 30 min in a microwave oven at 180 °C at 30 bar pressure [29]. The extracts were filtered, and a final volume of 50 mL was raised with distilled de-ionized water. The quantitative determination of heavy metals (mg/kg) was carried out using a fast sequential atomic absorption spectrometer with a hollow cathode lamp (AA24FS).
2.3. Quality Control (QC) Analysis
The entire reagents used in the investigation were of analytical grade. The plasticware and glassware used were systematically sluiced with 10% HNO3 (99.99%) solution followed by washing with de-ionized distilled H2O. In order to estimate the analytical meticulousness, and to ensure the appropriate quality of analytical results, some essential necessities were completed. For data quality assurance, apiece sample was scrutinized in triplicate and subsequently batches of five samples, three standards, and 5 µg/L and 10 µg/L of respective metal concentrations were analyzed via atomic absorption spectrometer. The certified reference materials for soil (SRM2709) and M. galilaea were used to plaid the precision of the measurements (Table S3).
2.4. Translocation Factor
The fruiting body (FB) to stipe/hymenophore (H) ratio of heavy metals was measured by dividing the concentration of the metal in FB and in H.
In the equation, Cfb represents heavy metals concentration in FB and Ch represent heavy metals concentration in H.
2.5. Plant Transfer Factor
Heavy metals translocate from soil to the consumed parts of M. galilaea assessed as plant transfer factor (PTF) described previously [30]. The following formula was used to get the AF values for specific heavy metals found in wild morels and soil.
PTF = HM concentration in morels/HM concentration in the soil
2.6. Daily Intake of Metals
Daily intake of metals (DIM) is estimated as heavy metals taken by the human population (HP) in their daily food and was calculated as
DIM = Cmetal × Cfactor × Dfood intake/Bw
Heavy metal concentrations in fresh and dry weight, the total food ingested, and the average body weight of individuals are represented by Cmetal, Cfactor, Dfood intake, and Bw, respectively. The average daily ingestion rate for selected M. galilaea was 10 g/person/day. Moreover, the average body weight was recorded as 63 kg.
2.7. Health Risk Index HRI
The health risk index (HRI) assessment was calculated through DIM and reference oral dose (RfD) for only toxic heavy metals is given as follows:
HRI = DIM/RfD
If the HRI > 1 then the population warrants additional analysis as to any health issues. For this purpose, questionnaires from 80 individuals were administered and the overall body mass, age, and daily intake of M. galilaea were recorded.
2.8. Statistical Analysis
Data were analyzed statistically for range, mean and standard deviation. Independent sample T-test and One-way ANOVA were carried out to compare different metal concentrations in soil, fruiting body (FB), and hymenophore (H) of M. galilaea. Statistical analyses were implemented in SPSS 20 (SPSS Inc., Chicago, IL, USA).
3. Results and Discussion
3.1. Metals Concentration in the Soil Substrate
Heavy metal concentrations viz., Zn, Cu, Ni, Mn, and Pb quantified in soil are presented in Table 1, and their mean concentration values are shown in Figure 1. The heavy metals concentration ranges were 2.04 to 48.96 mg/kg for Cu, 59.14 to 67.15 mg/kg for Zn, 5.02 to 40.32 mg/kg for Mn, 7.0 to 49.93 mg/kg for Pb and 1.32 to 49.70 mg/kg for Ni. Hence, the order of maximum to the minimum concentration of metals was Zn > Pb > Ni > Cu > Mn in the soil samples. The heavy metal concentrations in the soil samples were within the permitted limits prescribed by the State Environmental Protection Administration of China (SEPA 2005) for Cu (100), Ni (60), Pb (350), and Zn (300) mg/kg.

Table 1.
Heavy metals concentration (mg/kg) in soil substrate.
Our results showed similarity for heavy metals concentration with the hitherto reported data as Cu, (3.79–100.53), Mn (130.42–591.2), Zn (45.01–405.9), Ni (4.63–59), Pb (5.68–51) in different soils across the world including Romania, southeast China, Iran, United States, France and Pakistan [31,32,33,34,35,36]. In the current study, the metal concentrations were within the nontoxic limits set by the EU (2002) and SEPA China (2005). Data analysis showed that the soil of the study zone is safe for agricultural activities (Figure 2). However, based on the variation in metals concentration in different sample locations periodic follow-up is needed for healthy agriculture practices.
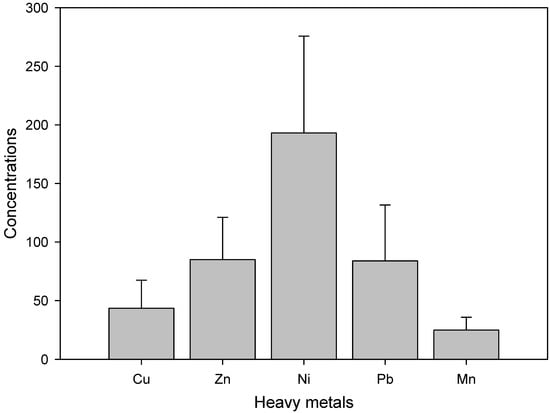
Figure 2.
Mean heavy metals concentration (mg/kg) in soil samples.
3.2. The Fate of Heavy Metals in M. galilaea (Fruiting Body (FB) and Hymenophore (H))
Statistical descriptions (Min to Max) for selected heavy metals in M. galilaea fruiting body (FB) and hymenophore (H) are summarized in Table 2a–c. The Cu, Zn, Mn, Pb and Ni concentrations in M. galilaea fruiting body were in the range of 9.0 to 14.1, 29.5 to 33, 0.8 to 20, 0.4 to 3.4, and 21.5 to 38.4 mg/kg respectively. The maximum concentration in selected M. galilaea fruiting body (FB) ranked in the order were: Ni > Zn > Mn > Cu > Pb respectively. Furthermore, the metal concentrations in hymenophore (H) of selected M. galilaea were observed in different ranges as Cu (0.1 to 9.6), Zn (27.2 to 29.2), Mn (0.2 to 6.20), Pb (0.1 to1.2) and Ni (1.2 to 20.24 mg/kg) respectively. The accumulation of heavy metals in the hymenophore (H) was in the order: Zn > Ni > Cu > Mn >Pb respectively. The mean Cu, Zn, Ni, Pb, and Mn concertation in FB were 9.63, 30.73, 78.36, 1.63 and 6.07 mg/kg respectively, while in hymenophore was: 5.62, 28.56, 36.42, 0.54, and 1.95 mg/kg (Figure 2). Hence, a monitoring mechanism may be devised that provides a statistical basis to assess the heavy metal concentration in soil and that translocated in the fruiting bodies of morels.
Table 2.
(a) Heavy metals concentration (mg/kg) in Morels fruiting body (FB). (b) Heavy metals concentration (mg/kg) in Morels hymenophore (H). (c) One-way ANOVA results showing the concentration of heavy metals translocating from soil to hymenophore and fruiting body (mg/kg) in M. galileae.
There were significant differences in the concentrations of heavy metals (Cu Zn Ni, Pb and Mn) from the soil to the hymenophore and fruiting body (p < 0.001).
Furthermore, the c/s ratio measuring the mineral concentrations in the fruiting body (FB) to those in the hymenophore (H), depicted the distribution of elements within the fruiting bodies of the M. galilaea (Table 3, Figure 3). A statistically significant difference was observed in the accumulation of elements in the fruiting body (FB) and hymenophore (H). The Zinc content ranged between 29.1 to 33 mg/kg in the fruiting body (FB) and 27.7–29.2 mg/kg in the hymenophore (H).
Table 3.
Translocation factor from FB to H for selected heavy metals.
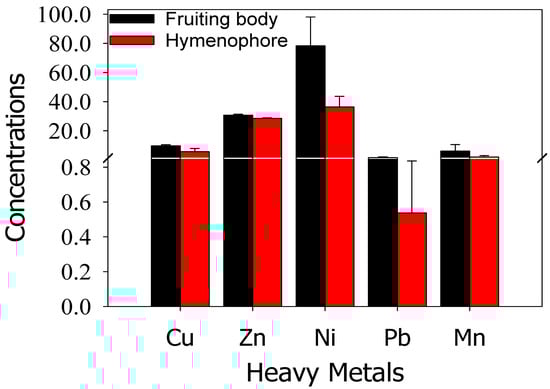
Figure 3.
Mean heavy metals concentration (mg/kg) in M. galilaea (fruiting body and Hymenophore).
Previously, higher concentrations of 190 mg/kg [37], 240 mg/kg, and 580 mg/kg [38], were reported in the fruiting bodies (FB). As shown in Table 2, the hymenophore (H) of M. galilaea have a lower Zn concentration in FB with the c/s value of 1.0–1.1. These results corroborate those reported previously [39]. However, the results may vary depending on the species, soil, and environmental conditions. For instance, a higher c/s ratio (c/s = 4.6) has been reported in the fruiting body of Boletus edulis studied in China [40].
Cu is a micronutrient required by organisms in small quantities. The Cu concentration in the fruiting body (FB) and hymenophore (H) ranged between 1.1 and 14.1 and 0.1 to 19 mg/kg respectively (Table 2a,b). As shown, Cu translocated more in the fruiting body (FB) than the hymenophore (H) in the case of M. galilaea with the c/s value ranging from 0.9 to 3.61. Previously, a higher c/s value of 3.8 was reported. Furthermore, Cu content in the fruiting body (FB) of Leccinum mushrooms was higher than those in hymenophores (H).
Ni content in M. galilaea was found as 21.5 to 38.4, 1.2 to 20.244, Pb 0.4 to 3.4, 0.1 to 2.1 and Mn 0.8 to 20, 0.2 to 6.2 mg/kg in the fruiting body (FB) and hymenophore (H), respectively. The permissible limits for Mn, Fe, Ni, Cu, Pb, Zn, C, and Cr were reported as 100–400, 15, 100–300, 40, 3–10, 60, 0.3–10, and 120 mg/kg, respectively [41,42]. In the current study, all metals were within the permissible limits prescribed by WHO and SEPA. The higher concentration of Zn and Mn may be explained through greater geo-genic input of these metals from the adjoining areas. Further, we collected the samples from the agricultural lands, which might be receiving the discharge of surrounding industries and application of various chemicals on crops containing a fraction of these metals.
The accumulation of metals, generally, in fruiting bodies (FB) were recorded higher as a comparison to those in hymenophore (H). This indicates the porous and spongy nature of morel fruiting bodies offering more space to the nutrient influx into FB compared to H, the size and the physiological differences in structure. All these factors are responsible for the differential translocation of elements/metals. On the contrary, we observed a preferentially less translocation of Pb into the fruiting bodies. Although, the primary source of metal deposition is the soil substrate, it may also receive an additional source from the atmosphere. Here a straight correlation of HMs in soil and atmosphere to those in FB and H was recorded. However, the concentrations of metals were significantly (p < 0.05) different between the fruiting body and hymenophore (H).
3.3. Translocation Factor
The translocation factor (TF) of heavy metals from FB and H of M. galilaea are summarized in Table 4. The results indicated that the TF values were greater than 1 for all the selected heavy metals, showing that the heavy metals accumulated in the soil are ultimately translocated to the FB. Previously it was reported that the bioavailability and accumulation rate vary from plant to plant and within the plants from organ to organ [43]. The highest TF values for Zn, Ni, Pb, Mn and Cu were: 1.47, 1.19, 4.01, 2.14, and 1.09 respectively [44]. The TF values in the present study were higher than those reported in [45], while lower than those reported elsewhere [46].
Table 4.
The soil to plat transfer (PTF) of heavy metals.
3.4. Plant Transfer Factor (PTF)
The soil-to-plant transfer of heavy metals is one of the major source of food chain contamination. The soil-to-plant transfer of heavy metals varies from metal to metal for the same plant species. The bioaccumulation of heavy metals depends on their concentrations in soil, physiochemical properties, and plant physiology [47]. In the present study, the PTF values were calculated to assess the bioaccumulation and subsequently human health risk through the consumption of M. galilaea (Table 4 and Figure 4. The mean PTF for FB was greater than 1 (PTF > 1) for all the heavy metals except for Cu, while for H the PTF was <1 for all the heavy metals.
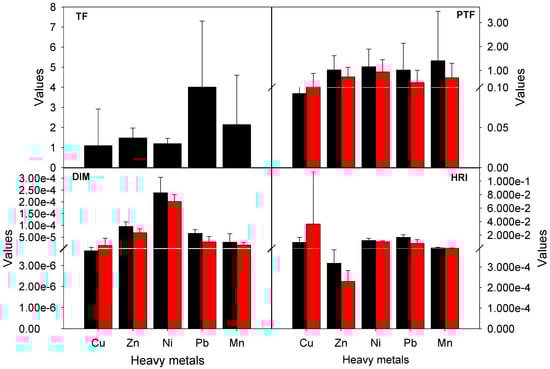
Figure 4.
Mean Translocation factor (TF), plant transfer factor (PTF), daily intake of metals (DIM), and health risk index (HRI) values of M. galilaea.
Among the selected metals, the maximum mean PTF value was recorded for Mn and minimum for Cu in FB, while in H the highest and lowest PTF values were observed for Ni and Cu, respectively. Previously, high PTF values (>1) for Cu and Zn were reported as FB > H. Other studies reported a PTF value of less than one (PTF < 1) for Cu and Zn in different mushroom species [48,49], however, as earlier mentioned this difference may be attributed to the difference in soil properties, climatic conditions, physiology, and mechanism of accumulation in plant species.
3.5. Daily Intake of Metal (DIM)
The results indicated that the DIM values for all the heavy metals through consumption of potentially contaminated M. galilaea were less than 1 for both FB and H (Table 5). The minimum DIM value through consumption of M. galilaea was recorded for Cu, while the maximum value for Ni. Overall DIM of M. galilaea was found as Ni > Zn > Pb > Mn > Cu for both FB and H. The DIM for all the metals were in accordance with [50].
Table 5.
The daily dietary intake of metals (DIM) through consumption of potentially contaminated M. galilaea (FB and H).
Although the DIM values for all the heavy metals was less than one, substantial variation was observed for different metals and the same metal in different plant parts and sample locations. This indicated that great care should be taken, in terms of the daily intake while consuming M. galilaea as generally applies to all edibles. Important to note is that as the morel ingestion rate increases, the heavy metals intake also increases in human and vice versa.
3.6. Health Risk Index (HRI)
Heavy metals may enter the human body through ingestion, dermal contact, and inhalation. Among these, the ingestion of contaminated food is a common means. To determine the human health risk through consumption of potentially contaminated M. galilaea the DIM values were compared with the oral reference dose for Pb (4.0 × 10⁻³ mg/kg-day), Ni (2.0 × 10⁻² mg/kg-day), Mn (1.4 × 10⁻¹ mg/kg-day), Zn (3.0 × 10⁻¹ mg/kg-day), and Cu (4.0 × 10⁻² mg/kg-day) [51]. By convention HRI > 1 indicates a potential health risk to the consuming population [52], in our analysis the HRI values were less than this threshold (HRI < 1) depicting that the consumption of M. galilaea poses no substantial risk to the local population. The mean maximum HRI was recorded for Pb in FB and Cu in H, whereas, the mean minimum HRI was reported for Zn (Table 6 and Figure 4). The HRI was in the order of Pb > Ni > Cu > Mn > Zn for FB and Ni > Pb > Cu > Mn > Zn for H. Our findings agree with [53], reporting that the HRI values were <1 with Pb a potentially toxic metal.
Table 6.
The potential human health risk (HRI) of heavy metals through consumption of M. galilaea (FB and H).
4. Conclusions
Our findings indicated that wild species of M. galilaea randomly selected from the study area depicts tendency of accumulation of heavy metals in FB and H through intake from soil substrate. The results showed higher heavy metals concentration in FB compare to H. Mostly, the studied M. galilaea confined various minerals and metals essential in the human diet, such as Ni, Zn, Cu, Mn, and Pb. This augmented concentration suggested greater influx of nutrient from soil to the FB, which is also shown by the TF values. Some of the heavy metals like Ni and Pb were found above the permissible limits prescribed by WHO and SEPA china. The <1 PTF, DIM and HRI values showed that M. galilaea is safe for edible purpose, however, variation in concentration in different plant parts and sample location revealed that great care should be done while consuming M. galilaea, particularly their FBs. From the findings of this study we concluded that M. galilaea, particularly the FB, is a potential accumulator of heavy metals and continuous consumption without proper investigation may result is potential health risks. It is further suggested that extensive research should be carried out to assess the bioaccumulation and subsequent human health risk of heavy metals and other hazardous compounds, through consumption of different morel species along with their spatial distribution.
Supplementary Materials
The following supporting information can be downloaded at: https://www.mdpi.com/article/10.3390/met13030472/s1, Table S1: Heavy metals concentration (Mg/kg) in selected soil; Table S2: Heavy metals concentration mg/kg in M. galilaea (Min, Max, Mean) collected from Charsadda Kpk Pakistan; Table S3: C. One-way ANOVA results showed the concentration of heavy metals from soil to hymenophore and fruiting body (mg/kg) in M. galileae.
Author Contributions
H.B. and A.S.M. designed the study. H.B. and A.S.M. conducted the experiment, collected data and did a formal analysis of the data. H.B. and A.K. (Anwarzeb Khan) drafted the initial manuscript. S.M.K. (review) A.K. (Asif Kamal) (software analysis) and M.K. help in methodology. Furthermore, M.A.A. and M.S.A., provide funding and support for the project. S.U.N. identified the species. All authors have read and agreed to the published version of the manuscript.
Funding
(RSP-2023R306), King Saud University, Riyadh, Saudi Arabia.
Data Availability Statement
Not applicable.
Acknowledgments
The authors extend their appreciation to the Researchers Supporting Project number (RSP-2023R306), King Saud University, Riyadh, Saudi Arabia.
Conflicts of Interest
The authors have no conflict of interest.
References
- Kula, İ.; Solak, M.H.; Uğurlu, M.; Işıloğlu, M.; Arslan, Y. Determination of mercury, cadmium, lead, zinc, selenium and iron by ICP-OES in mushroom samples from around thermal power plant in Muğla, Turkey. Bull. Environ. Contam. Toxicol. 2011, 87, 276–281. [Google Scholar]
- Badshah, H. Myco-chemical, Nutraceutical and Molecular Studies of Selected Wild Edible Morchella Species of Pakistan. Ph.D. Thesis, Quaid-i-Azam University, Islamabad, Pakistan, 2019. [Google Scholar]
- Kalač, P. Chemical composition and nutritional value of European species of wild growing mushrooms: A review. Food Chem. 2009, 113, 9–16. [Google Scholar] [CrossRef]
- Svoboda, L.; Zimmermannova, K.; Kalač, P. Concentrations of mercury, cadmium, lead and copper in fruiting bodies of edible mushrooms in an emission area of a copper smelter and a mercury smelter. Sci. Total Environ. 2000, 246, 61–67. [Google Scholar] [CrossRef]
- Kalač, P. A review of edible mushroom radioactivity. Food Chem. 2001, 75, 29–35. [Google Scholar] [CrossRef]
- Falandysz, J.; Kawano, M.; Świeczkowski, A.; Brzostowski, A.; Dadej, M. Total mercury in wild-grown higher mushrooms and underlying soil from Wdzydze Landscape Park, Northern Poland. Food Chem. 2003, 81, 21–26. [Google Scholar]
- Vetter, J. Arsenic content of some edible mushroom species. Eur. Food Res. Technol. 2004, 219, 71–74. [Google Scholar] [CrossRef]
- Mleczek, M.; Magdziak, Z.; Goliński, P.; Siwulski, M.; Stuper-Szablewska, K. Concentrations of minerals in selected edible mushroom species growing in Poland and their effect on human health. Acta Sci. Pol. Technol. Aliment. 2013, 12, 203–214. [Google Scholar]
- Isildak, O.; Turkekul, I.; Elmastas, M.; Aboul-Enein, H.Y. Bioaccumulation of Heavy Metals in Some Wild-Grown Edible Mushrooms. Anal. Lett. 2007, 40, 1099–1116. [Google Scholar] [CrossRef]
- Krupa, P.; Kozdrój, J. Accumulation of heavy metals by ectomycorrhizal fungi colonizing birch trees growing in an industrial desert soil. World J. Microbiol. Biotechnol. 2004, 20, 427–430. [Google Scholar] [CrossRef]
- Aloupi, M.; Koutrotsios, G.; Koulousaris, M.; Kalogeropoulos, N. Trace metal contents in wild edible mushrooms growing on serpentine and volcanic soils on the island of Lesvos, Greece. Ecotoxicol. Environ. Saf. 2012, 78, 184–194. [Google Scholar]
- Árvay, J.; Demková, L.; Hauptvogl, M.; Michalko, M.; Bajčan, D.; Stanovič, R.; Trebichalský, P. Assessment of environmental and health risks in former polymetallic ore mining and smelting area, Slovakia: Spatial distribution and accumulation of mercury in four different ecosystems. Ecotoxicol. Environ. Saf. 2017, 144, 236–244. [Google Scholar] [CrossRef]
- Borovička, J.; Braeuer, S.; Sácký, J.; Kameník, J.; Goessler, W.; Trubač, J.; Kotrba, P. Speciation analysis of elements accumulated in Cystoderma carcharias from clean and smelter-polluted sites. Sci. Total Environ. 2019, 648, 1570–1581. [Google Scholar] [CrossRef]
- Kalac, P. Edible Mushrooms: Chemical Composition and Nutritional Value; Academic Press: Cambridge, MA, USA, 2016; Chapter 2. [Google Scholar]
- Pourrut, B.; Shahid, M.; Dumat, C.; Winterton, P.; Pinelli, E. Lead uptake, toxicity, and detoxification in plants. Rev. Environ. Contam. Toxicol. Vol. 2011, 213, 113–136. [Google Scholar]
- Shah, M.T.; Ara, J.; Muhammad, S.; Khan, S.; Tariq, S. Health risk assessment via surface water and sub-surface water consumption in the mafic and ultramafic terrain, Mohmand agency, northern Pakistan. J. Geochem. Explor. 2012, 118, 60–67. [Google Scholar] [CrossRef]
- Newbound, M.; Mccarthy, M.A.; Lebel, T. Fungi and the urban environment: A review. Landsc. Urban Plan. 2010, 96, 138–145. [Google Scholar] [CrossRef]
- Petkovšek, S.A.S.; Pokorny, B. Lead and cadmium in mushrooms from the vicinity of two large emission sources in Slovenia. Sci. Total. Environ. 2013, 443, 944–954. [Google Scholar] [CrossRef]
- Amin, N.U.; Hussain, A.; Alamzeb, S.; Begum, S. Accumulation of heavy metals inedible parts of vegetables irrigated with wastewater and their daily intake to adults and children, District Mardan, Pakistan. Food Chem. 2013, 136, 1515–1523. [Google Scholar] [CrossRef] [PubMed]
- Rahman, M.A.; Rahman, M.M.; Reichman, S.M.; Lim, R.P.; Naidu, R. Heavy metals in Australian grown and imported rice and vegetables on sale in Australia: Health hazard. Ecotoxicol. Environ. Saf. 2014, 100, 53–60. [Google Scholar] [CrossRef]
- Badshah, H.; Khan, M.U.; Mumtaz, A.S. Elucidating Heavy Metals Concentration and Distribution in Wild Edible Morels and the Associated Soil at Different Altitudinal Zones of Pakistan: A Health Risk Implications Study. Biol. Trace Elem. Res. 2022, 1–14. [Google Scholar] [CrossRef]
- Jarup, L. Hazards of heavy metal contamination. Brit. Med. Bull. 2003, 68, 167–182. [Google Scholar] [CrossRef]
- Oskarsson, A.; Widell, A.; Olsson, M.; Grawé, K. Cadmium in food chain and health effects in sensitive population groups. Biometals 2004, 17, 531–534. [Google Scholar] [CrossRef] [PubMed]
- WHO. Cadmium, Environmental Health Criteria; WHO: Geneva, Switzerland, 1992; Volume 134.
- Badshah, H.; Qureshi, R.A.; Khan, J.; Ullah, F.; Fahad, S.; Ullah, F.; Khan, N. Pharmacological screening of Morchella esculenta (L.) Pers., Calvatia gigantea (Batsch ex Pers.) Lloyd and Astraeus hygrometricus Pers., mushroom collected from South Waziristan (FATA.). J. Med. Plants Res. 2012, 6, 1853–1859. [Google Scholar]
- Badshah, H.; Ullah, F.; Khan, M.U.; Mumtaz, A.S.; Malik, R.N. Pharmacological activities of selected wild mushrooms in South Waziristan (FATA), Pakistan. S. Afr. J. Bot. 2015, 97, 107–110. [Google Scholar] [CrossRef]
- Hamayun, M.; Khan, S.A.; Ahmad, H.; Shin, D.H.; Lee, I.J. Morel collection and marketing: A case study from the Hindu-Kush mountain region of Swat, Pakistan. Lyonia 2006, 11, 7–13. [Google Scholar]
- Alam, I.; Alam, M.; Khan, A.; Haq, S.; Ayaz, A.; Jalal, A.; Bhat, J.A. Biochar supplementation regulates growth and heavy metal accumulation in tomato grown in contaminated soils. Physiol. Plant. 2021, 173, 340–351. [Google Scholar] [CrossRef] [PubMed]
- Allen, S.E.; Grimshaw, H.M.; Rowland, A.P. Chemical Analysis. Methods in Plant Ecology; Moore, P.D., Chapman, S.B., Eds.; Blackwell Scientific Publications: Boston, MA, USA, 1986; pp. 285–344. [Google Scholar]
- Li, N.Y.; Fu, Q.L.; Zhuang, P.; Guo, B.; Zou, B.; Li, Z.A. Effect of fertilizers on Cd uptake of Amaranth hypochondriacus, a high biomass, fast growing and easily cultivated Cd hyperaccumulator. Int. J. Phytoremediation 2012, 14, 162. [Google Scholar] [CrossRef] [PubMed]
- Hernandez, L.; Probst, A.; Probst, J.L.; Ulrich, E. Heavy metal distribution in some French forest soil: Evidence for atmospheric contamination. Sci. Total Environ. 2003, 312, 195–219. [Google Scholar] [CrossRef] [PubMed]
- Elekes, C.C.; Busuioc, G. Influence of chemical composition of soil on metal accumulation in edible mushroom species of russula genus. Rev. Roum. Chim. 2013, 58, 629–637. [Google Scholar]
- Jan, F.A.; Ishaq, M.; Khan, S.; Ihsanullah, I.; Ahmad, I.; Shakirullah, M. A comparative study of human health risks via consumption of food crops grown on wastewater irrigated soil (Peshawar) and relatively clean water irrigated soil (Lower Dir). J. Hazard. Mat. 2010, 179, 612–621. [Google Scholar] [CrossRef]
- Muhammad, S.; Shah, M.T.; Khan, S. Health risk assessment of heavy metals and their source apportionment in drinking water of Kohistan region, northern Pakistan. Micro J. 2011, 98, 334–343. [Google Scholar] [CrossRef]
- Soffianian, A.; Madani, E.S.; Arabi, M. Risk assessment of heavy metal soil pollution through principal components analysis and false color composition in Hamadan Province, Iran. Environ. Syst. Res. 2014, 3, 1–14. [Google Scholar] [CrossRef]
- Richardson, J.B.; Donaldson, E.C.; Kaste, J.M.; Friedland, A.J. Forest floor lead, copper and zinc concentrations across the northeastern United States: Synthesizing spatial and temporal responses. Sci. Total. Environ. 2015, 505, 851–859. [Google Scholar] [CrossRef]
- Frankowska, A.; Ziółkowska, J.; Bielawski, L.; Falandysz, J. Profile and bioconcentration of minerals by King Bolete (Boletus edulis) from the Płocka Dale in Poland. Food Addit. Contam. Part B 2010, 3, 1–6. [Google Scholar] [CrossRef]
- Falandysz, J.; Frankowska, A.; Mazur, A. Mercury and its bioconcentration factors in King Bolete (Boletus edulis) Bull. Fr. J Environ. Sci. Health A 2007, 42, 2089–2095. [Google Scholar] [CrossRef] [PubMed]
- Falandysz, J.; Borovička, J. Macro and trace mineral constituents and radionuclides in mushrooms: Health benefits and risks. Appl. Microbiol. Biotechnol. 2012, 97, 477–501. [Google Scholar] [CrossRef] [PubMed]
- Fu, S.C.; Zhang, M.Y.; Shang, X.D.; Chen, M.J.; Tan, Q. An axenic culture system for fruiting body formation by an edible bolete phylogenetically related to culinary-medicinal penny bun mushroom, Boletus edulis Bull.:Fr. strains from China. Int. J. Med. Mushrooms 2011, 13, 387–395. [Google Scholar] [CrossRef]
- Bahemuka, T.E.; Mubofu, E.B. Heavy metals in edible green vegetables grown along the sites of the Sinza and Msimbazi rivers in Dar es Salaam, Tanzania. Food Chem. 1999, 66, 63–66. [Google Scholar] [CrossRef]
- WHO. Toxicological Evaluation of Certain Food Additives; WHO Food Additive Series No. 683; World Health Organization: Geneva, Switzerland, 1982.
- Haider, S.; Naithani, V.; Barthwal, J.; Kakkar, P. Heavy metal content in some therapeutically important medicinal plants. Bull. Environ. Contam. Toxicol. 2004, 72, 119–127. [Google Scholar] [CrossRef]
- Khan, A.; Khan, S.; Khan, M.A.; Qamar, Z.; Waqas, M. The uptake and bioaccumulation of heavy metals by food plants, their effects on plants nutrients, and associated health risk: A review. Environ. Sci. Pollut. Res. 2015, 22, 13772–13799. [Google Scholar] [CrossRef]
- Verma, S.; Dubey, R. Lead toxicity induces lipid peroxidation and alters the activities of antioxidant enzymes in growing rice plants. Plant Sci. 2003, 164, 645–655. [Google Scholar] [CrossRef]
- Wang, X.M.; Zhang, J.; Li, T.; Li, J.Q.; Wang, Y.Z.; Liu, H.G. Variations in Element Levels Accumulated in Different Parts of Boletus edulis Collected from Central Yunnan Province, China. J. Chem. 2015, 2015, 372152. [Google Scholar] [CrossRef]
- Sharma, S.; Nagpal, A.K.; Kaur, I. Heavy metal contamination in soil, food crops and associated health risks for residents of Ropar wetland, Punjab, India and its environs. Food Chem. 2018, 255, 15–22. [Google Scholar] [CrossRef] [PubMed]
- Chudzyński, K.; Falandysz, J. Multivariate analysis of elements content of Larch Bolete (Suillus grevillei) mushroom. Chemosphere 2008, 73, 1230–1239. [Google Scholar] [CrossRef]
- Kułdo, E.; Jarzyńska, G.; Gucia, M.; Falandysz, J. Mineral constituents of edible parasol mushroom Macrolepiota procera (Scop. ex Fr.) Sing and soils beneath its fruiting bodies collected from a rural forest area. Chem. Pap. 2014, 68, 484–492. [Google Scholar] [CrossRef]
- FAO; World Health Organization (WHO). Joint FAO/NACA/WHO Study Group on Food Safety Issues Associated with Products from Aquaculture. In Food Safety Issues Associated with Products from Aquaculture: Report of a Joint FAO/NACA/WHO Study Group; World Health Organization: Geneva, Switzerland, 1999; Volume 883. [Google Scholar]
- USEPA/IRIS, United States, Environmental Protection Agency, Integrated Risk Information System. 2006. Available online: http://www.epa.gov/iris/substS (accessed on 1 January 2023).
- United States Environmental Protection Agency (USEPA). Methods for Evaluating Wetland Condition: Introduction to Biological Assessment; Office of Water: Washington, DC, USA, 2002; EPA-822-R-02-014.
- Fang, Y.; Sun, X.; Yang, W.; Ma, N.; Xin, Z.; Fu, J.; Hu, Q. Concentrations and health risks of lead, cadmium, arsenic, and mercury in rice and edible mushrooms in China. Food Chem. 2014, 151, 379. [Google Scholar] [CrossRef]
Disclaimer/Publisher’s Note: The statements, opinions and data contained in all publications are solely those of the individual author(s) and contributor(s) and not of MDPI and/or the editor(s). MDPI and/or the editor(s) disclaim responsibility for any injury to people or property resulting from any ideas, methods, instructions or products referred to in the content. |
© 2023 by the authors. Licensee MDPI, Basel, Switzerland. This article is an open access article distributed under the terms and conditions of the Creative Commons Attribution (CC BY) license (https://creativecommons.org/licenses/by/4.0/).