Abstract
Six groups of austenitic 022Cr19Ni10 stainless steel bending specimens with three types of cross-sectional forms were used to study the impact of V-stiffeners on the failure mode and flexural behavior of stainless steel lipped channel beams. These cross-sectional forms included V-stiffeners in the web compression zone at 1/3 height near the compressed flange and no V-stiffeners on the flange, V-stiffeners in the web compression zone at 1/3 height near the compressed flange and V-stiffeners in the middle of the compressed flange, and V-stiffeners on the web at 1/2 height and V-stiffeners in the middle of the compressed and tensioned flange. The findings show that the specimens without a V-stiffener on the flange and with a V-stiffener in the web compression zone at 1/3 height near the compressed flange have a lower ultimate bearing capacity as a result of local–distortional interaction buckling. The test specimen’s flexural bearing capacity will rise with an increase in web height under the same stiffening form and other fixed cross-sectional parameters. Furthermore, the additional V-stiffeners in the middle of the flange effectively lower the width-to-thickness ratio of the stainless steel specimen with a flange that has been V-stiffened, thus increasing the specimen’s bending bearing capacity by 13% and emphasizing the distortional buckling issue. Buckling first manifests in the compression flange and is caused by the stress evolution on the web of the bending specimen, which is constrained by the V-stiffeners. The specimen’s capacity to withstand bending loads can be improved more successfully through the use of V-stiffeners in the web compression zone at 1/3 height close to the compressed flange and V-stiffeners in the middle of the compressed flange. For the test data, a finite element simulation was established, and the results are generally consistent with the test results.
1. Introduction
Compared to regular carbon steel, stainless steel is lighter, more resistant to corrosion, and has a more attractive and generous appearance. Many engineers favor stainless steel components due to this characteristic for different building types in today’s advancing urbanization [1].
The preferred material today for cold-formed thin-walled members is stainless steel. Despite having a high strength-to-weight ratio, cold-formed, thin-walled steel structures are vulnerable to local or distortional buckling under light loads. The approach that is applied most frequently is the addition of extra bends, such as intermediate stiffeners, to the cross-section [2,3,4,5,6,7]. In an experimental study by Kwon et al. [8], it was discovered that the middle V-stiffeners of the plate can significantly increase the load capacity of the member. The study involved high-strength, cold-formed, thin-walled, C-shaped axial compression members without stiffening and V-stiffeners in the middle of the plate. The V-stiffeners were installed by Yang and Hancock [9] in the center of the flange and on a web of high-strength, ultra-thin steel members. It was found that local and distortional buckling, which lower the stability and ultimate bearing capacity of the members, are correlated. Research studies to date have paid little attention to stainless steel members with V-capacity stiffeners to support flexural loads.
When the previous research on stiffened section members was summarized, it was discovered that the majority of the studies concentrated on carbon steel and high-strength steel, with little information on stainless steel lipped channel sections with web stiffeners under bending stress. When it comes to stiffening, the majority of web stiffeners are set at 1/2 of the web height. This paper creatively proposes the V-shaped stiffened lipped channel steel members in the compression area of the web and the middle of the flange in order to increase the strength of the section by using stiffeners on the web and flange of the section, improve the ratio of strength to weight, and broaden the application range of stainless steel flexural members.
Therefore, the goal of this study is to investigate how the placement of stiffeners affects how well V-shaped stiffened lipped channel beams bend. The stainless steel bending member was the first to be put to the test using the reference [10] method. Next, a finite element model was created to simulate the four-point bending test of the V-shaped stiffened lipped channel steel beam, and the results were used to validate a finite element model. The test results were compared to those obtained using the direct strength method, which can be used in this study to confirm the specimen’s capacity to withstand flexural loads.
2. Establishment of the Experimental Study
2.1. Design of the Specimens
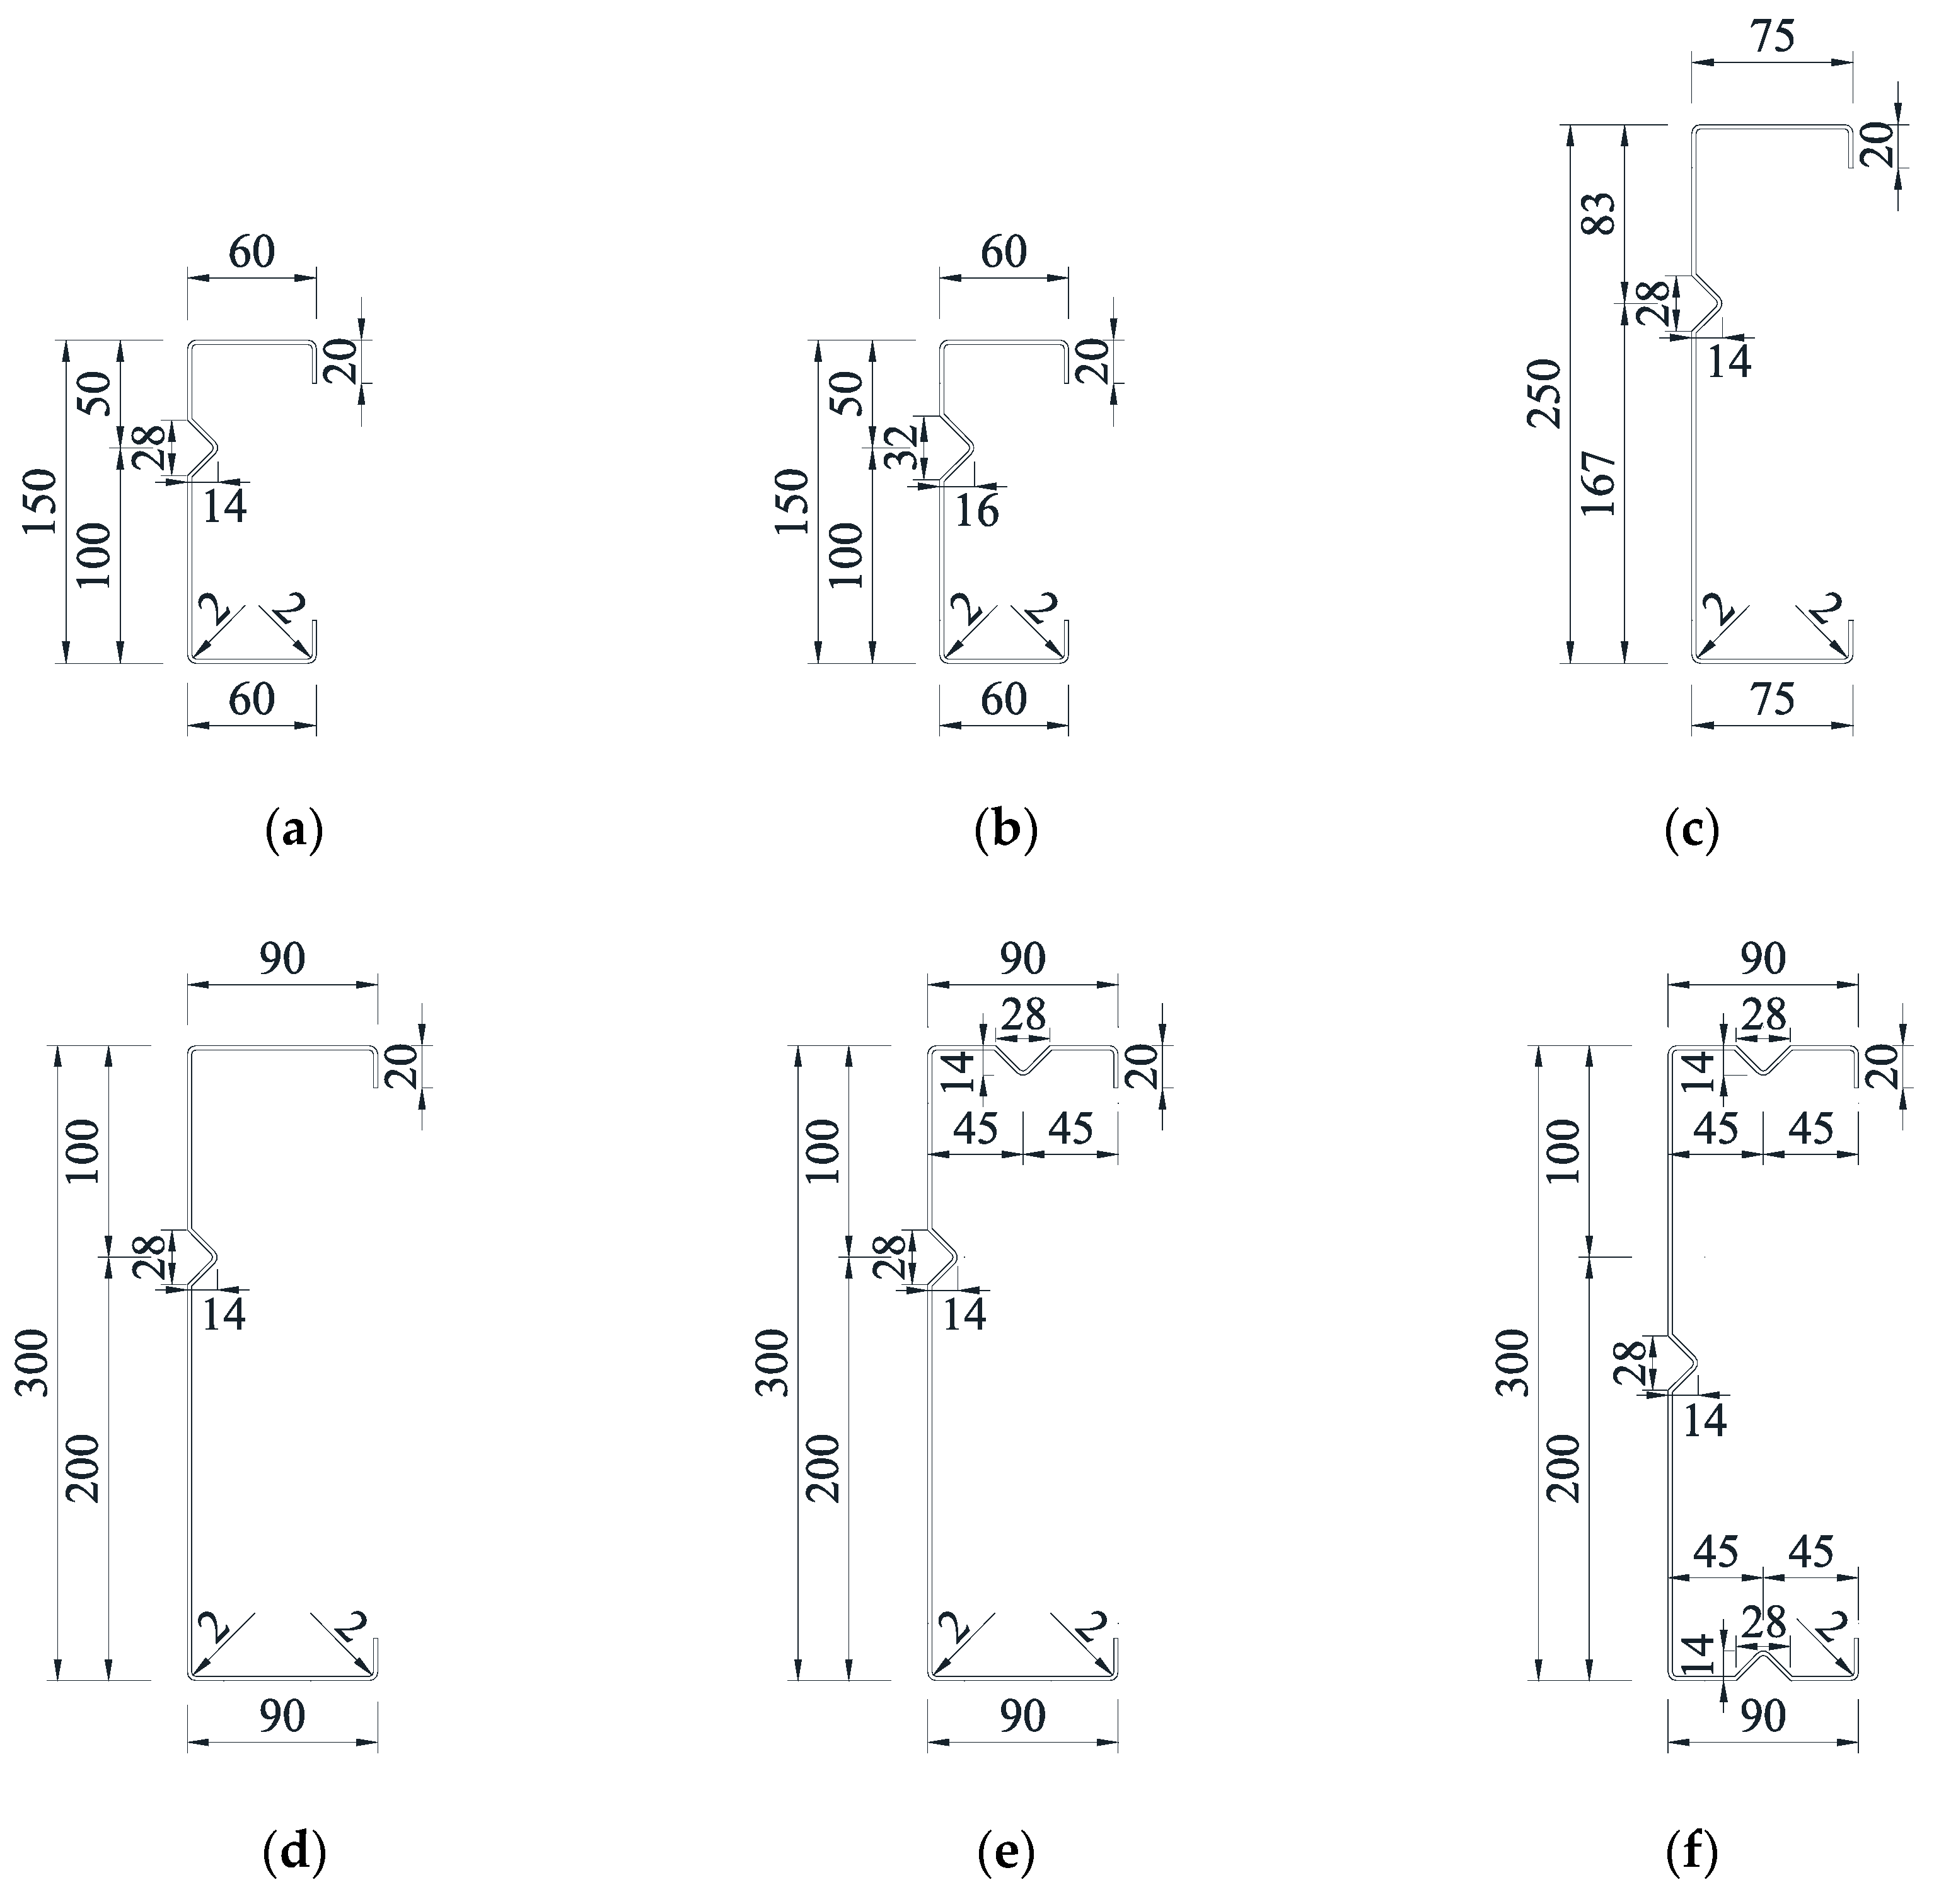
Six groups of sections are chosen with web heights of 150 mm, 250 mm, and 300 mm and flange widths of 60 mm, 75 mm, and 90 mm, respectively, in order to study the impact of the V-stiffeners’ size, section height-to-width ratio, and position of the web and flange on the bending load capacity and buckling mode of the lipped channel stainless steel members. Specimens SP-1 and SP-2 are used to compare the impact of the V-stiffeners on buckling performance, and specimens SP-3 and SP-4 are used to study the effect of the section height-to-width ratio on the buckling characteristics. Specimens SP-4, SP-5, and SP-6 are compared to study the effect of the V-stiffeners’ positions on the web and flange. Specimen SP-4’s web compression zone is V-stiffened at 1/3 height near the compressed flange, and no V-stiffeners are set up on the flange; specimen SP-5’s web compression zone is V-stiffened at 1/3 height near the compressed flange and in the middle of the compressed flange, and specimen SP-6 is V-stiffened at 1/2 web height and in the middle of the compressed and tensioned flange. Each test group comprises two C-shaped specimens with identical cross-sections, for a total of 12 specimens. Figure 1 depicts the specimen’s cross-sectional shape and all dimensions in mm.
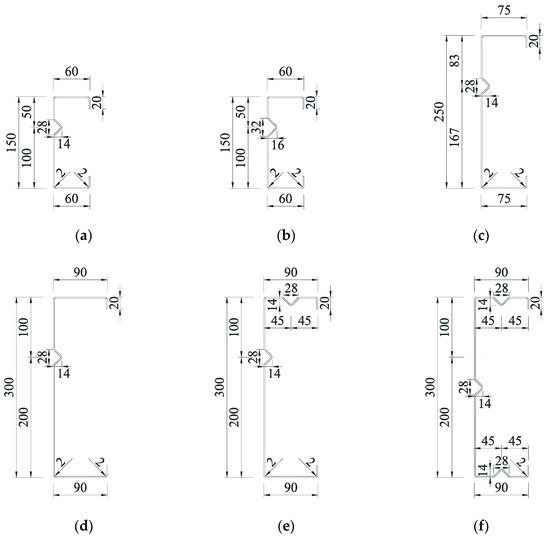
Figure 1.
(a) SP-1, (b) SP-2, (c) SP-3, (d) SP-4, (e) SP-5, (f) SP-6. Cross-section of specimens for (a) SP-1 to (d) SP-4 of V-stiffeners in the web compression zone at 1/3 height near the compressed flange and no V-stiffeners on the flange. (e) SP-5 of V-stiffeners in the web compression zone at 1/3 height near the compressed flange and V-stiffeners in the middle of the compressed flange. (f) SP-6 of V-stiffeners on the web at 1/2 height and V-stiffeners in the middle of the compressed and tensioned flange.
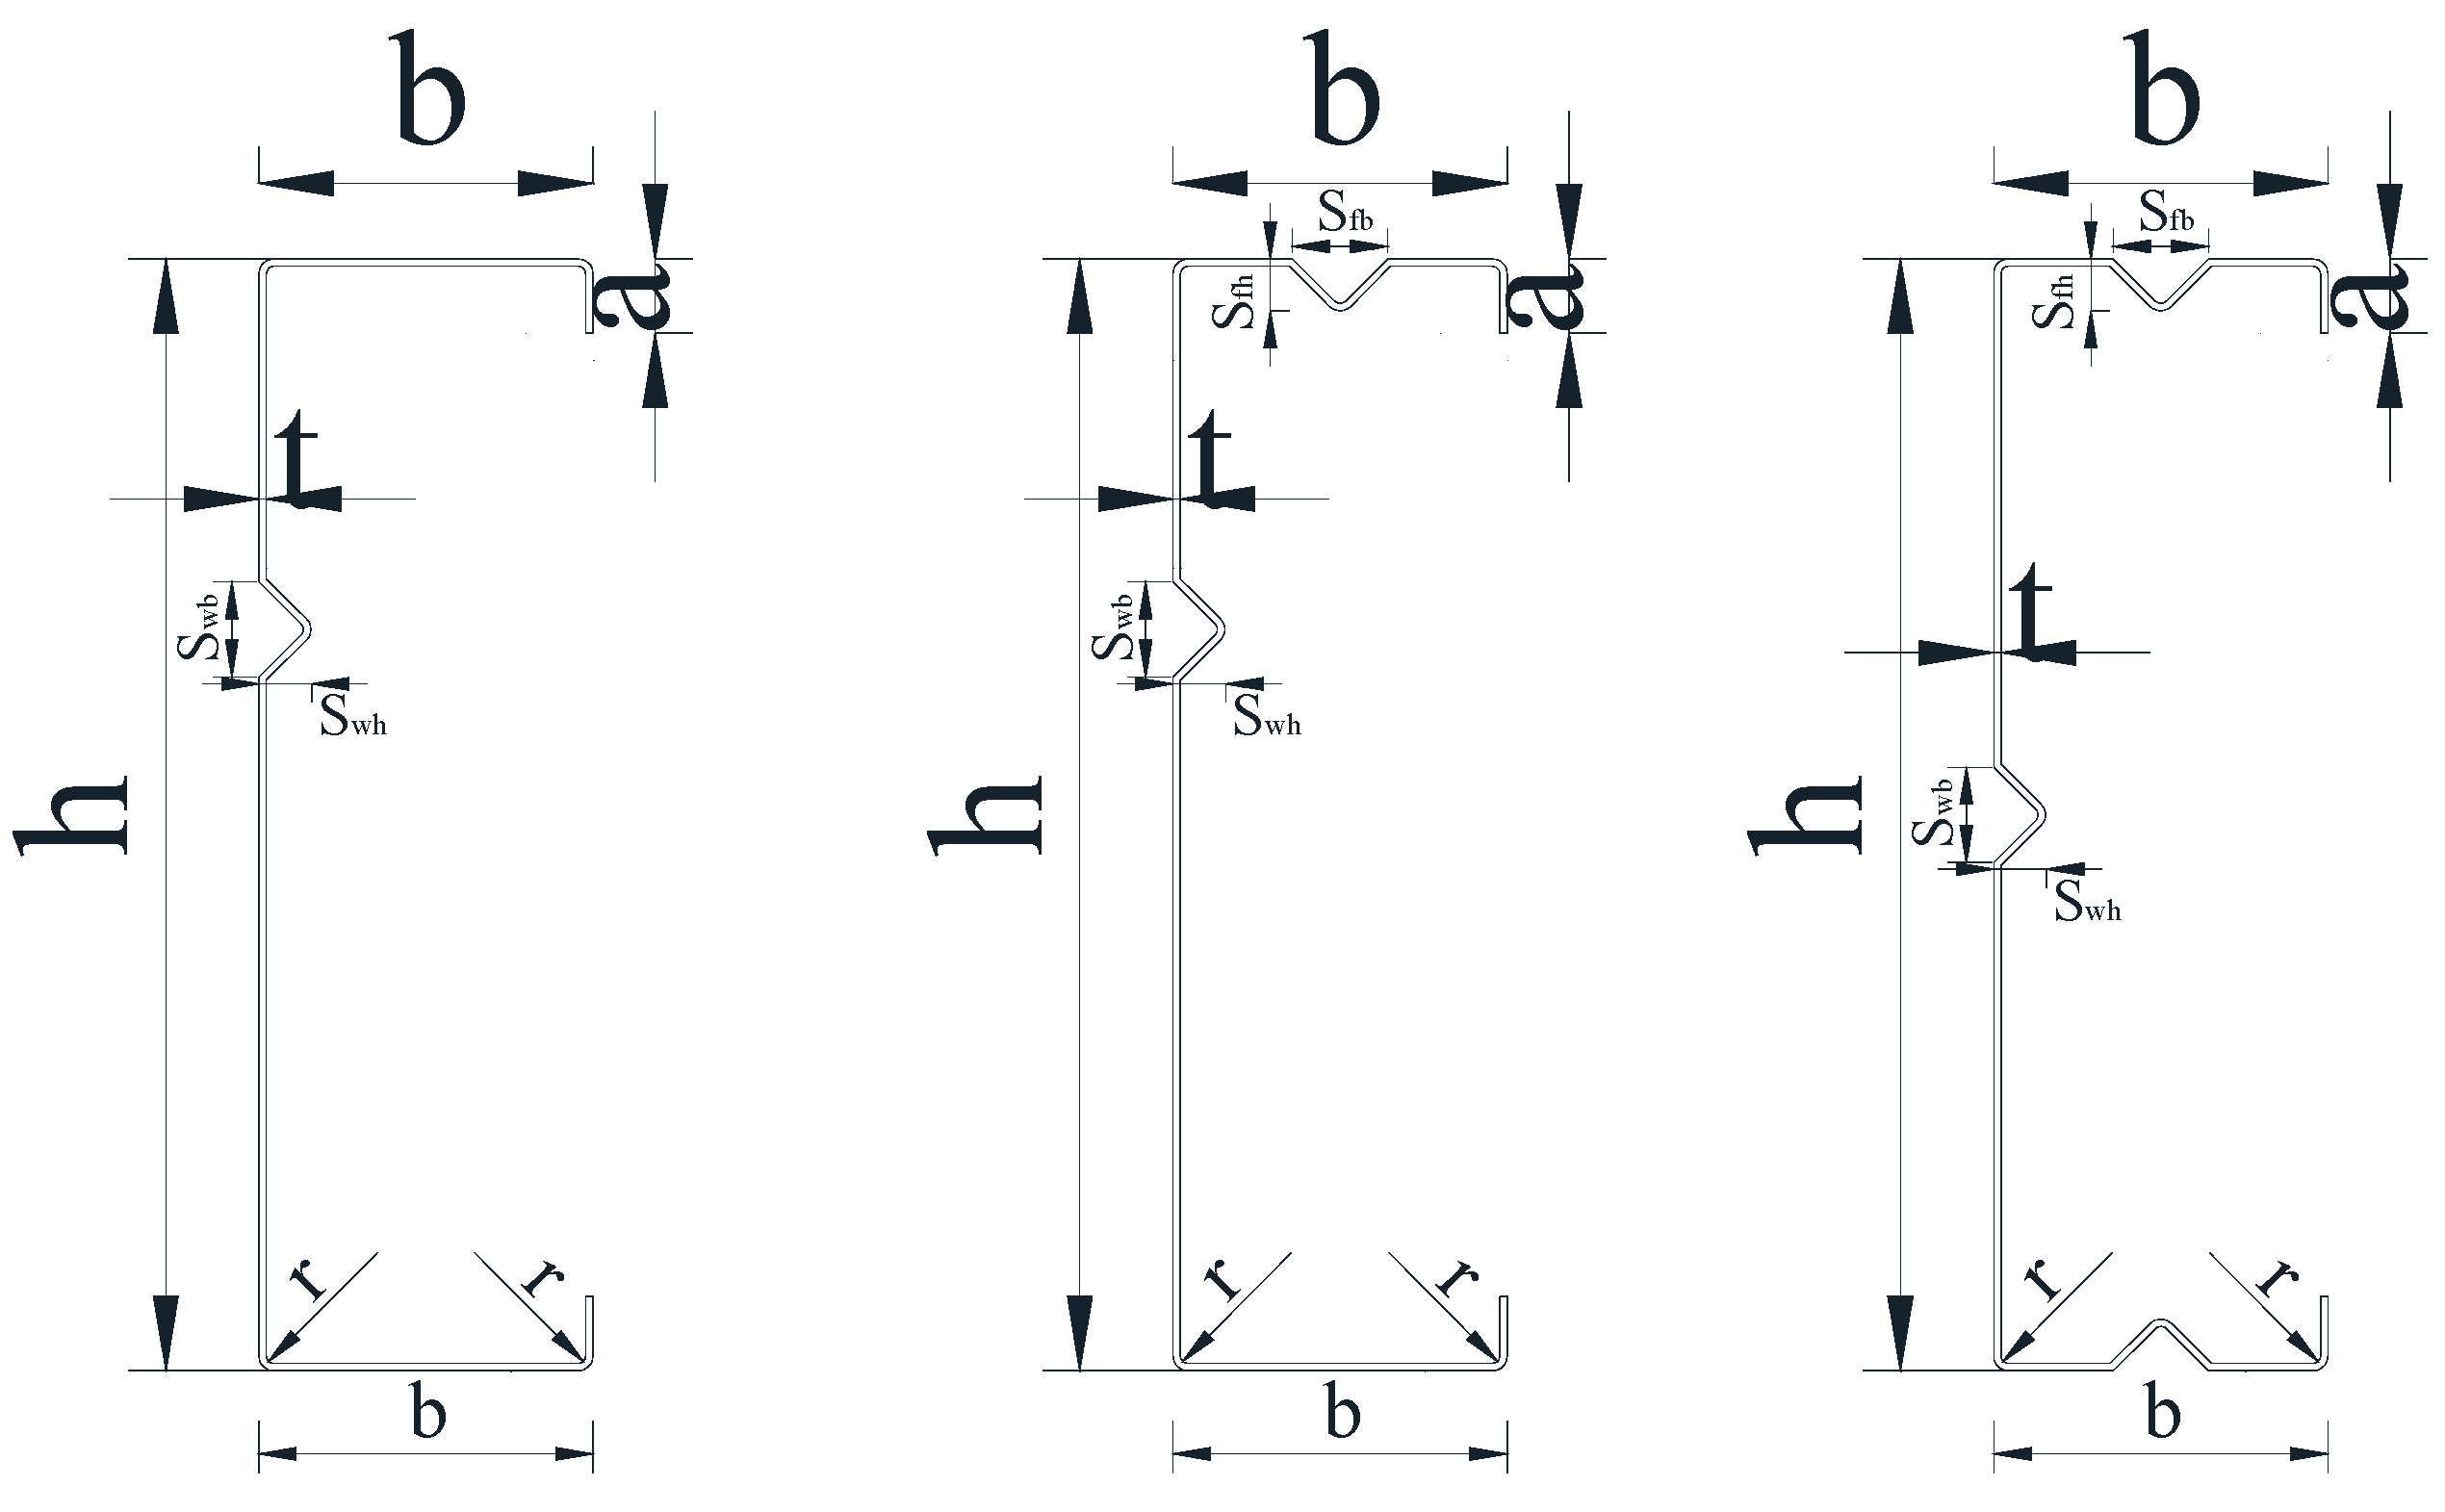
The specimens are cold-formed, utilizing stainless steel plates with a nominal thickness t of 2 mm. Figure 2 outlines the geometric parameters of the three different cross-sectional forms. Where, h is the height of the section web and b is the width of the section flange. All of the specimens have rolled edges with a wide c of 20 mm, the angles between the V-shaped stiffened ribs and the two plates are 90°, and the length of the specimen is 3400 mm. The bending inner diameter of the plate cross line is r = 2 mm, and the width Swb (Sfb) and height Sw (Sfh) of the web and flange V-stiffened ribs are 28 (32) mm and 14 (16) mm, respectively.
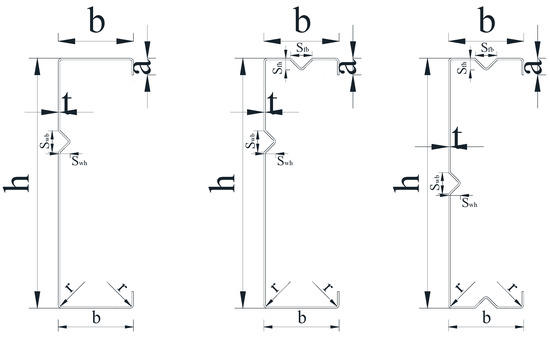
Figure 2.
Definitions of the sectional symbols.
Before the test, vernier calipers are used to measure the cross-sectional geometry of each specimen at its two ends and in the center. Finally, the average of the three measurements is used to determine the specimens’ actual cross-sectional sizes. The measurement results for each specimen’s actual cross-sectional geometry are listed in Table 1.

Table 1.
Actual dimensions of the specimens.
2.2. Material Properties
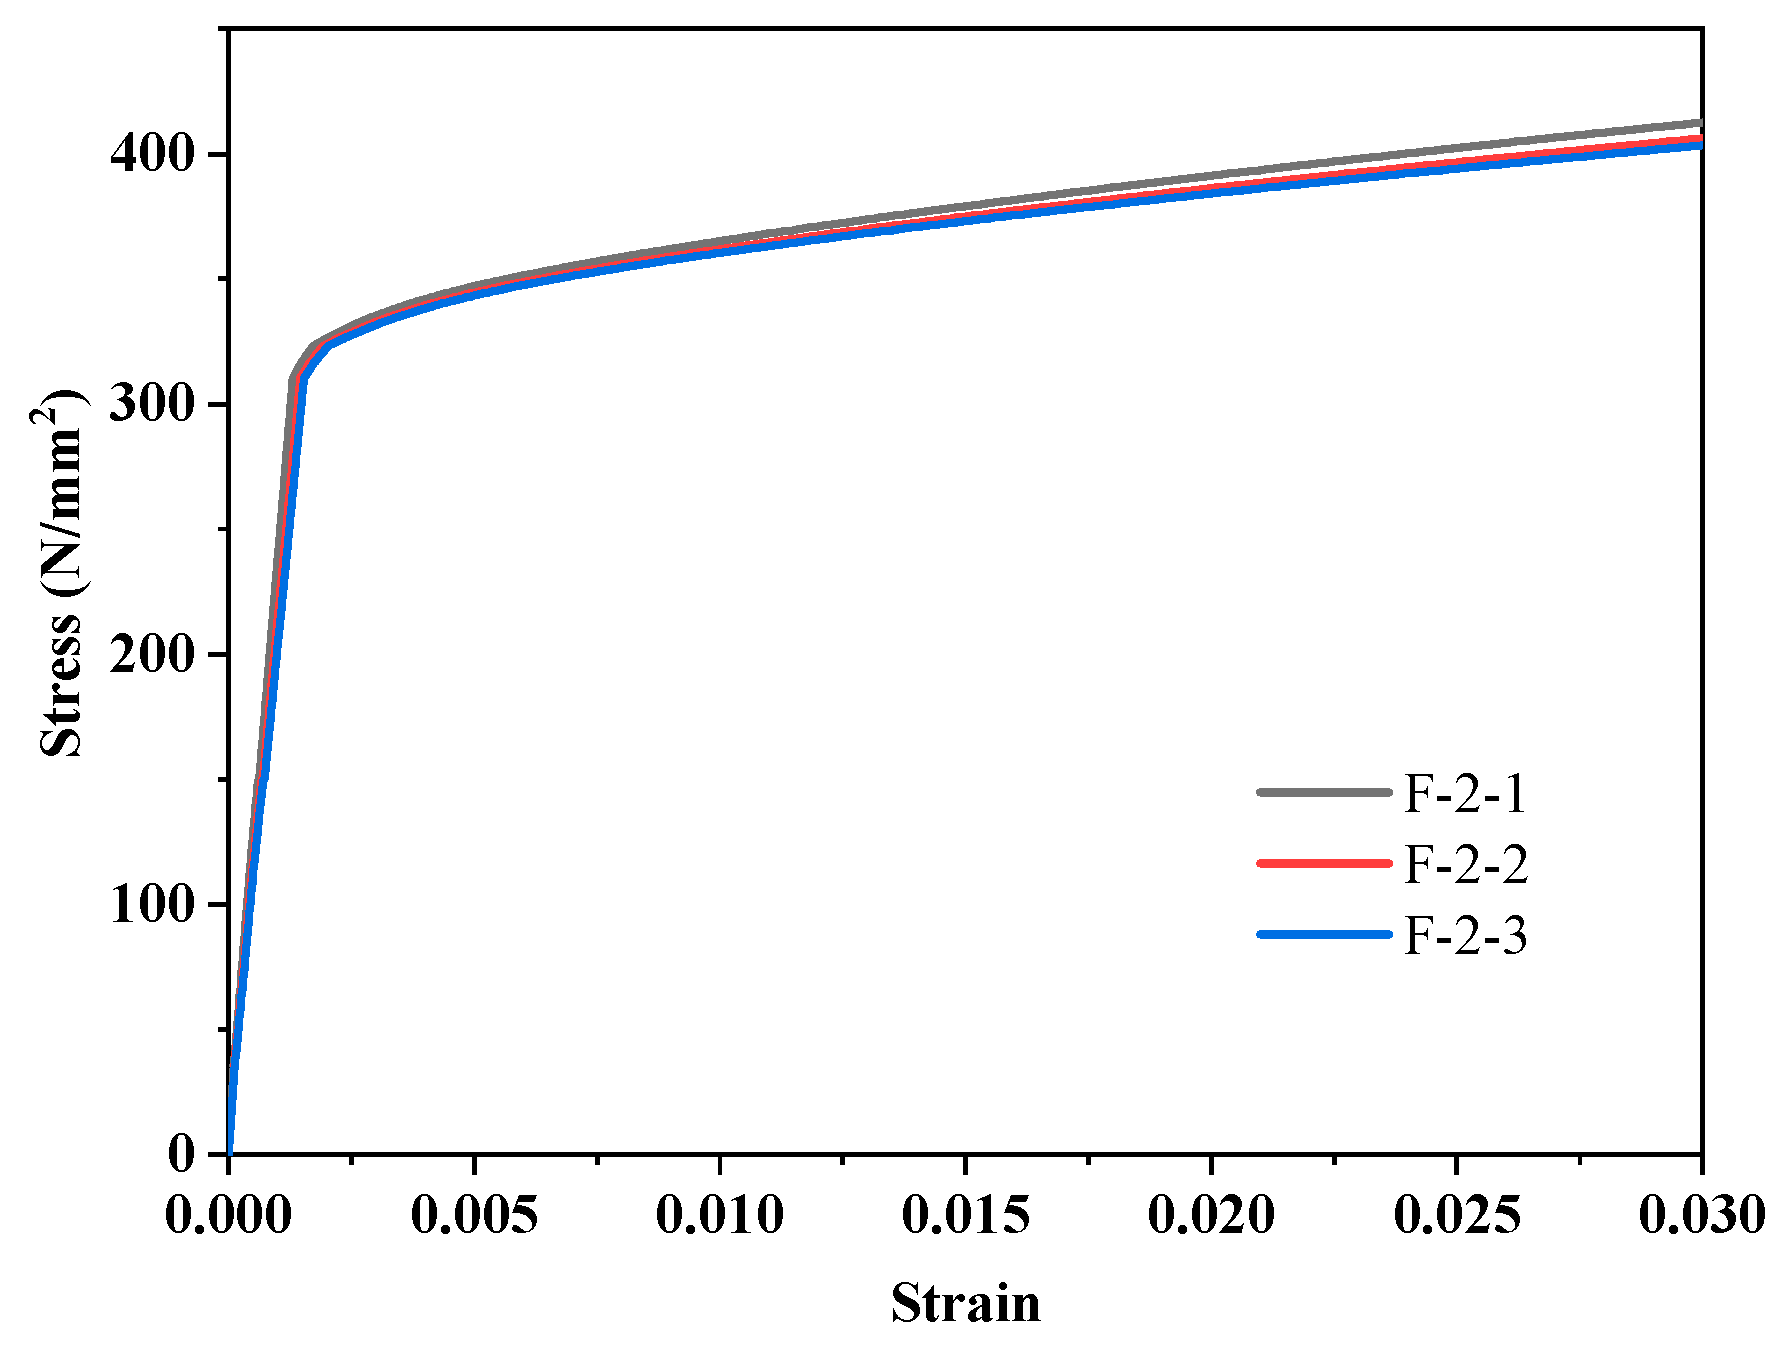
Three standard tensile specimens are taken from the same batch of steel plates made of austenitic 022Cr19Ni10 stainless steel. The relevant provisions in [11,12], respectively, guide the preparation of the flange and web of the standard specimens for the material test. Table 2 provides a list of the average values of the test results, and the stress–strain curves of the stainless steel are shown in Figure 3. Where, σ0.2 is the nominal yield stress; σu is the ultimate stress value of the material; E is the initial elastic modulus of the material; δ is the elongation of the material.

Table 2.
Test results of mechanical property.
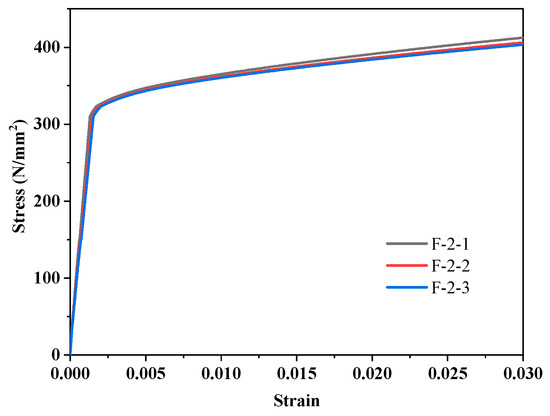
Figure 3.
Stress–strain curves of three groups of specimens.
2.3. Initial Imperfections
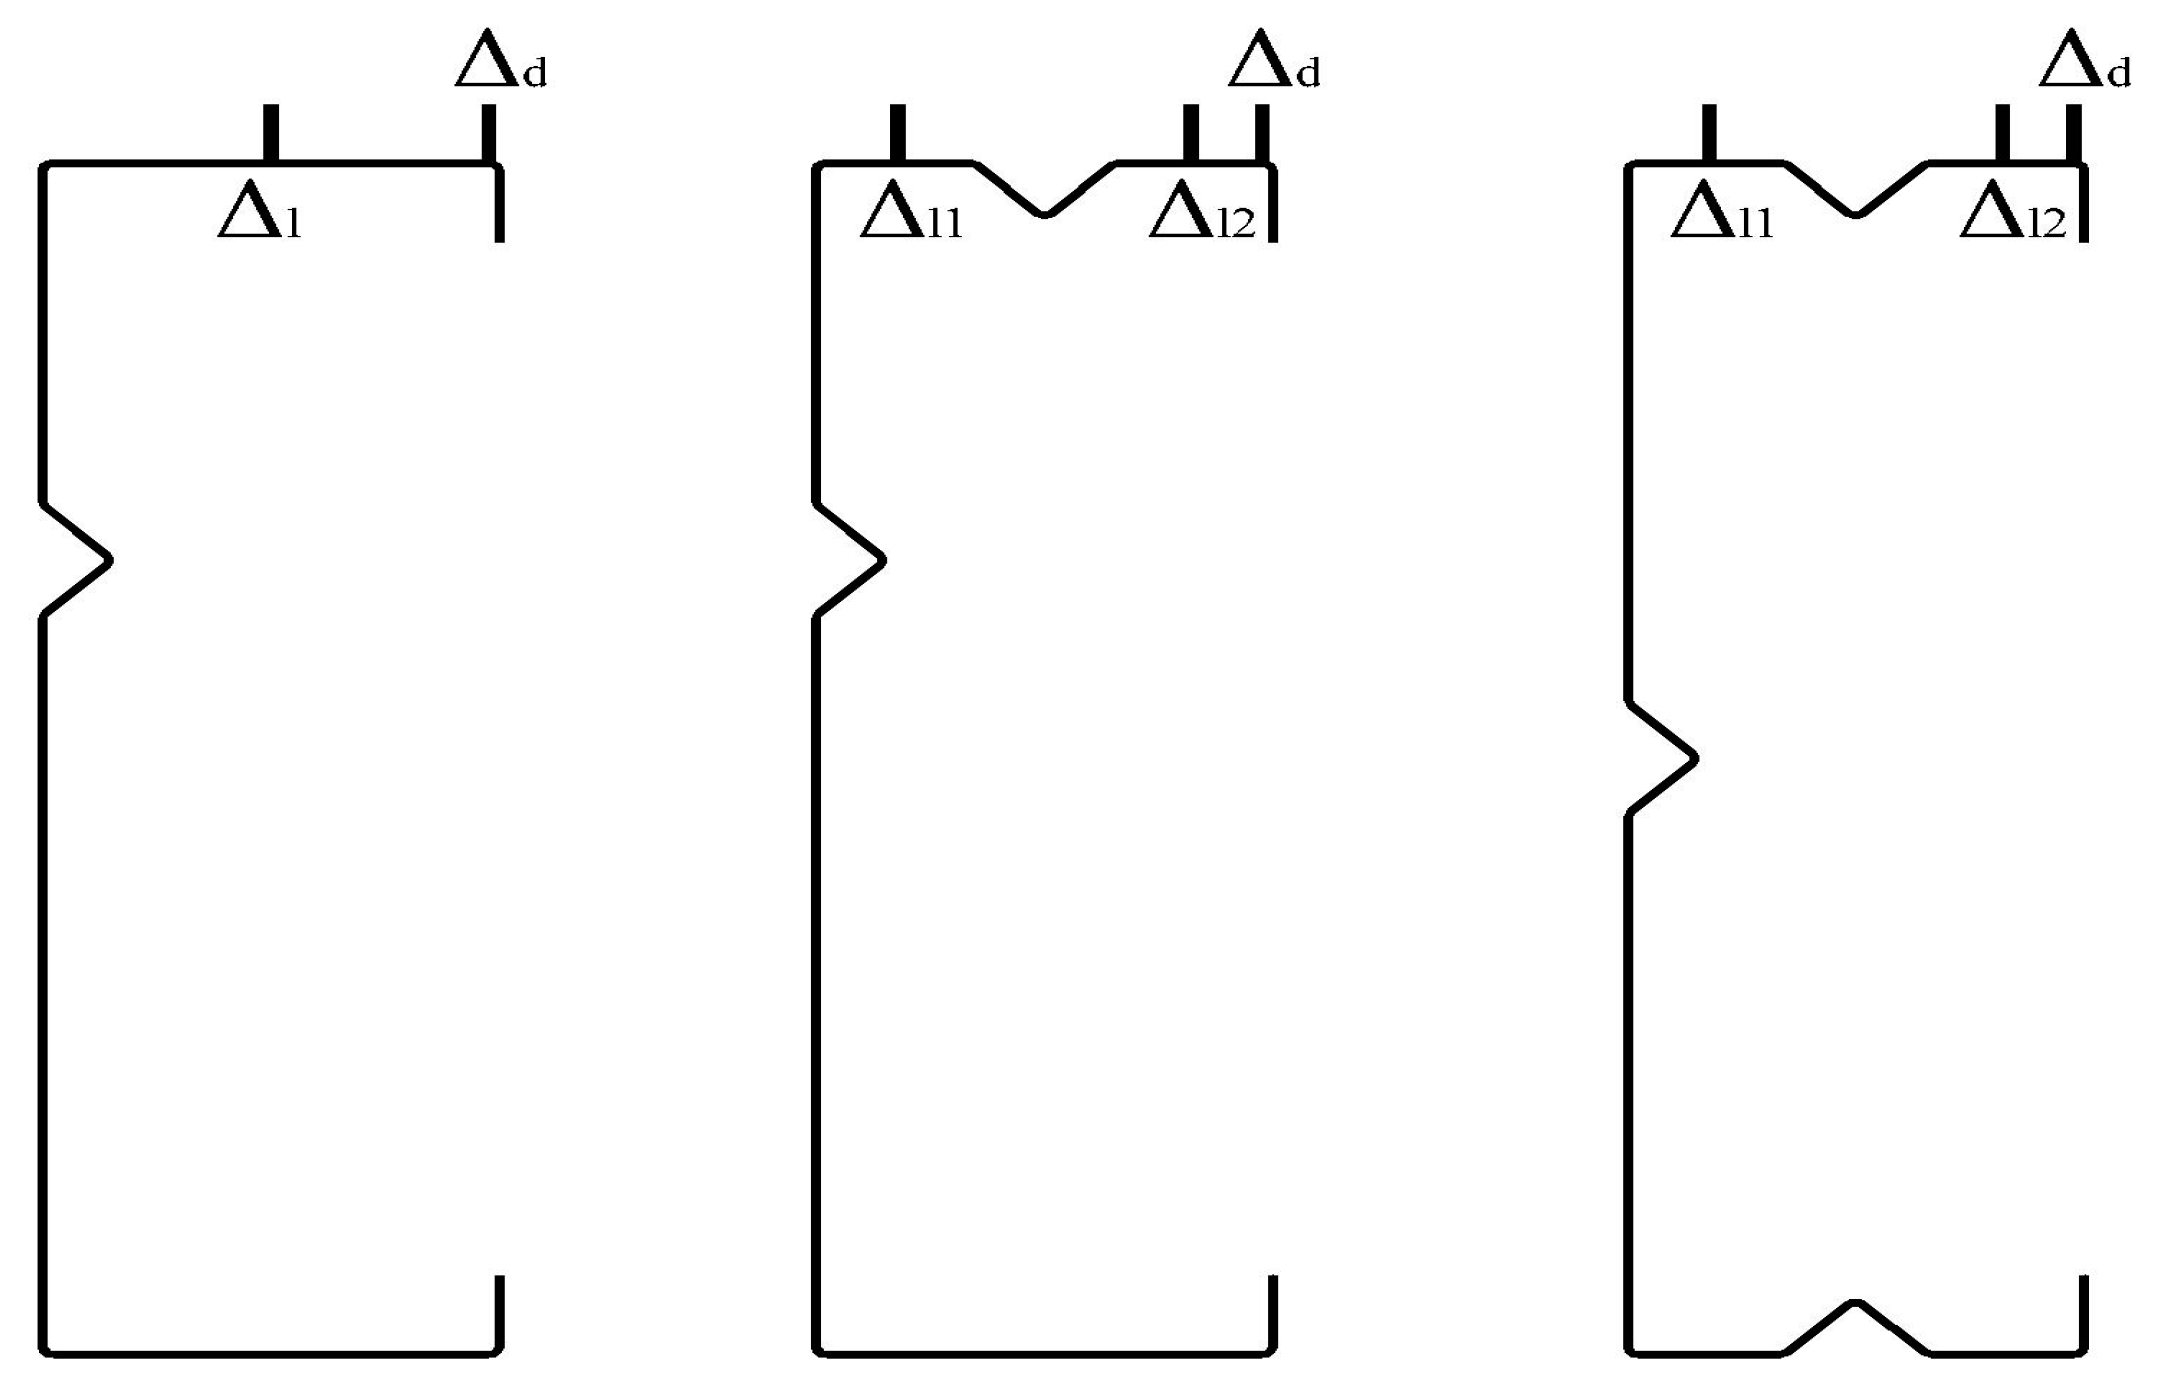
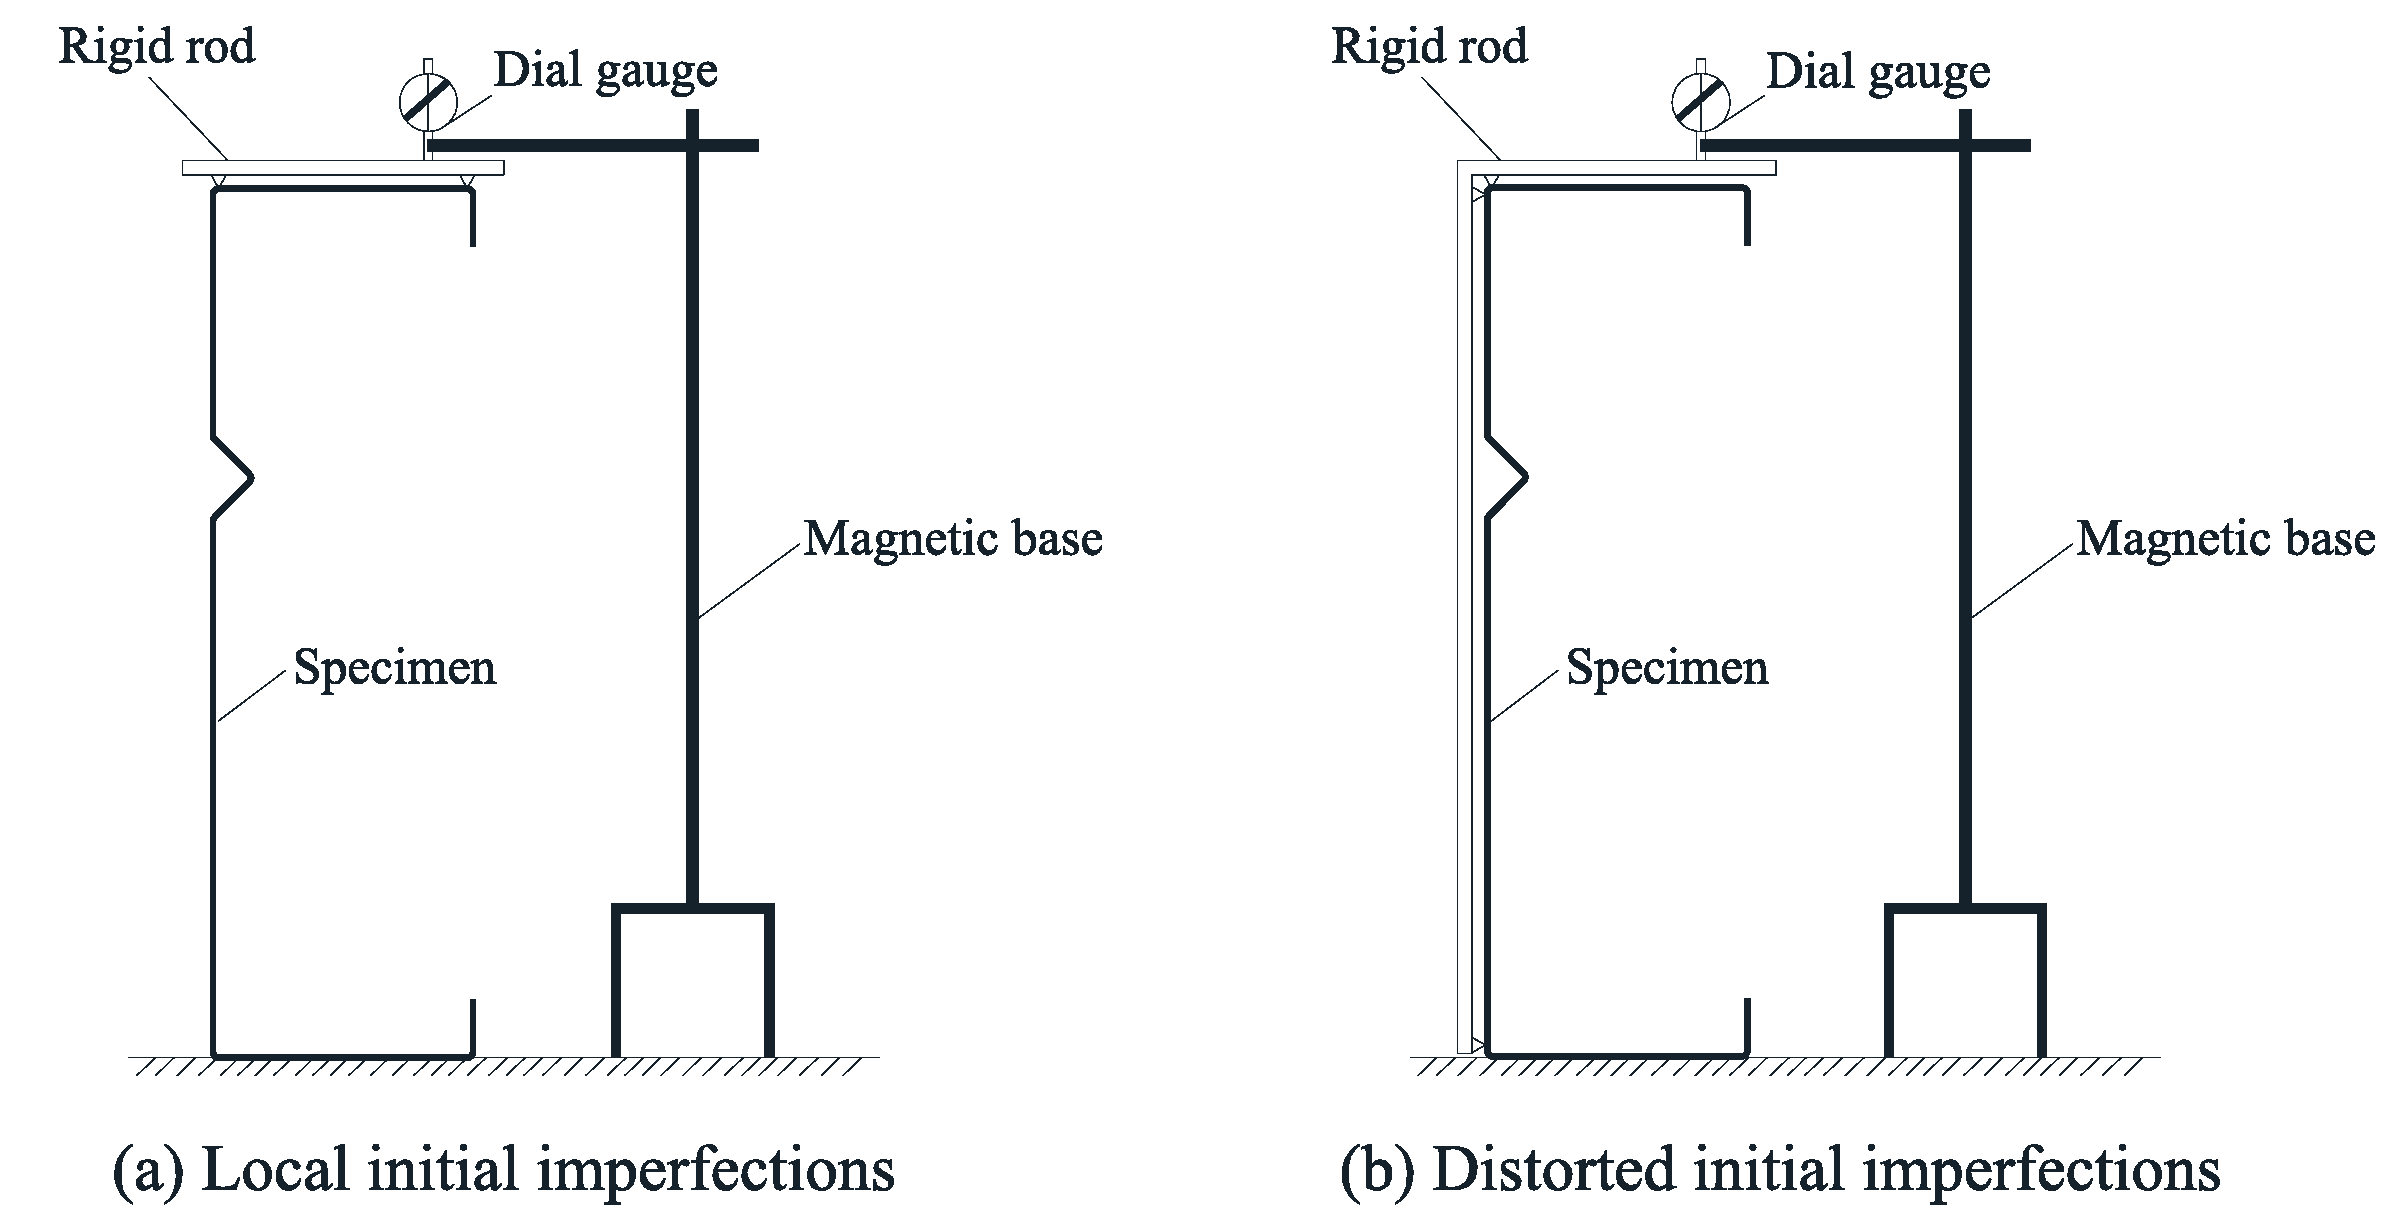
It has been demonstrated that initial imperfections can affect the member’s bearing performance, and the thinner the member, the larger the influence [13]. Before the test, the test specimens are measured using a method described in the References [14,15] to note any local initial imperfections and distorted initial imperfections. The study section of the test specimen’s pressurized flange is divided into 19 equal pieces before measurement. The location of the measurement point for the pressurized flange along the width direction is shown in Figure 4, and the intersection point of the straight lines in both directions is used as the measurement point for the initial imperfections. Figure 5 depicts the measurement device. Read the dial indicator readings on the rack before and after the rigid rod is removed, and record them as ∆1 and ∆2, respectively. The initial geometric defect value of the measured point can be regarded as ∆ = ∆1 − ∆2 − d if the distance between the rigid bar’s upper surface and the fulcrum is d, and the initial defect value for external convexity is positive and internal concavity is negative. Table 3 provides the ratio of the maximum value of the test specimen’s initial defect to plate thickness.
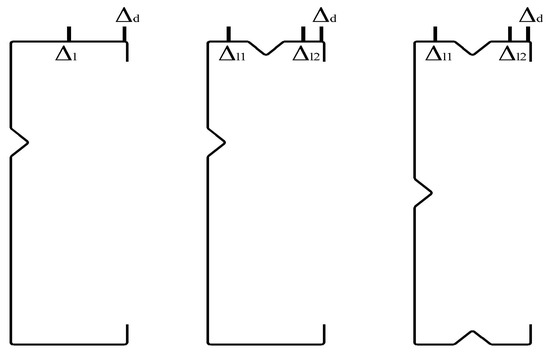
Figure 4.
Schematic diagram of the initial imperfections.
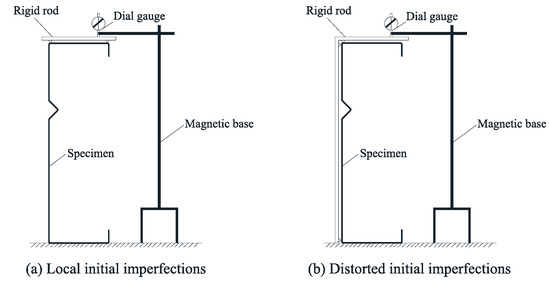
Figure 5.
Measuring devices of the initial imperfections.

Table 3.
Initial imperfections of the specimens.
2.4. Loading Device
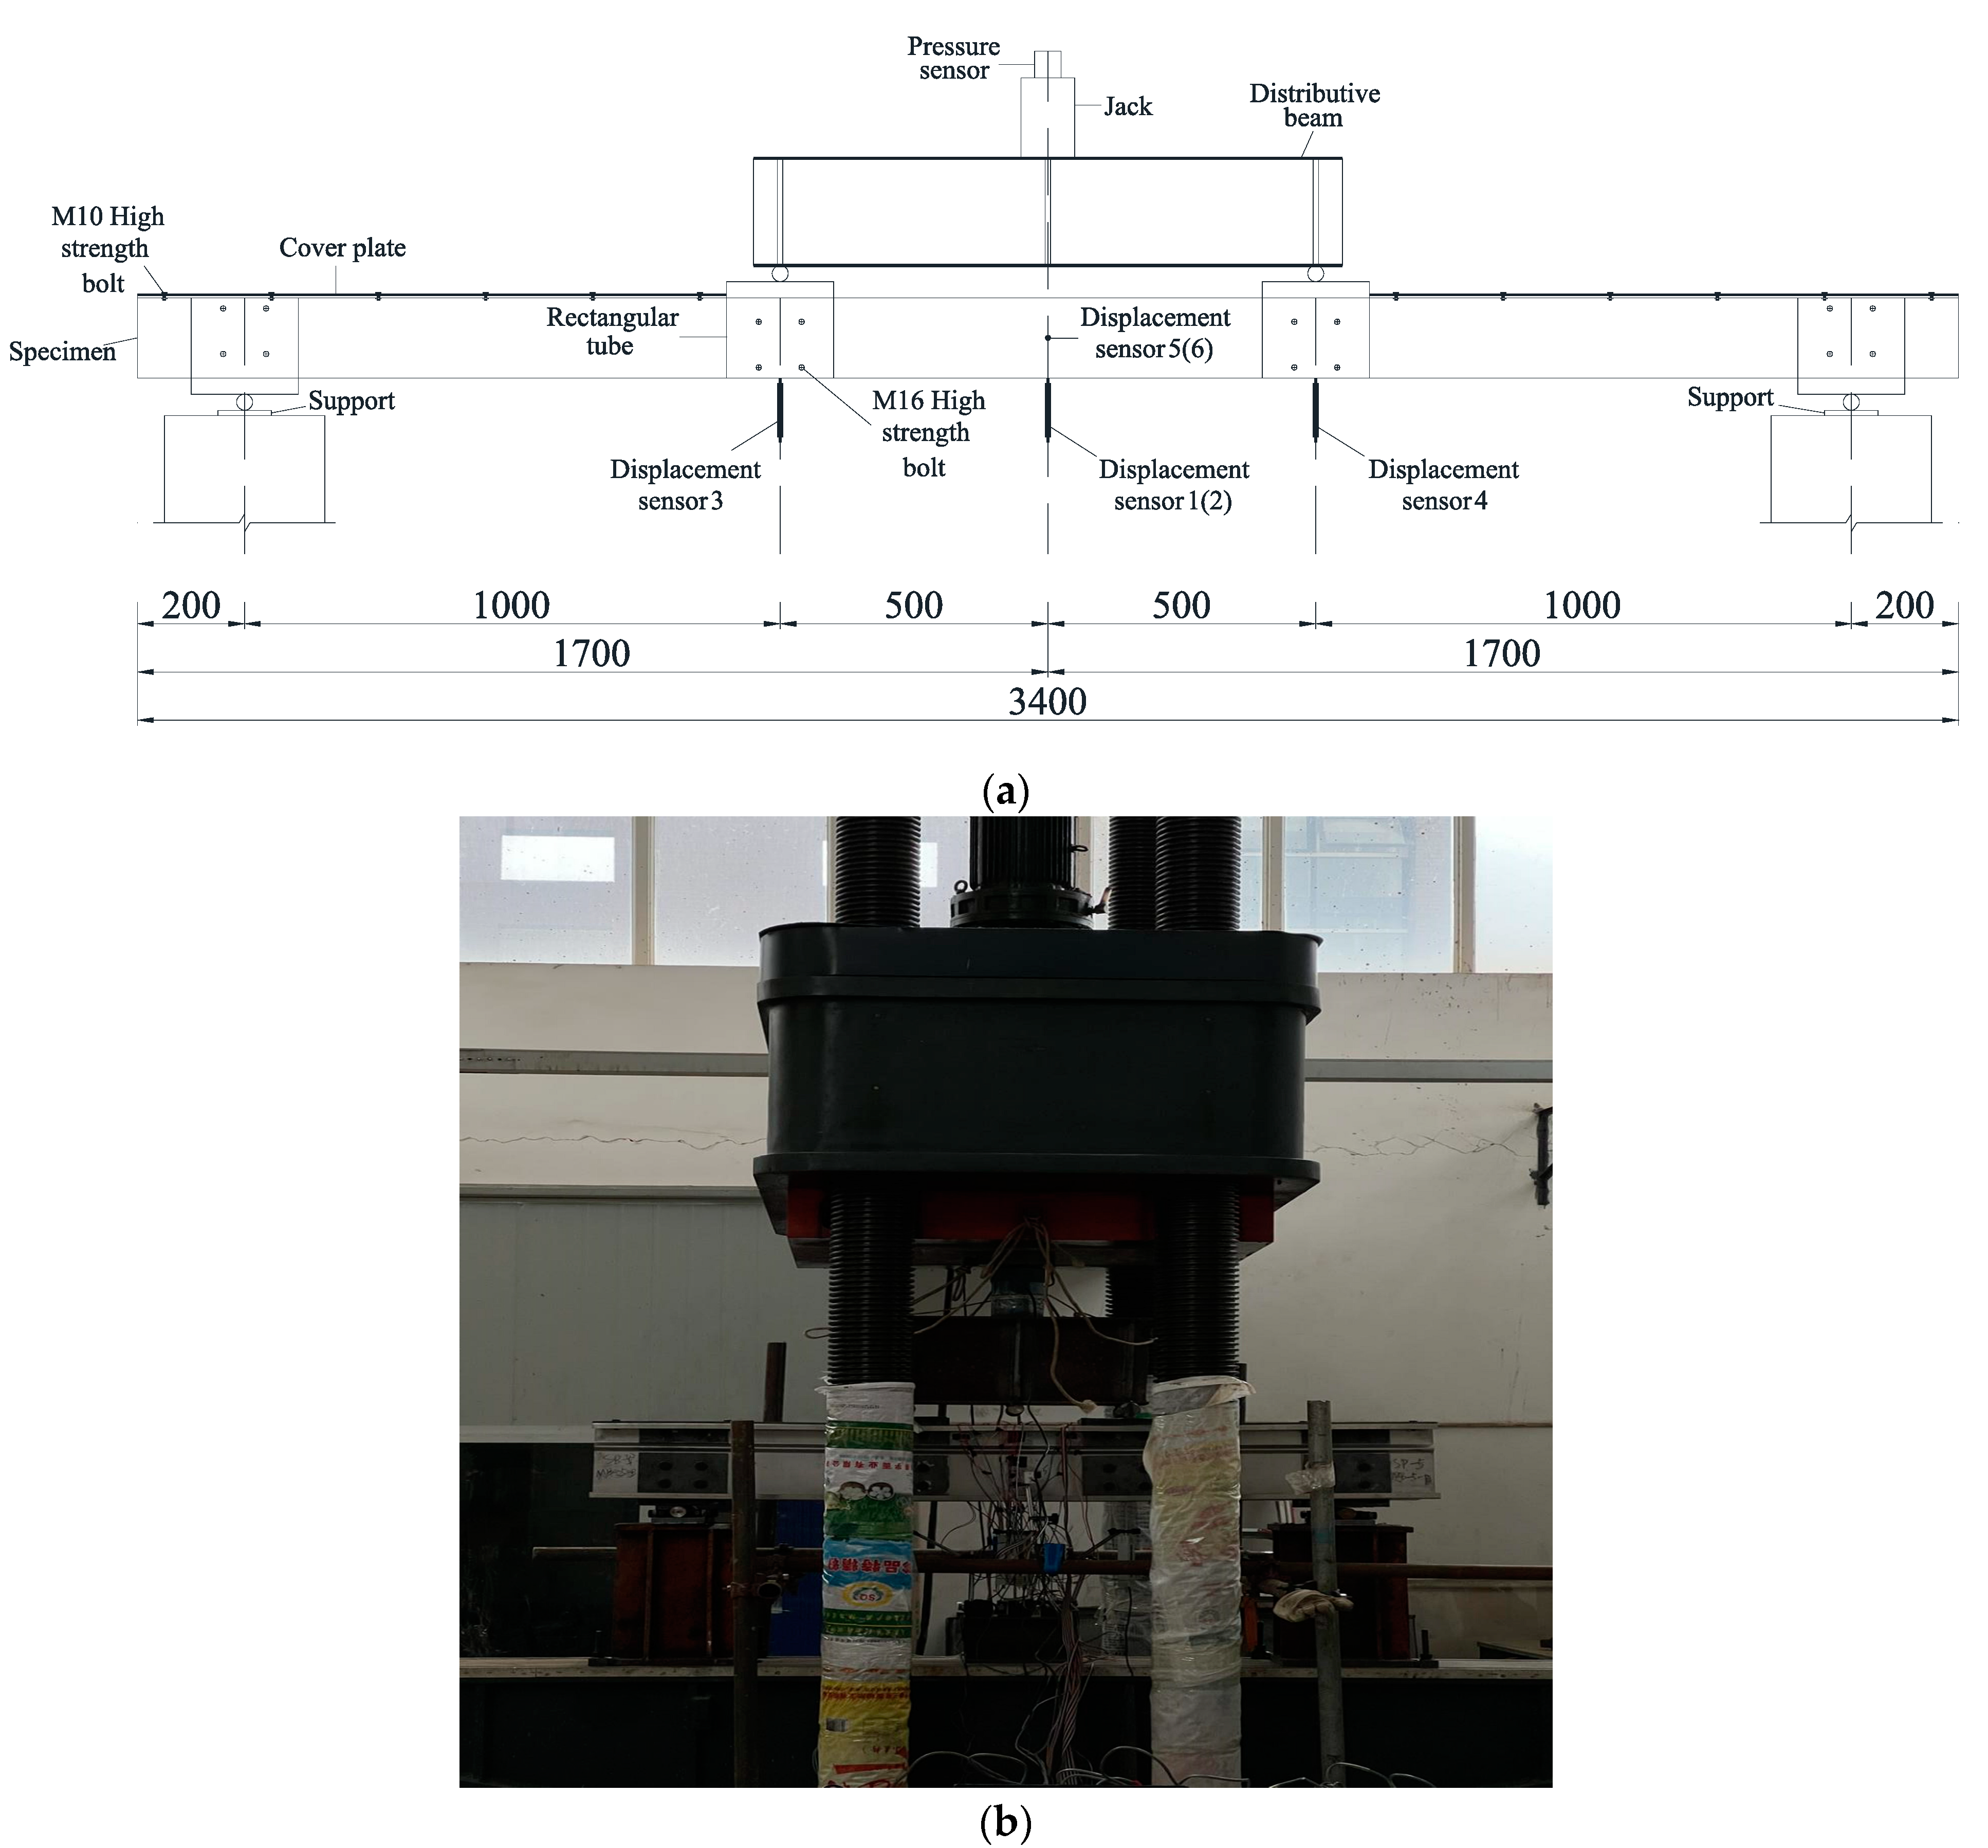
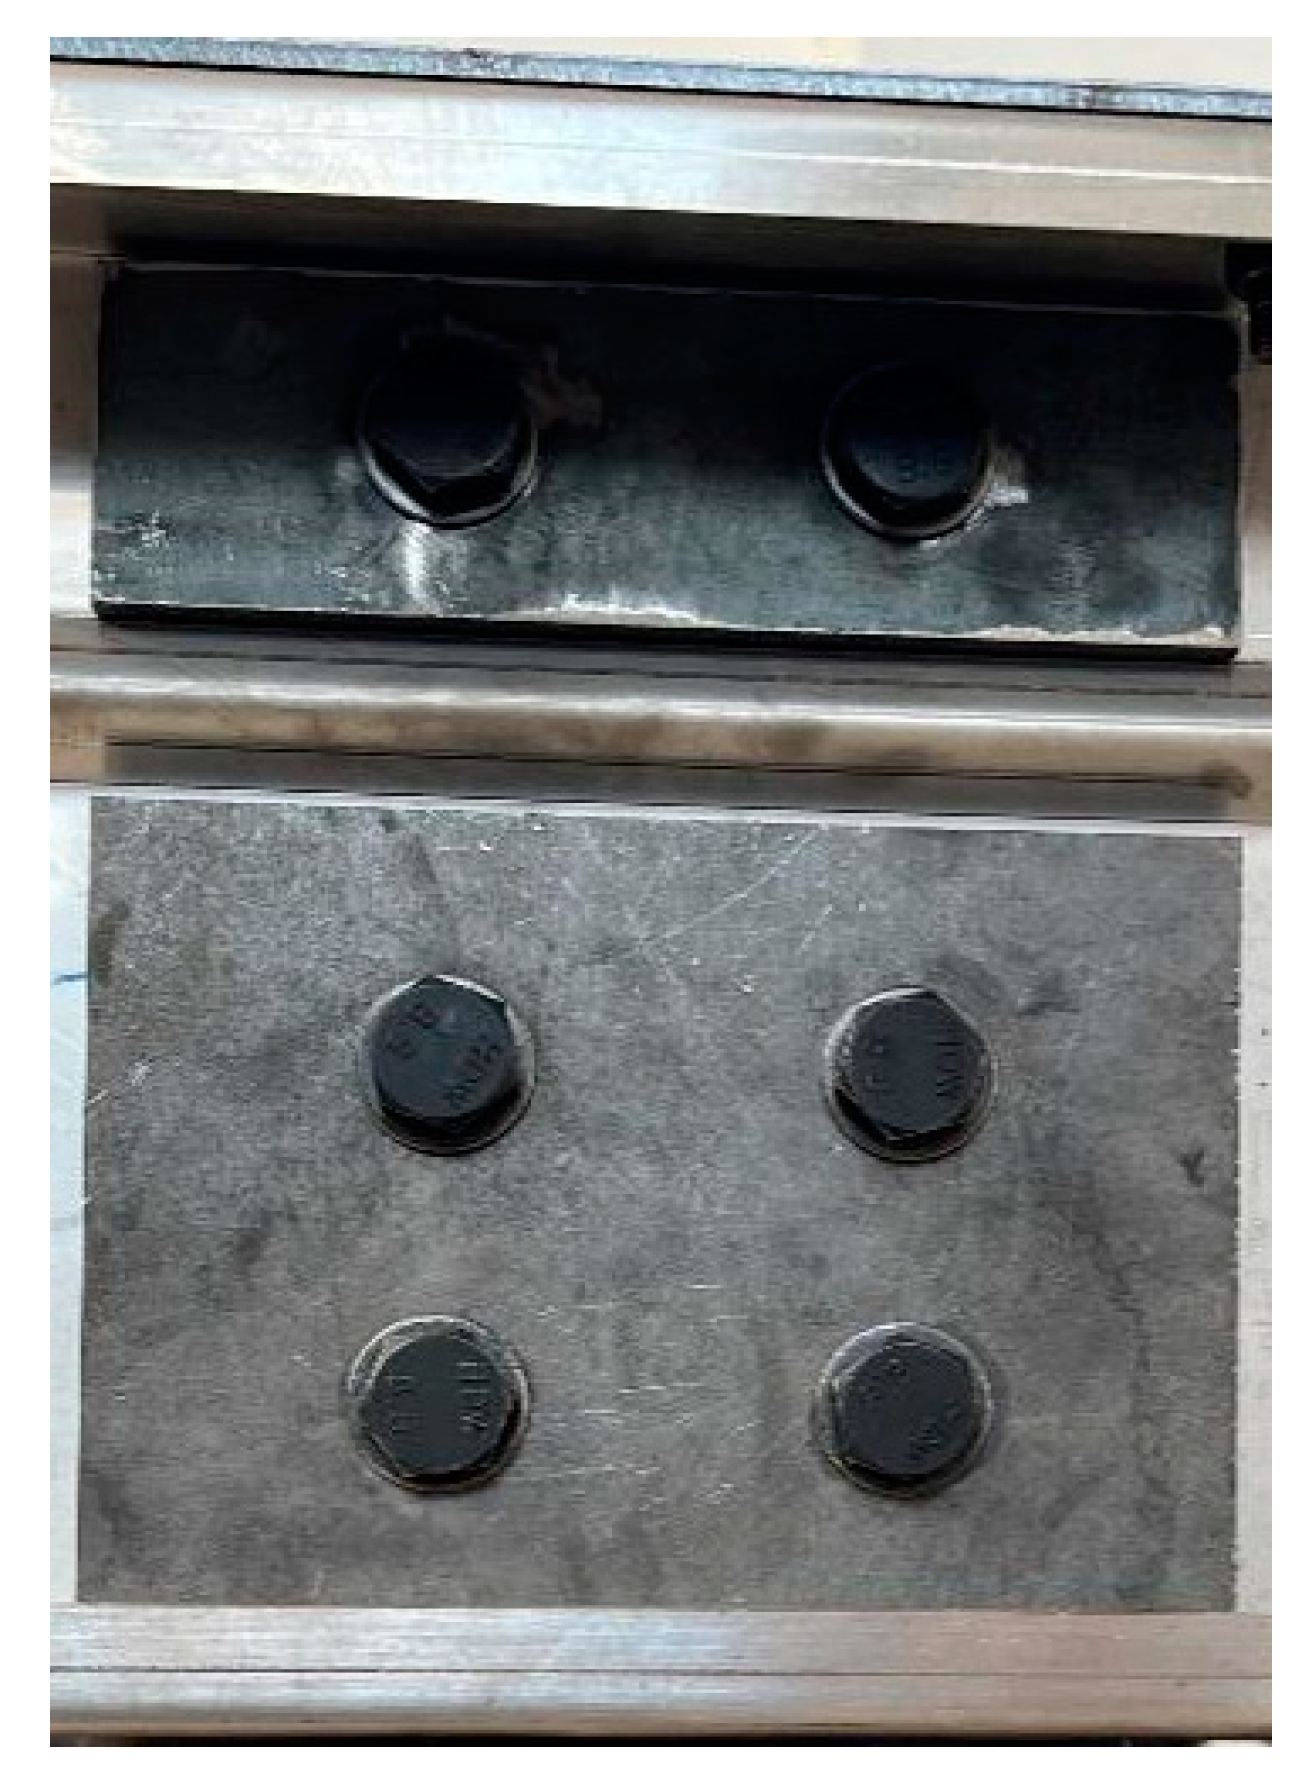
The test loading device is depicted in Figure 6a, and all dimensions in mm. Two identical specimens are connected back-to-back, and the webs of the two specimens are connected to the square steel pipe joint by M16 high-strength bolts at the supports and loading points. An external steel plate is placed at the side of the bolt contact with the specimen to prevent excessive local pressure from damaging the specimen at the bolt hole, as depicted in Figure 7. The square steel pipe and external steel plate material are both made of a Q235B grade hot-rolled steel plate. Due to friction between the webs and the high-strength bolts at the loaded square steel tube, the load is uniformly distributed to the webs of the two specimens before being distributed to the entire specimen by the webs.
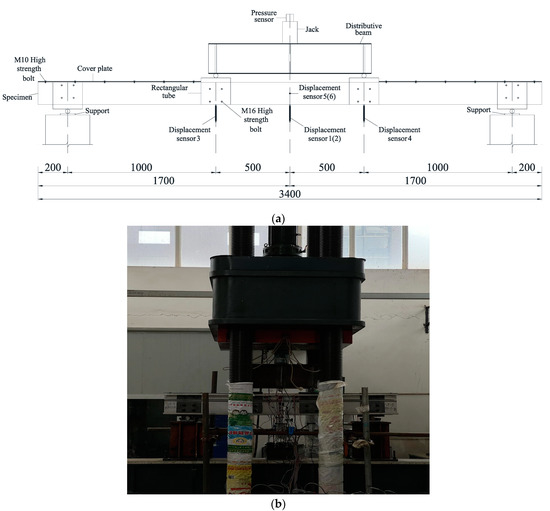
Figure 6.
Test device for (a) the loading device and (b) the layout of test equipment.
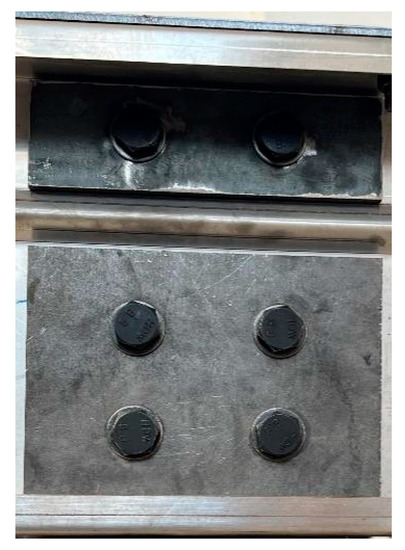
Figure 7.
External steel plate.
The pure bending section is treated as the research focus, and three-point loading is adopted by using a distribution beam to apply the loading. The 1000 mm-long section in the specimen middle is the pure bending section. To prevent the specimen from buckling; overall, during the test and to remove the influence of the bending shear section on both sides of the loading point, the upper flange of the specimen bending shear section is connected to the 5 mm-thick cover plate on both sides with M10 high-strength bolts. The spiral jack is used for manual loading, and the sensor reading reveals the specimen’s bearing capacity and the amount of loading at each jack level. On the piers at both ends, fixed and sliding hinge supports are installed.
2.5. Arrangement of Measuring Points
Each group of specimens in this test has 6 displacement sensors, of which 4 are set up for one constituent specimen at the compressed web, the loading point of the tensile flange, and the span of the tensile flange. These displacement sensors measure the vertical and lateral deflections of the span of the specimen and the two loading points. In order to measure the span wise and lateral deflection, the other component specimen has 2 displacement sensors at the position of the span of the tensile flange and at the compressed web, as shown in Figure 6a. The strain gauges are positioned at the mid-span section of the study section of the purely bending specimen and on both sides of the span at a length of 1/4 of the study section from the mid-span in order to check the physical alignment of the specimen before loading and to monitor the stress distribution in the study section during the test.
2.6. Test Procedure
Before the formal loading, the preload is preloaded in three stages to 15% of the predicted ultimate load. The readings of the displacement sensor and strain gauges at the same section of the two specimens are used to determine whether the force on the two specimens is uniform. If they are not roughly equal, the distribution beam and the jack positions are then readjusted repeatedly until the forces on the two specimens are equal.
The formal loading adopts a graduated loading mechanism, first using the displacement-controlled loading mode, and then the load-controlled loading mode. The specific loading system is as follows: In load-controlled loading, the load is added to 50% of the estimated bearing capacity (using a finite element simulation for the estimated bearing capacity) at a rate of 1 KN/s. At this point, the loading is stopped and held for 1 min while pictures of the member are taken, and the strain gauges and displacement sensor data are monitored to see if the load is uniform. In order to obtain the desired results in the displacement-controlled loading stage, the loading is imposed at a rate of 1 mm/min. In order to collect accurate data when plastic deformation occurs in the specimen, this rate is slower than in the previous stage. Whenever there is an increase in displacement of 1 mm or more, take one picture for the record, and during this process, personnel is required to maintain a safe distance from the test device. Take new pictures after loading the member to its maximum bearing capacity and note the load reading as the member’s maximum bearing capacity. Stop loading and complete the test when the member’s bearing capacity decreases by about 80% of its maximum bearing capacity.
3. Test Results and Analysis
3.1. Failure Mode
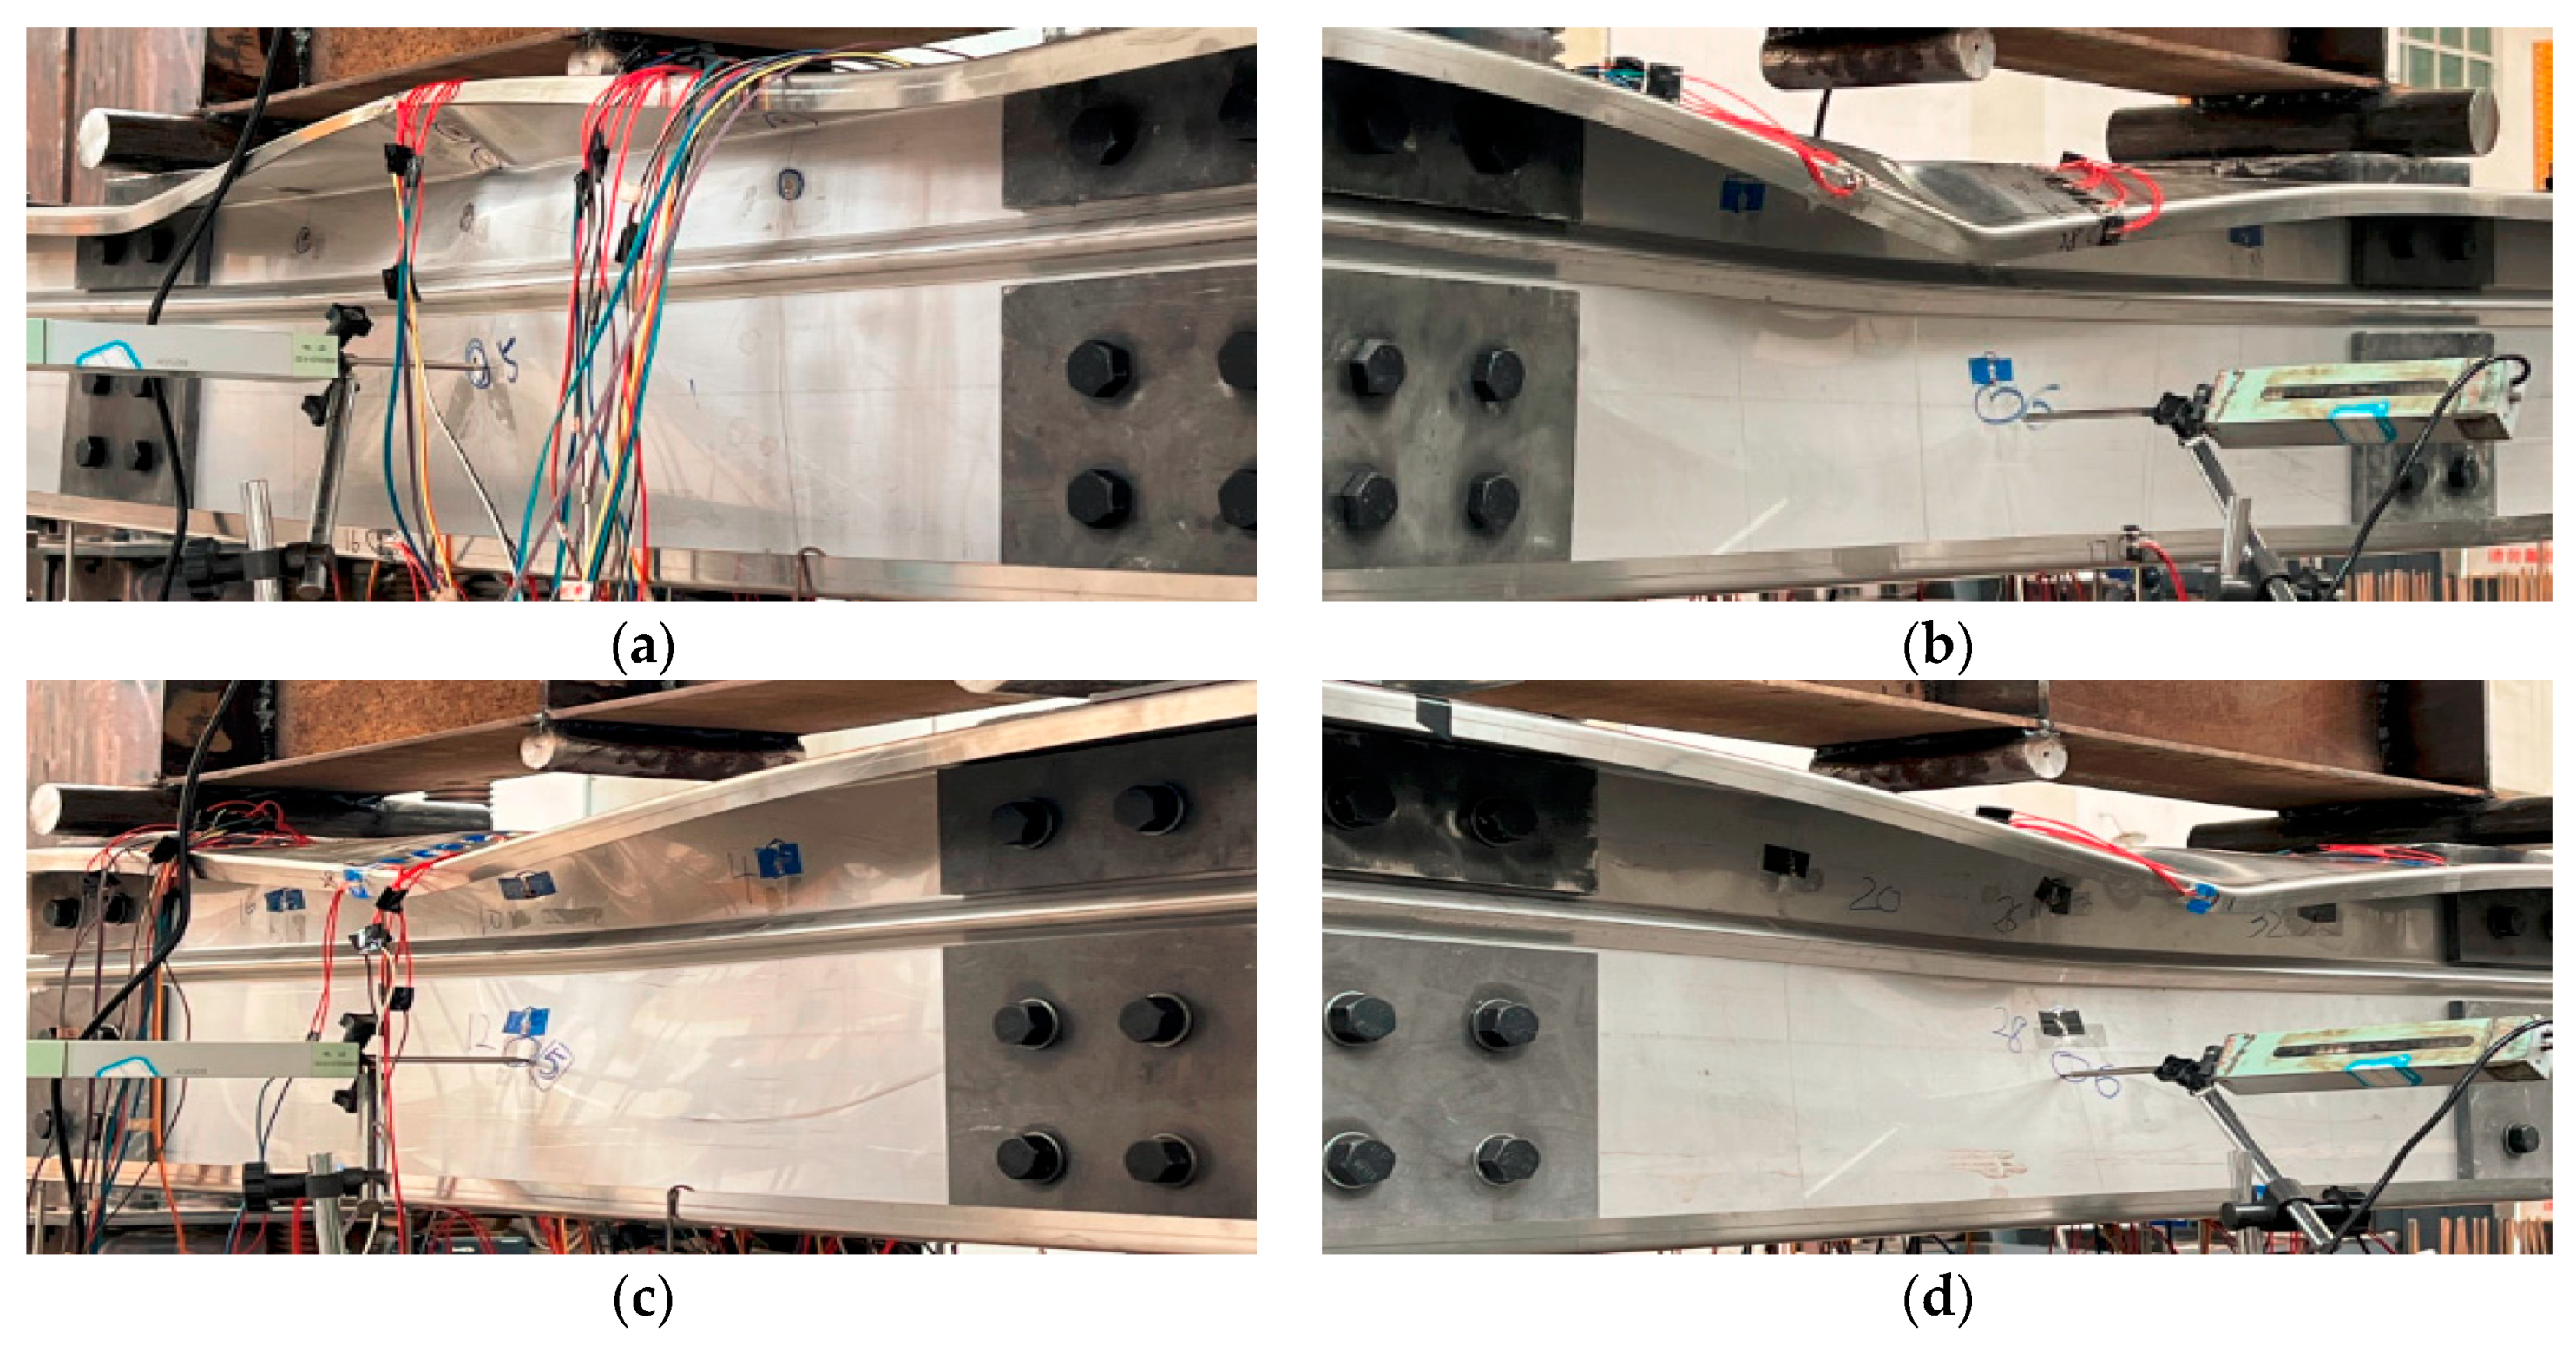
Throughout the entire test, the specimens present a distortional buckling mode and a local–distortional interaction buckling mode. The SP-1, SP-3, and SP-4 specimens show local–distortional interaction buckling, while the SP-2, SP-5, and SP-6 specimens exhibit distortional buckling. Overall buckling does not appear, and the lateral displacement of each group of tests is minimal.
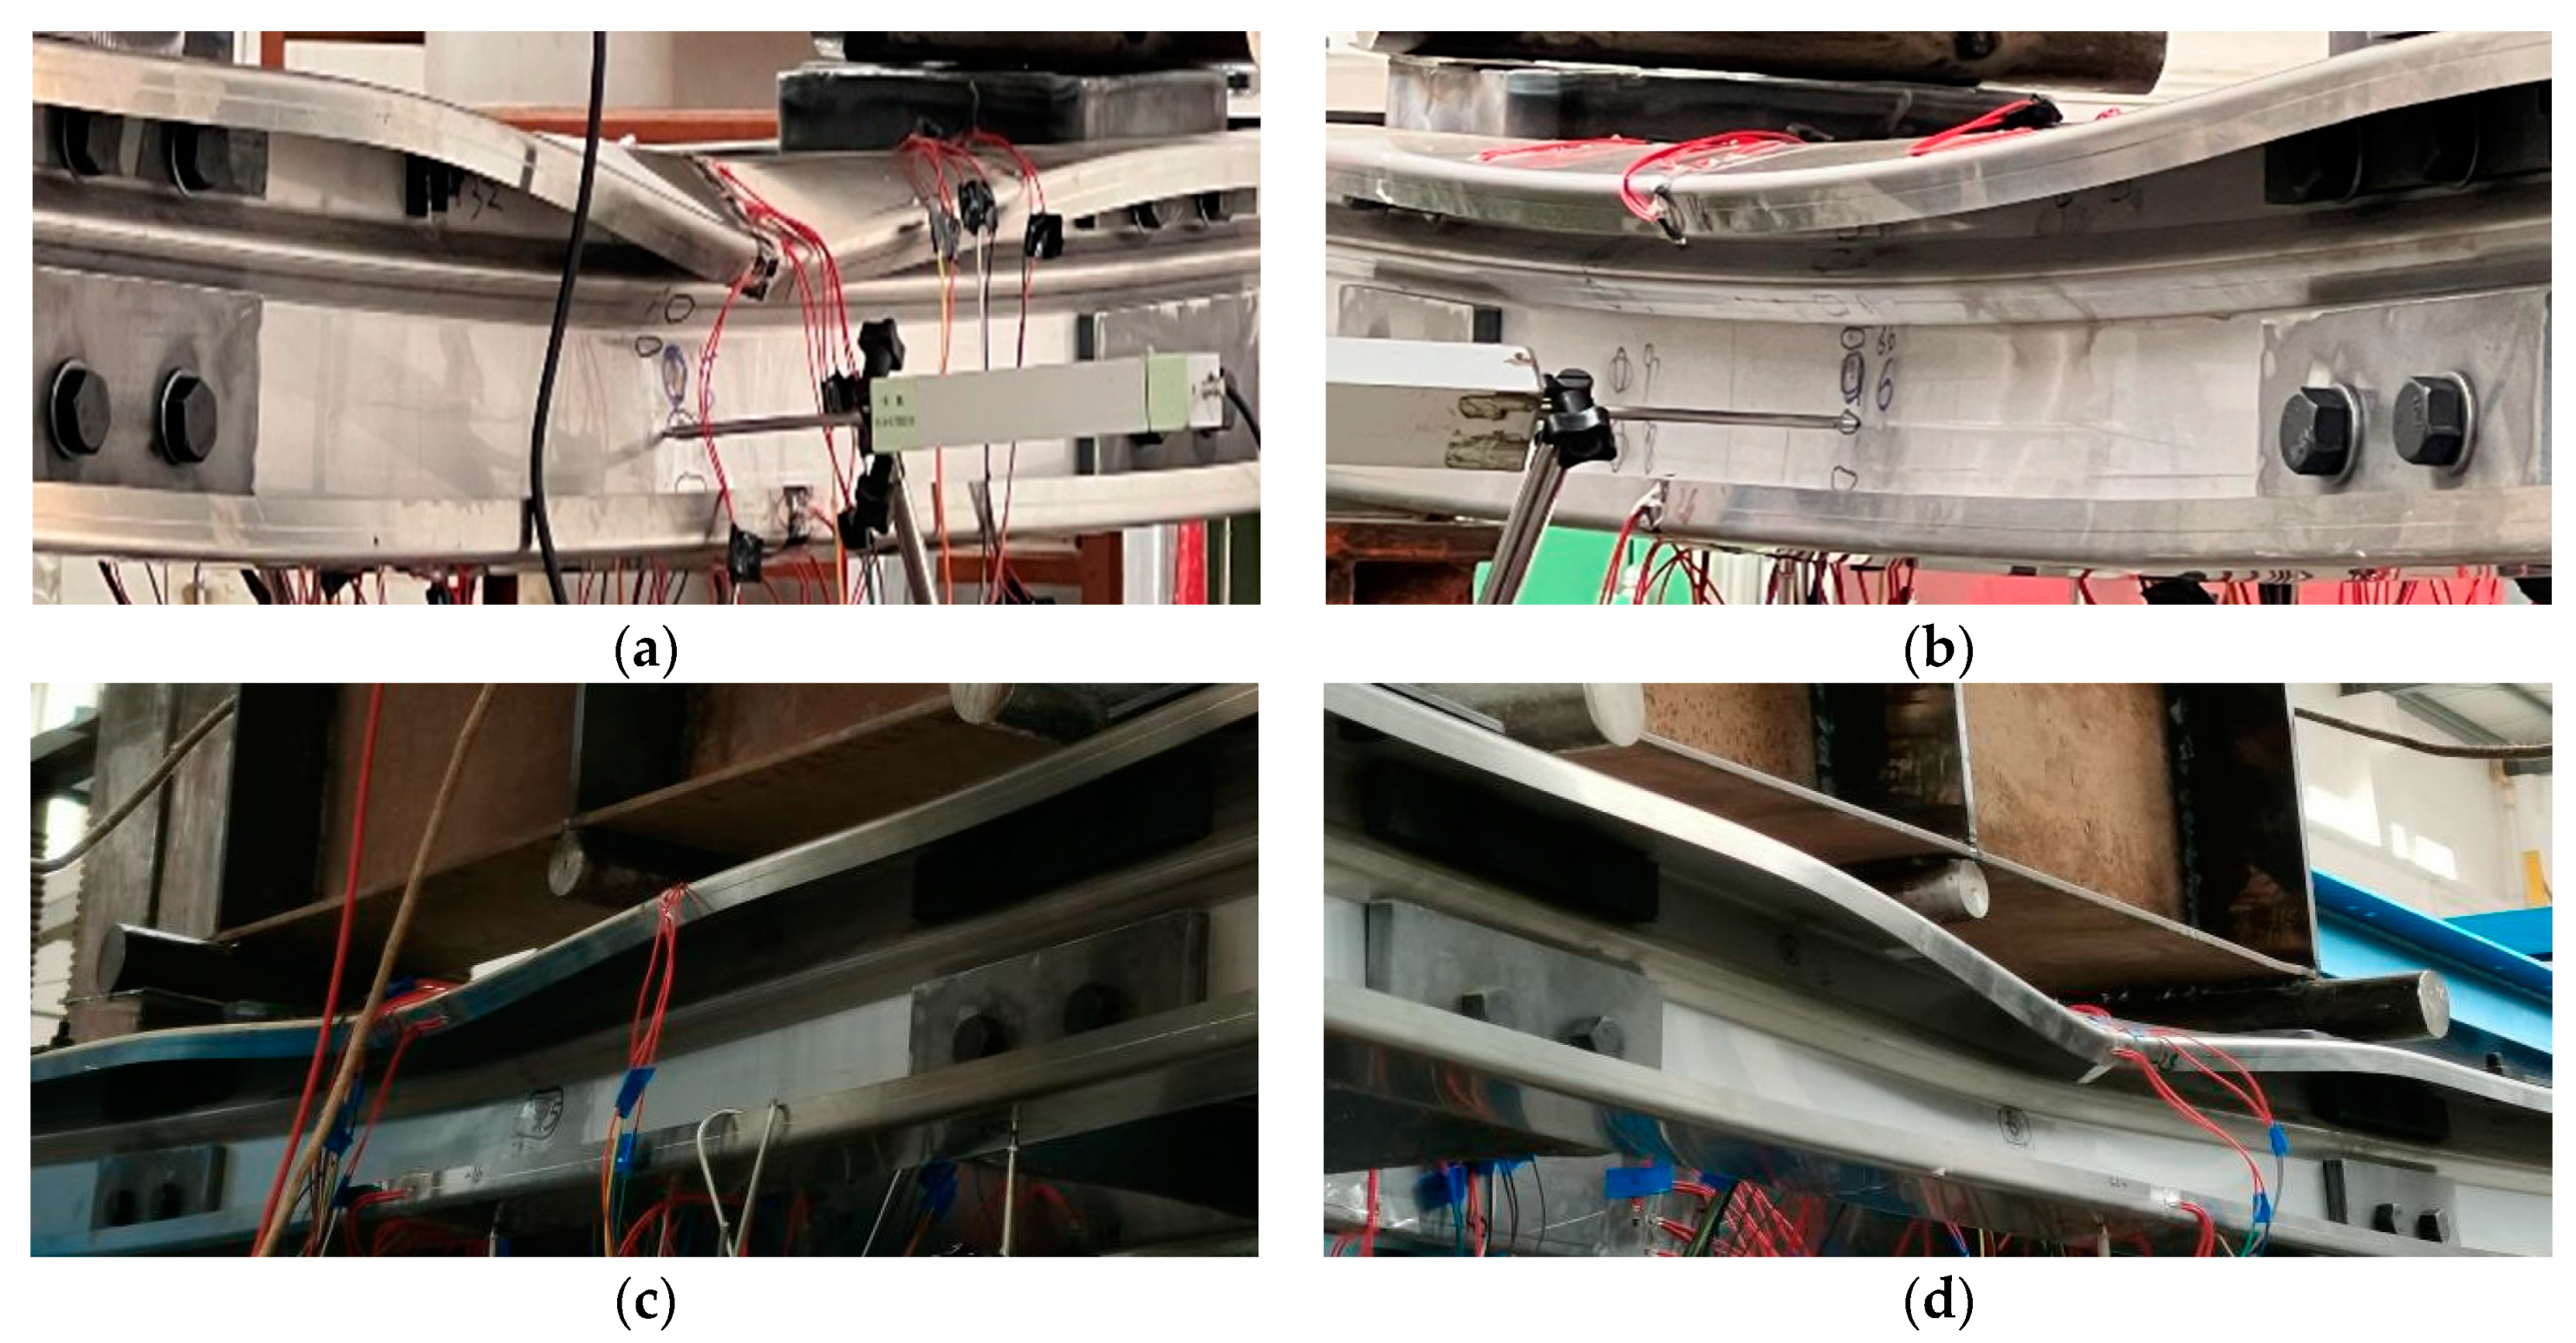
In the SP-1 and SP-2 tests, the two SP-1 specimens deformed differently, with the deformation of SP-1-A being greater than SP-1-B. In addition to the distortional buckling mode, specimen SP-1-A also displayed the local buckling patterns of the flange in the span of the compressed flange, showing both local–distortional interaction buckling modes, while specimen SP-1-B only displayed distortional buckling. The deformation of two SP-2 specimens is consistent, exhibiting distortional buckling mode, as shown in Figure 8.
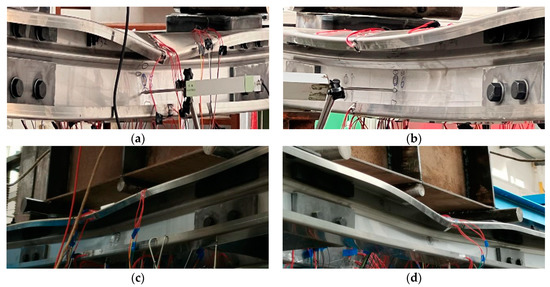
Figure 8.
The failure mode of SP-1 and SP-2. (a) SP-1-A, (b) SP-1-B, (c) SP-2-A, (d) SP-2-B.
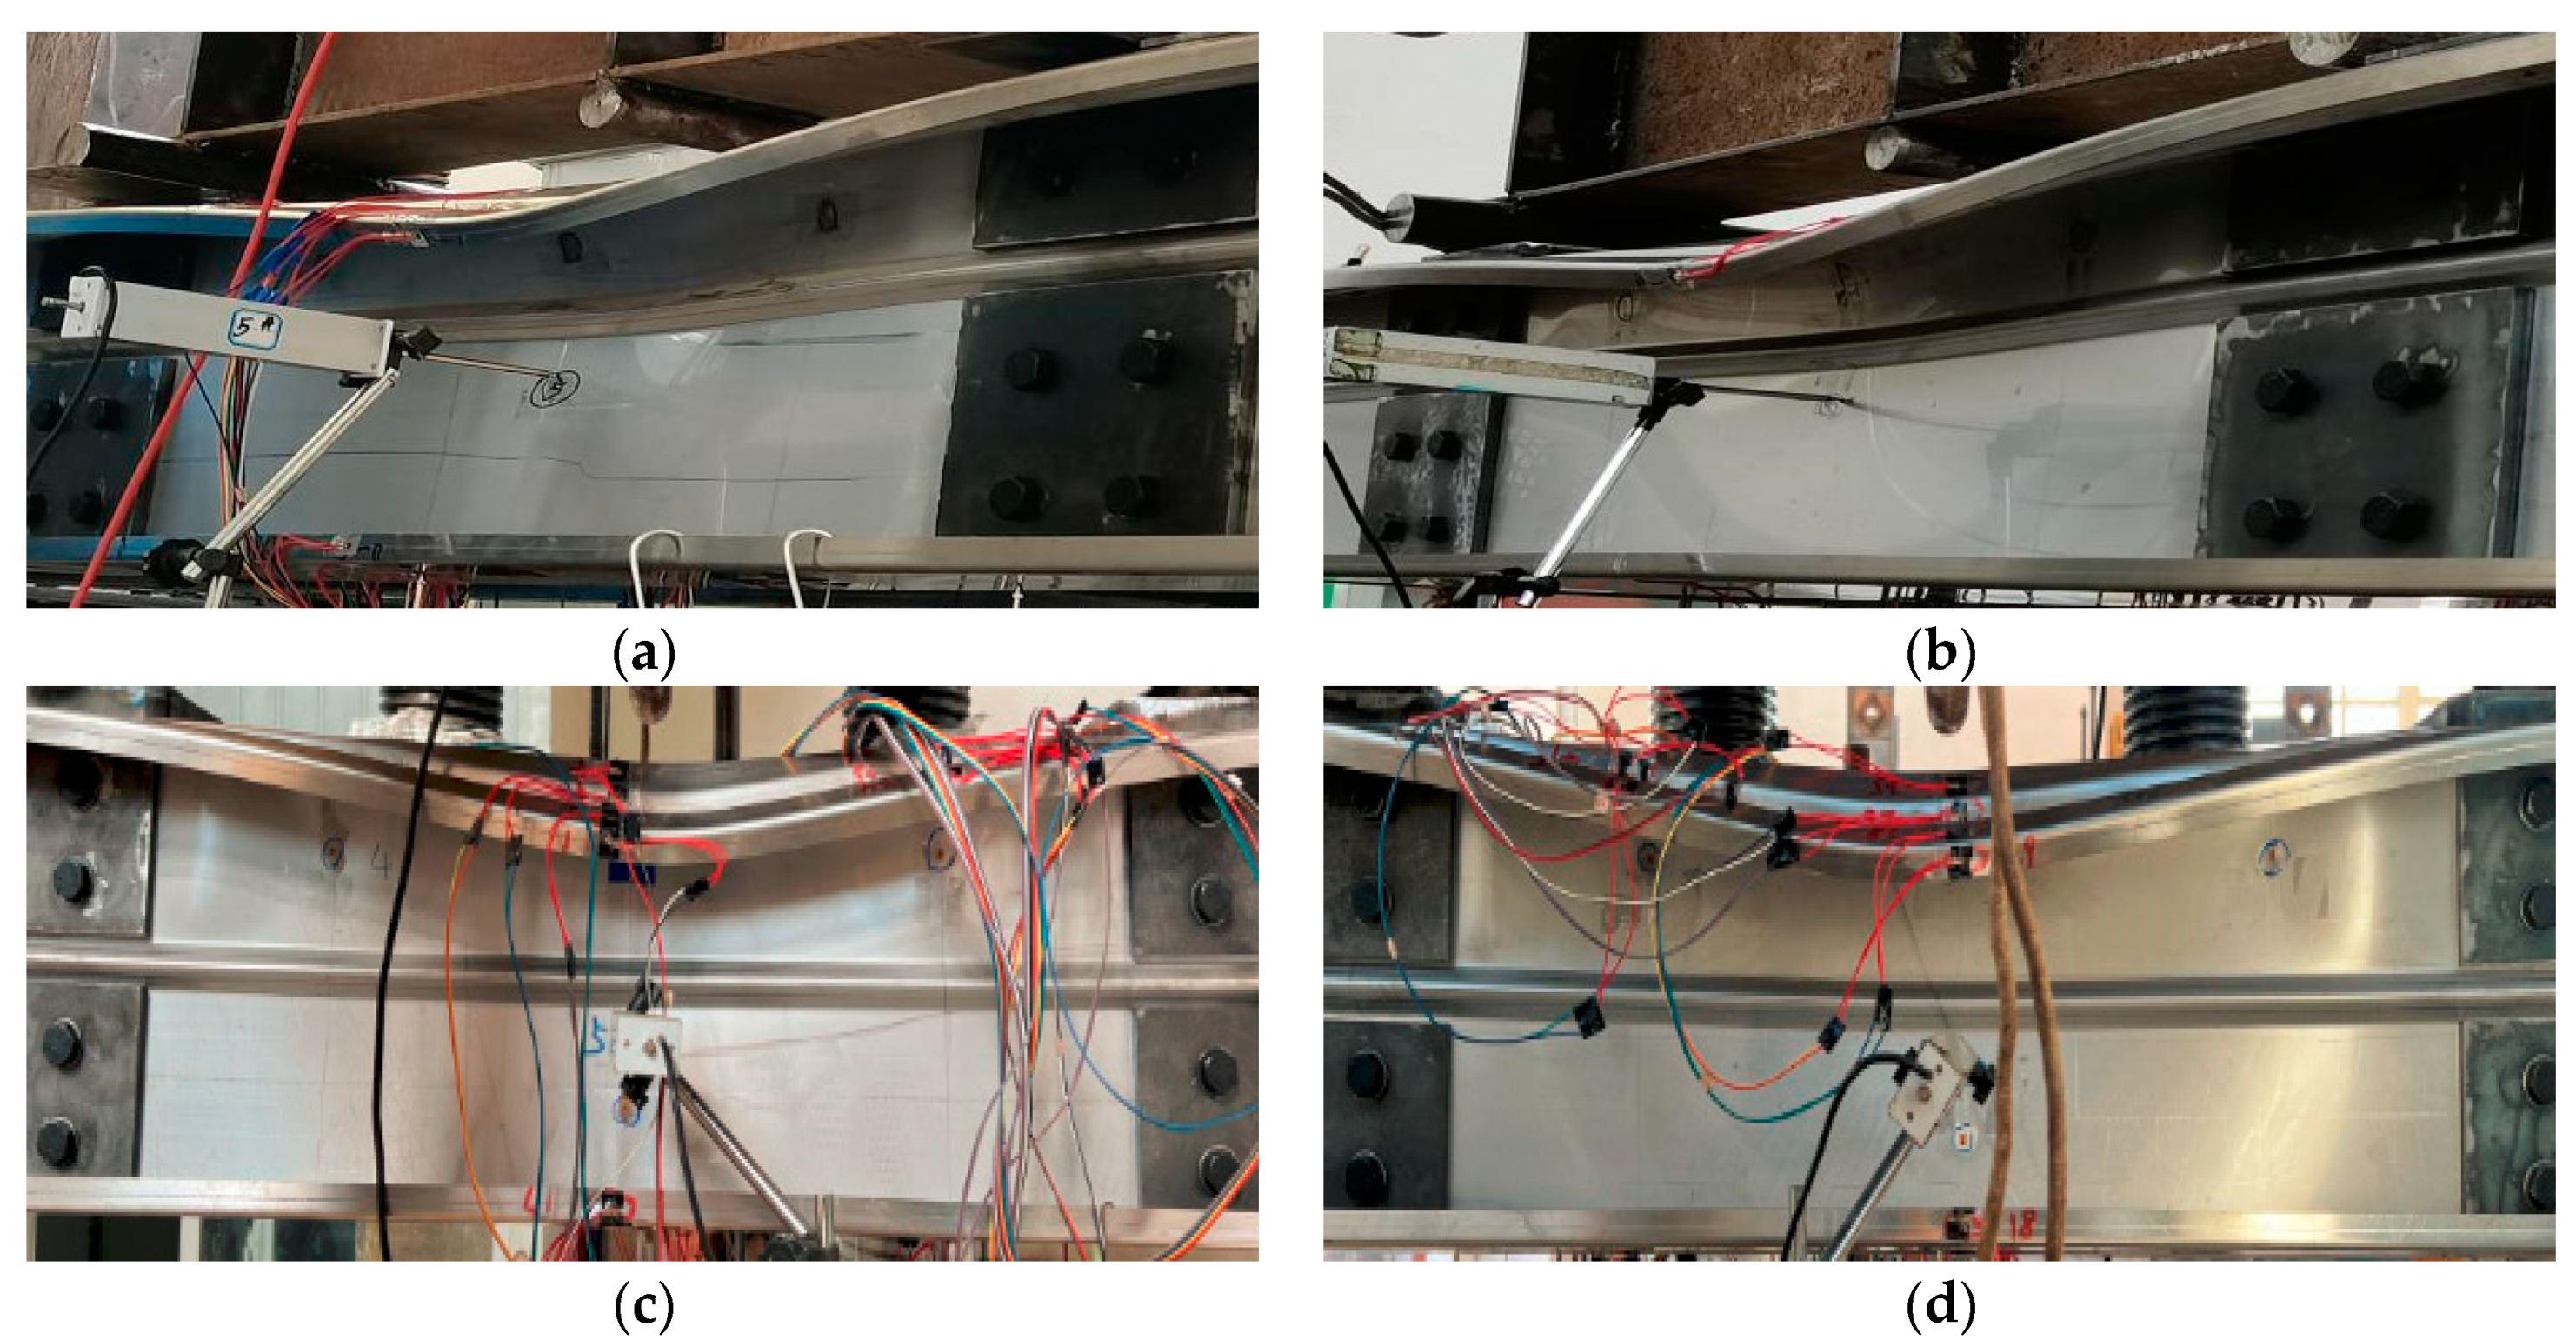
In the SP-3 and SP-4 tests, the two SP-3 specimens present different deformations, but they are more pronounced than SP-4. Only distortional buckling is visible in specimen SP-3-A, but in specimen SP-3-B, local buckling of the flange on the compressed flange in the span is also visible, demonstrating a local–distortional interaction buckling mode. The two SP-4 specimens’ deformation is essentially consistent, and both displayed distortional buckling, in addition to local buckling of the flange on the compressed flange in the span, presenting a local–distortional interaction buckling mode, as shown in Figure 9.
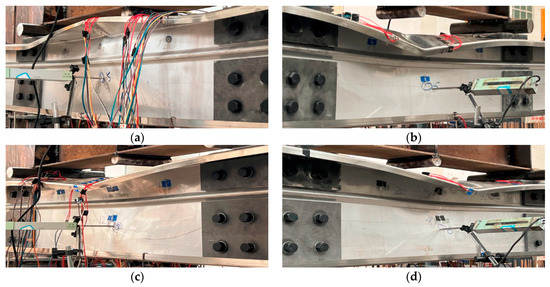
Figure 9.
The failure mode of SP-3 and SP-4. (a) SP-3-A, (b) SP-3-B, (c) SP-4-A, (d) SP-4-B.
In each group of tests for the SP-5 and SP-6 specimens, the deformations of the two specimens are essentially the same, and both displayed apparent distortional buckling caused by the middle V-stiffeners of the flange. However, the deformation of SP-6 is greater than that of SP-5, primarily because the V-stiffeners on the web of SP-6 are shifted down to the middle stiffening, as shown in Figure 10.
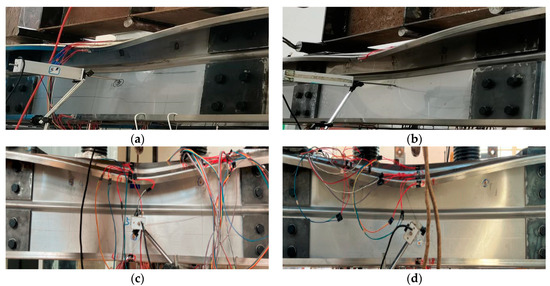
Figure 10.
The failure mode of SP-5 and SP-6. (a) SP-5-A, (b) SP-5-B, (c) SP-6-A, (d) SP-6-B.
3.2. Flexural Capacity
Table 4 lists the tested flexural bearing capacity of the specimens. Although the V-stiffener ribs of specimen SP-2 are taller and wider than those of specimen SP-1, the latter’s flexural bearing capacity is 13% less due to local–distortional interaction buckling, which lowers the ultimate bearing capacity of the super-stiffened specimen. When the other cross-sectional parameters of specimens SP-3 and SP-4 are held constant, specimen SP-4 has a 23% higher flexural bearing capacity than specimen SP-3, despite having the same height-to-width ratio. The flexural bearing capacity of specimen SP-5 is 13% higher than that of specimen SP-4, while specimen SP-6 shifts the web’s V-stiffeners from a near 1/3 compressed flange to the middle of the web and adds V-stiffeners in the middle of the tensile flange, resulting in a 4.5% reduction in flexural load capacity compared to specimen SP-5. As can be seen, the V-stiffeners in the compressive flange’s middle and the V-stiffeners in the web close to 1/3 of the compressive flange can both offer a greater bearing capacity.

Table 4.
Comparison between the test results and the finite element results.
3.3. Load-Span Displacement Curve
The load-span displacement curves for the stiffening size control group, height-to-width ratio control group, and stiffening position control group are depicted in Figure 10a–c, respectively. From Figure 11, it can be seen that the rising section of the curve for the super-stiffened specimen is below the suitably stiffened specimen, the issue of distortional buckling becomes more evident as stiffener size increases, and the maximum bearing capacity decreases. The curve for the specimen with a larger web height at the same aspect ratio is above the specimen with a smaller web height, which demonstrates that as section size is increased, the specimen’s stiffness and strength increase. The rising section of the curve for the specimen with additional V-stiffeners in the middle of the flange is incredibly close, while the falling section is scattered because of the various positions of the V-stiffeners.

Figure 11.
Load-span displacement curves. (a) Specimens SP-1~SP-2, (b) Specimens SP-3~SP-4, (c) Specimens SP-4~SP-6.
3.4. Load-Span Longitudinal Strain Curve
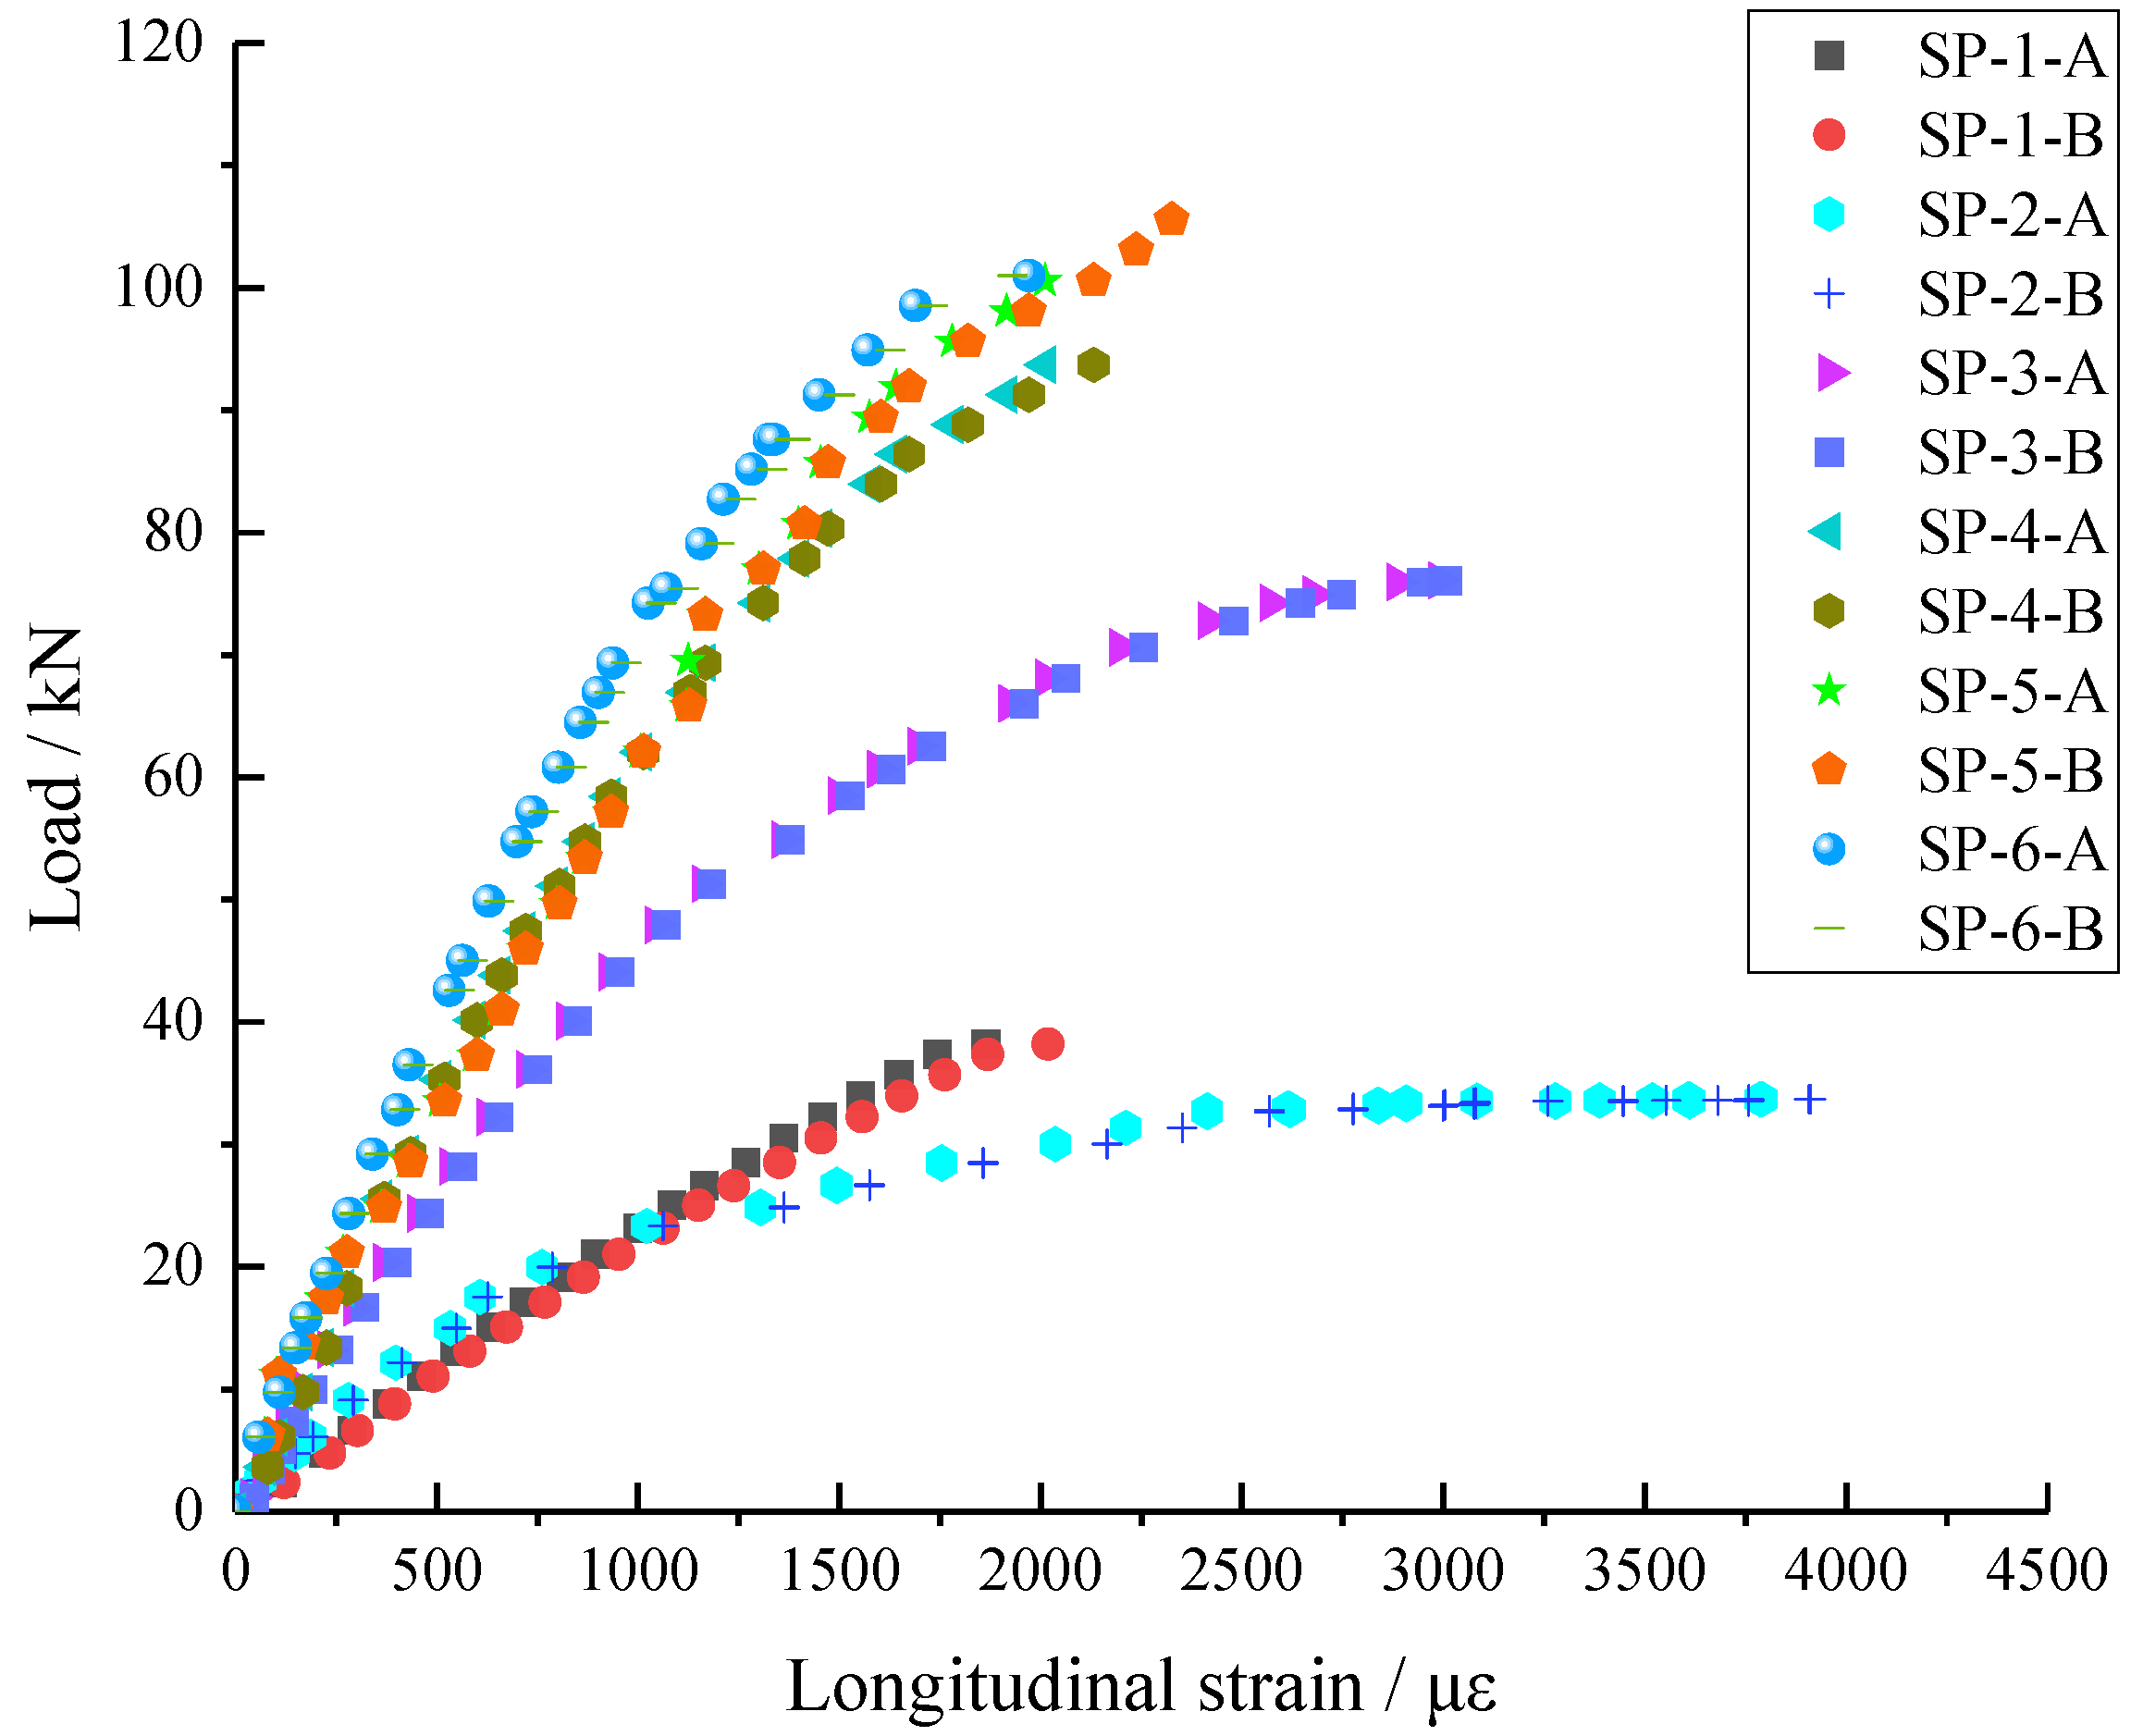
The load-span longitudinal strain curves of six groups of tests are plotted, as shown in Figure 12, using the load as the vertical axial and the longitudinal tensile strain in the span section of the tensile flange as the horizontal axial. As seen in Figure 12, the longitudinal tensile strains in the span cross-section of the two specimens tested in the same group of tests essentially follow the same trend with the load, indicating that the longitudinal tensile deformation of the two specimens is basically coordinated and that the jack load is applied uniformly to the two specimens. This confirms that the test setup has been properly aligned.
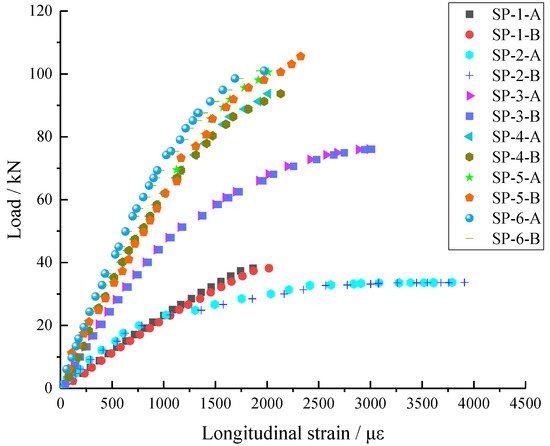
Figure 12.
Load-span longitudinal strain curves.
4. Numerical Analysis
Six sets of tests are subjected to finite element simulations using the finite element program ABAQUS. In the simulation, the dual nonlinearity of the geometry and material are taken into account, and the simulation of the stainless steel specimens using S4R shell cells and the cover and connections are simulated using solid cells. With the actual measured values of material properties in Table 2 and the initial geometric imperfections in Table 3, the member’s material properties and initial geometric flaws are entered into the simulations. The simulation does not account for the effects of the rise in material yield strength brought on by residual stresses or cold bending.
4.1. Finite Element Model
To model and analyze the test specimen, the Part module of ABAQUS was used, and the geometric model was created based on the actual size of each specimen.
The shell element S4R of the finite element model was adopted to simulate the specimen. The ultimate load deviation of the specimen obtained by simulation analysis is less than 1% when the grid size is not greater than 10 mm. The grid size of the two crimped groove steel beams is 10 mm to ensure the necessary calculation accuracy, while the grid size of the square tube and cover plate is 20 mm because they are not the primary test objects.
The support being tested is a straightforward support with a fixed hinge support on one end and a sliding hinge support on the other. Two reference points are established at the connector’s bottom center point at the supports at both ends, and rigid constraints are applied to the connector’s bottom and reference points. The displacement is constrained in the X, Y, and Z directions at one end and the X and Y directions at the other, where X is the specimen’s width direction, Y is its vertical direction, and Z is its length direction. Rigid constraints are applied to the reference point established by the center point and upper end face of the connector at the loading point. The displacement is applied through the reference point in the finite element model.
4.2. Material Properties and Initial Geometric Imperfections
The two-stage stress–strain model of stainless steel proposed by Gardner [16] is used in the finite element analysis. The measured results from the tensile test of the specimen’s material properties are used for each parameter in this finite element analysis. Additionally, real stress and strain input into ABAQUS must be converted from engineering stress and strain using the conversion formula shown in Equation (1).
In the finite element simulation, the impact of initial geometric imperfections is taken into account. The first buckling mode of the model is extracted using eigenvalue buckling analysis, and the initial flaws are then added to the model for nonlinear analysis by multiplying this buckling mode by a coefficient. The actual value of the initial defect, as measured by various specimens before the test, determines the multiplied coefficient.
4.3. Verification of the Finite Element Model
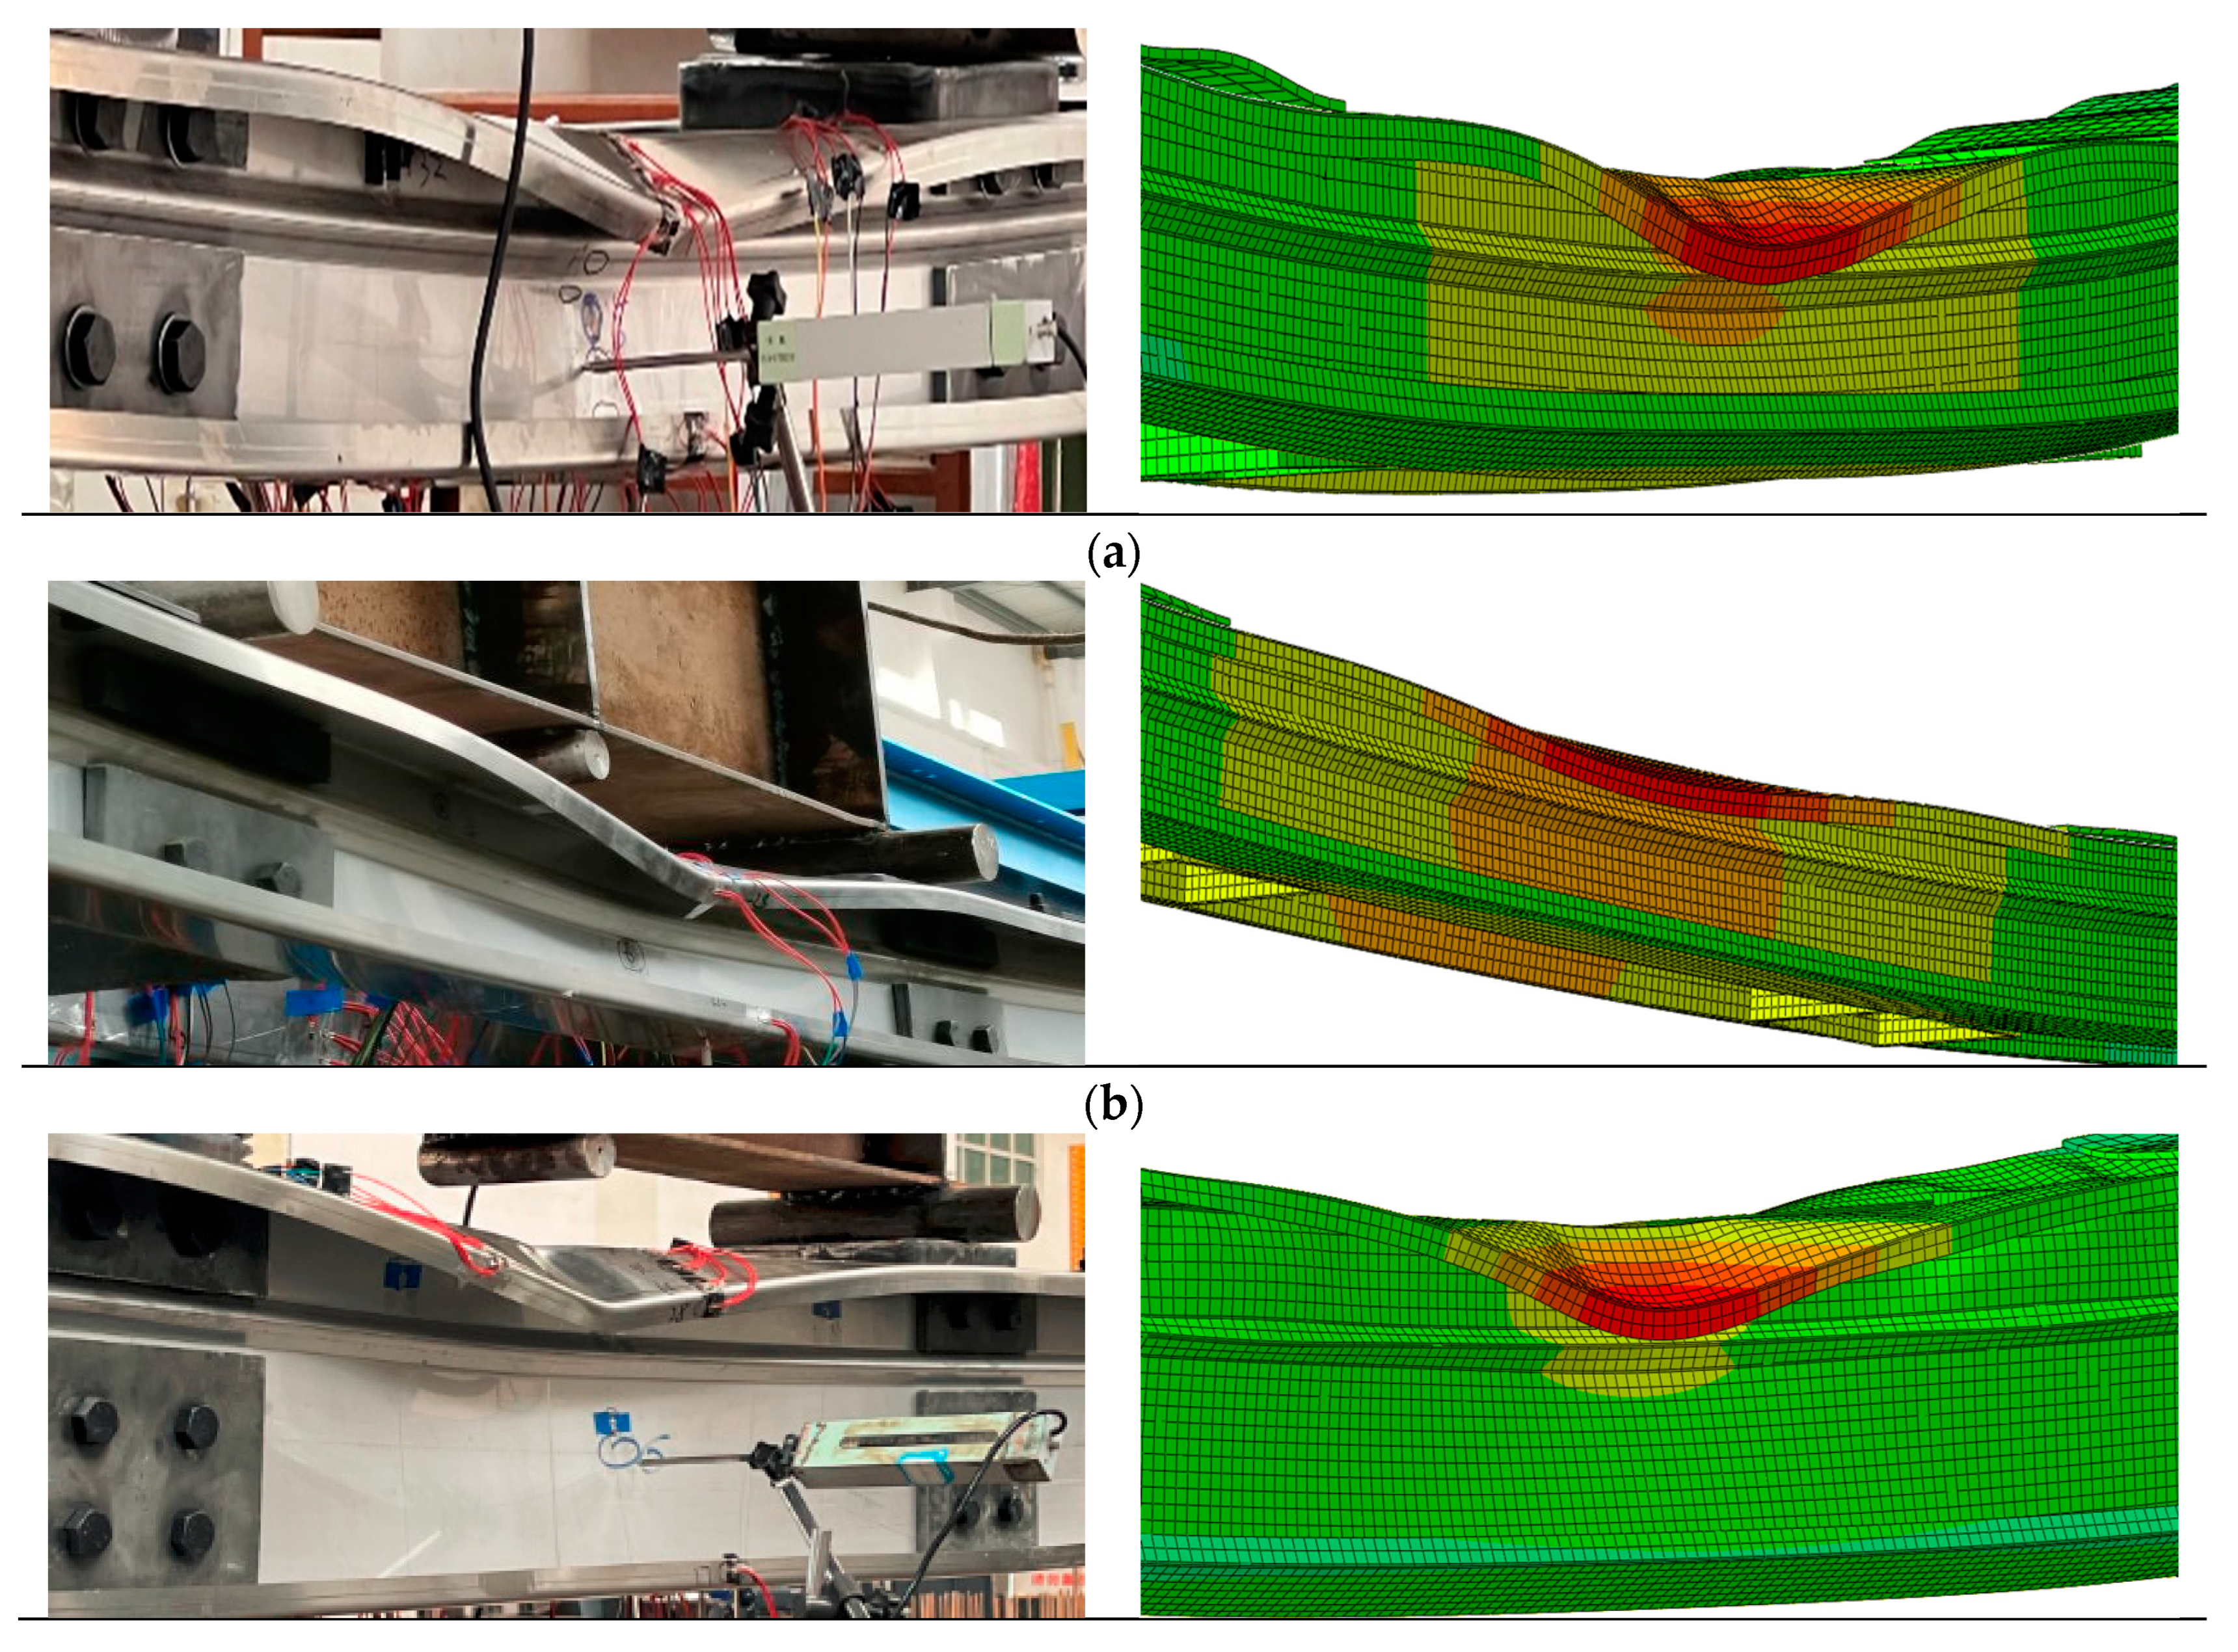
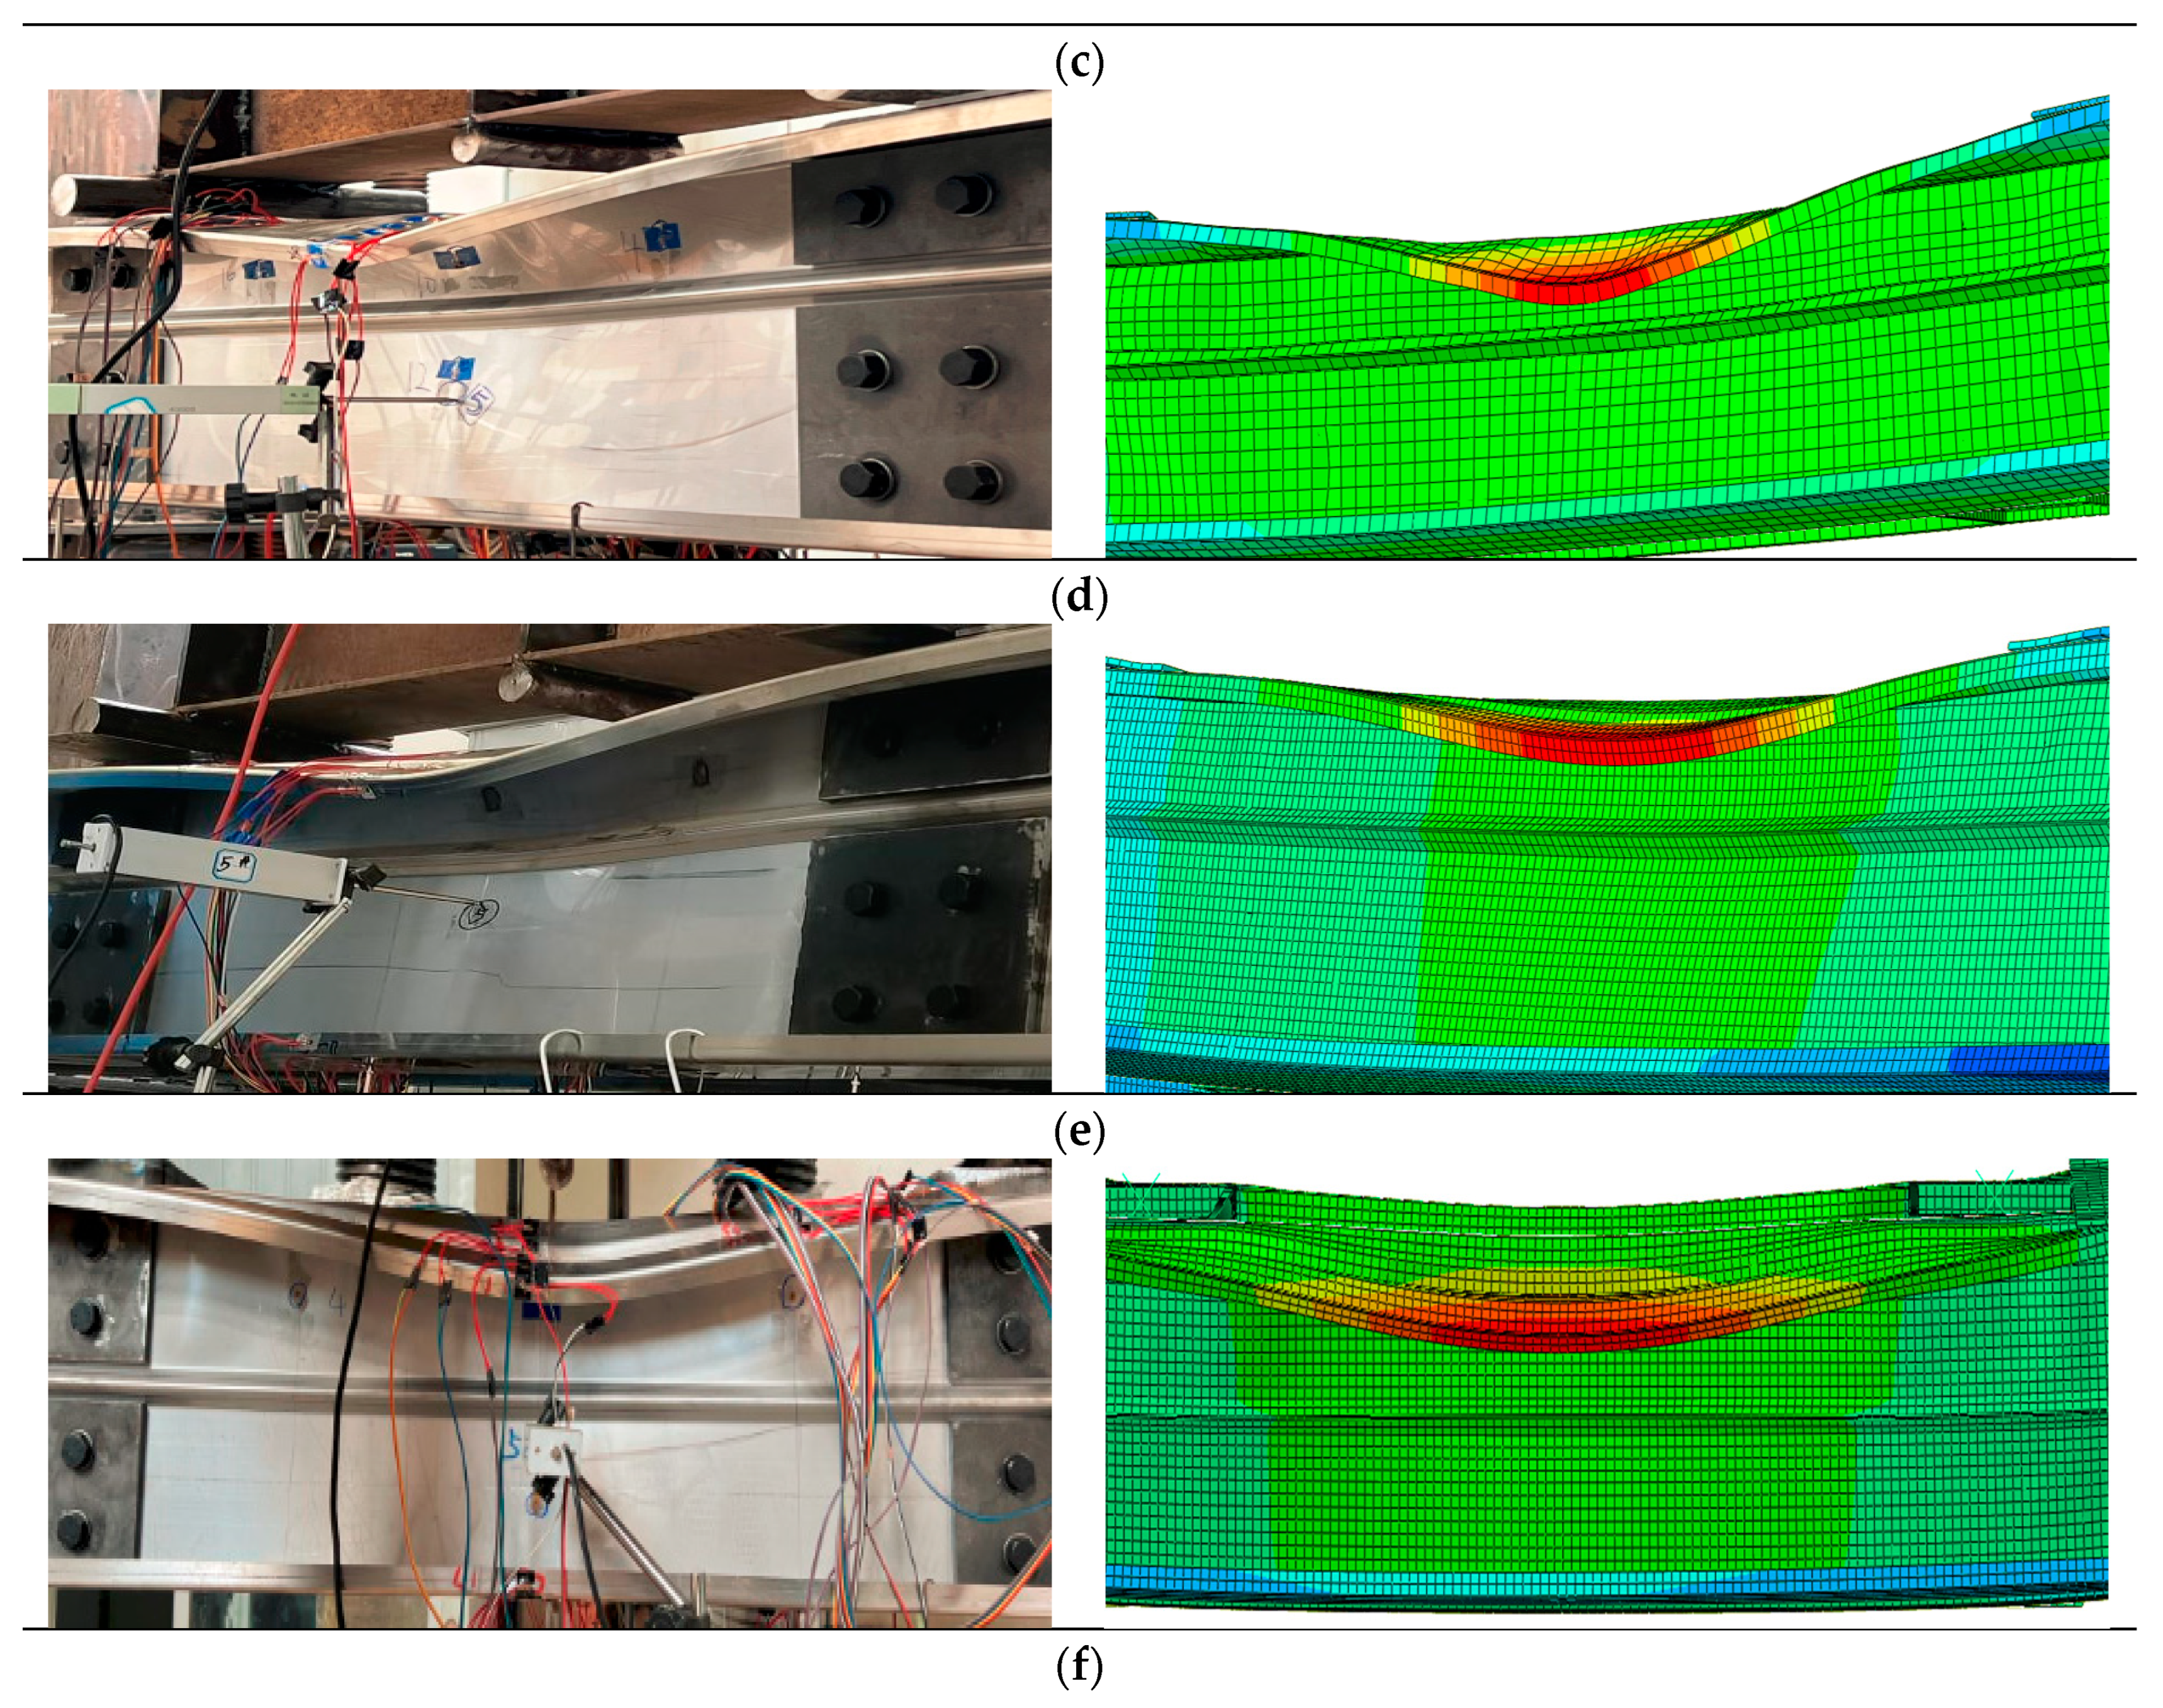
Table 4 compares the tested bending load capacity and failure mode with the finite element simulation results. The results demonstrate that the bending load capacity of the specimen obtained from the finite element simulation and the test results are in good agreement, and the difference between the two is less than 5%. The average value of the ratio between the results of the numerical simulation and the test results of the specimen’s bending capacity is 0.963, and the standard deviation is 0.022. The results also indicate that the failure mode obtained from the finite element simulation is consistent with the test results, as shown in Figure 13. It can be seen that the results of the finite element simulation accurately reflect the test, and the usage of the finite element model for the analysis of stainless steel bending members with V-stiffened lipped channel sections shows high accuracy. On this basis, many finite element parametric analysis studies of such components can be carried out.
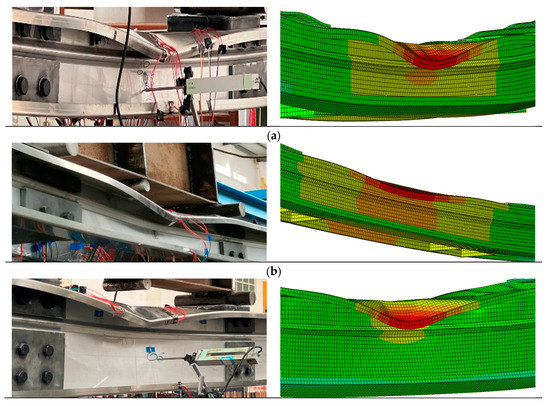
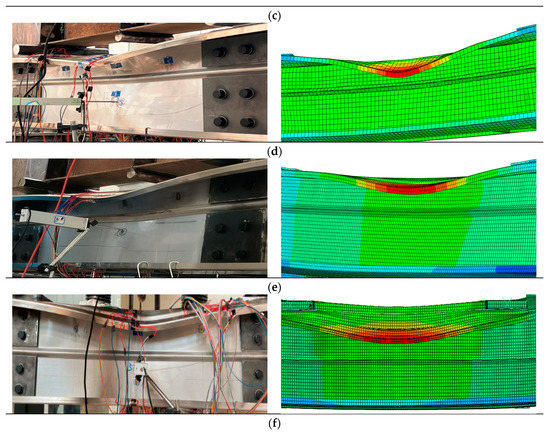
Figure 13.
Failure mode comparison for (a) SP-1 to (f) SP-6. (a) SP-1, (b) SP-2, (c) SP-3, (d) SP-4, (e) SP-5, (f) SP-6.
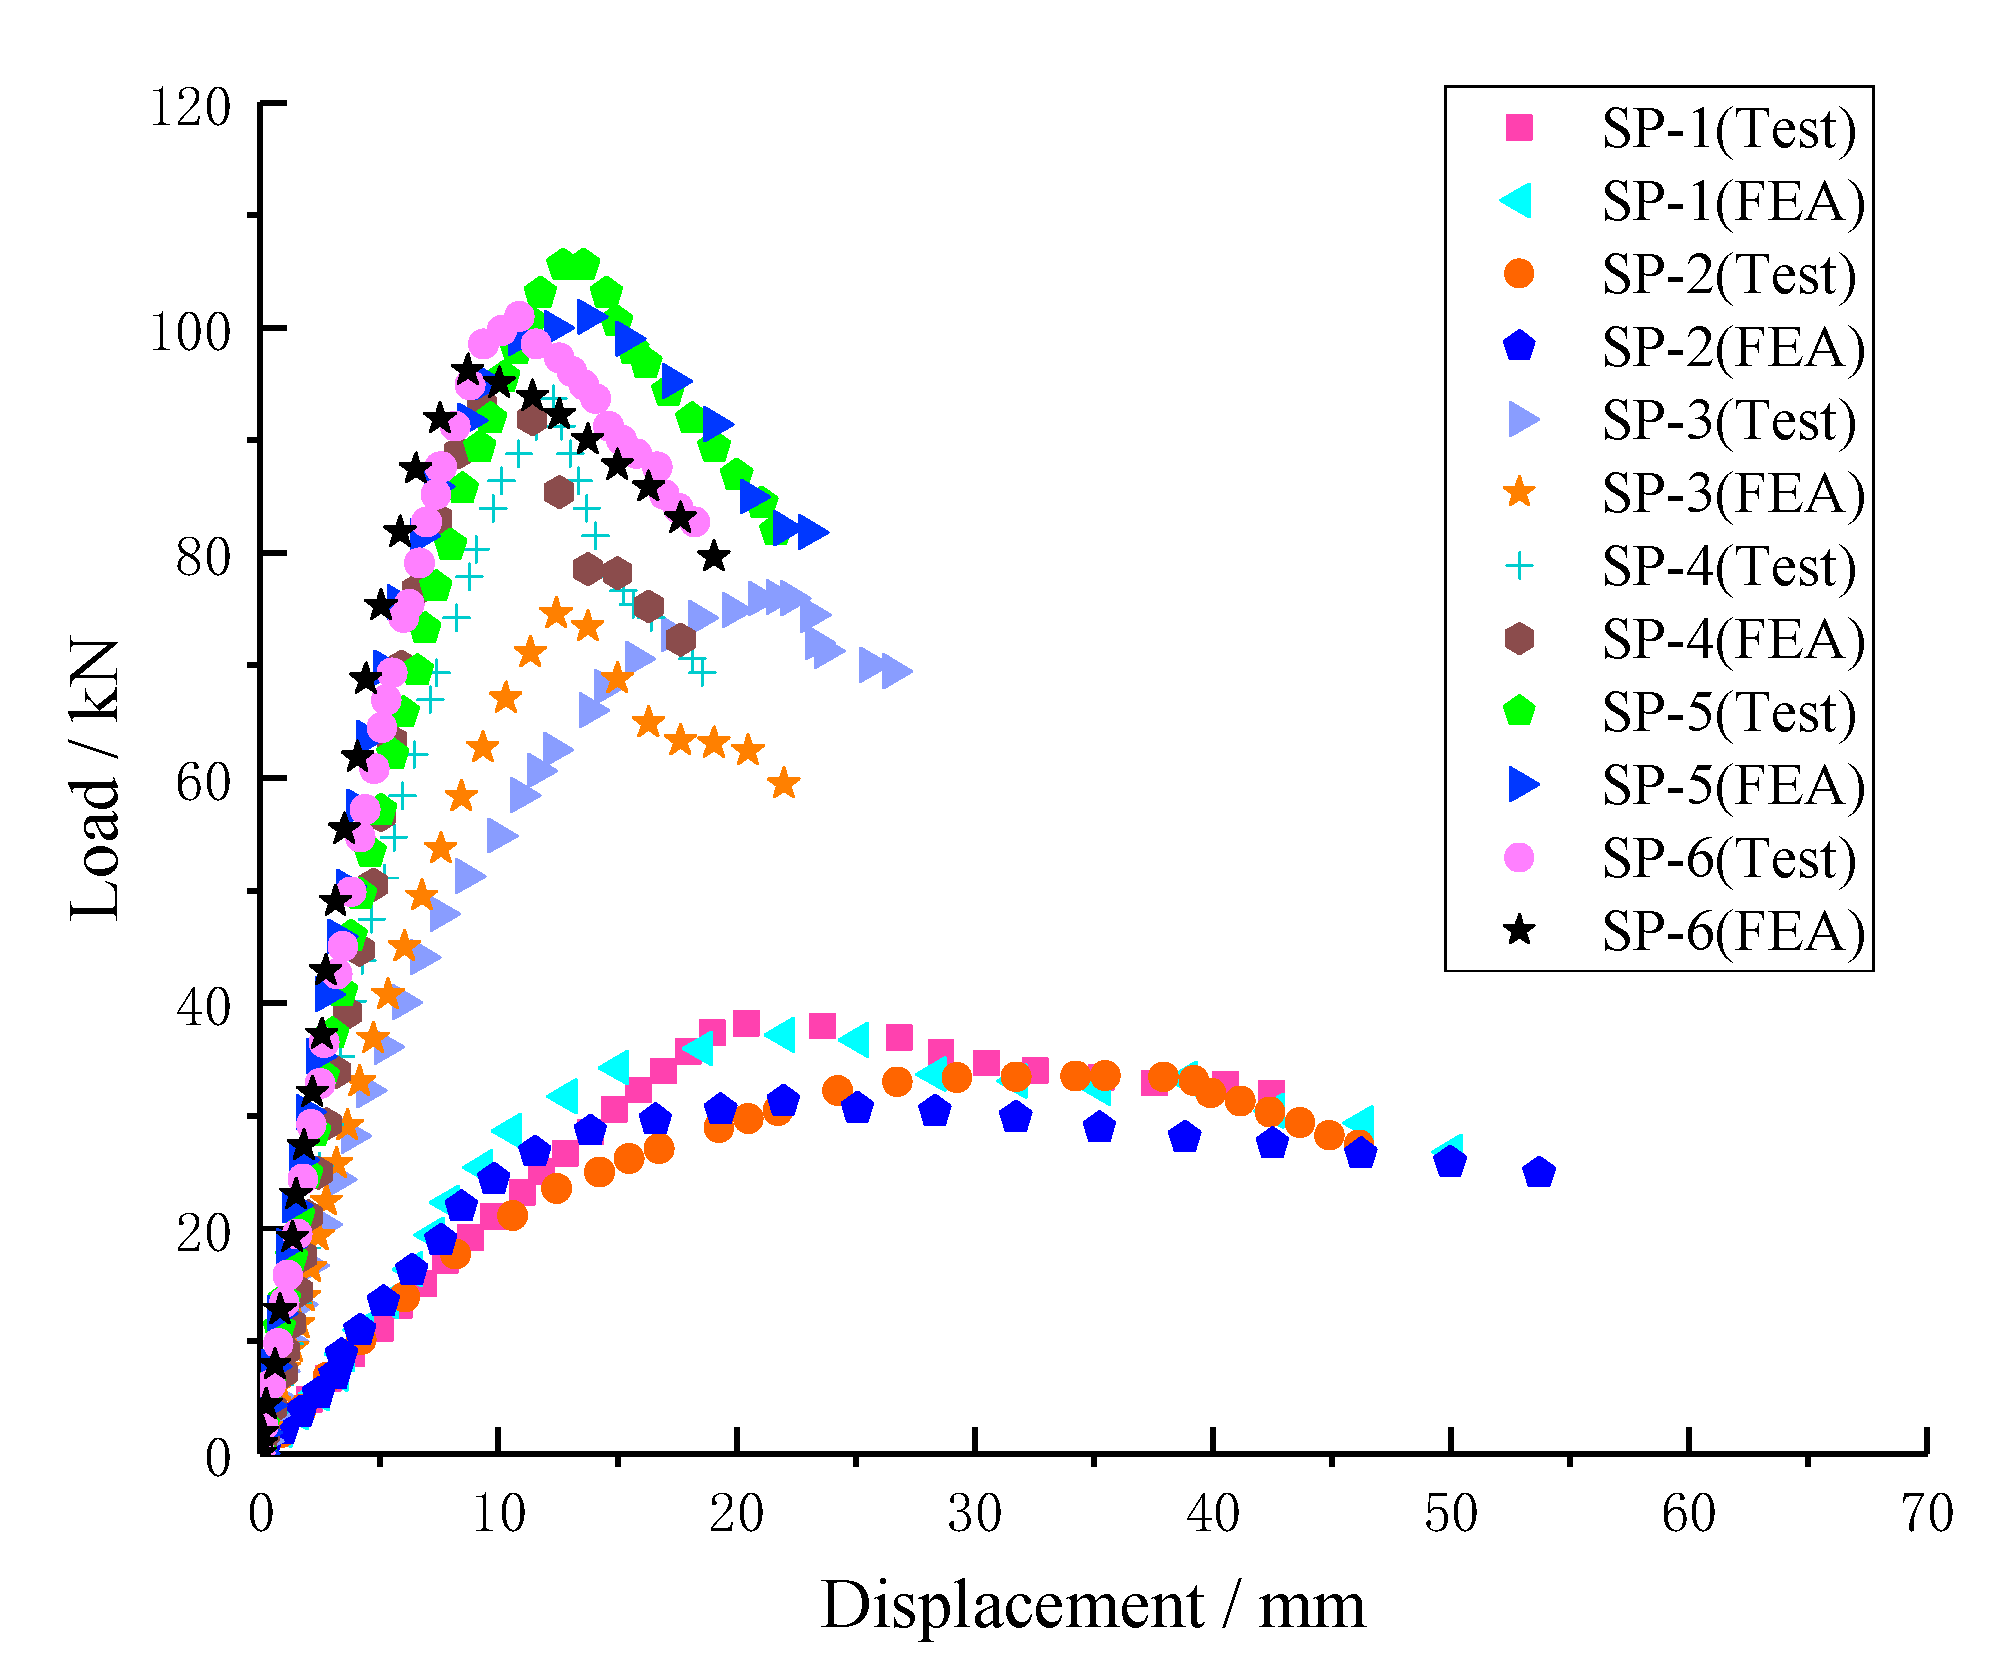
The load-span displacement curves of test and numerical simulation results are contrasted in order to compare the evolution of specimen deformation under load, as shown in Figure 14. The test results for all specimens are in good agreement with the outcomes of the numerical simulation, based on the curve change trend. The test results of the rising section of the bearing capacity curve are lower than the finite element simulation results, indicating that the stiffness of the specimen tested is smaller. The main reason is as follows: in the finite element analysis model, the whole section of the lower edge at the support rectangular tube is confined to the rigid region; in the test, the rectangular tube is placed on the round bar, and the constraint at the support is weaker, so the actual stiffness of the finite element simulation specimen is larger.
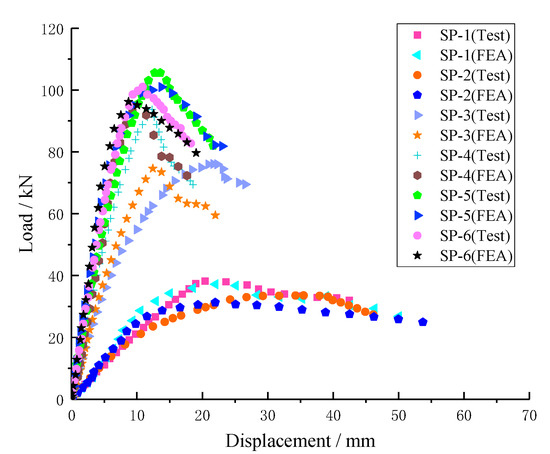
Figure 14.
The comparison of the load-span displacement curves between the finite element results and the test results.
5. Verification Based on Direct Strength Method
The direct strength method was first proposed by Schafer et al. [17] and later improved in Reference [18]. The North American specification (AISI-S100-16) [19] and the Australian/New Zealand specification (AS/NZS 4600: 2018) [20] both adopt this method. Martins [21] calculated the locally distortion-related buckling capacity of carbon steel and high-strength steel lipped section beams using the direct strength method. According to Liu et al. [1], the local–distortional interaction buckling capacity of stainless steel lipped C-beams was underestimated by the current calculation method for carbon steel and high-strength steel lipped C-beams. In this study, the test results are verified using a calculation method of local–distortional interaction buckling of stainless steel C-beams based on Liu’s direct strength method in Equation (2).
where, MnDL-SS is local—distortional interaction buckling capacity, My is edge yield bending moment, MnL is local buckling capacity, Mcrl is critical moment of elastic local buckling, λL is local buckling slenderness ratio, MnD is distortional buckling capacity, Mcrd is critical moment of elastic distortional buckling, λD is distortional buckling slenderness ratio, λDL and λLD are local—distortional interaction buckling slenderness ratios.
It can be seen in Table 5 that the relevant parameters were calculated using Schafer’s finite strip program CUFSM [22], and that the maximum deviation between specimen SP-6 and Equation (2) was 14.5%, with an average deviation value of 9.47%. The flexural bearing capacity of the specimen in this study can thus be predicted using this method.

Table 5.
Comparison between test results and the direct strength method results.
6. Conclusions
Through the experimental and numerical analysis of six groups of stainless steel V-stiffened lipped channel beams with varying stiffening sizes, web heights, and stiffening positions, the following conclusions were reached:
- In this study, the cross-sectional V-stiffeners improve distortional buckling while also increasing steel utilization. The flexural bearing capacity of the specimen will increase with an increase in the web heights of each specimen under the same stiffening form when the other sectional parameters are fixed. The application of the direct strength method (DSM) requires the identification of the buckling failure modes. Specifically, the V-stiffeners’ web compression zone at 1/3 height near the compressed flange and the V-stiffeners at the middle of the compressed flange can be used more effectively to increase the bending capacity of the specimen.
- The finite element simulation and experimental results show good agreement, which can provide a strong backing for the analysis of a number of finite element parameters for such V-stiffened lipped channel stainless steel bending members.
- In this study, it was found that the local–distortional interaction buckling failure mode predominated in the V-stiffened lipped channel sections. For the vast majority of the V-stiffened lipped channel sections that are currently available, these results might not be sufficient to offer a conclusive guide for using the DSM. The findings of this study, however, can be used as a starting point for recommendations regarding the application of the DSM for the design of such cross-sections.
Author Contributions
Conceptualization, Z.T.; Funding acquisition, Z.T.; Investigation, Z.T. and Z.W.; Methodology, S.-E.H.; Project administration, J.Z. and Z.W.; Resources, C.Y. and Z.W.; Software, S.-E.H. and J.Z.; Validation, S.-E.H.; Writing—original draft, S.-E.H.; Writing—review & editing, W.A.G. Writing—review & editing, and Resources M.M.H. All authors have read and agreed to the published version of the manuscript.
Funding
This research is sponsored by the Key Research and Development programs (Key R&D programs) at the Department of Science and Technology in Yunnan province and the Yunnan Earthquake Engineering Research Institute (YEERI) (grant nos. 202003AC100001).
Data Availability Statement
The data presented in this research are available on request from the corresponding authors.
Conflicts of Interest
This manuscript, based on independent research, has been conceptually prepared and written by the authors. The authors report no declarations of interest and the views expressed in this manuscript are solely those of the authors.
References
- Liu, M.; Wu, Y.; Fan, S.; Wu, Q.; Liang, D. Local-distortional interaction buckling of stainless steel lipped C-section beams. J. Constr. Steel Res. 2023, 201, 107731. [Google Scholar] [CrossRef]
- Kalyanaraman, V. Local buckling of cold-formed steel members. ASCE J. Struct. Div. 1979, 105, 813–828. [Google Scholar] [CrossRef]
- Papazian, R.P.; Schuster, R.M.; Sommerstein, M. Multiple stiffened deck profiles. In Proceedings of the Twelfth International Specialty Conference on Cold-Formed Steel Structures: Recent Research and Developments in Cold-Formed Steel Design and Construction, St. Louis, MO, USA, 18–19 October 1994. [Google Scholar]
- Schafer, B.W.; Peköz, T. The behavior and design of longitudinally stiffened thin-walled compression elements. Thin-Walled Struct. 1997, 27, 65–78. [Google Scholar] [CrossRef]
- Young, B.; Chen, J. Design of cold-formed steel built-up closed sections with intermediate stiffeners. J. Struct. Eng.-Asce 2008, 134, 727–737. [Google Scholar] [CrossRef]
- Zhang, J.; Young, B. Compression tests of cold-formed steel I-shaped open sections with edge and web stiffeners. Thin-Walled Struct. 2012, 52, 1–11. [Google Scholar] [CrossRef]
- Nguyen, V.B.; Pham, C.H.; Cartwright, B.; English, M.A. Design of new cold rolled purlins by experimental testing and Direct Strength Method. Thin-Walled Struct. 2017, 118, 105–112. [Google Scholar] [CrossRef]
- Kwon, Y.B.; Kim, B.S.; Hancock, G.J. Compression tests of high strength cold-formed steel channels with buckling interaction. J. Constr. Steel Res. 2009, 65, 278–289. [Google Scholar] [CrossRef]
- Yang, D.; Hancock, G.J. Compression Tests of High Strength Steel Channel Columns with Interaction between Local and Distortional Buckling. J. Struct. Eng. 2004, 130, 1954–1963. [Google Scholar] [CrossRef]
- Wu, Y.; Fan, S.; Du, L.; Wu, Q. Research on distortional buckling capacity of stainless steel lipped C-section beams. Thin-Walled Struct. 2021, 169, 108453. [Google Scholar] [CrossRef]
- Standards Press of China. Tensile Testing of Metallic Materials-Part 1: Test Methods at Room Temperature; Standards Press of China: Beijing, China, 2010. [Google Scholar]
- Standards Press of China. Steel and Steel Products-Location and Preparation of Samples and Test Pieces for Mechanical Testing; Standards Press of China: BeiJing, China, 2018. [Google Scholar]
- Fan, S.; Chen, M.; Li, S.; Ding, Z.; Shu, G.; Zheng, B. Stainless steel lipped C-section beams: Numerical modelling and development of design rules. J. Constr. Steel Res. 2019, 152, 29–41. [Google Scholar] [CrossRef]
- Wang, H.; Zhang, Y. Experimental and numerical investigation on cold-formed steel C-section flexural members. J. Constr. Steel Res. 2009, 65, 1225–1235. [Google Scholar] [CrossRef]
- Wang, C.; Zhang, Z.; Zhao, D.; Liu, Q. Compression tests and numerical analysis of web-stiffened channels with complex edge stiffeners. J. Constr. Steel Res. 2016, 116, 29–39. [Google Scholar] [CrossRef]
- Gardner, L. A New Approach to Structural Stainless Steel Design. Ph.D. Thesis, Imperial College London, London, UK, 2002. [Google Scholar]
- Schafer, B.W.; Peköz, T. Direct strength prediction of cold-formed steel members using numerical elastic buckling solutions. In Proceedings of the Fourteenth International Specialty Conference on Cold-Formed Steel Structures: Recent Research and Developments in Cold-Formed Steel Design and Construction, St. Louis, MO, USA, 15–16 October 1998. [Google Scholar]
- Schafer, B.W. Local, Distortional, and Euler Buckling of Thin-Walled Columns. J. Struct. Eng. 2002, 128, 289–299. [Google Scholar] [CrossRef]
- AISI S100-16; North American Specification for the Design of Cold-Formed Steel Structural Members. American Iron and Steel Institute: Washington, DC, USA, 2016.
- AS/NZS 4600:2018; Australian/New Zealand Standard Cold-Formed Steel Structures. SAI Global Limited: Sydney, Australia; Standards New Zealand: Wellington, Australia, 2018.
- Martins, A.D.; Camotim, D.; Dinis, P.B. Local-distortional interaction in cold-formed steel beams: Behaviour, strength and DSM design. Thin-Walled Struct. 2017, 119, 879–901. [Google Scholar] [CrossRef]
- CUFSM, Version 5.04. 2020. Available online: http://www.ce.jhu.edu/bschafer/cufsm/ (accessed on 6 April 2020).
Disclaimer/Publisher’s Note: The statements, opinions and data contained in all publications are solely those of the individual author(s) and contributor(s) and not of MDPI and/or the editor(s). MDPI and/or the editor(s) disclaim responsibility for any injury to people or property resulting from any ideas, methods, instructions or products referred to in the content. |
© 2023 by the authors. Licensee MDPI, Basel, Switzerland. This article is an open access article distributed under the terms and conditions of the Creative Commons Attribution (CC BY) license (https://creativecommons.org/licenses/by/4.0/).

