Abstract
In the present work, inclusion analyses were carried out for inclusions in the tundish samples and in the 28 m transition slabs produced during the ladle exchange of heats A and B. At the beginning of heat B steel casting, the 12th meter of the casting slabs was in the position of the mold meniscus. The number of densities of the inclusions containing TiN and the inclusions containing Al2O3+TiN increased significantly from the 12th meter to the 22nd meter, while the number densities of the inclusions containing Al2O3 markedly increased from the 13th meter to the 20th meter. Therefore, the length of the transition slabs whose cleanliness was seriously reduced was about 10 m starting from the beginning of heat B steel casting. It was deduced that the contamination of the transition slabs could be caused by the liquid steel exposure in the tundish, the inflow of ladle filling sand of the next heat, or the entrainment of the tundish flux due to the fluctuation of the tundish liquid level at the beginning of heat B steel casting.
1. Introduction
The quality requirements for automobiles, which are as the second largest high-end consumer good after a house in a family, are increasingly stringent, so that the automotive exposed panel has the highest surface quality requirements in steel products. The surface defects may be generated in steelmaking, continuous casting, hot rolling, cold rolling, and hot galvanizing of the production processes of automotive exposed panels, among which surface defects generated in the steelmaking and continuous casting processes (hereinafter referred to as steelmaking defects) usually account for more than 70%. The generating mechanism of the steelmaking defects is complex and the steelmaking defects are intertwined with the defects in the later processes, which makes them difficult to be identified, judged, and improved upon in the steelmaking process.
The steelmaking defects mainly include defects of entrainment of mold powders, inclusions, and bubbles. In view of the fact that the steelmaking defects on the surface of automotive exposed panels are all large in size, these three types of steelmaking defects are called defects of large inclusions in the present paper. These large inclusions may be formed from deoxidation that aggregate together, or as secondary oxidation products of molten steel during continuous casting, which are captured by the primary solidification shell of the slab. They may also be the particles peeled off from the inner wall of the submerged entry nozzle, or the inclusions adsorbed by argon bubbles which are blown into the molten steel during the continuous casting process [1]. It is also possible that they are the entrainment of mold powders due to the abnormal fluctuation of the mold level. In particular, inclusion formation in the unsteady state stage of continuous casting, such as the beginning of continuous casting, the ladle exchange, and the end of continuous casting, it is more likely to lead to large inclusion defects. Therefore, at present, the control of large inclusions in the unsteady state stage of continuous casting is a serious problem in producing automotive exposed panels with a satisfactory surface quality for steelmaking plants throughout the world.
Therefore, unsteady state continuous casting slabs are usually degraded during the production of automotive exposed panels. Since it is difficult to quantitatively evaluate the surface quality of a range of continuous casting slabs by monitoring the various unsteady state continuous casting operating factors, missed judgments or wrong judgments may occur when the unsteady state continuous casting slabs are degraded [2], which leads to the increase of the degradation ratio of continuous casting slabs in the production of automotive exposed panels, decrease in the product yield, and increase in the production cost. Therefore, it is necessary to study the cleanliness of unsteady state continuous casting slabs, so as to accurately evaluate the length of unsteady state continuous casting slabs which should be degraded.
As for studying the cleanliness of the unsteady state continuous casting slabs of ultra-low-carbon steel for automotive exposed panels, Zhang and Wang et al. [3] reported that in the unsteady state casting process, the casting speed Vc varied greatly, which led to serious fluctuations of the mold surface level and the decrease in the cleanliness of the unsteady continuous casting slabs. Therefore, they tested decreasing and increasing the casting speed. After sampling the unsteady state continuous casting slabs of IF steel when the casting speed was decreased or increased, they found that at the higher casting speed of 1.4 m/min, the content of non-metallic inclusions significantly increased even if the casting speed was slightly changed. Therefore, at higher casting speeds, changing the casting speed or adopt a lower changing rate should be avoided. Deng and Ji et al. [4] studied the surface cleanliness at 0.5 mm from the surface of the steady and the unsteady state continuous casting slabs of IF steel, which were at the beginning of casting, the ladle exchange, the nozzle exchange, and the end of casting. It was found that among the four kinds of unsteady continuous casting slabs, the surface cleanliness of the slab at the beginning of casting was the worst. The number densities of inclusions increased to 2.5 times that of the normal slab during ladle exchange, and the number densities of inclusions in the casting slab at the nozzle exchange was slightly larger than that of the normal slab. The number densities of inclusions at the end of casting were close to the average value of the normal slab. Cui Heng et al. [2] studied the change in cleanliness of the head slab of IF steel by means of analysis of the nitrogen and oxygen compositions, electrolysis analysis of large-sized samples, scanning electron microscope analysis, and other methods, and made a comparison with the cleanliness of the normal slab. It was found that the content of large inclusions in the head slab was obviously higher than that in the normal slab, and the content of large inclusions in the head slab decreased along the casting direction. After 4.4 m, the content of large inclusions was close to the value of the normal slab. The content of large inclusions in the slab was not uniform in the thickness direction, and the content in the inner arc side was obviously higher than that of the outer arc side. The large inclusions were mainly generated from the entrainment of mold powders and tundish flux, secondary oxidation products, and ladle filling sands.
For the other steels which are not ultra-low-carbon, the cleanliness of unsteady state continuous casting slabs has also been studied. Ren and Wang et al. [5] took a full-section sample of the cast billet during the steady state and ladle exchange process for producing the Al-killed medium-carbon steel, and used the inclusion automatic analysis system (ASPEX 1020) to statistically analyze the size, composition, and morphology of the inclusions with sizes larger than 0.6 μm in the two sections. It was found that because the amounts of the entrained slag and the air absorbed in the molten steel in the ladle exchange process were more than those in the steady state, the number of inclusions larger than 20 μm, sulfide inclusions, and oxide inclusions in the ladle exchange process were more than those in the steady state. In steady state billet, oxide inclusions do not accumulate in the center of billet, while in the unsteady state billet ladle exchange process, there are more inclusions in the center and inner arc side. Xue Wenhui et al. [6] used electrolysis of large-sized samples, scanning electron microscopy, and other analysis methods to compare and analyze the cleanliness of five kinds of unsteady state continuous casting slabs of low-carbon steel, including the head slab, final casting slab, slabs of changing ladles (transition slabs), slab of changing slags, and slab of opening pouring, and compared them with the steady state casting continuous slab. It was found that the inclusion content of the slab of opening pouring was the largest, which was more than 10 times that of steady state casting slabs. The content of inclusions in head slab and transition slabs were relatively high, and the content of inclusions in final casting slabs was relatively low. There was no obvious difference between the content of inclusions in the slab of changing slags and the steady state casting slab. However, the inclusions in the head slab, the transition slabs, and the slab of opening pouring were mainly Al2O3, while the inclusions in the final casting slab and the transition slabs were mainly calcium aluminate or calcium silicate aluminate, indicating that the slag entrainment phenomenon exists in the two processes.
To the best of our knowledge, there are no previous reports using the automatic inclusion analysis system to study the cleanliness of IF steel transition slabs with the length completely covering the casting slab of the two consecutive heats. In addition, although some work has been done on the cleanliness of transition billet, they mainly focus on steels that are not ultra-low-carbon. Therefore, this paper focuses on inclusion analysis to study the cleanliness of transition slabs of ultra-low-carbon IF steel used for automotive exposed panels. In view of the automotive exposed panels of ladles A and B produced by the slab continuous caster with a mold thickness of 250 mm and mold width of 1750 mm in a steel mill, the molten steel in the tundish and the consecutive casting slabs of ladle exchange were sampled, and the variation law of inclusions in the transition slabs with a length of 28 m was studied. The morphology, quantity, size, composition, and distribution of inclusions with sizes larger than 0.2 μm and 5 μm in the tundish steel and transition slabs were analyzed by the inclusion automatic analysis system. The characteristics of the inclusions in the transition slabs were studied by combining the results of thermodynamic calculations. The main reasons for the decrease in the cleanliness of the transition slabs were expounded.
2. Research Method
The steelmaking and continuous casting process in the steel mill to produce IF steel for automotive exposed panels consists of the pretreatment of hot metal, BOF, RH secondary refining, and slab continuous casting. The transition slabs of two consecutive steel heats A and B were selected for this study. The weight of steel in a ladle was 300 tons and 56 tons in the tundish; the width of the continuous casting mold was 1750 mm and the thickness was 250 mm. The casting speed of heat A was 1.0 m/min and the superheat was 28 °C. The casting speed of heat B was 0.9 m/min and the superheat was 30 °C.
The continuous casting condition for the transition slabs was as follows: the tip of nozzle is submerged when the second ladle(B) is opened; the minimum level of steel during ladle exchange is 36 tons; the minimum level of molten steel is not maintained, and the liquid level will rise rapidly after pouring of the next ladle(B); the minimum residence time during ladle exchange is 120 s; the number of strands is two; the refilling steel throughput of the second ladle(B) is 10 ton/min; and the compositions of the tundish slag are as shown in Table 1.

Table 1.
Chemical compositions of tundish slag (wt%).
Figure 1 is a schematic diagram of the transition slabs of two successive heats A and B. As shown in the dark blue cuboids in Figure 1, the continuous casting slab samples with a size of 110 mm × 110 mm × 250 mm were taken every meter at 1/4 of the width of the slab, and 28 samples of continuous casting slabs were taken from the three transition slabs with a total length of 28 m. At the beginning of starting heat B steel casting, the 12th meter position of the slab was just in the position of the meniscus of the continuous casting mold. Therefore, 1#~11# slab samples belong to heat A steel, and 12#~28# samples belong to heat B steel.
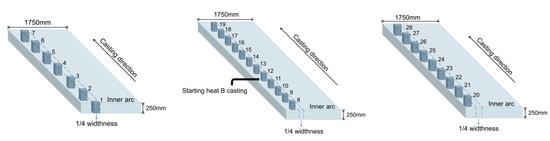
Figure 1.
Schematic diagram of sampling of continuous casting slabs for two successive heats of steel.
Then, a metallographic sample with a size of 15 mm × 15 mm × 10 mm was taken at the 1/4 thickness of the inner arc side of each slab sample. These samples were made into metallographic samples after hot insert prototyping, automatic grinding, ultrasonic cleaning, and other steps. The composition, quantity, particle size, and distribution of inclusions were statistically analyzed by the inclusion automatic analysis system (IAAS). The automatic inclusion analysis system is composed of an EVO18 scanning electron microscope and energy dispersive spectrometer (SEM–EDS), assisted by the inclusion analysis software feature (Oxford Instruments, Abingdon, Oxfordshire, UK). In addition to the basic function of a conventional scanning electron microscope, the equipment also has the function of automatically detecting and analyzing the quantity, size, composition, and other characteristics of inclusions. An optical emission spectrometer (SPECTROMAXx AMETEK Inc. Kleve, Germany) and a nitrogen and oxygen analyzer (NOH836 LECO INSTRUMENTS HK LIMITED, Kowloon, Hong Kong) were used to determine the chemical compositions of the steel samples. Finally, the FactSage8.1 thermodynamic software combined with the Equilibrate B module and FToxide and FSstel databases were used to calculate the types and amounts of precipitated inclusions in steel at different temperatures according to the chemical compositions of molten steel in the tundish. Since the limit size of inclusions in steel samples that can be identified with a SEM is 0.2 μm, the inclusions sizes larger than 0.2 μm were analyzed first. In addition, because it is usually the large-sized inclusions that affect the surface quality of the automotive exposed panel, the inclusions with sizes larger than 5 μm were further analyzed in this paper.
3. Analysis Results and Discussion
3.1. Thermodynamic Calculation
The continuous casting slabs of two successive heats A and B were selected, and the chemical compositions of the steels in the tundish of the two heats are shown in Table 2. The contents of C, Mn, P, Al, O, N, and Ti in heat B was slightly higher than those in heat A, and the Si content was slightly lower than that in heat A, but there was no significant difference in the S content. The Ti contents of the two heats were relatively high. The Ti content in heat A was about 0.0476%, and about 0.0503% in heat B.
Table 2.
Chemical compositions of steels (wt%).
The FactSage8.1 thermodynamic software was used to calculate the evolution of inclusions in heat A and B at different temperatures, as shown in Figure 2. It can be seen that the inclusions in the steels of the two heats were mainly TiS, Al2O3, TiN, and MnS, and the contents of the inclusions were (from highest to lowest): TiS, TiN, Al2O3, and MnS.
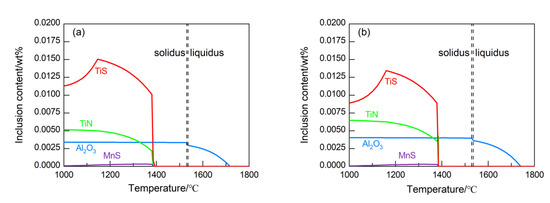
Figure 2.
Evolution of inclusions during solidification calculated with FactSage8.1. (a) Heat A; (b) Heat B.
For heat A steel, Al2O3 inclusions were first generated in the liquid steel at 1700 °C. When the temperature dropped to 1385 °C, a large number of TiS and MnS inclusions began to precipitate in the solid phase. Then, when the temperature further dropped to 1380 °C, TiN inclusions began to precipitate in the solid phase. For heat B steel, Al2O3 inclusions were first generated in the liquid phase at 1740 °C. When the temperature dropped to 1384.6 °C, TiN inclusions were precipitated first in the solid phase, and then when the temperature further dropped to 1380 °C, TiS and MnS inclusions were precipitated.
Compared with heat A, the content of TiS in heat B was lower, the contents of TiN and Al2O3 were slightly higher, and the content of the MnS inclusions was not different; this is because the S content in heat B was lower than that in heat A, and the contents of N and O in heat B were higher than those in heat A.
3.2. Analysis Results of Inclusions in Tundish Samples
Automatic analysis of inclusions was carried out on Tundish (TD) process steel samples of heats A and B. The total number densities and average sizes of all inclusions are shown in Table 3. For inclusions with sizes larger than 0.2 μm, the number densities of the TD steel sample in heat B were larger than that in heat A, while the average sizes of inclusions were smaller than that in heat A. For inclusions with sizes larger than 5 μm, the number densities in the TD steel sample in heat B were much lower than that in heat A, while the average sizes of the inclusions were slightly larger than that in heat A.
Table 3.
Statistical results of inclusions in TD samples.
3.2.1. Analysis Results of Inclusions with Sizes Larger than 0.2 μm
Combined with SEM photos and automatic analysis results of inclusions with sizes larger than 0.2 μm, it was found that the main inclusions in the TD steel samples of heats A and B were Al2O3, TiN, TiS, MnS, and their composite inclusions. Figure 3 shows the typical morphologies of inclusions in the TD steel samples of heats A and B. The inclusions in TD samples are mainly spherical, bar, or bulk Al2O3 inclusions, Al2O3+TiS composite inclusions, Al2O3+TiS+MnS composite inclusions, square Al2O3+TiN, Al2O3+TiN+TiS composite inclusions, and a few square TiN inclusions, thin strip TiS, MnS inclusions, etc.
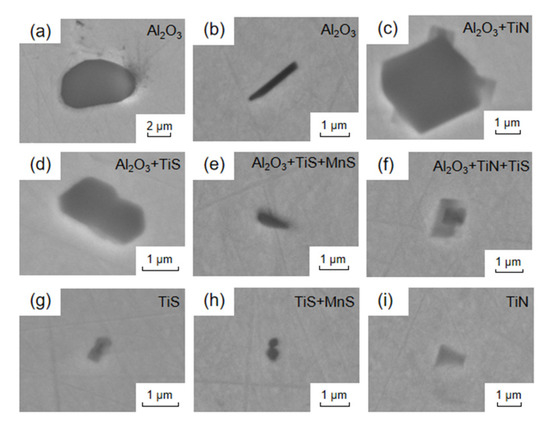
Figure 3.
(a–i) Typical morphologies of inclusions with sizes larger than 0.2 μm in the TD samples of heats A or B.
Figure 4 shows the compositions and size distributions of individual inclusions with sizes larger than 0.2 μm in the TD process of heat A and B. The compositions of the inclusions can be roughly represented by the quaternary phase diagram of Al2O3, TiS, MnS, and TiN. The inclusions in the TD steel samples were mostly close to Al2O3, and mainly concentrated on the Al2O3+TiN and Al2O3+TiS axes, so there are many composite inclusions of Al2O3+TiS and Al2O3+TiN, while the inclusions near MnS are relatively few.
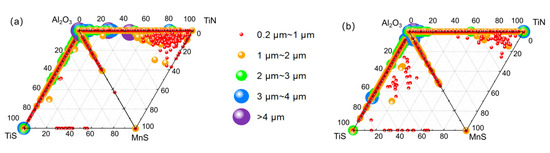
Figure 4.
Compositions and size distributions of individual inclusions with sizes larger than 0.2 μm illustrated in the phase diagrams. (a) TD of heat A; (b) TD of heat B.
Figure 5 illustrates the average number densities and average sizes of various inclusions in the TD steels of the two heats as bar charts. This figure clearly shows the number densities and average sizes of 13 kinds of inclusions in steel samples. It can also be seen that compared with heat B, the number densities and sizes of Al2O3 and its composite inclusions in heat A were smaller and larger. In addition, the number densities of TiN inclusions in the TD steel sample of heat A were smaller than that of heat B, because the N content in molten steel in the TD steel sample of heat A was lower than that in heat B. The average sizes of the TiN and TiS inclusions in the TD steel sample of heat A were almost the same as that of heat B. The average sizes of MnS and TiN+TiS were slightly larger than that of heat B, and the average size of TiS+MnS was slightly smaller, and there are almost no TiN+MnS inclusions in heat A.
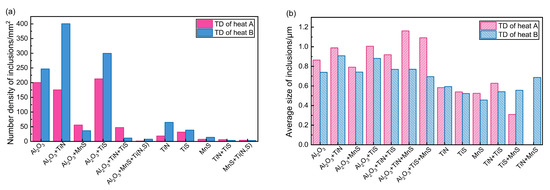
Figure 5.
Comparisons of the average number densities and the average sizes of various inclusions with sizes greater than 0.2 μm between TD steels of heats A and B. (a) Number density; (b) Average size.
3.2.2. Analysis Results of Inclusions with Sizes Larger Than 5 μm
Figure 6 exhibits the typical morphologies and EDS surface scanning results of inclusions with sizes larger than 5 μm in TD steel samples of heats A and B. The results the inclusion automatic analyzer showed that the inclusions with sizes larger than 5 μm in the TD steel samples of heats A and B were mainly Al2O3, and Al2O3-TiOx and Al2O3-CaO-SiO2 composite inclusions. Pure Al2O3 inclusions were generally in the clustered shape, while Al2O3, TiOx, CaO, and SiO2 composite inclusions were generally in a spherical shape. Usually, the content of N in Al2O3-TiOx composite inclusions with sizes larger than 5 μm is very low.
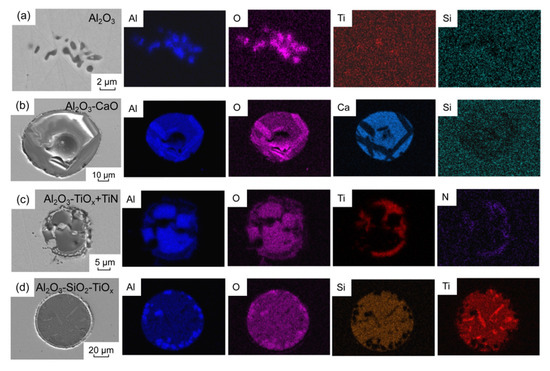
Figure 6.
(a–d) Morphologies and map scanning results of the typical inclusions with sizes larger than 5 μm in the TD samples.
Figure 7 gives the compositions of individual inclusions with sizes larger than 5 μm in the TD process of heats A and B. The compositions of the inclusions can be roughly expressed with the ternary phase diagram of Al2O3, TiOx, and CaO+SiO2. It can be seen that there were few pure TiOx inclusions and the pure CaO+SiO2 inclusions in the TD steel samples, and most of the inclusions were Al2O3 and composite inclusions containing Al2O3.
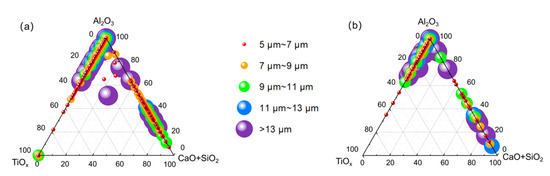
Figure 7.
Compositions of individual inclusions with sizes larger than 5 μm illustrated in the phase diagrams. (a) TD of heat A; (b) TD of heat B.
Figure 8 shows the average number densities and average sizes of various inclusions in the TD steels of the two heats as bar charts. The number densities of all kinds of oxide inclusions in the TD steel sample of heat A were much higher than those of heat B, probably due to more serious secondary oxidation and slag entrainment occurred in the tundish of heat A. The average sizes of the Al2O3 inclusions in the two heats were similar, and the average sizes of Al2O3-TiOx and Al2O3-CaO-SiO2 composite inclusions in the TD steel samples of heat B were larger than those in the heat A.
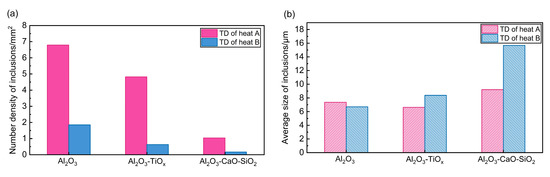
Figure 8.
Comparisons of the average number densities and the average sizes of various inclusions with sizes greater than 5 μm between TD steels of heats A and B. (a) Number density; (b) Average size.
3.3. Observation and Analysis Results of Inclusions with the Sizes Larger than 0.2 μm in the Continuous Casting Slabs
The inclusions with sizes larger than 0.2 μm observed in 28 samples of continuous casting slabs can be divided into four categories: Type TS, Type TN, Type M, and Type A. Figure 9 shows the typical morphologies and EDS map scanning results of these four types of inclusions. Type TS inclusions are TiS inclusions and TiS+MnS composite inclusions. TiS inclusions are generally strip or round in shape and very small in size, below 1 μm, as shown in Figure 9a,b. Type TN inclusions are inclusions containing TiN, including TiN inclusions and TiN+MnS or TiN+TiS composite inclusions. Pure TiN inclusions are generally square-shaped, with a size of about 1.5~3 μm. Sometimes TiS and MnS precipitate around TiN particles. Type M inclusions are MnS inclusions, which are generally round and small in size, about 1 μm. Type A inclusions are inclusions containing Al2O3, including Al2O3 inclusions, and Al2O3+TiN, Al2O3+MnS, Al2O3+TiS, Al2O3+TiN+TiS, Al2O3+TiN+MnS, and Al2O3+MnS+TiS composite inclusions. The pure Al2O3 inclusions were generally larger than 2 μm in size with a bulky shape. The Al2O3+TiN composite inclusions were generally round, strips, or block-shaped Al2O3 as the core with the square TiN particles formed around it, as shown in Figure 9g. Fine TiS and MnS will precipitate around Al2O3 to form composite inclusions, as shown in Figure 9h.
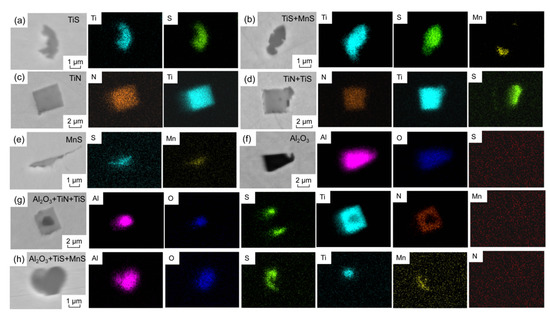
Figure 9.
(a–h) Inclusions with sizes larger than 0.2 μm observed by SEM–EDS in slabs.
Table 4 lists the number densities and average sizes of all the inclusions with sizes larger than 0.2 μm in 28 samples of continuous casting slabs that were statistically analyzed with the inclusion automatic analyzer, and the number densities and average sizes of the four types of inclusions. When the inclusions with sizes larger than 0.2 μm were counted, the analysis area of each slab sample was about 4 mm2, and the total number of inclusions detected was between 400 and 2000.
Table 4.
Statistical analysis results of inclusions with sizes larger than 0.2 μm in slabs.
Figure 10 shows the statistical analysis diagram of the number densities and average sizes of all the inclusions with sizes larger than 0.2 μm in the 28 samples of continuous casting slabs. It can be seen that the number densities and average sizes of the inclusions with sizes larger than 0.2 μm were relatively stable, and the number densities fluctuated in the range of 100~300/mm2, while the average size fluctuated in the range of 0.7~1.3 μm. There was no obvious change due to the unstable casting state during the ladle exchange.
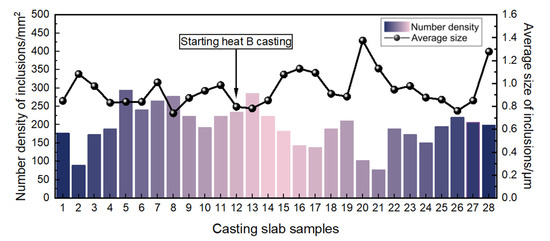
Figure 10.
Statistical analysis diagram of number densities and average sizes of all inclusions with sizes larger than 0.2 μm.
Figure 11 is the comparison of the number densities and average sizes of each Type of inclusions with sizes greater than 0.2 μm. First, it can be seen that the number densities of Type TS inclusions were much higher than those of the other three types of inclusions, while the number densities of Type TN inclusions were slightly higher than those of Type A and Type M inclusions, which is basically consistent with the calculation results in Figure 2. The number densities of Type TS inclusions fluctuated in the range of 100~230/mm2, Type TN inclusions in the range of 9~34/mm2, and Type M inclusions in the range of 3~28/mm2. Combined with Table 4, it can be found that the number densities of Type A inclusions suddenly increased from 4~9/mm2 in 1#~7# slab samples to 10~21/mm2 in the 8#~17# slab samples, and then dropped to 4~9/mm2 in the 18#~28# slab samples, indicating that the number densities of Al2O3 inclusions and its composite inclusions increased during the ladle exchange. It can be seen from Figure 11b that the average sizes of Type A inclusions and Type TN inclusions were larger than those of the other two types of inclusions. The average sizes of Type A inclusions, Type TN inclusions, Type TS inclusions, and Type M inclusions were always in a relatively stable state, fluctuating within the certain ranges.
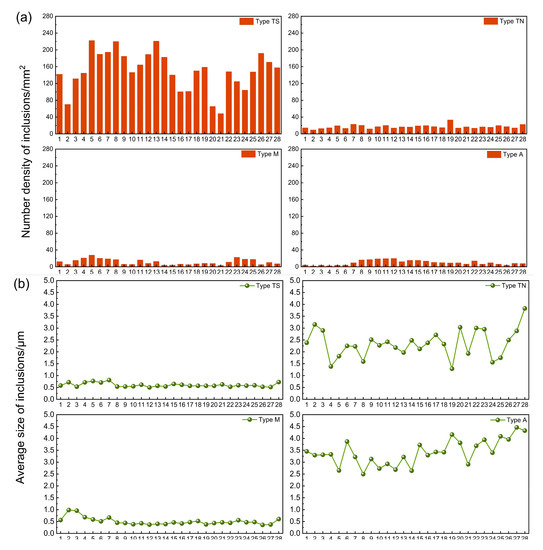
Figure 11.
Statistical analysis diagram of number densities and average sizes of different types of inclusions with sizes larger than 0.2 μm. (a) Number density; (b) Average size.
3.4. Observation and Analysis Results of Inclusions with the Sizes Larger than 5 μm in the Continuous Casting Slabs
The inclusions with sizes larger than 5 μm observed in 28 samples of continuous casting slabs can be divided into three categories: Type A, Type TN, and Type A+TN. Type A refers to inclusions containing Al2O3, including Al2O3 inclusions, and Al2O3+MnS, Al2O3+TiS, and Al2O3+MnS+TiS composite inclusions. Type TN refers to inclusions containing TiN inclusions, including TiN inclusions, and TiN+MnS and TiN+TiS composite inclusions. Type A+TN are inclusions containing Al2O3+TiN, including Al2O3+TiN, Al2O3+TiN+TiS, and Al2O3+TiN+MnS composite inclusions. As TiS inclusions and MnS inclusions were generally small in size, they were rarely found when detecting inclusions with sizes larger than 5 μm, but large composite inclusions containing TiS or MnS were be observed.
Figure 12 presents the typical morphologies and map scanning results of these three types of inclusions with sizes larger than 5 μm observed in slabs with SEM–EDS. Type A inclusions were generally lumps or clusters, and there were often small MnS or TiS inclusions precipitated at the edges, forming the composite inclusions. TiN inclusions were generally square-shaped, sometimes with MnS and TiS precipitated on their surfaces. Type A+TN inclusions were generally round with Al2O3 as the core and square TiN in its periphery, indicating that Al2O3 is the heterogeneous nucleation site of TiN. [Ti] and [N] in steel combine to precipitate TiN on Al2O3 inclusions [7].
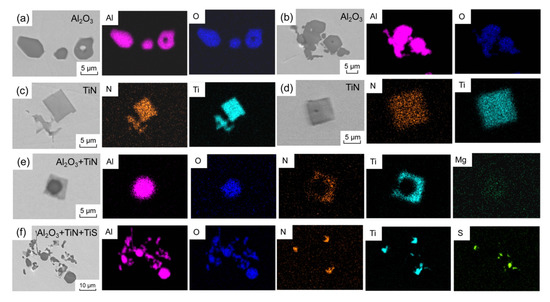
Figure 12.
(a–f) Typical morphologies and map scanning results of inclusions with sizes larger than 5 μm observed in slabs with SEM–EDS.
Table 5 lists the number densities and average sizes of the total inclusions with sizes larger than 5 μm in 28 slab samples, as well as the number densities and average sizes of each type of inclusions that were statistically analyzed with the inclusion automatic analyzer. When the inclusions with sizes larger than 5 μm were counted, the analysis area of each slab sample was about 100 mm2, and the number of inclusions detected was more than 1000.
Table 5.
Statistical analysis results of inclusions with sizes larger than 5 μm in slabs.
Figure 13 is the statistical analysis diagram of the number densities and average sizes of all the inclusions with sizes larger than 5 μm in continuous casting slabs which are 28 m long. It can be seen that both the number densities and average sizes first increased and then decreased when heat B steel started casting at the 12th meter. Combined with the results in Table 5, it can be seen that the number densities of all the inclusions in the 1#~11# slab samples with sizes larger than 5 μm fluctuated in the range of 2.7~6.9/mm2. When heat B steel started casting at the 12th meter, the number densities of all the inclusions increased to 9.76/mm2, and then the number densities of all the inclusions in the 14#~19# slab samples were about 16/mm2. When it comes to the 20#~22# slab samples, the number densities of all the inclusions decreased slightly to about 10/mm2, but they were still significantly higher than the number densities of all the inclusions in the 1#~11# slab samples. Until the 23# slab sample, the number densities of all the inclusions returned to the normal level, namely, there was little difference with the number densities of all inclusions in the first 11 m of slab samples. For the average sizes, combined with the results in Table 5, it can be found that in the 15#~19# slab samples, the average sizes of inclusions larger than 5 μm increased to 7.2 μm, while in the 1#~14# slab samples and 20#~28# slab samples, the average size of inclusions larger than 5 μm was about 6.2 μm.
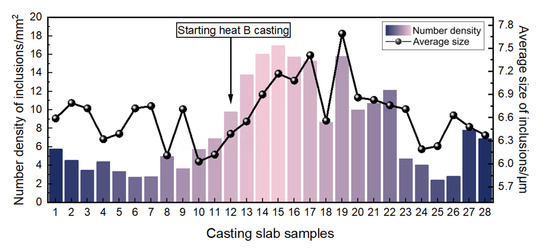
Figure 13.
Statistical analysis diagram of number densities and average sizes of total inclusions with the sizes greater than 5 μm.
It can be clearly seen that ladle exchange has a strong influence on all of the inclusions in the slabs for about 10 m from the 12th meter to the 22nd meter of the slab after heat B casting starts, which was reflected in the large increase in the number densities and average sizes. During the ladle exchange process, the liquid level first decreased after finishing the casting of ladle A. After starting the casting of ladle B, the liquid level of the tundish began to rise, and the strong secondary oxidation and tundish flux entrainment during the initial stage of the casting of ladle B could be responsible for the increase in the number densities and average sizes of all the inclusions in the slab. After the 23rd meter of the casting slab sample, the number densities and average sizes of all inclusions returned to the normal level. Therefore, the influence length of ladle exchange on the large inclusions in slabs was about 10 m.
Figure 14 shows the statistical analysis diagram of the number densities and average sizes of various inclusions with sizes larger than 5 μm of 28 m long continuous casting slabs. It can be seen that during the ladle exchange, the number densities of Type A, Type TN, and Type A+TN inclusions all increased substantially, and the average sizes of Type TN and Type A+TN inclusions also increased substantially, while the average sizes of Type A inclusions did not change. The number densities of Type TN inclusions were much higher than those of the other two types of inclusions. In 1#~11# slab samples, the number densities of Type TN inclusions were less than 5/mm2. In the 12# slab sample, the number densities of Type TN inclusions increased to 5.97/mm2, and then gradually increased to 11.08/mm2 in the 19# slab sample. This was about 10 times of that of the 7# slab sample, which shows that the ladle exchange process has a great influence on the cleanliness of casting slabs. From the 20# slab sample, the number densities of Type TN inclusions began to decrease on the whole, until the 22# slab sample where it was still more than 5/mm2. The number densities of Type TN inclusions in the 23#~28# slab samples reached a normal level, namely, less than 5/mm2. This indicates that the effect of ladle exchange on the number densities of Type TN inclusions were seen in the 10 m slab between the 12# and 22# slab samples. The number densities of Type A inclusions were the smallest among the three types of inclusions. In the 1#~12# slab samples, the number densities of Type A inclusions were less than 1/mm2, but they were increasing slowly. The number densities of Type A inclusions in the 13# slab sample greatly increased to 1.44/mm2. In the 13#~20# slab samples, the number densities of Type A inclusions increased from 1.44/mm2 to 1.96/mm2 and then decreased to 1.15/mm2. From the 21# slab samples, the number densities of Type A inclusions returned to less than 1/mm2. This shows that the influence of length of ladle exchange on the number densities of Type A inclusions was at 7 m from 13# to 20#. The number densities of Type A+TN inclusions was between the other two kinds of inclusions. In the 1#~11# slab samples, the number densities of Type A+TN inclusions were lower than 2/mm2, but they increased slowly from about 0.5/mm2 to about 1.2/mm2. The number densities of Type A+TN inclusions in the 12# slab sample increased significantly to 2.34/mm2, and then remained at a high value. The number densities of Type A+TN inclusions in the 12#~22# slab samples were in the range of 2~3/mm2. In the 23# slab sample, the number densities decreased significantly to 0.79/mm2, and then it tended to be stable, fluctuating in the range of 0.4~1.7/mm2. The influence length of the ladle exchange on the number densities of Type A+TN inclusions was also at 10 m between the 12# and 22# slab samples.
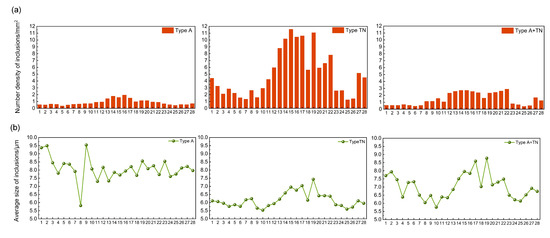
Figure 14.
Statistical analysis diagram of number densities and average sizes of different types of inclusions with sizes larger than 5 μm. (a) Number density; (b) Average size.
It can be seen from Figure 14b that the change trend of the average sizes of Type TN inclusions and Type A+TN inclusions were very similar. This is because Type A+TN inclusions are inclusions formed by the growth of TiN around Al2O3 as a heterogeneous site, so that their sizes are related to the formation of TiN. Combined with the results in Table 5, it can be seen that the average sizes of Type TN inclusions and Type A+TN inclusions began to increase in the 14#~22# slab samples, and the average sizes decreased to the normal level after the 23# slab samples, indicating that the influence of ladle exchange on the average sizes of these two types of inclusions occurs at 8 m between the 14# and 22# slab samples. The average sizes of Type A inclusions were about 8 μm, indicating that the ladle exchange had little effect on the average sizes of Type A inclusions, but the sizes of Type A inclusions were larger than those of the other two types of inclusions.
Figure 15 shows the area fraction of inclusions with sizes larger than 5 μm in the casting slabs with a length of 28 m. The area fraction of inclusions refers to the ratio of the sum of the areas of all detected inclusions (μm2) to the detected area (mm2), which reflects the comprehensive effect of the number densities and the sizes of the inclusions. It can be seen that the area fraction of all inclusions in the 1#~11# slab samples was in the range of 110 × 10−6~230 × 10−6, and in 12#~22# slab samples, it increased to 2~4 times that of the first 11 slab samples, which was between 300 × 10−6 and 800 × 10−6. The area fractions of all inclusions in the 23#~28# slab samples returned to the normal level. For Type TN inclusions, the area fractions of the 1#~11# slab samples and 23#~28# slab samples fluctuated in the range of 40 × 10−6~150 × 10−6, while the area fraction of Type TN inclusions in the 12#~22# slab samples was in the range of 170 × 10−6~520 × 10−6, increasing by about 4 times. In the 1#~11# slab samples, the area fraction of Type A+TN inclusions was in the range of 20 × 10−6~55 × 10−6, and in the 12#~22# slab samples, it was in the range of 65 × 10−6~150 × 10−6, which increased by about 3 times. The area fraction of Type A inclusions increased less and the influence length on the slabs was shorter. In the 12#~20# slab samples, the area fraction increased by about 2 times.
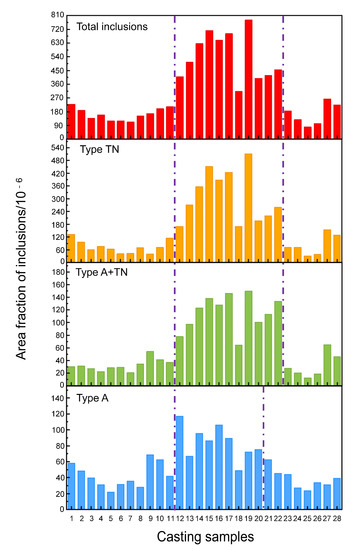
Figure 15.
Area fraction of inclusions with sizes larger than 5 μm in the casting slabs with a length of 28 m.
At the beginning of heat B steel casting, the 12th meter in the continuous casting slabs was in the position of the meniscus of the mold. During the ladle exchange process, the liquid level depth of the tundish first decreased, and then began to rise when the heat B started casting. The possible reasons for the increase in the number densities and average sizes of inclusions in the transition slabs are as follows: (1) at the end of heat A steel casting, due to the decrease in the liquid level of the residual molten steel in the ladle, it is easy to lead to the formation of a vortex, which causes ladle slag to be drawn into the long nozzle, resulting in the pollution of the liquid steel by the ladle slag. In this case, the compositions of the inclusions caused by the slag entrainment are usually close to those of the ladle slag. (2) At the beginning of heat B casting, the sintered ladle filling sands will flow into the tundish along with the flowing molten steel. In the present work, chromic filling sands were used, which consist of two phases, namely the chromite phase (Cr2O3∙FeO phase) and quartz phase (SiO2 phase). On the one hand, the SiO2–FeO–MgO–Al2O3 inclusions are easily formed when the chromic filling sands flows into the molten steel. On the other hand, SiO2 and Cr2O3 easily react with Al in the molten steel, resulting in the formation of large Al2O3 inclusions [8,9]. (3) In the process of ladle exchange, the surface depth of the tundish first decreases and then increases. Hua Zhang et al. [10] combined a numerical simulation with physical simulation experiments to find that slag inclusions will not occur when the liquid level of the tundish decreases during ladle exchange process. However, when the liquid level rises, it fluctuates because of violent agitation by the molten steel flow in the process of the ladle steel pouring, resulting in entrainment of the tundish flux. At the same time, secondary oxidation can occur easily in the exposed area of the molten steel. (4) Due to the fluctuation of the liquid level in the tundish, the liquid level of the cast mold fluctuates, resulting in the entrainment of mold powders. Xiaoxuan Deng et al. [11] adopted a 1:1 water model to simulate the influence of the rise rate of the tundish liquid level on the fluctuation of mold powder during ladle exchange process, showing that the higher the rise rate of the tundish liquid level, the greater the energy of the low frequency (0.05 Hz) periodic fluctuation signal, and the easier it is for the entrainment of mold powders to occur. (5) Secondary oxidation occurs due to the liquid steel exposure caused by the rise of the liquid level in the tundish. Hua Zhang et al. [10] also concluded that after the casting of the secondary heat in the ladle exchange process, as the liquid level of the tundish is low, the steel pouring stream from the long nozzle of the ladle reaches the bottom of the turbulence suppressor of the tundish and strongly bounces to impact the liquid level of the tundish, resulting in exposed steel and secondary oxidation.
It can be seen from the analysis results of the inclusions in the present work that the tendency of the Type A inclusions to first increase and then decrease near the transition slabs indicates the existence of secondary oxidation of the molten steel due to the liquid steel exposure in the tundish. Type TN and Type A+TN inclusions first increased and then decreased, reflecting the exposure of molten steel, and their increase was due to the absorption of N from the air into the molten steel.
The exposure of molten steel in the ladle exchange process mainly affected Type A inclusions or Type TN inclusions. The number densities of these inclusions were obviously less than that of Type TS inclusions. When the inclusions with sizes larger than 0.2 μm were analyzed, the number densities of inclusions were mainly determined by the Type TS inclusions. The total number densities of inclusions did not change significantly in the process of ladle exchange, but the number densities of Type A inclusions increased slightly. However, when analyzing inclusions with sizes larger than 5 μm, Type TS inclusions whose size is much smaller than 5 μm cannot be detected, so that the number densities of inclusions increase significantly in the process of ladle exchange from the beginning of heat B steel casting.
Since the number densities and average sizes of inclusions with sizes larger than 5 μm increased from the 12th meter of the slab at the beginning of the casting of heat B, the ladle slag at the end of ladle A casting in the previous heat should not contaminate the molten steel in the tundish in the present case. This is because the entrainment of the ladle slag was strictly controlled by leaving more than several tons of molten steel in the ladle at the end of the casting of the previous heat and the strict detection of ladle slag entrainment with thermography. In addition, because the mold powder particles with the typical elements of K, Na, and F were not detected in the transition slab, the entrainment of mold powders due to the fluctuation of the liquid level of the cast mold caused by the fluctuation of the liquid level in the tundish should not be responsible for the contamination of the transition slabs in the present case. Therefore, in the present work, the reasons for the decrease of cleanliness of the transition slabs can be attributed to: (1) secondary oxidation and nitrogen absorption caused by the exposure of the molten steel in the tundish due to the impact of the steel pouring stream of the next heat since the liquid level in the tundish decreased during the ladle exchange process. (2) The entrainment of tundish flux due to the violent fluctuations of the tundish liquid level caused by the impact of the steel pouring stream of the next heat. (3) The ladle filling sands from the next heat flowing into the molten steel.
4. Conclusions
For the slab continuous caster with a mold size of 250 mm × 1750 mm, 300 tons ladle and 56 tons tundish (TD), the inclusion analyses were carried out for inclusions in the TD samples, and in the 28 m transition slabs produced during the ladle exchange of heats A and B. At the beginning of the casting of heat B steel, the 12th meter of the continuous casting slabs was in the position of the mold meniscus. Combined with the thermodynamic calculation results, the following conclusions were obtained:
- FactSage thermodynamic calculation results showed that the main types of inclusions in the tundish and the transition slabs of heats A and B were TiS, TiN, Al2O3, MnS, and their composite inclusions. The calculation results were consistent with the inclusion analysis results.
- The statistical analysis results of the inclusions with sizes larger than 0.2 μm in the 28 m transition slabs showed that only the number densities of the inclusions containing Al2O3 increased up to 8.85 times in the transition slabs from the 8th meter to 17th meter.
- The statistical analysis results of the inclusions with sizes larger than 5 μm in the 28 m transition slabs showed that the number densities of all the inclusions increased up to 10 times in the transition slabs from the 12th meter to 22nd meter, and the average sizes increased up to 1.21 times from the 14th meter to 21st meter. These results showed that the cleanliness of the transition slab was seriously reduced by a length of about 10 m from the beginning of heat B steel casting.
- The reasons for the decrease in cleanliness of the transition slabs can be attributed to: (1) secondary oxidation and nitrogen absorption caused by the exposure of the molten steel in the tundish due to the decrease in the liquid level in the tundish during the ladle exchange process. (2) The entrainment of tundish flux due to the violent fluctuation of the tundish liquid level caused by the impact of the steel pouring stream of the next heat. (3) The ladle filling sands from the next heat flowing into the molten steel.
Author Contributions
Conceptualization, J.Y. and J.Z.; methodology, M.R. and Y.C.; software, M.R.; validation, J.Z., R.W. and Z.F.; formal analysis, J.Y.; investigation, M.R.; resources, Z.F.; data curation, M.R.; writing—original draft preparation, M.R.; writing—review and editing, M.R. and J.Y.; visualization, M.R.; supervision, J.Y.; project administration, J.Z. and R.W.; funding acquisition, J.Y. All authors have read and agreed to the published version of the manuscript.
Funding
This research was funded by National Natural Science Foundation of China (U1960202).
Data Availability Statement
Data is contained within the article.
Conflicts of Interest
The authors declare no conflict of interest.
References
- Zhang, Q.Y.; Wang, L.T.; Wang, X.H. Influence of Casting Speed Variation during Unsteady Continuous Casting on Non-metallic Inclusions in IF Steel Slabs. ISIJ Int. 2006, 46, 1421. [Google Scholar] [CrossRef]
- Cui, H.; Yue, F.; Bao, Y.P.W.S. Study on Cleanliness of IF Steel First Slab. Iron Steel 2010, 45, 38. [Google Scholar]
- Zhang, Q.Y.; Wang, L.T.; Wang, X.H. Non-Metallic Inclusion Distribution in Surface Layer of IF Steel Slabs. J. Iron Steel Res. Int. 2008, 15, 70. [Google Scholar] [CrossRef]
- Deng, X.; Ji, C.; Zhu, G. Quantitative Evaluations of Surface Cleanliness in IF Steel Slabs at Unsteady Casting. Metall. Mater. Trans. B 2019, 50, 1974. [Google Scholar] [CrossRef]
- Ren, Y.; Wang, Y.; Li, S. Detection of Non-metallic Inclusions in Steel Continuous Casting Billets. Metall. Mater. Trans. B 2014, 45, 1291. [Google Scholar] [CrossRef]
- Xue, W.H.; Wu, H.Z.; Song, M.T. Research on Influence of Unstable Casting on Slab Quality. Steelmaking 2009, 25, 56. [Google Scholar]
- Wang, M.; Bao, Y.P.; Cui, H.; Wu, H.J.; Wu, W.S. Generation Mechanism of Al2O3-TiN Inclusion in IF Steel. J. Iron Steel Res. Int. 2010, 22, 29. [Google Scholar]
- Deng, Z.; Glaser, B.; Bombeck, M.A. Mechanism study of the blocking of ladle well due to sintering of filler sand. Steel Res. Int. 2016, 87, 484. [Google Scholar]
- Deng, Z.; Glaser, B.; Bombeck, M.A.; Sichen, D. Effects of temperature and holding time on the sintering of ladle filler sand with liquid steel. Steel Res. Int. 2016, 87, 921. [Google Scholar] [CrossRef]
- Zhang, H.; Luo, R.; Fang, Q. Numerical Simulation of Transient Multiphase Flow in a Five-Strand Bloom Tundish during Ladle Change. Metals 2018, 8, 146. [Google Scholar] [CrossRef]
- Deng, X.X.; Wang, X.H.; Li, L.P. Surface Cleanliness Evaluation on Transition Slabs of IF Steel and Water Modeling of Mold Level during Ladle Change Process. CAJ 2013, B, 608. [Google Scholar]
Disclaimer/Publisher’s Note: The statements, opinions and data contained in all publications are solely those of the individual author(s) and contributor(s) and not of MDPI and/or the editor(s). MDPI and/or the editor(s) disclaim responsibility for any injury to people or property resulting from any ideas, methods, instructions or products referred to in the content. |
© 2023 by the authors. Licensee MDPI, Basel, Switzerland. This article is an open access article distributed under the terms and conditions of the Creative Commons Attribution (CC BY) license (https://creativecommons.org/licenses/by/4.0/).