Article

The Formation Mechanism of a Multilayer-Structure Oxide Film during the Oxidation of FeCrAl in Air at 700 °C

1
Hefei Institutes of Physical Science, Chinese Academy of Sciences, Hefei 230031, China
2
University of Science and Technology of China, Hefei 230026, China
3
International Academy of Neutron Science, Qingdao 266199, China
4
National Institute of Neutronic Energy Co., Ltd., Qingdao 266199, China
*
Author to whom correspondence should be addressed.
Metals 2023, 13(2), 305; https://doi.org/10.3390/met13020305
Submission received: 29 December 2022 / Revised: 25 January 2023 / Accepted: 26 January 2023 / Published: 2 February 2023
(This article belongs to the Special Issue Environmentally-Assisted Degradation of Metals and Alloys)

Abstract

:
A protective oxide film is the key to the corrosion resistance of the FeCrAl alloy. The mechanism of the formation of the multilayer oxide film of the FeCrAl alloy in 700 °C air was explored by studying the structure evolution of the oxide film and the oxidation kinetics of FeCrAl. The results show that a multilayer oxide layer is formed on the surface of the FeCrAl alloy after 1344 h, with a (Fe,Cr)2O3 layer, an Al-rich oxide layer, an Al-depleted zone, and a new Al-rich oxide layer sequentially arranged from the surface to the matrix. This indicates that the Al element plays an important role in the formation of the oxide film. The Al in the matrix is depleted to form the Al-rich oxide layer, resulting in the Al-depleted zone. The new Al-rich oxide layer is formed under the Al-depleted zone by internal oxidation. It should be noted that the precipitation of the AlN phase in the matrix is observed, which might be a probable factor for the Al-depleted zone in the matrix.

1. Introduction

The high temperature environment of advanced energy systems creates requirements for the corrosion resistance of structural materials. As a rational corrosion inhibition strategy for structural materials, introducing a surficial oxide film can prevent further corrosion to the bulk phase [1,2,3]. In general, the common oxides on the surface of alloys are SiO2, Cr2O3, and Al2O3 [4,5,6]. Among the three oxides, Al2O3 has the most stable chemical properties at high temperatures, making it an ideal candidate for the corrosion inhibition of structural materials with high-temperature application scenarios [7].
As a potential candidate for next-generation structural materials for advanced energy systems, the FeCrAl alloy stimulates broad research interests because of its superior high-temperature corrosion resistance [8,9], which could be attributed to its surficial oxide layer, Al2O3 [10,11]. Such a layer inhibits oxidation by hindering the outbound diffusion of Fe and the inbound diffusion of O [12].
Considering the dominant effect of the Al2O3 layer in the corrosion inhabitation of the FeCrAl alloy, the Al content has a significant impact on its oxidation behavior. A protective alumina-based layer starts to form as dispersed islands on the FeCrAl surface when the Al content is about 2 wt.%, so the layered fraction gradually increases to full coverage when the Al content is higher than 3.2 wt.% [13]. Therefore, the oxidation resistance extension of FeCrAl can be achieved by increasing the Al content [14]. However, such a practice is also known to deteriorate the mechanical properties of the FeCrAl alloy due to the increased Al content, such as the high-temperature creep strength [15]. Lean Al FeCrAl alloys have been widely investigated to solve the contradiction between oxidation resistance and creep strength caused by the increasing Al content [16].
It is worth noting that a multi-layered oxide film on the surface of FeCrAl can be synthesized at 600~700 °C, while a variety of morphologies are obtained at other temperatures, including amorphous oxide at temperatures lower than 500 °C and α-Al2O3 at temperatures up to 500 °C [17,18]. In the temperature range of 800–900 °C, a bilayer oxide is generated with the aluminum-rich inner layer and the Al, Cr, and Fe- containing outer layer [19,20]. A single layer alumina is generated when the temperature increases to 1000–1300 °C [8,21].
However, the oxidation mechanism leading to the formation of the multilayer structure at an intermediate temperature (such as 700 °C) is still unclear, which limits the application and development of FeCrAl in solar concentrating power generation systems [22,23]. The formation of the oxide film, especially caused by internal oxidation, is the most likely cause of growth stress [24]. Growth stress might be one of the reasons for the failure of protective oxide films [24,25]. Therefore, the formation mechanism of the multilayered-structure oxide film on the FeCrAl in the air at 700 °C is investigated. This study provides new hints for the oxidation mechanism of FeCrAl alloys and might lead to an improved corrosion inhibition strategy of this alloy, which broadens the application scenario of this important material for advanced energy systems applications.

2. Materials and Methods

The Fe13Cr2Al alloy was used in this work. The pure metal powders were melted by vacuum induction melting (VIM) to obtain ingot, followed by hot rolling at 1100 °C. After rolling, the chemical compositions of FeCrAl were analyzed using inductively coupled plasma optical emission spectroscopy (ICP-OES), model Agilent 5110(OES) (Agilent, Santa Clara, CA, USA). The major elements in the alloy are shown in Table 1. Figure 1 shows the microstructure of Fe13Cr2Al, which was chemically etched using 15% Nital.
The samples for the high-temperature oxidation test specimens, with dimensions of 12 × 12 × 2 mm in thickness, were prepared. The surfaces of all specimens were mechanically ground using silicon-carbide paper of up to 2000 grit and were cleaned ultrasonically in deionized water and alcohol before the exposure test. After being numbered, the samples were placed into the prepared alumina crucible. The crucible was then placed into a muffle furnace and high-temperature oxidation in the air was carried out. The oxidation tests were carried out three separate times (336 h, 672 h, and 1344 h) at 700 °C. An oxidation time of 1344 h was selected because of the excellent oxidation resistance of the alloy. The division of the time nodes (336 h and 672 h) is based on the assumption that alloy oxidation may follow the parabolic law [10]. After oxidation, the samples were allowed to cool in the air.
The specimens were then ultrasonically washed using ethanol or acetone. The oxide phases of the external layer of oxide film were analyzed using an X-ray polycrystalline diffractometer (XRD) (Bruker, Billerica, MA, USA) with Cu-Kα radiation. The measurements were obtained between 15° < 2θ < 85° (step size 0.03°). The structure and composition of the oxide film were observed by a field emission scanning electron microscope (FESEM) (JEOL Ltd., Tokyo, Japan) equipped with an EDS system. FESEM used an accelerating voltage of 15KV. The cross-sectional and superficial images of the oxidized samples were captured on the FESEM in the secondary electron mode (SE).

3. Results

3.1. Characterization of Oxide Layers

3.1.1. Morphology of the Oxide Film Surface

The surface morphology evolution of the FeCrAl alloy samples after oxidation at 700 °C for 336 h, 672 h, and 1344 h were observed using SEM, as shown in Figure 2. The alloy surface was covered by the oxide film with thick lamellar grains and an uneven morphology. Numerous protrusions on the surface of the oxide film were observed after oxidation for 336 h (Figure 2a). At the scale of 500nm, these protrusions were needle-like and consisted of small lamellar grains, as shown in Figure 2b. After exposure in air for 672 h, the number of protrusions decreased while their size increased, as shown in Figure 2c. After 1344 h of oxidation, the number of protrusions and depressions on the oxide film surface further decreased (Figure 2e). Figure 2b,d,f indicates that the grain size on the oxide film surface increased and their number decreased with the exposure time. In other words, the oxide film became smoother as the exposure time increased. The XRD analysis of the surface of the FeCrAl alloy sample after oxidization for 336 h, 672 h, and 1344 h is illustrated in Figure 3. (Fe,Cr)2O3 could be easily identified in all of the samples (the number of the PDF card is 02-1357).

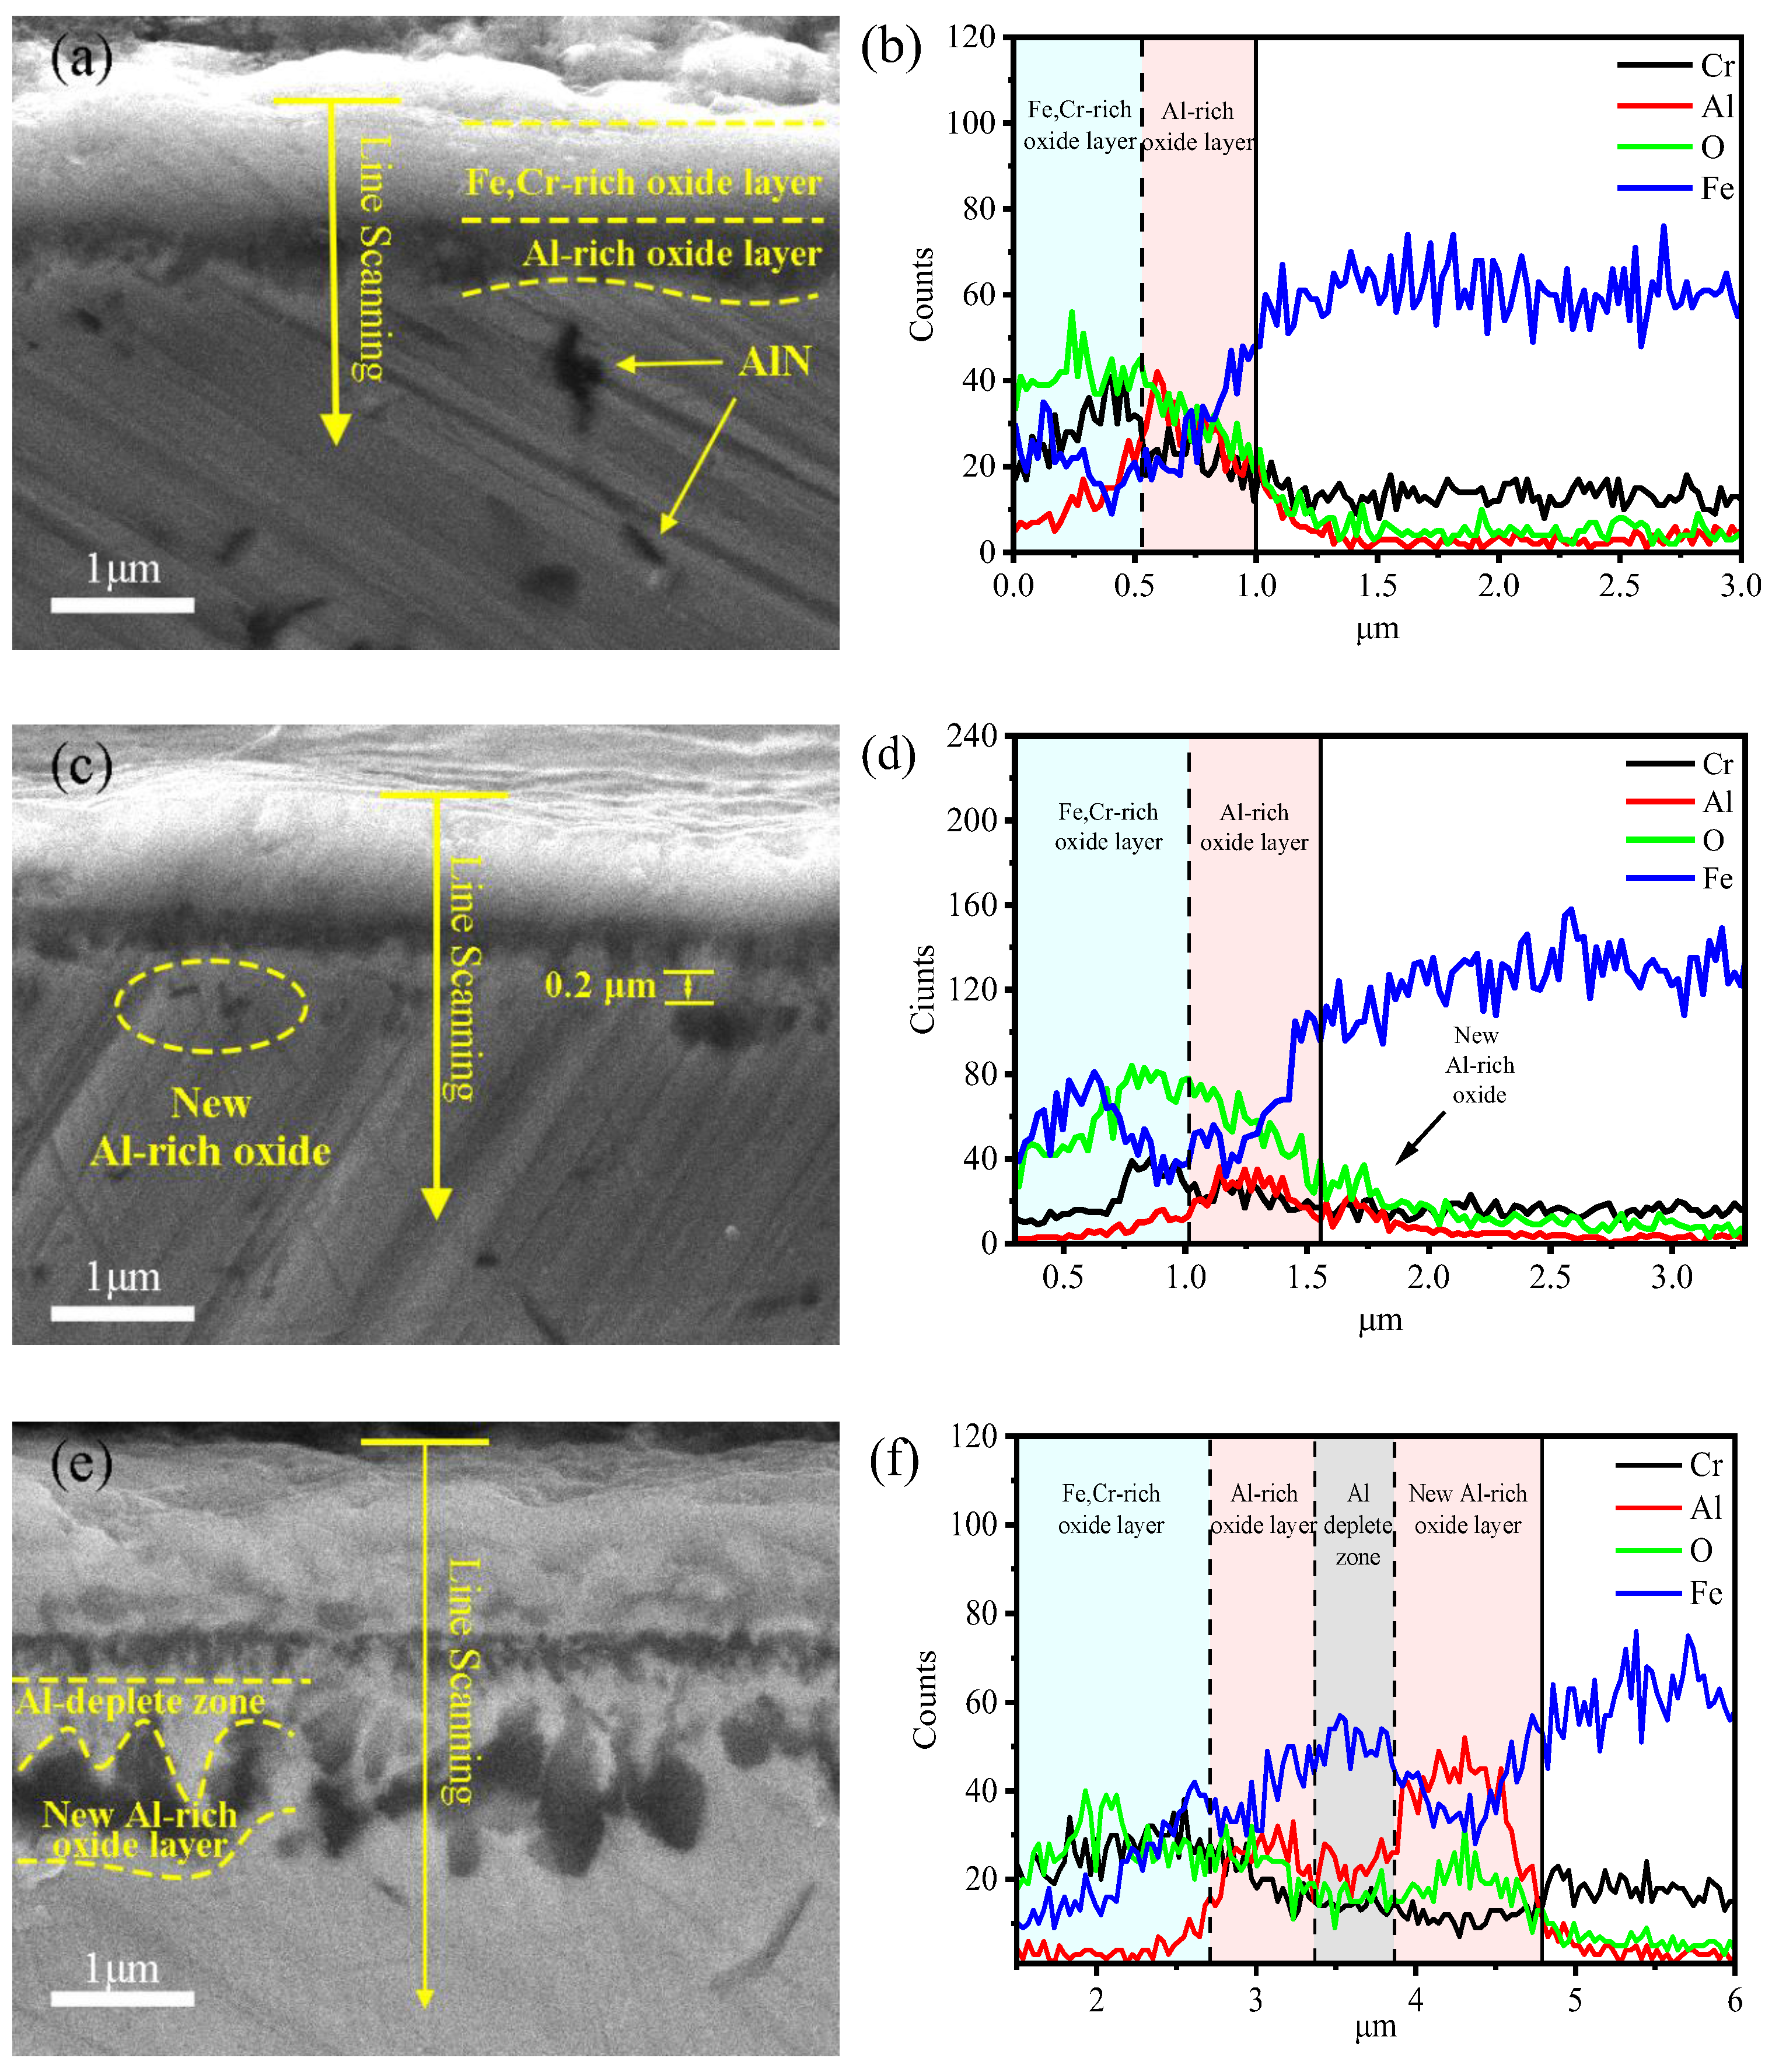
3.1.2. The Cross-Section Morphology and Composition of the Oxide Film

A continuous oxide film formed on the alloy surface and was observed in all of the samples (Figure 4), which is rich in Fe, Cr, and Al, as shown in the corresponding EDS mapping images of Figure 4. Many needle-like phases precipitated in the alloy matrix. Additionally, the EDS results show that the acicular phase was not an oxide, which will be discussed in the next section.
After 336 h of exposure, the oxide film exhibited a double-layer structure composed of an external layer and an internal layer, as shown in Figure 5a. The typical EDS line profile images suggest that the outer layer was composed of an Fe,Cr-rich oxide, as Fe, Cr, and O accumulated there (Figure 5b). The XRD in Figure 3 also supports this. It could be seen from Figure 5b that the internal layer of the oxide film was Al-rich oxides because Al and O accumulated there. However, the peak of Al-rich oxides was relatively ambiguous in XRD in comparison with the strong peak of (Fe,Cr)2O3, due to the lower content of Al-rich oxides in the oxide film.
The structure of the oxide films changed from being double-layered to four-layered with the aging time. As the exposure time increased to 672 h, new particles were observed in the matrix close to the matrix–oxide interface (Figure 5c). Peaks around 1.7–1.8 μm of the EDS line profiles reveal an Al,O-rich region (Figure 5d), suggesting that the particulates were Al-rich oxide. It is worth noting that these Al-rich oxide particulates were formed in the matrix 0.2–0.3 μm below the Al-rich oxide layer, so it should be distinguished from the previously observed Al-rich oxide layer around 1.0–1.6 μm (Figure 5c,d). When the exposure time increased to 1344 h, a new Al-rich oxide layer was formed due to the coarsening and interconnection of the aforementioned Al-rich oxide particulates (Figure 5e,f). There was an Al-depleted zone with a relatively low Al content and O content between the two Al-rich oxide layers, as shown in Figure 5f. In brief, a multilayer oxide layer was formed on the surface of the FeCrAl alloy after 1344 h, with a (Fe,Cr)2O3 layer, an Al-rich oxide layer, an Al-depleted zone, and a new Al-rich oxide layer sequentially arranged from the surface to the matrix.
It is worth noting that the structural changes in the oxide film mainly occurred on the inner side of the oxide film. The inner side of the oxide film evolved from a single Al-rich oxide layer to an Al-rich oxide layer, an Al-depleted zone, and a new Al-rich oxide layer. In contrast, the morphology of the (Fe,Cr)2O3 layer on the outer side of the oxide film remained stable with negligible thickness changes.

3.2. Morphology of AlN Precipitation in the Matrix

A large amount of needle-like precipitation was observed in the matrix after exposure for 336 h (Figure 4). The EDS analysis of the precipitation showed that the stoichiometry of Al and N was approximately 1:1 (inset table in Figure 6), suggesting the existence of AlN. In the meantime, the prominent concentration of Fe in the alloy matrices was also detected as the diameter of the needle-like phase was about 200 nm and the actual scope of the EDS analysis was usually a few cubic microns [26]. The AlN coarsened as the distance from the oxide film increased, as illustrated in Figure 4, where the AlN was almost invisible at the oxide film/matrix interface. The number of AlN phases decreased as the exposure time increased, as shown in Figure 4.

4. Discussion

4.1. Mechanism of Oxide Film Growth

A double-layer oxide film composed of an external layer and an internal layer was observed, after exposure for 336 h in air. These external and internal layers were mainly composed of (Fe,Cr)2O3 and Al-rich oxides, respectively. This is consistent with previous observations of oxidation in the Fe–Cr–Al systems [12]. The formation of this structure may be related to the promoting effect of Cr oxide on the formation of alumina [27]. In the present work, the XRD results show that (Fe,Cr)2O3 has a rhombohedral structure with space group R 3 ¯ c, which is the same as α-Al2O3. The Cr2O3 may promote the formation of α-Al2O3 [27,28,29]. However, it should be noted that their lattice parameters are not consistent. Therefore, the crystallographic relationship between (Fe,Cr)2O3 and Al-rich oxides needs to be characterized on a smaller scale in the future so as to obtain more accurate evidence.
The structural evolution of the oxide film with the aging time was observed. The change mainly occurred at the matrix near the oxide film because of the internal oxidation, while the phase and morphology of the (Fe,Cr)2O3 layer remained stable. Compared with the inhibition of internal oxidation, the Al-rich oxide layer had a better performance when inhibiting the external oxidation of the FeCrAl alloy, which explains this observation [29]. Considering the relative stability of the external (Fe,Cr)2O3 layer, the internal oxidation and its influences on the corrosion inhabitation performance of the FeCrAl alloy are discussed in the following text.
Because of internal oxidation, the new Al-rich oxide particles nucleated in the matrix and finally formed a new Al-rich oxide layer. It should be noted that the newly formed Al-rich oxide layer was isolated from the Al-rich oxide layer that previously formed. An Al-depleted zone formed between the two Al-rich oxide layers. Figure 7 illustrates a probable alloy internal oxidation model, which is also supported by the EDS results (Figure 5f). The presence of the Al-depleted zone can be attributed to the consumption of Al on the matrix side of the oxide film/matrix interface when forming the Al-rich oxides. The outward Al flux diffusing from the alloy is not sufficient to counterbalance the consumption of Al, which may also be one of reasons leading to the Al-depleted zone. Similar phenomena have also been reported in previous studies. A concentration gradient of Al on the matrix side of the oxide film/matrix interface oxidized below 1080 ° C was observed in the study of Al consumption during oxidation by B. Lesage [30].
The morphology and EDS analysis show that the Al-depleted zone is mainly composed of the partially oxidized alloy matrix (Figure 5c–f). This is because the oxidation of Fe and Cr requires a higher oxygen concentration than that of Al. Figure 8 reveals that for oxidization reactions at the same oxygen partial pressure, the standard Gibbs free energy change of Fe, Cr, and Al ( G Fe 3 O 4 θ , G Cr 2 O 3 θ , and G Al 2 O 3 θ ) were −401.5, −628.7, and −912.9 kJ mol−1, respectively, in the order Fe3O4 < Cr2O3 < Al2O3, where Al2O3 had the largest value, indicating that Al exhibited a higher affinity for O than Cr and Fe at 700 °C [31]. The change in standard Gibbs free energy for the oxidation reaction is as follows [31,32]:
3 / 2 Fe ( s ) + O 2 ( g ) = 1 / 2 Fe 3 O 4 ( s ) ,     G Fe 3 O 4 θ = 551 , 100   J / mol + 153.7 T
4 / 3 Cr ( s ) + O 2 ( g ) = 2 / 3 Cr 2 O 3 ( s ) ,     G Cr 2 O 3 θ = 773 , 173   J / mol + 148.5 T
4 / 3 Al ( s ) + O 2 ( g ) = 2 / 3 Al 2 O 3 ( s ) ,     G Al 2 O 3 θ = 1,124,800   J / mol + 217.9 T
In addition, the Al-depleted zone may have appeared after 336 h of oxidation (Figure 7a), instead of 672 h. As previously mentioned, the occurrence of the Al-depleted zone was caused by the depletion of Al in the matrix by the formation of the Al-rich oxide layer. After 336 h of oxidation, an Al-rich oxide layer formed inside the oxide film (Figure 5a). Therefore, the Al-depleted zone should also be formed at the same time. The results after oxidation for 672 h could also prove this conclusion. After 672 h of oxidation, new Al-rich oxide particles were found in the matrix ~0.2 μm away from the oxide film, as shown in Figure 5c. This shows that the concentration of Al in the matrix area between the newly formed Al-rich oxide particles and the oxide film was too low to form the Al-rich oxide. Therefore, after 336 h of oxidation, the Al-depleted zone may have appeared.

4.2. Oxidation Kinetics

The oxidation kinetics were studied by measuring the oxide film thickness. The oxide film thickness at different oxidation times is listed in Table 2. The growth curve of the oxide film is shown by the red line in Figure 9. The thickness of the (Fe,Cr)2O3 layer as one subdivision sub-layer of the oxide film was also measured to show the different stages of oxidation, as shown by the blue line in Figure 9. It can be seen that in the early stage (<336 h), external oxidization leads to the fast growth of the (Fe,Cr)2O3 layer. Then, its growth stagnates due to the formation of the Al-rich oxide layer, indicating that the external oxidation of the alloy is significantly inhibited.
The growth rate of the oxide film (red curve in Figure 9) conformed to the parabolic law, as shown below:
x 2 = 2 k t
where k is the parabolic rate constant of the oxide film (including all fine layers, such as the (Fe,Cr)2O3 layer). k = 2.4 × 10 3 μ m 2 / h , between the parabolic rate constants of Fe10Cr1.9Al and Fe10Cr2.3Al in 650 °C air [16]. In this study, we examined a continuous Al-rich oxide layer on the alloy surface after 336 h of oxidation and its significant inhibition on external oxidation of the alloy during 336~1344 h of oxidation (Figure 4 and Figure 5). This is the main reason the oxidation rate of the alloy is lower than that of Fe10Cr1.9Al [16], which is consistent with the previous understanding of the protective effect of Al-rich oxides [12,27,28,29,31].
The inhibition of Al-rich oxides against external oxidation means that the (Fe,Cr)2O3 layer may not be formed if fast formation of the continuous Al-rich oxide layer is realized in the early oxidation stage (<336 h). However, in this study, the external (Fe,Cr)2O3 layer was observed on the alloy surface at the early stage of oxidation, indicating that the formation rate of Al-rich oxides on the alloy surface was relatively slow. This may be caused by the slightly lower Al content in the alloy. The Fe10Cr2.3Al in previous research does not form an external Fe-rich oxide, showing a better oxidation resistance [16]. The lower Al content may be one of the reasons the oxidation rate of the alloy in this work is higher than Fe10Cr2.3Al. Another reason is that the Al-depleted zone in the oxide film reduces the protective effect of the oxide film during long-term oxidation. As previously mentioned, the Al-depleted zone was mainly composed of unoxidized Fe (see Figure 5). The diffusion coefficients of oxygen in Fe, Cr2O3, and Al2O3 are, respectively [33,34,35]:
D O   i n   Fe = 0.37 e x p ( 298   KJ × mol 1 R T ) m 2 / s
D O   i n   Cr 2 O 3 = 1.59 × 10 3 e x p ( 421   KJ × mol 1 R T ) m 2 / s
D O   i n   Al 2 O 3 = 1.59 × 10 3 e x p ( 603   KJ × mol 1 R T ) m 2 / s
when the temperature is 700 °C, D O   i n   Fe = 3.7 × 10 11   m 2 / s , D O   i n   Cr 2 O 3 = 4.0 × 10 26   m 2 / s and D O   i n   Al 2 O 3 = 1.1 × 10 35   m 2 / s . It can be seen that the diffusion coefficient of oxygen in the alloy matrix is much greater than that in Cr2O3 and Al2O3. Therefore, when designing new alloys, the content of Al should be carefully designed within the acceptable range of processing performance to avoid the generation of the Al-depleted zone as much as possible.

4.3. Interaction between AlN and Oxide Film

The appearance of the Al-depleted zone may be related to the formation of AlN. Figure 4 and Figure 6 show that the AlN phase precipitated in the alloy matrix under the oxide film after oxidation for 336 h. The precipitation of the AlN phase may have been the result of diffusion of the N element from the air into the alloy matrix. Previous studies have shown that the nitridation of alloys occurs in the very early stage of oxidation [36]. Consequently, Al in the alloy matrix is consumed by the precipitation of AlN, which may be another reason for the appearance of the Al-depleted zone.
The formation of the Al-rich oxide layer prevents further nitridation, as shown in Figure 4. This indicates that the oxide film on the surface of the alloy successfully inhibits the migration of N into the alloy matrix, thus preventing the nitridation of the alloy. Compared with AlN, Al2O3 is more thermodynamically stable [13]. The formation of Al2O3 consumes Al in the matrix, so the Al content in the matrix near the oxide film is further lowered, making the formation of AlN thermodynamically unfavorable. Therefore, only a limited amount of AlN is observed in the matrix extremely near the oxide film. The fine AlN phase near the oxide film may directly react with the inwardly diffused O to form Al2O3 due to the higher affinity of Al and O [37].

5. Conclusions

The oxidation behavior of FeCrAl in the air at 700 °C for 336 h, 672 h, and 1344 h was studied by investigating the oxidation kinetics and microstructure evolution. Based on the presented analysis, the following conclusions can be drawn:
  • At the early stage of oxidation, a double-layer oxide film was formed on the alloy surface. The external layer of the oxide film is (Fe,Cr)2O3 and the internal layer is Al-rich oxides.
  • With the extension of the oxidation time, the structure of the oxide film evolved from being double-layered to four-layered. The four-layered oxide film consists of a (Fe,Cr)2O3 layer, an Al-rich oxide layer, an Al-depleted zone, and an Al-rich oxide layer. The main components of the Al-depleted zone are Fe and Cr, which have not been completely oxidized.
  • The occurrence of the Al-depleted zone is mainly due to the depletion of Al in the matrix by an Al-rich oxide layer formed at 336 h. The formation of the new Al-rich oxide layer is mainly because of the internal oxidation of the alloy.
  • The growth of the oxide film follows a parabolic law.
  • The AlN phase was formed due to the diffusion of N into the alloy matrix in the early stage of oxidation. The precipitation of the AlN phase might be one of the reasons for the appearance of the Al-depleted zone.

Author Contributions

Conceptualization, S.L.; formal analysis, Z.G. and X.W.; funding acquisition, S.L. and L.S.; investigation, Z.G.; methodology, Z.G.; project administration, S.L. and Q.W.; Resources, X.W., C.L. and Q.W.; supervision, D.Z., S.L. and C.L.; visualization, Z.G.; writing—original draft, Z.G.; writing—review and editing, X.W., D.Z., L.S. and S.L. All authors have read and agreed to the published version of the manuscript.

Funding

This work was supported and funded by the National Natural Science Foundation of China with grant no. 51901223, the Youth Innovation Promotion Association of the Chinese Academy of Sciences with grant no. 2017486, and the Laoshan Laboratory with grant no. LSKJ202205200.

Data Availability Statement

The data presented in this study are available upon request from the corresponding author.

Conflicts of Interest

The authors declare no conflict of interest.

References

  1. Agüero, A. Progress in the Development of Coatings for Protection of New Generation Steam Plant Components. Energy Mater. 2008, 3, 35–44. [Google Scholar] [CrossRef]
  2. Dryepondt, S.; Unocic, K.A.; Hoelzer, D.T.; Massey, C.P.; Pint, B.A. Development of Low-Cr ODS FeCrAl Alloys for Accident-Tolerant Fuel Cladding. J. Nucl. Mater. 2018, 501, 59–71. [Google Scholar] [CrossRef]
  3. Terrani, K.A.; Pint, B.A.; Kim, Y.-J.; Unocic, K.A.; Yang, Y.; Silva, C.M.; Meyer, H.M.; Rebak, R.B. Uniform Corrosion of FeCrAl Alloys in LWR Coolant Environments. J. Nucl. Mater. 2016, 479, 36–47. [Google Scholar] [CrossRef]
  4. Xu, Z.; Song, L.; Zhao, Y.; Liu, S. The Formation Mechanism and Effect of Amorphous SiO2 on the Corrosion Behaviour of Fe-Cr-Si ODS Alloy in LBE at 550 °C. Corros. Sci. 2021, 190, 109634. [Google Scholar] [CrossRef]
  5. Xu, Z.; Liu, S.; Song, L.; Yang, X.; Zhao, Y.; Mao, X. Effect of Silicon on Oxidation Behavior of 9Cr-ODS Steel at 650 °C. Fusion Eng. Des. 2021, 167, 112384. [Google Scholar] [CrossRef]
  6. Eklund, J.; Paz, M.D.; Jönsson, B.; Liske, J.; Svensson, J.; Jonsson, T. Field Exposure of FeCrAl Model Alloys in a Waste-fired Boiler at 600 °C: The Influence of Cr and Si on the Corrosion Behaviour. Mater. Corros. 2019, 70, 1476–1485. [Google Scholar] [CrossRef]
  7. Xiang, Z.D.; Zeng, D.; Zhu, C.Y.; Rose, S.R.; Datta, P.K. Steam Oxidation Resistance of Ni-Aluminide/Fe-Aluminide Duplex Coatings Formed on Creep Resistant Ferritic Steels by Low Temperature Pack Cementation Process. Corros. Sci. 2011, 53, 496–502. [Google Scholar] [CrossRef]
  8. Rebak, R.B.; Gupta, V.K.; Larsen, M. Oxidation Characteristics of Two FeCrAl Alloys in Air and Steam from 800 °C to 1300 °C. JOM 2018, 70, 1484–1492. [Google Scholar] [CrossRef]
  9. Chen, G.; Yang, H.; Sun, H.; Wang, F.; Wang, H.; Kong, Q.; An, X.; Zhang, Y.; Wang, J. Exploring the High-Temperature Steam Oxidation Behaviors of the Lean-Cr (7–10 Wt%) FeCrAl Alloys. Corros. Sci. 2022, 194, 109927. [Google Scholar] [CrossRef]
  10. Josefsson, H.; Liu, F.; Svensson, J.-E.; Halvarsson, M.; Johansson, L.-G. Oxidation of FeCrAl Alloys at 500–900 °C in Dry O2. Mater. Corros. 2005, 56, 801–805. [Google Scholar] [CrossRef]
  11. Tsisar, V.; Stergar, E.; Gavrilov, S.; Van Renterghem, W.; Louette, P.; Lucas, S. Effect of Variation in Oxygen Concentration in Static Pb–Bi Eutectic on Long-Term Corrosion Performance of Al-Alloyed Austenitic Steels at 500 °C. Corros. Sci. 2022, 195, 109963. [Google Scholar] [CrossRef]
  12. Birks, N.; Meier, G.H.; Pettit, F.S. Introduction to the High Temperature Oxidation of Metals, 2nd ed.; Cambridge University Press: Cambridge, UK, 2006. [Google Scholar]
  13. Engkvist, J.; Bexell, U.; Grehk, M.; Olsson, M. High Temperature Oxidation of FeCrAl-Alloys–Influence of Al-Concentration on Oxide Layer Characteristics: High Temperature Oxidation of FeCrAl Alloys. Mater. Corros. 2009, 60, 876–881. [Google Scholar] [CrossRef]
  14. Gurrappa, I.; Weinbruch, S.; Naumenko, D.; Quadakkers, W.J. Factors Governing Breakaway Oxidation of FeCrAl-Based Alloys. Mater. Corros. 2000, 51, 224–235. [Google Scholar] [CrossRef]
  15. Magnusson, H.; Sandström, R. Influence of Aluminium on Creep Strength of 9–12% Cr Steels. J. Mater. Sci. Eng. A 2009, 527, 118–125. [Google Scholar] [CrossRef]
  16. Tang, S.; Zhu, S.; Tang, X.; Pan, H.; Chen, X.; Xiang, Z.D. Influence of Al on Scale Formation and Growth Kinetics of 10wt.% Cr Creep Resistant Ferritic Steels at 650 °C in Air. Corros. Sci. 2014, 80, 374–382. [Google Scholar] [CrossRef]
  17. Li, N.; Parker, S.S.; Saleh, T.A.; Maloy, S.A.; Nelson, A.T. Intermediate Temperature Corrosion Behaviour of Fe-12Cr-6Al-2Mo-0.2Si-0.03Y Alloy (C26M) at 300–600 °C. Corros. Sci. 2019, 157, 274–283. [Google Scholar] [CrossRef]
  18. Li, N.; Parker, S.S.; Wood, E.S.; Nelson, A.T. Oxide Morphology of a FeCrAl Alloy, Kanthal APMT, Following Extended Aging in Air at 300 °C to 600 °C. Metall. Mat. Trans. A 2018, 49, 2940–2950. [Google Scholar] [CrossRef]
  19. Tomaszewicz, P.; Wallwork, G.R. The Oxidation of High-Purity Iron-Chromium-Aluminum Alloys at 800~. Oxid. Met. 1983, 20, 75–109. [Google Scholar] [CrossRef]
  20. Götlind, H.; Liu, F.; Svensson, J.-E.; Halvarsson, M.; Johansson, L.-G. The Effect of Water Vapor on the Initial Stages of Oxidation of the FeCrAl Alloy Kanthal AF at 900 °C. Oxid. Met. 2007, 67, 251–266. [Google Scholar] [CrossRef]
  21. Quadakkers, W.J.; Naumenko, D.; Wessel, E.; Kochubey, V.; Singheiser, L. Growth Rates of Alumina Scales on Fe–Cr–Al Alloys. Oxid. Met. 2004, 61, 17–37. [Google Scholar] [CrossRef]
  22. Dömstedt, P. Corrosion Studies of Low-Alloyed FeCrAl Steels in Liquid Lead at 750 °C. Oxid. Met. 2019, 91, 511–524. [Google Scholar] [CrossRef]
  23. Popovic, M.P.; Bolind, A.M.; Aussat, Y.; Gubser, A.J.; Hosemann, P. Oxidative Passivation of Fe–Cr–Al Steels in Lead-Bismuth Eutectic under Oxygen-Controlled Static Conditions at 700° and 800 °C. J. Nucl. Mater. 2019, 523, 172–181. [Google Scholar] [CrossRef]
  24. Popovic, M.P.; Chen, K.; Shen, H.; Stan, C.V.; Olmsted, D.L.; Tamura, N.; Asta, M.; Abad, M.D.; Hosemann, P. A Study of Deformation and Strain Induced in Bulk by the Oxide Layers Formation on a Fe-Cr-Al Alloy in High-Temperature Liquid Pb-Bi Eutectic. Acta Mater. 2018, 151, 301–309. [Google Scholar] [CrossRef]
  25. Smialek, J.L. Invited Review Paper in Commemoration of Over 50 Years of Oxidation of Metals: Alumina Scale Adhesion Mechanisms: A Retrospective Assessment. Oxid. Met. 2022, 97, 1–50. [Google Scholar] [CrossRef]
  26. Liu, Z.W.; Sun, C.; Gauvin, R.; Wu, W.; Zeng, Y.; Demers, H. High Spatial Resolution EDS Mapping of Nanoparticles at Low Accelerating Voltage. J. Test. Eval. 2016, 44, 20140457. [Google Scholar] [CrossRef]
  27. Brumm, M.W.; Grabke, H.J. The Oxidation Behaviour of NiAl-I. Phase Transformations in the Alumina Scale during Oxidation of NiAl and NiAl-Cr Alloys. Corros. Sci. 1992, 33, 1677–1690. [Google Scholar] [CrossRef]
  28. Zeng, C.; Ling, Y.; Li, S.; Rao, Y.; Chen, Y. The Effect of Chromium on the Gamma to Alpha Phase Transition of Alumina Coating Formed on 316L SS by a Cathodic Micro Arc Deposition (CMAD) Process. Surf. Coat. Technol. 2015, 263, 15–20. [Google Scholar] [CrossRef]
  29. Niu, Y.; Wang, S.; Gao, F.; Zhang, Z.G.; Gesmundo, F. The Nature of the Third-Element Effect in the Oxidation of Fe–XCr–3at.% Al Alloys in 1atm O2 at 1000 °C. Corros. Sci. 2008, 50, 345–356. [Google Scholar] [CrossRef]
  30. Chevalier, S.; Lesage, B.; Legros, C.; Borchardt, G.; Strehl, G.; Kilo, M. Oxygen Diffusion in Alumina. Application to Synthetic and Thermally Grown Al2O3. DDF 2005, 237–240, 899–910. [Google Scholar] [CrossRef]
  31. Gaskell, D.R. Introduction to the Thermodynamics of Materials, 6th ed.; CRC Press: Boca Raton, FL, USA, 2017; ISBN 978-1-315-11903-8. [Google Scholar]
  32. Lim, J. Effects of Chromium and Silicon on Corrosion of Iron Alloys in Leadbismuth Eutectic. Ph.D. Thesis, Massachusetts Institute of Technology, Cambridge, MA, USA, 2006. [Google Scholar]
  33. Hagel, W.C. Oxygen-ion diffusion in hematite. Trans. Metall. Soc. AIME 1966, 236, 179–184. [Google Scholar]
  34. Frank, W.; Engell, H.J.; Seeger, A. Solubility and Interstitial Migration of Oxygen in Bcc Iron. Trans. Met. Soc. AIME 1968, 242, 749–750. [Google Scholar]
  35. Heuer, A.H. Oxygen and Aluminum Diffusion in α-Al2O3: How Much Do We Really Understand? J. Eur. Ceram. Soc. 2008, 28, 1495–1507. [Google Scholar] [CrossRef]
  36. Veskovic-Bukudura, S.; Kovac, J.; Karpe, B.; Umek, P.; Nagode, A.; Cerc-Korosec, R.; Bizjak, M. High Temperature Corrosion of Commercial FeCrAl Alloys (Kanthal AF) in Nitrogen Gas. J. Min. Metall. Sect. B 2019, 55, 55–63. [Google Scholar] [CrossRef]
  37. Israelsson, N.; Unocic, K.A.; Hellström, K.; Jonsson, T.; Norell, M.; Svensson, J.-E.; Johansson, L.-G. A Microstructural and Kinetic Investigation of the KCl-Induced Corrosion of an FeCrAl Alloy at 600 °C. Oxid. Met. 2015, 84, 105–127. [Google Scholar] [CrossRef] [Green Version]
Figure 1. OM microstructure of the Fe13Cr2Al etched with 15% NITAL (100×).
Metals 13 00305 g001
Figure 2. FESEM-SE surface morphology of FeCrAl after oxidation at different exposure times: (a) (b) 336 h, (c,d) 672 h, and (e,f) 1344 h. The magnification of (a,c,e) is 8000× and the magnification of (b,d,f) is 40,000×.
Metals 13 00305 g002aMetals 13 00305 g002b
Figure 3. XRD patterns of the oxidation scale formed on the FeCrAl surface.
Metals 13 00305 g003
Figure 4. FESEM-SE cross-sectional morphology and EDS chemical mapping of FeCrAl after oxidation at different exposure times (2000×): (a) 336 h, (b) 672 h, and (c) 1344 h.
Metals 13 00305 g004
Figure 5. FESEM-SE image and EDS line scanning on the cross-sectional oxide film of the FeCrAl during different exposure times (16,000×): (a,b) 336 h, (c,d) 672 h, and (e,f) 1344 h.
Metals 13 00305 g005
Figure 6. EDS point scanning analysis of the needle-like phase (10,000×).
Metals 13 00305 g006
Figure 7. Oxidation mode of FeCrAl during long-term exposure for (a) 336 h, (b) 672 h, (c) 1344 h.
Metals 13 00305 g007
Figure 8. Ellingham diagram showing the standard Gibbs free energy per one mol O2 for the oxide formation relating to the main constitutive elements of the FeCrAl alloys as a function of temperature [31,32].
Metals 13 00305 g008
Figure 9. The thickness of the oxide film and (Fe,Cr)2O3 layer in the oxide film as a function of exposure time.
Metals 13 00305 g009
Table 1. Compositions of FeCrAl alloys used in the present work (wt. %).
ElementsFeCrAlMo
Content (wt.%)balance12.72.01.5
Table 2. Change in oxide film thickness with time.
Time (h)3366721344
Thickness (μm)1.31.82.5
Disclaimer/Publisher’s Note: The statements, opinions and data contained in all publications are solely those of the individual author(s) and contributor(s) and not of MDPI and/or the editor(s). MDPI and/or the editor(s) disclaim responsibility for any injury to people or property resulting from any ideas, methods, instructions or products referred to in the content.

