Abstract
An approach coupling experimental tests and numerical simulation of the pressure resistance welding (PRW) process is proposed for optimizing fuel cladding welds for the new generation of nuclear reactors. Several experimental welds were prepared by varying the dissipated energy, which accounts for the effect of electric current and welding time applied during the PRW process. A working zone, a function of both applied dissipated weld energy and plug-displacement, was then identified on the basis of the microscopy observations of the weld defects. In addition, the numerical approach, based on a 2D axisymmetric multi-physics finite element model, was developed to simulate the PRW process in a plug-tube configuration. The proposed model accounted for interactions between the electrical, thermal and mechanical phenomena and the electro-thermo-mechanical contact between the pieces and electrodes. Numerical simulations were first validated by comparison to experimental measurements, notably by comparing the plug-displacement and the size and position of the heat-affected zone (HAZ). They were then used to assess the effect of the applied parameters on the maximum temperature and cumulated plastic strain reached during welding and the effect of the welding force on the quality of the weld. According to the numerical computations, the maximum temperature reached in the weld remains well below the melting temperature. Changing the welding force implies also modifying the applied energy in order to maintain the quality of the welds. Applied to different plug and clad geometries, the proposed model was shown to be useful for optimizing the joint plane for such a welding configuration.
1. Introduction
Oxide dispersion-strengthened (ODS) ferritic–martensitic steels are candidate materials for the fabrication of fuel cladding for the fourth generation of nuclear reactors, notably sodium-cooled fast reactors (SFR) [1], as well as structure materials for fusion reactors [2,3]. Indeed, these materials present an excellent response to the loading conditions foreseen for these reactors. For instance, the ferritic and martensitic structure resists irradiation swelling to doses up to 200 dpa, while the nano-oxide uniform distribution improves the creep strength at temperatures up to 700 °C [4,5]. Numerous ODS ferritic–martensitic alloys with different chromium contents have been developed and characterized: 9Cr martensitic alloys [6], 12Cr ferritic alloys [7], 14Cr ferritic alloys [8], 18Cr ferritic alloys [9] and 20Cr ferritic alloys [10].
For ODS steels, the material melting during the welding processes modifies the nano-oxide dispersion, resulting in an inhomogeneous distribution within the ferritic–martensitic matrix and, by consequence, a local loss of mechanical properties [11,12]. In order to bypass such a problem, solid welding processes (SWP) are generally applied for ODS steels. Among these, the pressure resistance welding (PRW) process has already been studied in the literature for different configurations of fuel cladding by varying the investigated material, the geometry of the welded components or their position with respect to the electrodes. Chamfered and/or unchamfered clad and plug geometries were studied for numerous ODS alloys [13,14,15,16,17,18]. In addition to the different initial contact conditions of pieces and alloys, clad and plug dimensions can also vary from one study to another. Later studies carried out at CEA considered non-chamfered plugs and clads, with an initial linear contact between both pieces measuring less than 250 µm [19].
These studies highlight the challenge in transposing operative and metallurgical weldability results from one configuration to another, as these strongly depend on the welding parameters and the welding configuration. An optimization step of the process parameters is therefore necessary for each new configuration in order to obtain compact welds without defects such as a lack of joints or local melting. Experimental studies about the PRW of ODS steels have allowed the identification of a working zone, which depends mainly on the dissipated energy, , during the welding process [14,20].
Meanwhile, numerical approaches using the finite elements method (FEM) have been proposed to account for the multi-physical phenomena at play during the PRW process of ODS alloys. Zirker et al. [21] proposed a very simplified FEM model, considering only the thermo-mechanical coupling phenomenon and a very rudimentary finite element mesh. By neglecting the electro-thermal phenomena at the weld interfaces, the maximum computed temperature was largely overestimated, exceeding the material melting temperature. More recently, Corpace [22] proposed a model accounting for both electro-thermo-mechanical (ETM) phenomena and electro-thermal contact resistance (ETCR) between the clad and end-plug and between electrodes and both pieces. Corpace correlated the numerical simulation predictions with the process parameters, which allowed decomposing the PWR process into three main steps: (1) heating at the interface, mainly driven by the current intensity; (2) heating in the volume, mainly controlled by the length of the clad exceeding the electrode; and (3) the deformation of both pieces, controlled by the length of the clad exceeding the electrode, the force, the current intensity and the welding time.
The huge magnitude and the rate of plastic strain imposed during the welding process and the absence of remeshing during the simulations resulted in non-negligible incertitude in the predicted temperature field, as reported by Corpace [22,23]. According to Le Gloannec et al. [13,24], the implementation of a remeshing procedure is not sufficient to reduce such incertitude, as long as the contact resistance between pieces and electrodes is not correctly modeled. Le Gloannec and co-workers paid special attention to the calibration of the ETCR parameters before proposing a complete ETM model, using an automatic remeshing procedure to simulate the welding process of 9Cr-ODS and 14Cr-ODS steels. By simulating the PRW of chamfered and unchamfered configurations, these authors reported the latter as being more suitable for creating welds of good quality, since in this configuration the heat is concentrated around the joint plane. A sensibility study showed the effect of taking into account the ETCR model between pieces and electrodes, even though variations of ±50% around the ETCR parameters values had minor impacts on the numerical predictions. It was also shown that the ETCR modeling between the clad and the plug has a limited impact on the predicted results when compared to the case wherein it was not taken into account. Based on FEM computations, Feng el al. [25] could optimize the electrode-clad geometry for welding zirconium alloy clads.
The aim of this work is to optimize the welding configuration in order to obtain an adequate weld joint, meaning free of defects, and to study the effect of the process parameters on the weld integrity. For that purpose, an approach coupling experimental tests with 11Cr-ODS, P91 and 9Cr-ODS ferritic–martensitic steels and numerical simulations of the PWR process is proposed. The experiments were carried out with a fixed welding force with various dissipated energies, allowing defining a working zone based on the plug-displacement and the dissipated energy. The multi-physics model was validated with respect to the experimental measurements. Further predictions of the PRW process are presented and discussed.
2. Experimental Approach
2.1. Materials and Geometry
The experimental welding optimization of a non-chamfered clad–plug configuration was carried out using three grades of ferritic–martensitic steels (the chemical compositions are summarized in Table 1). The 11Cr-ODS steel is the material of interest for this study. Since this material has been recently developed, its electro-thermal-mechanical properties are still poorly documented. According to Le Gloannec [13,24], the electro-thermal properties determined experimentally for 9Cr-ODS and 14Cr-ODS steels are quite similar (thermal and electric conductivity, calorific capacity, volume density), suggesting little difference between the physical properties of 9Cr-ODS and 11Cr-ODS alloys. For this purpose, welds using 9Cr-ODS and P91 (X10CrMoVNb9-1 grade) steels were prepared, as their temperature-dependent electro-thermal properties are accessible in the literature.

Table 1.
Chemical compositions of the three studied steels in wt.%: 11Cr-ODS, 9Cr-ODS and P91.
Plugs and clads made of 9Cr-ODS and 11Cr-ODS were machined directly from raw bars with a diameter of 18 mm (manufactured at CEA, SRMA/LTMex, Gif-Sur-Yvette, France). The raw bars were produced by the hot extrusion of compacted powder at 1100 °C. After extrusion, a heat treatment at 1050 °C for 1 h was applied, followed by slow cooling, resulting in an equiaxed ferritic microstructure. More information about the manufacturing process of these bars can be found in [26,27]. The P91 plugs and clads were machined in the rolling direction of commercial thick plates. The as-received P91 microstructure was characterized as a tempered martensitic. The solidus temperature, , and liquidus temperature, , are about the same for these three grades and can be taken as 1450 °C and 1500 °C, respectively.
The same experimental welding configuration was applied for the three steels. The clad thickness was 0.5 mm, with a 10.73 mm external diameter. The plug diameter was 10.2 mm. The initial thickness of the contact ring between the clad and plug was then of about 235 µm (see Figure 1). Despite a minimal dimensional tolerance being respected in the machining process, small variations on the clad thickness or in the plug diameter may affect the weld quality.
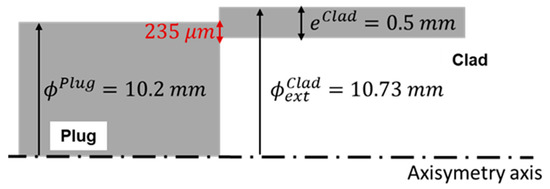
Figure 1.
Geometry and dimensions of the welding pieces.
2.2. Pressure Resistance Welding Process
PRW was carried out using the experimental device (Technax, Saint-Priest, France) shown in Figure 2. This process consists of applying a mechanical force while heating the contact surfaces to be welded by the Joule effect. It can be divided into three main steps. First, the welding clad and plug are positioned between the electrodes, and a force is applied on the surface of the plug, establishing the contact between these two pieces. The welding force, , is kept constant during the entire process. Second, the plug–clad welding takes place, as a high current, , is applied from the plug electrode to the clad one through the surfaces in contact during the welding time . The dissipated energy, , resulting in the material heating, can be expressed by:
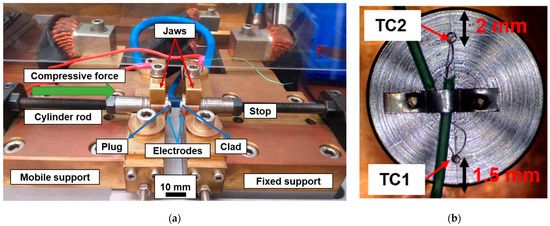
Figure 2.
(a) Plug and clad installed within copper alloy electrodes in the PWR device. (b) Top view of a plug outfitted with K-type thermocouples.
The process parameters considered in this study are and , which regroups the effects of and . During welding, sensors implemented in the PRW device record the evolution of the welding parameters (, but also the plug-displacement, , and the difference in the electric potential between the two jaws, . Typical electrical and mechanical recordings are shown in Figure 3. Regarding the application of the 1 kHz alternative electric current, we can see that it first increases up to the targeted value (Figure 3a). Then, the average effective measured electric current exceeds the targeted one, with a maximum difference of about 13% (Figure 3a). At the end of the process, the decrease of the current is slower than the set value. The measured force is in better agreement with the set value (Figure 3b). A drop of the load of about 150 N is observed when the plug begins to move during the passage of the current. Additionally, temperature measurements were also carried out using type-K thermocouples installed at the surface of some plugs in order to understand the effects of the process parameters on the temperatures reached near the weld (Figure 2b).
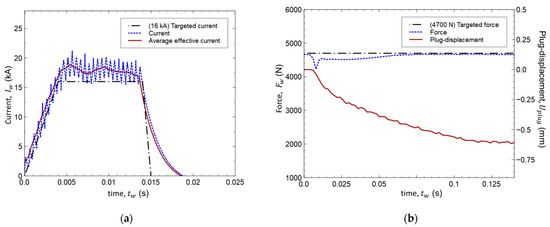
Figure 3.
Example of experimental measurements obtained during the PRW process. (a) Applied current, , compared with the targeted electric current, 16 kA. (b) Plug-displacement, , and welding force, , compared to the targeted force, 4700 N.
2.3. Weld Characterization
After welding, the plug–clad assemblies were cut in half and prepared by conventional metallographic polishing, using abrasive paper and diamond paste. A Keyence VHX-1000 microscope (Keyence, Bois-Colombes, France) was used to investigate the welding quality. Observations were made before and after etching (oxalic acid solution) in order to identify the presence of defects and to determine the HAZ dimensions, respectively.
2.4. Experimental Results
The experimental approach to optimizing the process parameters for the new welding configuration was conducted by defining a working zone and ensuring the absence of defects in welds. It can be defined by correlating the plug-displacement, , with the applied dissipated energy, , regrouping the effect of both and parameters (Equation (1)) [14,20]. These experiments were mainly performed using P91 steel, but tests were also carried out with 9Cr-ODS and 11Cr-ODS steels.
In order to estimate the effects of the steel composition, an initial set of experimental welds were done using the same set of process parameters, (, , ) = (4700 N, 13 kA, 120 ms). Measurements of the electric potential, , and the plug displacement, , obtained for the three tested alloys are shown in Figure 4. The differences between the recordings on the different specimens are lower than 10%. Optical microscopy observations showed identical weld shapes for these materials (Figure 5), with only a slight difference noticed in the external and internal bead of the weld. This difference is perhaps mainly related to the difference in the final plug-displacement value (Figure 4b) or to the difference in the initial contact geometry. These results indicate that the electro-thermomechanical behavior of the three steels are similar under the welding conditions.
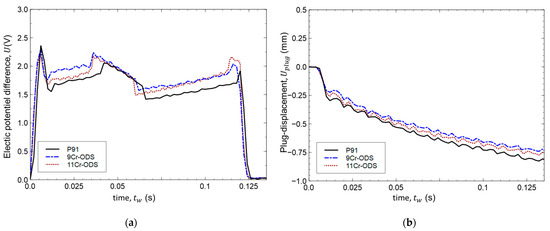
Figure 4.
Characteristic experimental measurements obtained for the P91, 9Cr-ODS and 11Cr-ODS steels, using the same set of process parameters (, , ) = (4700 N, 13 kA,120 ms): (a) electric potential difference measured between the jaws, and (b) plug-displacement, .
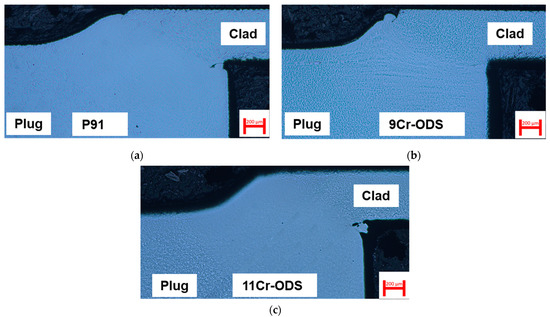
Figure 5.
Weld optical metallography images obtained with the same set of process parameters (, , ) = (4700 N, 13 kA, 120 ms) for the three steels: (a) P91, (b) 9Cr-ODS and (c) 11Cr-ODS.
For the second set of tests, the force value was also fixed at 4700 N. Figure 6 presents the final plug-displacement recorded for each test according to the dissipated energy, . On the basis of 62 experiments, it was established that the plug-displacement increases almost linearly as a function of the dissipated energy. A lack of external joining was observed when plug-displacements were lower than 0.7 mm (Figure 7b), while liquid material ejections were revealed for plug-displacements higher than 1 mm (Figure 7c). These operating conditions were therefore discarded in the following. The working zone was thus defined in a central domain corresponding to a dissipated energy range between 1900 J and 2500 J and a plug-displacement between 0.7 mm and 1 mm (Figure 6).

Figure 6.
Experimental measurements of plug-displacement, , obtained for 62 experimental welds as a function of the dissipated energy, , for constant welding force, . The optimized working zone is defined as being between 1900 J and 2500 J and between 0.7 and 1 mm, which correspond to the absence of welding defects (a lack of a joining zone and material ejection).

Figure 7.
Optical metallography images showing: (a) an adequate weld, (b) external lack of joining, (c) external and internal signs of melting and material ejection.
For a fixed dissipated energy, or even for the same set of applied () parameters, plug-displacement variance was nevertheless observed. Small variations in the clad and plug dimensions after machining and local assembly overheating, resulting in the material melting, could be the main source of these differences.
For a welding force of 4700 N, the working zone was defined experimentally in order to obtain adequate welds (Figure 7a). As the experimental analyses of the influence of welding force and other experimental parameters (geometry, position of pieces in respect to electrodes and so on) on the working zone would require multiplying the number of welding tests, numerical simulations were performed instead. These simulations allow additionally comparing the effect of the different welding parameters on the maximum temperature and cumulated plastic strain in order to better understand their effect on the working zone, and can thus be used for the further optimization of the welding parameters.
3. Numerical Simulation Approach
As discussed earlier, numerical simulations of the PRW process must take into account interactions between electrical, thermal and mechanical phenomena as well as the electro-thermal-mechanical contact conditions between the welded pieces and the electrodes. Moreover, an automatic remeshing procedure must be implemented in order to adapt the mesh during the simulation. A too-large deformation of the mesh alters the accuracy in the determination of the thermo-mechanical cycles experienced by the material during the welding process [13]. The following subsections are devoted to the development and numerical validation of a multi-physics numerical model for simulating the PRW process. Finite elements method (FEM) computations were applied, using the CEA Cast3M software (2022, Cast3M, Gif-Sur-Yvette, France) [28].
3.1. Geometry and Mesh
The PRW welding process was modeled considering a 2D axisymmetric geometry, representative of the clad, plug and electrode dimensions (Figure 8). The same mesh was used for the electrical, thermal and mechanical calculations, containing 15,305 quadrangle linear finite elements (QUA4 in the Cast3M library). The mesh close to the contact surface between the plug and the clad, where high thermal gradients and high strains are expected, was refined. Automatic remeshing was applied only in this zone.
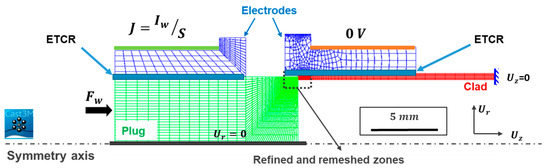
Figure 8.
2D mesh of the clad, plug and electrodes. Boundary and loading conditions are indicated.
3.2. Electro-Thermo-Mechanical Modeling
A sequential coupling between the electro-thermal calculation and the thermo-mechanical calculation was used. The first problem was defined by the electric charge conservation equation and the heat equation. In the same time step, the electrical phenomena were solved according to a steady-state analysis, while the thermal modeling was solved according to a transient nonlinear analysis. They are updated at each iteration of the time-step resolution loop until the convergence of both the electric potential and temperature. The convection and radiation phenomena were neglected due to the high heating and cooling rates observed during the PWR process [13,22,25]. The effect of both plastic deformation and friction energies is negligible if compared to the Joule effect on the assembly heating. For sake of simplification, only the last one was modeled. Finally, the static analysis is chained by solving the equilibrium equation of the mechanical model at each time step (Appendix A). The temperature-dependent material properties are updated at each iteration of the resolution loop of the electro-thermal model and at each time-step of the static analysis. The material mechanical behavior is considered to be linear elastic and perfectly plastic. Material data are presented in Appendix B. This method of ETM calculation is largely used in the modeling of the resistance welding process [13,25,29,30].
3.3. Electro-Thermal Contact Resistance (ECTR) Modeling
In this model, the ETCR at the interfaces between the clad and its electrode and between the plug and its electrode are also taken into account. The contact resistance is defined along the contact between the pieces and the electrodes. The discontinuity of the electric potential and temperature fields between two surfaces were described, respectively, by Equations (2) and (3):
and correspond to the electric current density and heat flow, respectively. and are the electrical potentials, and and are the temperatures at both pieces and electrode surfaces, respectively. The electrical and thermal contact resistance between pieces and electrodes are represented by and , respectively. Their temperature-dependent values were taken from the literature [13,24], for a configuration similar to the one investigated in this study.
Le Gloannec and co-workers [13,24] paid special attention to the calibration of both and values for a welding configuration similar to the one investigated in this work. They determined both the thermal and electric resistance by the inverse method for the “plug–electrode” interface, while the resistances for the “clad–electrode” interface were determined by an analytical method, using interface geometrical parameters. In this work, both resistances were taken as identical to the ones defined by these authors.
In this study, the ETCR between clad and plug was not modeled, and a mesh continuity was considered between them. It was shown that the ETCR for the “clad–plug” has a limited impact on the predicted results [13,24].
3.4. Contact Modeling
The mechanical contact between the welded pieces has a major effect on the welding process, particularly on the plug-displacement and the weld shape [22]. The tribological characteristics of the contact friction between the welded pieces under conditions close to those encountered during PRW in terms of temperature and strain rate are poorly known. In particular, the usual coefficient of the Coulomb’s friction law is difficult to estimate. Le Gloannec et al. [13] estimated the friction coefficient at 0.6 for a chamfered geometry by the inverse method. In this work, the value of this coefficient was also determined by means of an inverse method in order to obtain computed welding shapes similar to the ones observed experimentally. Computations were carried out using a friction coefficient equal to 0.35.
3.5. Boundary and Loading and Conditions
The following boundary and loading conditions were considered (Figure 8): (i) electrical, in which an electrical current density, , was applied on the outer surface of the plug side electrode, and the electric tension was imposed to the external surface of the clad side electrode; (ii) mechanical, in which a welding force, , was applied to the left surface of the plug, and the displacement along the direction was blocked at the end of the clad.
3.6. Electric Welding Power Calibration
The electric welding power, , can be expressed by:
The electric resistance, , is a function of the temperature, . Experimentally, can be defined as the sum of several elementary electric resistances related to the various welding components (plug and clad, copper alloy electrodes and jaws). The welding power also depends on the current, , which is an imposed parameter. During the welding process, the applied current is not constant, and values higher than the target ones were commonly measured (Figure 3a). Such variations are hardly controlled, although they may affect the temperature evolution during the welding process.
For the numerical simulations, only the resistances of the welding pieces and electrodes were taken into account (Figure 8), and the welding current intensity was considered constant. Differences between experimental and simulated welding powers, and , respectively, were thus expected. In order to correct such differences and improve computed predictions, an efficiency coefficient, , depending on the applied dissipated energy, was introduced. The simulated power is expressed as:
is adjusted by the inverse method, comparing the maximum computed temperature with the experimental measurement obtained from the thermocouples installed on the plug surface (Figure 2b). Due the short welding times and high heating kinetics observed during the PRW process, the estimation of the experimental temperature is a challenge. Specific parameters with a longer and lower were preferred to avoid problems related to the thermocouple response (Table 2). Only the value of the specified force was maintained (4700 N).
Table 2.
Specific welding parameters used for calibration of the simulated welding power.
The maximum temperatures measured at thermocouple TC1 (Figure 2b) as a function of the dissipated energy, , are shown and compared to the computed ones in Figure 9a. As expected, the predicted temperatures were significantly lower than the experimental ones with a parameter equal to one; that means . For each of the plotted experiments, we adjusted the value of in order to reach the experimental maximum temperatures. The adjusted values of as functions of are plotted in Figure 9b. From these values, a logarithmic function of the dissipated energy was identified. For the simulation of the other tests, the parameter was adjusted according to the logarithmic function presented in Figure 9b.

Figure 9.
(a) Maximum measured and simulated temperatures, , by TC1 for different values of the dissipated energy, . (b) Evolution of the efficiency coefficient, , as function of .
3.7. Material Properties
The electro-thermal properties, , , and , were taken from the literature [24]. The yield strength, , and Young’ modulus, , were derived from tensile stress–strain curves of 9Cr-ODS steel at different temperatures. The values of these parameters are provided in Appendix B. The volume density and Poisson’s ratio were taken as constant: and .
3.8. Model Validation
Experimental results obtained for the P91 steel were used for the validation of the computation results. Since this steel is submitted to the austenitic phase transformation at a well-defined temperature ( = 780 °C), the heat-affected zone (HAZ) can be easily identified after etching. Figure 10a compares the position and the size of both experimental and computed HAZ. Numerically, the HAZ was defined only by the zone where the temperature was exceeded, as metallurgical transformations were not taken into account in these simulations. It can be seen that the dimensions of the predicted HAZ (represented by solid green lines) was similar to the one obtained experimentally (indicated by dotted green lines). The evolution of plug-displacement during welding was also well-described with respect to the experimental measurements (Figure 10b).


Figure 10.
(a) Comparison of the position and dimensions of both experimental (dotted lines) and computed (solid line) HAZ of P91 weld. Computed HAZ is defined by elements submitted to temperatures higher than the temperature . (b) Comparison between experimental and computed plug-displacement curves.
4. Results and Discussion
4.1. Influence of the Dissipated Energy on the PWR Process
Numerical simulations were conducted by increasing the dissipated energy to values up to 3500 J with a fixed welding force ( = 4700 N). The computed plug-displacement values are plotted and compared to the experimental measurements in Figure 11 as a function of the dissipated energy. For energies lower than 2500 J, good agreement was found, with plug-displacement continuously increasing in both numerical predictions and experimental measurements. For higher energy values, numerical computations underestimated the plug-displacement.
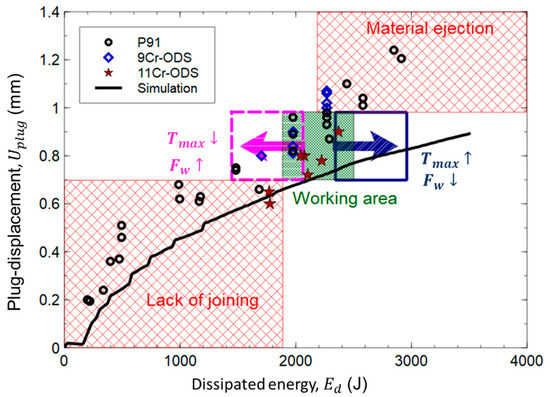
Figure 11.
Comparison between experimental measurements and numerical predictions of the plug-displacement, , as a function of the dissipated electrical energy, , for a fixed force . The effect of increasing or decreasing of on the position of the working zone (Section 2) is schematized by the rectangle with dashed and continuous pink and blue lines, respectively.
From these numerical simulations, predictions of plug-displacement, maximum temperature and cumulated plastic strain can be compared (Figure 12), allowing for the better understanding of the model response with respect to the applied dissipated energy. By increasing the value of , the heating induced by the Joule effect also increased, and therefore the maximum temperature was reached during the welding process. As the material mechanical strength drastically decreases with the temperature (Appendix B), notably the yield stress and plastic strain increases, and consequently the plug-displacement does as well.
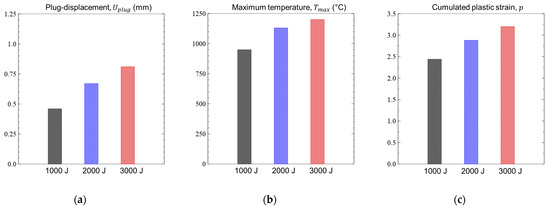
Figure 12.
Numerical predictions of (a) plug-displacement, ; (b) maximum temperature, ; and (c) cumulated plastic strain, , for different dissipated energies, . Values are extracted from a node located at the joint plane.
The maximum predicted temperature for = 3000 J was close to 1200 °C, while clear evidence of material melting was observed experimentally, indicating that the temperature locally surpassed the melting temperature of 1450 °C. The lower values of plug-displacement derived from numerical simulations would then be related to an underestimation of predicted temperatures. The friction coefficient between the welding pieces, assumed as constant during the entire welding process, combined with an inadequate description of contact evolution between the different elements during welding could also explain these results. Moreover, other phenomena like local assembly overheating, resulting in the material melting, were not taken into account in the proposed model, although they could significantly affect the final plug-displacement.
4.2. Influence of the Welding Force
To determine the working zone, the welding force value was chosen to be constant. However, the value of also has an effect on the weld quality. In order to address this issue, the value of was kept constant (2500 J), and simulations were conducted imposing two different forces: 2600 N and 7000 N. Figure 13 compares the temperature field derived from numerical computations carried out with the lowest welding force, 2600 N, and the highest one, 7000 N. These comparisons are made at the beginning of welding, meaning at 5 ms, in the middle of welding, at 50 ms and at the end of welding, at = 100 ms.
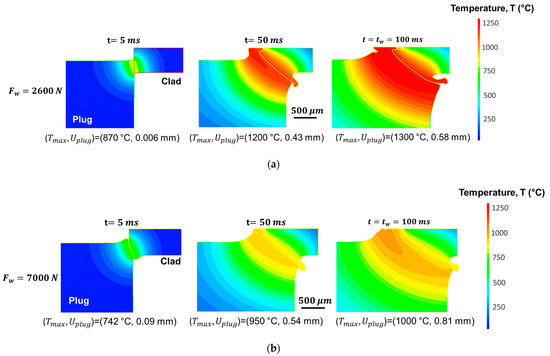
Figure 13.
Temperature field during welding obtained by imposing constant dissipated energy, , and different welding forces: (a) and (b) .
For a welding force of 2600 N, the heat induced by the Joule effect resulted in homogeneous heating at the joint plane; the maximum temperature reached after 5 ms was only 870 °C, while the plug-displacement barely changed. Only when the temperature was sufficiently high did the hottest zones begin to deform, forming inner and outer beads. The maximum temperature reached at 100 ms was 1300 °C, and the final plug-displacement was 0.58 mm. The high temperature attained during the process induced the high deformation of the inner and outer bead and a HAZ width of 1380 (Figure 13a). By comparing these results with those obtained with higher force (7000 N), at 5 ms a clear difference in the plug-displacement was first observed, as one can see on the deformed shapes presented in Figure 13. For a higher welding force, plastic deformation took place once a temperature of about 700 °C was achieved (not presented here). It was necessary to heat the pieces up to 1100 °C to plastically deform them when the welding force was of only 2600 N. By promoting the plastic deformation of both the plug and clad at lower temperatures, the initial contact surface between the clad and plug increased, which in turn decreased the electric current density, as well as the Joule effect and then the temperatures. At 50 ms, the maximum temperature was only 950 °C. At the end of the process, at 100 ms, a difference of −30% in the maximum temperature was obtained between both imposed welding forces, resulting in a HAZ about 35% smaller for the higher force.
Although the predicted inner and outer beads were higher with an applied force of 2600 N, at the end of the welding, the final plug-displacement for a force of 7000 N was about 28% higher. For the same dissipated energy of 2500 J, the plug displacement was 0.58 mm for a welding force of 2600 N and 0.81 mm for a force of 7000 N. It means that the former case would be outside the working zone presented in Figure 11. For lower welding forces, in order to obtain a plug-displacement within the working zone, equal to 0.7 mm, for example, a dissipated energy higher than 2500 J would be required. This increase in energy will results in a displacement of the working zone towards a higher energy (Figure 11). As a consequence, an increase in the maximum temperature will be observed, thus increasing the risk of material melting. On the contrary, for obtaining similar plug-displacement with higher welding forces, a dissipated energy lower than 2500 J is required. In this case, a decrease in the maximum temperatures achieved during welding will be observed (Figure 11).
4.3. Optimization of the Joint Plane Shape
In service, these welds will be submitted to elevated temperatures, high irradiation doses and a constant increase in the internal pressure induced by fission gases [31,32]. An adequate weld shape is required to insure the improved mechanical strength of the welded assembly.
The experimental observations reported during the course of the present study indicate that the mechanical strength of cladding assemblies are correlated with the zone submitted to higher plastic deformation and presenting higher hardness values [33]. These results are not presented in this paper and will be the subject of another publication. For () = (4700 N, 2000 J), the joint plane can be divided into two parts (Figure 14a): an internal joint plane, characterized by a higher plastic strain on both sides of the clad and the plug, almost oriented at 45° with respect to the clad (circled in red in Figure 14a), and an external joint plane, showing plastic strain localization on the plug side only and almost perpendicular to the clad longitudinal axis (bordered by a red dashed box in Figure 14a). Based on the simulation results, the internal joint plane is formed by the deformation of the plug and the clad with respect to each other, from the beginning of the process. The external joint plane is the result of the deformation of the plug in relation to the clad at the beginning of the process and then the deformation of this one when the temperature is high enough along the entire weld plane. The optimization of the shape of the joint plane was proposed to achieve a more homogeneous deformation in both the clad and the plug, with the formation of a joint plane inclined almost at 45° with respect to the clad axis in order to ensure the metallurgical continuity of the weld.

Figure 14.
Comparison of the influence of the welding force, and of the dissipated energy , on the computed cumulated plastic strain, p, field: (a) (, ) = (4700 N, 2000 J); (b) (, ) = (4700 N, 2500 J); (c) (, ) = (7000 N, 2000 J).
Figure 14 compares the effect of increasing the dissipated energy (Figure 14a,b) and the welding force values (Figure 14a,c) on the shape of the joint plane, along with the cumulated plastic strain field. The set of parameters () was selected to prevent the maximum temperature from exceeding the melting point and to obtain a plug-displacement ranging between 0.7 and 1 mm. By changing the dissipated energy or the welding force, a larger length of the weld plane was oriented 45° with respect to the clad. However, this slight difference does not seem sufficient to completely optimize the shape of the joint plane in order to improve the mechanical strength of cladding assemblies.
Figure 15 compares the results with the initial geometry on the shape of the joint plane and the cumulated plastic strain field to the results obtained with a modified geometry, presenting a chamfer at 45° on the contact surface between the plug and the clad. The evolution of the plastic strain field with the studied configuration is presented in Figure 15a, while the evolution of the plastic strain field with the modified geometry is shown in Figure 15b. The advantage of this second configuration stands in the localization of the deformation within the external bead of the clad and plug, resulting in a more homogeneous deformation of the external joint (Figure 15b). The angle of the internal joint plane decreased in comparison to the one obtained with the initial configuration (Figure 15). The decrease of this angle could affect the mechanical strength of this zone.
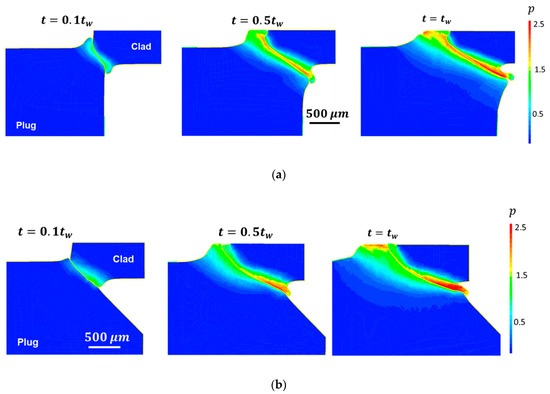
Figure 15.
Effect of the geometry of welding pieces on the cumulated plastic strain field and the shape of the joint plane during welding obtained with the: (a) studied welding pieces and the (b) proposed chamfered welding pieces.
Configurations with chamfers have been already studied [14,23,25]; however, this new configuration has not been investigated experimentally yet. The particularity of this configuration lies in the fact that the clad–plug contact with the chamfer is located under the clad electrode (as for the configuration studied presented in Figure 8). Moreover, the absence of an external bead compared to the configurations studied in the literature would avoid the post-weld machining of assemblies, which is difficult to realize in particular with stacked fuel cladding. An experimental optimization study of this geometry, by taking into account the characteristics of the chamfer, would be required. Preliminary welding experiments with the proposed geometry in order to confirm the numerical simulation results will be carried out.
5. Conclusions
A coupled experimental–simulation approach was proposed to investigate and optimize the PRW process applied to the ODS steel fuel cladding. The experimental welds allow assessing the effect of the dissipated energy on the weld integrity, in which a work zone was defined for a constant welding force of 4700 N. Within the working zone, delimited by a dissipated energy range from 1900 to 2500 J, welds were free of defects such as a lack of joining and material ejections, delimiting the measured plug displacement between 0.7 and 1 mm. Additionally, a numerical multi-physics model using the finite-element method was developed and validated in order to simulate the PRW and to assess the effect of the different welding parameters on the working zone. The numerical computation showed that:
- (i)
- The dissipated energy was identified as a key parameter controlling the PRW process. In particular, it was shown that, under a fixed load, the plug displacement varies almost linearly as a function of the dissipated energy;
- (ii)
- In the defined working zone, the maximum temperature reached in the weld remains well below the melting temperature. The increase in the value of dissipated energy leads to an increase in the maximum temperature reached in the weld and consequently in the cumulated plastic strain and in the plug-displacement values;
- (iii)
- The decrease of the welding force implies a higher energy input in order to keep constant the quality of the welds. However, this leads to an increase in the maximum temperatures reached during welding and, consequently, to a higher risk of material melting. Meanwhile, increasing the welding force reduces the actual energy required by the process, and as a consequence, the maximum temperatures reached during welding.
- (iv)
- The shape of the joint plane does not significantly depend on the applied process parameters. In order to introduce a sufficient amount of cumulated plastic deformation in the external part of the joint plane, which is confined between the clad-side electrode and the plug, a new geometry of the contact surfaces was proposed and studied numerically. If the plastic deformation is more homogenous on the outer part of the contact surfaces with this new geometry, the level of deformation did not seem sufficient to ensure a good-quality weld.
Author Contributions
Conceptualization, M.M.; methodology, M.M., D.G., S.P., G.H. and A.P.-Q.; software, M.M. and S.P.; validation, M.M.; formal analysis, M.M.; investigation, M.M.; resources, M.M; data curation, M.M.; writing—original draft preparation, M.M.; writing—review and editing, M.M., D.G., S.P., G.H. and A.P.-Q.; visualization, M.M.; supervision, D.G., S.P., G.H. and A.P.-Q.; project administration, D.G.; D.B. performed the tensile tests. All authors have read and agreed to the published version of the manuscript.
Funding
This research received no external funding.
Data Availability Statement
Data will be available on request to the corresponding author.
Acknowledgments
The authors gratefully acknowledge the support of the CEA research project MATNA, related to the Generation IV program.
Conflicts of Interest
The authors declare no conflict of interest.
Appendix A. Governing Equations for the ETM Modeling
- Electrical modeling
Electrical phenomena are described by the charge conservation equation, which allows the calculation of the electric potential field:
The volume current density vector is represented by and the electrical potential by . The electrical conductivity, , depends on the temperature, . In PRW simulations, the electromagnetic transient phase is generally negligible. Thieblemont [34] showed that the electrical phenomenon can be considered static and that the heat source generated by Joule effect, , can be expressed as a function of the electric potential by:
- Thermal modeling
The heat equation is applied to describe the thermal problem:
The temperature is calculated in the entire modeled domain, with the volume density, ; heat capacity, ; and thermal conductivity, , depending on the temperature. The heat source generated by the Joule effect, , is the same as in Equation (A3).
- Mechanical modeling
The mechanical behavior is described by the static equilibrium equation to calculate the resulting displacement and consequently the strain and stress fields:
where denotes the stress tensor.
Appendix B. Material Parameters
The values of the different material parameters are provided in Table A1.
Table A1.
Material parameters of the 9%Cr-ODS steel used in simulation.
Table A1.
Material parameters of the 9%Cr-ODS steel used in simulation.
| 25 | 440 | 2000 | 0.023 | 800 | 216.000 | 1.01 |
| 100 | 440 | 1900 | 0.0223 | 760 | 211.000 | 1.1 |
| 200 | 510 | 1700 | 0.0249 | 720 | 205.000 | 1.17 |
| 300 | 560 | 1510 | 0.0263 | 680 | 190.000 | 1.24 |
| 400 | 600 | 1350 | 0.0265 | 650 | 180.000 | 1.31 |
| 500 | 680 | 1200 | 0.0274 | 600 | 160.000 | 1.39 |
| 700 | 950 | 1000 | 0.0257 | 280 | 150.000 | 1.53 |
| 800 | 780 | 900 | 0.0253 | 200 | 115.000 | 1.6 |
| 900 | 680 | 850 | 0.029 | 180 | 115.000 | 2.4 |
| 1000 | 620 | 800 | 0.0265 | 50 | 114.000 | 2.4 |
| 1100 | 640 | 760 | 0.0273 | 10 | 90.000 | 1.01 |
| 1450 | 795 | 606 | 0.0328 | 5 | 30.000 | 1.1 |
References
- Oksiuta, Z.; Olier, P.; de Carlan, Y.; Baluc, N. Development and characterisation of a new ODS ferritic steel for fusion reactor application. J. Nucl. Mater. 2009, 393, 114–119. [Google Scholar] [CrossRef]
- Ukai, S.; Fujiwara, M. Perspective of ODS alloys application in nuclear environments. J. Nucl. Mater. 2002, 307–311, 749–757. [Google Scholar] [CrossRef]
- De Carlan, Y.; Bechade, J.-L.; Dubuisson, P.; Seran, J.-L.; Billot, P.; Bougault, A.; Cozzika, T.; Doriot, S.; Hamon, D.; Henry, J.; et al. CEA developments of new ferritic ODS alloys for nuclear applications. J. Nucl. Mater. 2009, 386–388, 430–432. [Google Scholar] [CrossRef]
- Ukai, S.; Ohtsuka, S.; Kaito, T.; Sakasegawa, H.; Chikata, N.; Hayashi, S.; Ohnuki, S. High-temperature strength characterization of advanced 9Cr-ODS ferritic steels. Mater. Sci. Eng. A 2009, 510–511, 115–120. [Google Scholar] [CrossRef]
- Huet, J.-J. Preparation and properties of oxide dispersion-strengthened ferritic alloys. Met. Powder Rep. 1985, 40, 155–158. [Google Scholar]
- Toualbi, L.; Cayron, C.; Olier, P.; Logé, R.; de Carlan, Y. Relationships between mechanical behavior and microstructural evolutions in Fe 9Cr–ODS during the fabrication route of SFR cladding tubes. J. Nucl. Mater. 2013, 442, 410–416. [Google Scholar] [CrossRef]
- Narita, T.; Ukai, S.; Kaito, T.; Ohtsuka, S.; Kobayashi, T. Development of two-step softening heat treatment for manufacturing 12Cr--ODS ferritic steel tubes. J. Nucl. Sci. Technol. 2004, 41, 1008–1012. [Google Scholar] [CrossRef]
- Karch, A.; Sornin, D.; Barcelo, F.; Bosonnet, S.; de Carlan, Y.; Logé, R. Microstructural characterizations of 14Cr ODS ferritic steels subjected to hot torsion. J. Nucl. Mater. 2015, 459, 53–61. [Google Scholar] [CrossRef]
- Singh, R.; Prakash, U.; Kumar, D.; Laha, K. Nano oxide particles in 18Cr oxide dispersion strengthened (ODS) steels with high yttria contents. Mater. Charact. 2022, 189, 111936. [Google Scholar] [CrossRef]
- Sun, D.; Liang, C.; Shang, J.; Yin, J.; Song, Y.; Li, W.; Liang, T.; Zhang, X. Effect of Y2O3 contents on oxidation resistance at 1150 °C and mechanical properties at room temperature of ODS Ni-20Cr-5Al alloy. Appl. Surf. Sci. 2016, 385, 587–596. [Google Scholar] [CrossRef]
- Molian, P.A.; Yang, Y.M.; Patnaik, P.C. Laser welding of oxide dispersion-strengthened alloy MA754. J. Mater. Sci. 1992, 27, 2687–2694. [Google Scholar] [CrossRef]
- Lindau, R.; Klimenkov, M.; Jäntsch, U.; Möslang, A.; Commin, L. Mechanical and microstructural characterization of electron beam welded reduced activation oxide dispersion strengthened—eurofer steel. J. Nucl. Mater. 2011, 416, 22–29. [Google Scholar] [CrossRef]
- Le Gloannec, B.; Doyen, O.; Pouvreau, C.; Doghri, A.; Poulon-Quintin, A. Numerical simulation of resistance upset welding in rod to tube configuration with contact resistance determination. J. Mater. Process. Technol. 2016, 238, 409–422. [Google Scholar] [CrossRef]
- Corpace, F.; Monnier, A.; Grall, J.; Manaud, J.-P.; Lahaye, M.; Poulon-Quintin, A. Resistance upset welding of ODS steel fuel claddings—evaluation of a process parameter range based on metallurgical observations. Metals 2017, 7, 333. [Google Scholar] [CrossRef]
- De Burbure, S. Resistance butt welding of dispersion-hardened ferritic steels. In Proceedings of the Advances in Welding Processes 3rd International Conference, Harrogate, UK, 7–9 May 1974; pp. 7–9. [Google Scholar]
- Seki, M.; Hirako, K.; Kono, S.; Kihara, Y.; Kaito, T.; Ukai, S. Pressurized resistance welding technology development in 9Cr-ODS martensitic steels. J. Nucl. Mater. 2004, 329–333, 1534–1538. [Google Scholar] [CrossRef]
- Doyen, O.; Gloannec, B.L.; Deschamps, A.; Geuser, F.D.; Pouvreau, C.; Poulon-Quintin, A. Ferritic and martensitic ODS steel resistance upset welding of fuel claddings: Weldability assessment and metallurgical effects. J. Nucl. Mater. 2019, 518, 326–333. [Google Scholar] [CrossRef]
- Jerred, N.; Zirker, L.; Charit, I.; Cole, J.; Frary, M.; Butt, D.; Meyer, M.; Murty, K.L. Pressure Resistance Welding of High Temperature Metallic Materials; Idaho National Laboratory (INL): Idaho Falls, ID, USA, 2010. [Google Scholar]
- Goncalves, D. CEA Internal Report (Private Communication). 2020. [Google Scholar]
- Lienert, T.J.; Lear, C.R.; Steckley, T.E.; Lindamood, L.R.; Gould, J.E.; Maloy, S.A.; Eftink, B.P. Projection-capacitor discharge resistance welding of 430 stainless steel and 14YWT. J. Manuf. Process. 2022, 75, 1189–1201. [Google Scholar] [CrossRef]
- Zirker, L.R.; Bottcher, J.H.; Shikakura, S.; Tsai, C.L.; Hamilton, M.L. Fabrication of Oxide Dispersion Strengthened Ferritic Clad Fuel Pins; Argonne National Lab.: Lemont, IL, USA, 1991. [Google Scholar]
- Corpace, F. Soudage par Résistance du Gainage Combustible ODS d’un Réacteur Nucléaire de 4ème Génération. Ph.D. Thesis, Université Sciences et Technologies—bordeaux I, Bordeaux, France, 2011. [Google Scholar]
- Corpace, F.; Monnier, A.; Poulon Quintin, A.; Manaud, J.-P. Resistance upset welding of an ODS steel fuel cladding—identification of the thermal and mechanical phenomena using a numerical simulation. Mater. Et Tech. 2012, 100, 291–298. [Google Scholar] [CrossRef]
- Le Gloannec, B. Modifications Microstructurales sous Sollicitations Thermomécaniques Sévères: Application au Soudage par Résistance des Gaines de Combustibles en Aciers ODS. Ph.D. Thesis, Université de Bordeaux, Bordeaux, France, 2016. [Google Scholar]
- Feng, G.; Lin, J.; Yang, J.; Liang, Z.; Lu, L.; Lei, Y.; Fu, H. Numerical modeling of pressure resistance welding of zirconium alloy tube-end plug joint. Int. J. Adv. Manuf. Technol. 2022, 121, 3337–3350. [Google Scholar] [CrossRef]
- Toualbi, L. Optimisation de la Gamme de Fabrication de Tubes en Acier Renforcés par une Dispersion Nanométrique D’oxydes (ODS): Compréhension des Relations Microstructures/Propriétés Mécaniques. Ph.D. Thesis, Ecole Nationale Supérieure des Mines de Paris, Paris, France, 2012. [Google Scholar]
- Toualbi, L.; Cayron, C.; Olier, P.; Malaplate, J.; Praud, M.; Mathon, M.-H.; Bossu, D.; Rouesne, E.; Montani, A.; Logé, R.; et al. Assessment of a new fabrication route for Fe–9Cr–1W ODS cladding tubes. J. Nucl. Mater. 2012, 428, 47–53. [Google Scholar] [CrossRef]
- Cast3M CEA Software Cast3M. Available online: http://www-cast3m.cea.fr (accessed on 19 December 2022).
- Monnier, A.; Froidurot, B.; Jarrige, C.; Meyer, R.; Teste, P. A coupled-field simulation of an electrical contact during resistance welding. In Proceedings of the Electrical Contacts—The 52nd IEEE Holm Conference on Electrical Contacts, Montreal, QC, Canada, 25–27 September 2006; pp. 95–102. [Google Scholar]
- Biele, L.; Schaaf, P.; Schmid, F. Method for contact resistance determination of copper during fast temperature changes. J. Mater. Sci. 2021, 56, 3827–3845. [Google Scholar] [CrossRef]
- Ukai, S.; Ohtsuka, S.; Kaito, T.; de Carlan, Y.; Ribis, J.; Malaplate, J. Oxide dispersion-strengthened/ferrite-martensite steels as core materials for generation IV nuclear reactors. In Structural Materials for Generation IV Nuclear Reactors; Yvon, P., Ed.; Woodhead Publishing: Sawston, Cambridge, UK, 2017; pp. 357–414. ISBN 978-0-08-100906-2. [Google Scholar]
- Sornin, D.; Ehrnstén, U.; Mozzani, N.; Rantala, J.; Walter, M.; Hobt, A.; Aktaa, J.; Oñorbe, E.; Hernandez-Mayoral, M.; Ulbricht, A.; et al. Creep properties of 9Cr and 14Cr ODS tubes tested by inner gas pressure. Metall. Mater. Trans. A 2021, 52, 3541–3552. [Google Scholar] [CrossRef]
- Mabrouki, M.; Gonçalves, D.; Pascal, S.; Bertheau, D.; Hénaff, G.; Poulon-Quintin, A. Caractérisation de la tenue mécanique des assemblages gaine-bouchon en acier ODS obtenus par soudage par resistance. In Proceedings of the Conférence Internationale Matériaux, Lille Grand Palais, Lille, France, 25 October 2022. [Google Scholar]
- Thieblemont, É. Modélisation du Soudage par Résistance par Points. Ph.D. Thesis, Institut National Polytechnique de Lorraine, Nancy, France, 1992. [Google Scholar]


Disclaimer/Publisher’s Note: The statements, opinions and data contained in all publications are solely those of the individual author(s) and contributor(s) and not of MDPI and/or the editor(s). MDPI and/or the editor(s) disclaim responsibility for any injury to people or property resulting from any ideas, methods, instructions or products referred to in the content. |
© 2023 by the authors. Licensee MDPI, Basel, Switzerland. This article is an open access article distributed under the terms and conditions of the Creative Commons Attribution (CC BY) license (https://creativecommons.org/licenses/by/4.0/).