Article

EBSD Analysis of Hot Deformation Behavior of Oxide-Doped Molybdenum Alloys

1
School of Materials Science and Engineering, Henan University of Science and Technology, Luoyang 471023, China
2
National Joint Engineering Research Center for Abrasion Control and Molding of Metal Materials, Henan University of Science and Technology, Luoyang 471003, China
*
Authors to whom correspondence should be addressed.
Metals 2023, 13(2), 238; https://doi.org/10.3390/met13020238
Submission received: 10 December 2022 / Revised: 21 January 2023 / Accepted: 25 January 2023 / Published: 27 January 2023

Abstract

:
Hot compression tests of Mo–1.5 wt% Al2O3/ZrO2 molybdenum alloys were carried out using the Gleeble–1500 simulator at 0.01 s−1−5 s−1 strain rates and 1000–1500 °C deformation temperatures. The microstructural changes of the alloy at 1000–1500 °C were studied. The changes in the hot deformation process for the Mo−1.5 wt% Al2O3/ZrO2 molybdenum alloys were analyzed by means of EBSD. The ZrO2 particles had a greater effect on improving the thermal deformation resistance of molybdenum alloys than did the Al2O3 particles. The activation energy of the molybdenum alloy doped with ZrO2 (403.917 kJ/mol) was lower than that of the molybdenum alloy doped with Al2O3 (440.314 kJ/mol). Due to the occurrence of recrystallization, the intensity of {100} the texture first increased and, then, dropped down with increase in the temperature, while the change law of {111} texture was the opposite. Above 1200 °C, the higher deformation temperature made the texture more random by lowering the texture intensity. The dislocation density was sacrificed to promote recrystallization. When dynamic recrystallization occurred, the sub–grain boundaries absorbed dislocations and transformed them into high–angle grain boundaries, resulting in a decrease in dislocation density and an increase in high–angle grain boundaries at high temperatures and low strain rates. At 0.01 s−1 strain rate, the average grain size of Mo–1.5 wt% ZrO2 alloy increased from 2.38 μm to 4.67 μm, and the proportion of large angle grain boundaries increased from 59.8% to 86.6%.

1. Introduction

Molybdenum (Mo), a refractory metal, maintains a body-centered cubic (Bcc) crystal structure from ambient temperature up to 2610 °C (melting point). The high stability, creep resistance and thermal conductivity of Mo-based alloys make them attractive for many high-temperature applications [1,2,3].The inevitable impurity elements in Mo alloys, such as O, and N, particularly when these impurities are biased at the grain boundaries [4,5,6,7], seriously affect their comprehensive performances. Oxides doped into molybdenum alloys play an important part in changing the distribution of impurities at grain boundaries, refining grains and impeding dislocation movement, which has a significant impact on the improvement of strength and ductility [8,9,10]. Oxides improve the mechanical properties of molybdenum alloys by inhibiting grain growth and hindering dislocation movement. In contrast to rare earth oxides, the benefits of ceramic oxides are their high melting point, high strength, hardness, excellent chemical stability and wear resistance, etc. Al2O3 and ZrO2 doped into molybdenum alloys as the second phase are scattered at grain boundaries or in crystals, which changes the dislocation configuration and distribution of the molybdenum matrix, improving the crack propagation resistance, ductility and mechanical properties of the molybdenum matrix.
Liu et al. [11] prepared Mo–Y–Ce molybdenum alloys by means of the liquid–solid doping method. The addition of rare earth oxides refined grains and improved the tensile properties of the molybdenum alloys. Liu et al. [12] used a liquid–liquid doping technique to prepare nanoscale La2O3–Mo alloys. Zhou et al. [13] prepared pure molybdenum and Al2O3−doped molybdenum alloys, using a hydrothermal method. The addition of Al2O3 increased the recrystallization temperature of the molybdenum alloy by more than 200 °C, and the strength of the Al2O3−doped Mo alloys after annealing at 1000 °C, 1100 °C, 1200 °C and 1300 °C increased by 72%, 54%, 73% and 76%, respectively, with a very significant enhancement effect. Cui et al. [14] prepared Mo–ZrO2 alloys by a hydrothermal method. The addition of ZrO2 delayed the occurrence of recrystallization, the maximum tensile stress at 1400 °C increased by 1.5 times more than that of pure molybdenum, and the area shrinkage rate increased by 5 times. The above study illustrated that the addition of oxides raised the recrystallization temperature of molybdenum alloys and effectively prevented dislocation movement; thus, achieving an enhanced high−temperature strength for molybdenum alloys. Hu [15] et al. studied the hot deformation resistance of TZM–La2O3. Rare earth oxides in TZM alloy effectively increased the deformation resistance of the TZM alloy at high temperatures. Chaudhuri et al. [16] analyzed the thermal rheological behavior of TZM alloy and its organizational changes at the strain rate of 0.001–10 s−1 and at 1400–1700 °C. The results showed that the stress–strain curves exhibited work hardening at low temperatures and high strain rates and flow softening at high temperatures and low strain rates. Oxide dispersion reinforced alloys (ODS–Mo alloys) are widely used in machinery, aerospace and electron industries. The presented research was primarily concerned with recrystallization and mechanical strength at high temperatures, and less so with thermal rheological behaviors. Therefore, a study of the hot deformation behavior of ODS–Mo alloys is essential.
We prepared oxide−doped molybdenum alloys with different doping amounts in the previous stage, and found that molybdenum alloys with a doping amount of 1.5wt% had better comprehensive performance, so we mainly focused on Mo–1.5wt% ZrO2/Al2O3. In this paper, the rheological behaviors of Mo–Al2O3 and Mo–ZrO2 alloys were studied, based on fitted intrinsic constitutive equations at 1000–1500 °C and a wide range of strain rates (0.01–5 s−1). Electron backscatter diffraction (EBSD) was used to analyze the changes in grain orientation and texture during thermal deformation, the changes of dislocation density during dynamic recovery (DRV) and dynamic recrystallization (DRX), and their effects on the microstructure, with the mechanism being clarified.

2. Experimental Section

2.1. Material Preparation

The deformed materials were Mo–1.5wt% Al2O3 and Mo–1.5wt% ZrO2. The molybdenum alloy powders were prepared using ammonium tetramolybdate ((NH4)2Mo4O13·2H2O), zirconium nitrate and aluminum nitrate ((Zr(NO3)4·3H2O, Al(NO3)3·9H2O) as raw materials in a hydrothermal method. During the grinding process, an appropriate amount of Y2O3 was added to stabilize the zirconia crystals (molar ratio of Zr to Y 88:12) to prevent the crystallization of zirconia under large temperature changes. Molybdenum alloy rods with a 7.5 mm diameter were prepared by cold isostatic pressing, pressureless sintering and rotary swaging. Figure 1 shows the method of making the molybdenum alloys, and Figure 2 shows the schematic diagram of the liquid–liquid doping process.

2.2. Experimental Procedures

The specimens were machined into Φ7.5 × 11.25 mm cylinders for thermal compression tests. The specimens were subjected to compression tests using a Gleeble−1500D thermal simulation tester (DSI, St. Paul, MN, USA) deformation temperatures of 1000–1500 °C and at strain rates of 0.01–5 s−1, as shown in Figure 3. In this process, the heating speed was controlled at 20 °C/s, and held at this temperature for 3 min. The compression ratio of the specimens was 55% (a true strain of 0.8).
The samples after the thermal compression test were sliced open along the radial direction, and the microstructural evolution of the Al2O3–/ZrO2–doped molybdenum alloys was investigated. The specimens were alkali etched in a corrosive solution (potassium ferricyanide, sodium hydroxide and distilled water) and the microstructure was observed with a field−emission scanning electron microscope (FESEM, JSM−IT800 SHL, JEOL, Tokyo, Japan). The specimens for the electron backscatter diffraction (EBSD) analyses were first taken for mechanical polishing and then polished within the crushed specimen center cross-section using an argon ion cross-section polisher (IB-19530CP, JEOL, Tokyo, Japan). Under various circumstances, the textures and dislocation densities were measured and analyzed by using an EBSD detector (C-Nano, Oxford Instruments, Oxford, Britain), with the EBSD data processed by the AZtecCrystal software (2.1, AZtecCrystal, Oxford Instruments, Abingdon, UK).

3. Results

3.1. True Stress–True Strain Curve

The true stress–true strain curves of the Mo-1.5wt% Al2O3 and Mo-1.5wt% ZrO2 alloys deformed are shown in Figure 4. During thermal deformation, as strain increases, the flow stress decreases, because of DRV, DRX and other softening mechanisms which occur [17]. Steady-state behavior may occur in the stress–strain curves resulting from the simultaneous action of work hardening, DRX and DRV. By analyzing the changes of stress with temperature and deformation rate, it is possible to better understand the microscopic mechanism of high temperature deformation. In actual production, a larger strain rate is used. Therefore, it was also necessary to study the variation of flow stresses under large strains.
According to the curves, it can be seen that the enhancement effect of the Mo–1.5wt% ZrO2 alloy was more obvious than that of the Mo–1.5wt% Al2O3. The flow stress was significantly affected by the temperature and strain rate of the deformation. With other conditions remaining unchanged, the flow stress increased with decrease of the deformation temperature and increase of the strain rate. Under different deformation conditions, when the strain was small, the flow stress increased rapidly, presenting work hardening. However, after work hardening, the flow stress presented two trends. One trend was that the flow stress decreased with the increase of strain, which became flow softening. This was caused by dynamic recrystallization (DRX) and dynamic recovery (DRV), which usually occur under the condition of high temperature and low strain (1200–1500 °C, 0.01–0.1s−1). The other trend was that the flow stress continued to increase slowly with the strain until the steady state. [18]. When the deformation rate was 5 s−1 (Figure 4d), the stress value at 1000–1300 °C showed an upward trend as the strain rose, indicating that the softening mechanism was not obvious at a high strain rate. In summary, the thermos–rheological curves of the alloys exhibited work hardening in the beginning, and then either flow softening or steady−state behavior, and the softening effect depended on the strain rate and temperature.

3.2. Microstructural Evolution

Figure 5 shows the microstructure of the alloy of Mo–1.5wt% ZrO2 at 1000–1500 °C and a strain rate of 0.01 s−1, which could explain the changes in the flow stress curves in Figure 4 from the point of view of the microstructural evolutionary mechanism. At 1000–1100 °C, the deformed grains remained perpendicular to the compression direction, with no obvious recrystallized grains appearing. Therefore, the softening mechanism was mainly DRV, and the change in microstructure was not obvious. At 1200 °C, some of the deformed grains could be found at the grain boundaries, where recrystallization had started to occur. The quantity of recrystallized grains increased at 1300 °C. Figure 5e is the microstructure image at 1400 °C. It can be seen that there were more grains in the equiaxed state, compared to 1300 °C, and, during the compression process, some equiaxed grains were continuously compressed to form deformed grains. Figure 5f shows that, at 1500 °C, the molybdenum grains were partially grown, compared with those at 1400 °C, and the equiaxed grains were compressed at the same time. The beginning recrystallization temperatures of the oxides doping the molybdenum alloys were increased by more than 200–400 °C, compared with that of pure molybdenum (about 800–1000 °C).

3.3. Constitutive Equations

Thermal deformation is a thermally activated course, which is affected by stress, temperature, and deformation rate. Previously, various constitutive models were constructed to predict and explain thermal deformation behavior. Among them, under a variety of thermal deformation circumstances, the flow stress may be precisely predicted by the Arrhenius model. [19]. The constitutive equation suggested by Sellars [20] and McTegart [21] is widely used to represent the relationship between flow stress (σ), temperature (T) and deformation rate (έ) during thermal deformation.
Equations (1) and (2) are applied to low and high stress levels, respectively, and Equation (3) can be applied to all cases. These equations can be expressed as follows:
ε ˙ = A 1 σ n 1 e x p Q R T   ( α σ < 0.8 )
ε ˙ = A 2 e x p β σ e x p Q R T   ( α σ > 1.2 )
ε ˙ = A s i n h α σ n e x p Q R T   ( For   all )
Z = s i n h α σ n = ε ˙ e x p Q R T
where A, A1, A2, α, β, n1 and n2 are material constants, Q is activation energy (J/mol), T is the absolute temperature (K) and R is the universal gas constant (R = 8.31 J/mol.K).
The effect of temperature and deformation rate on the rheological stress is defined according to Zener–Hollomon, where Q is the self−diffusion activation energy of dislocation slip and climbing to form the lattice. Take the logarithm of both sides of Equations (1)–(3) to yield:
ln ε ˙ = n 1 ln σ + ln A 1 Q R T
ln ε ˙ = β σ + ln A 2 Q R T
ln ε ˙ = n ln s i n h α σ Q R T + ln A
where n 1 is the average of ln ε ˙ and ln σ slopes, β is the average of ln ε ˙ and σ is slopes, as shown in Figure 6a,b.
For the Mo–1.5wt% Al2O3 alloy: n 1 = 16.42 and β = 0.074, α = β / n 1 = 0.0045 , and n is the average of ln ε ˙ and ln s i n h α σ slopes, with n = 12.208 , as shown in Figure 6c. Substituting these results in Equation (8) yields the alloy thermal activation energy, with the average activation energy Q = 440.31   kJ / mol .
Q = R ln ε ˙ ln s i n α σ T ln s i n h α σ 1 / T = R n S
S is the average value of the slope of ln s i n h α σ 1000 / T , with S = 4.34, as shown in Figure 6d.
Figure 7a shows the linear relationship between ln Z and ln s i n h α σ :
ln Z = ln A + n ln s i n h α σ
The lnA is the intercept of Figure 7a, with lnA = 32.09 available. Thus, the constitutive equation of the Mo–1.5 wt% Al2O3 alloy can be expressed as:
ε ˙ = e 32.09 s i n h 0.0045 12.21 e x p 440314 R T
For the Mo–1.5wt% ZrO2 alloy: n 1 = 16.073 ,   β = 0.0668 ,   α = β / n 1 = 0.0042 ,   n = 11.98 ,   Q = 403.92   K J / m o l ,   S = 4.056   and   l n A = 29.43 , shown as in Figure 8 and Figure 7b. Based on the above equations, the constitutive equations of the Mo–1.5wt%ZrO2 alloy Equation (11) were constructed in the same way:
ε ˙ = e 29.43 s i n h 0.0042 11.98 e x p 403917 R T
It may be obtained from Equations (10) and (11) that the activation energy of Mo–1.5wt% ZrO2 was 403.92 KJ/mol and that the activation energy of Mo-1.5wt% Al2O3 alloy was 440.31 KJ/mol. Therefore, ZrO2 lowered the activation energy of molybdenum alloys more effectively. The smaller the thermal activation energy, the lower the energy barrier to be crossed when plastic deformation occurs, and the easier it is for the material to deform, making it easier to process, and the better the plasticity of the alloy. The results indicated that the Mo–1.5wt% ZrO2 had higher plasticity than the Mo–1.5wt% Al2O3 alloy. Meanwhile, the compressive strength of the ZrO2–doped molybdenum alloy was higher than the Mo–1.5wt% Al2O3 alloy at the same strain rate. The higher plasticity and compressive strength indicated that the enhancement effect of doping ZrO2 was better than that of doping Al2O3.

3.4. Strain Compensation
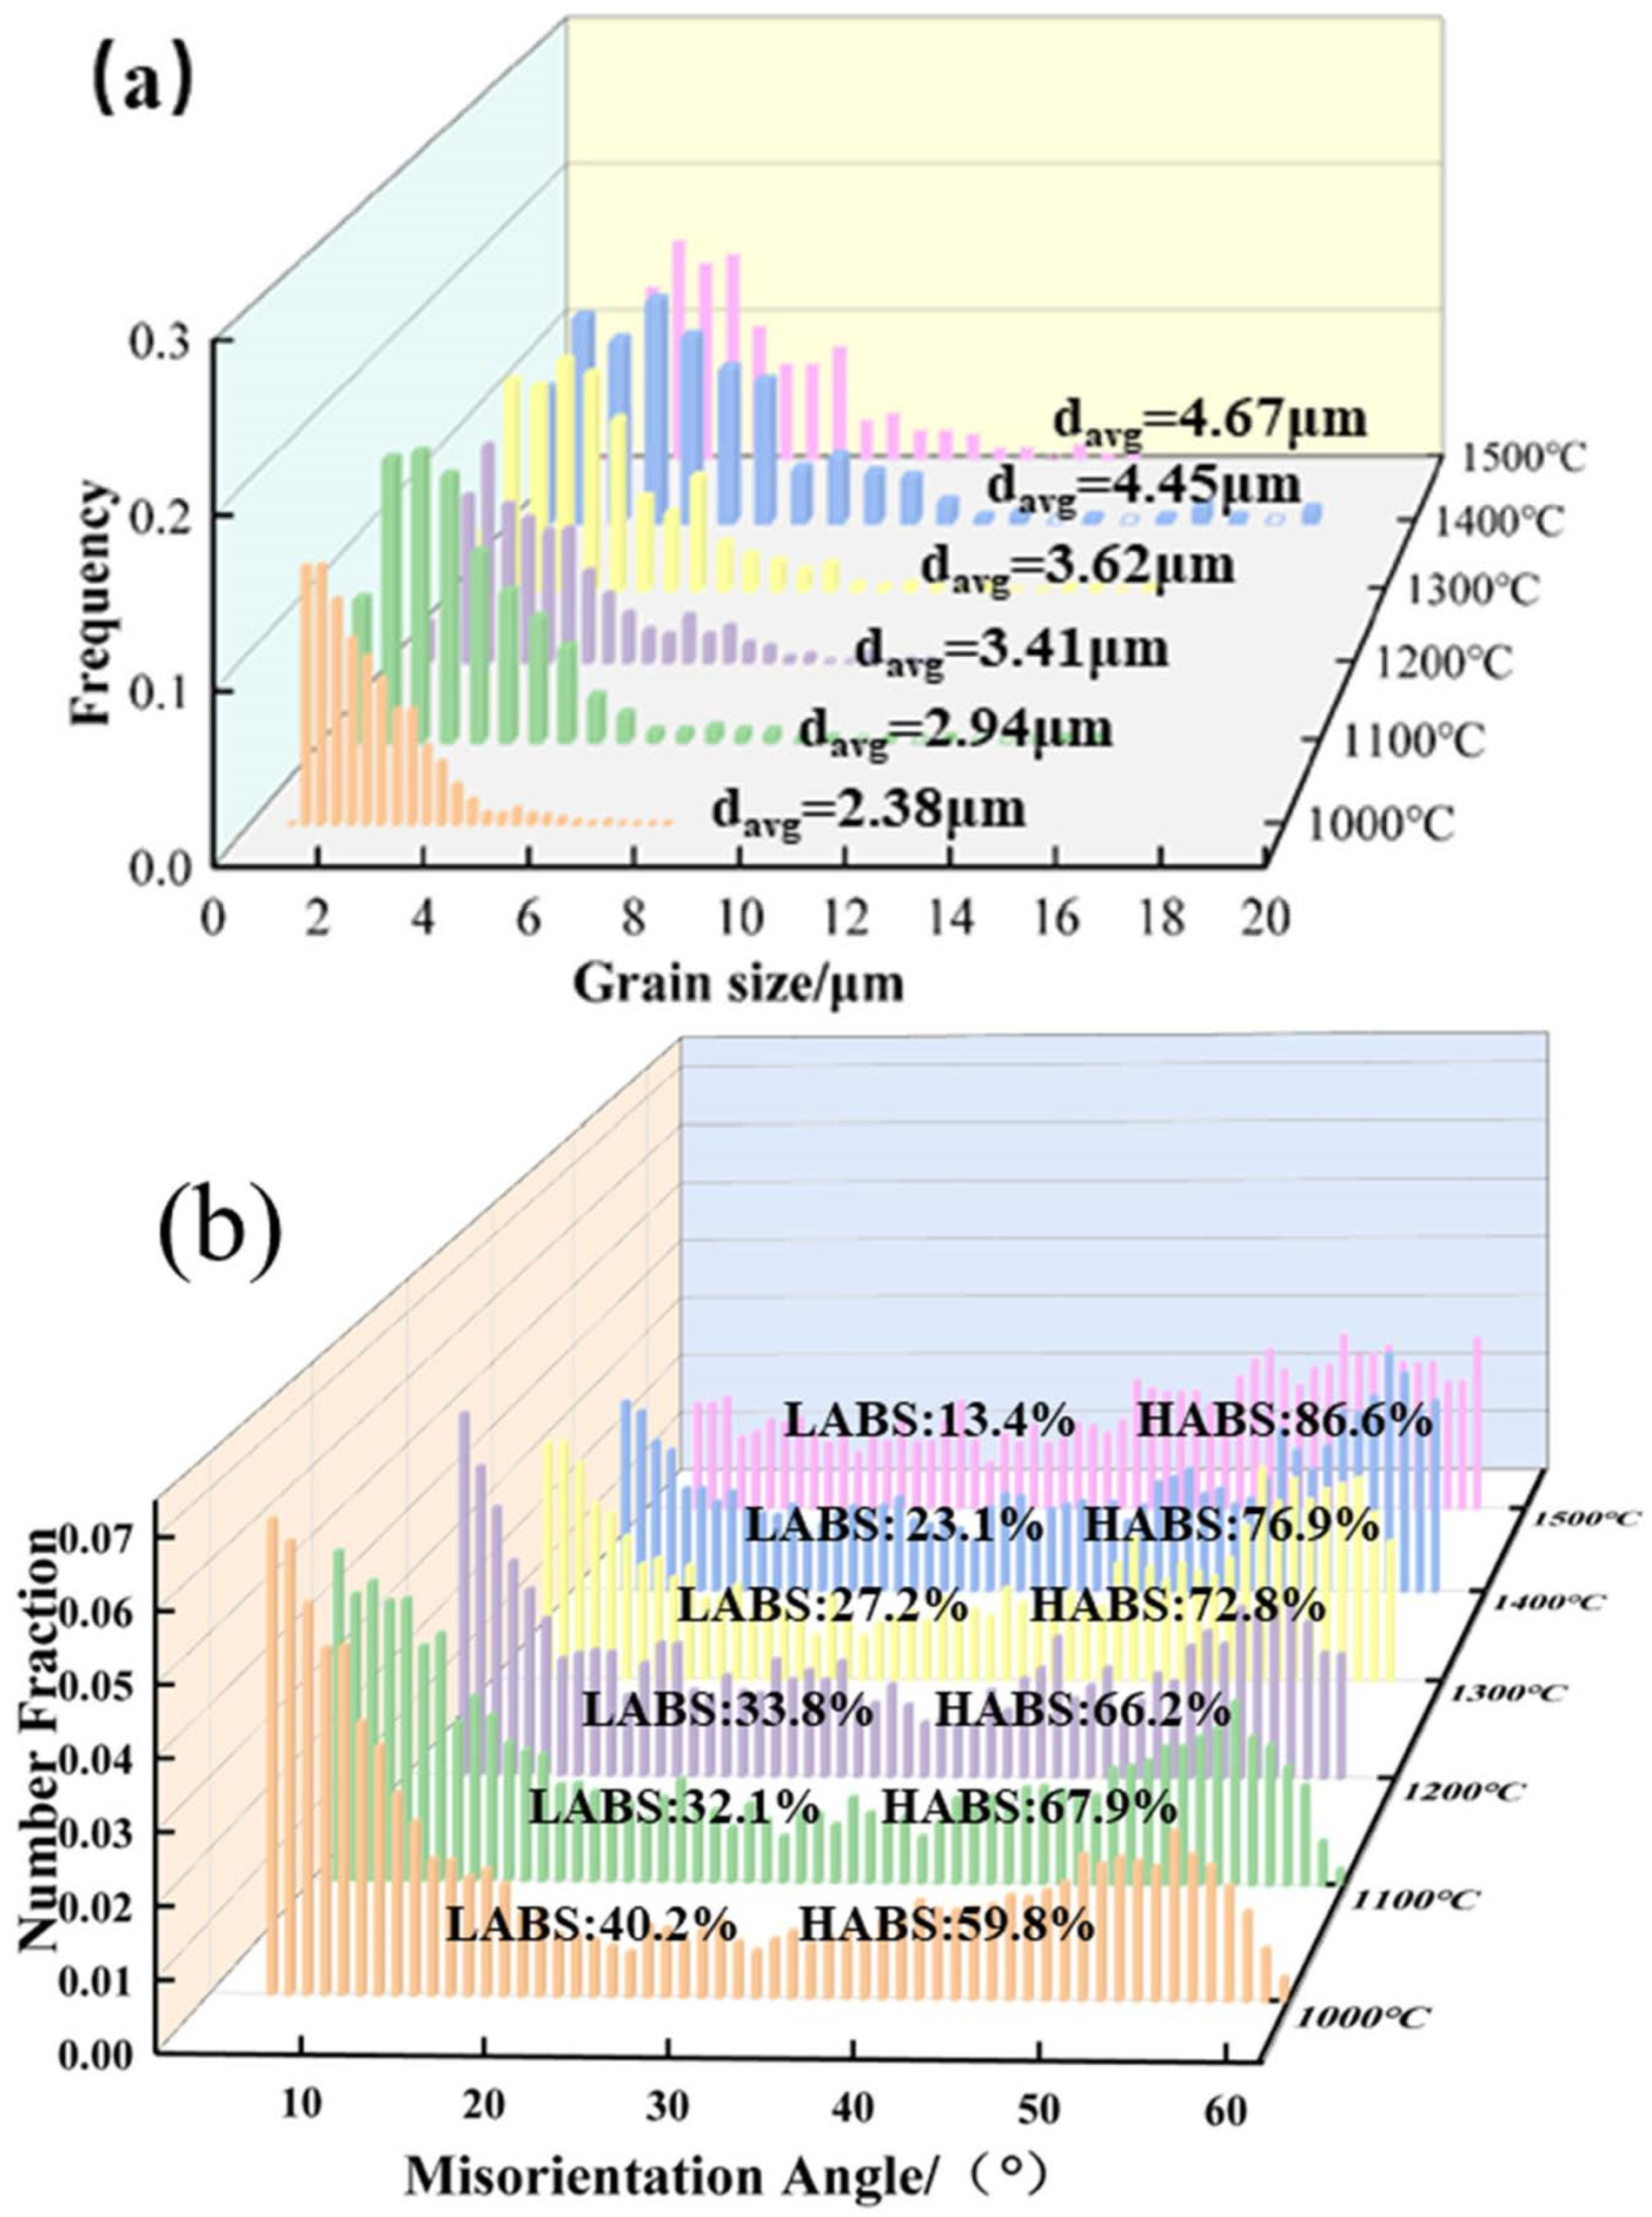
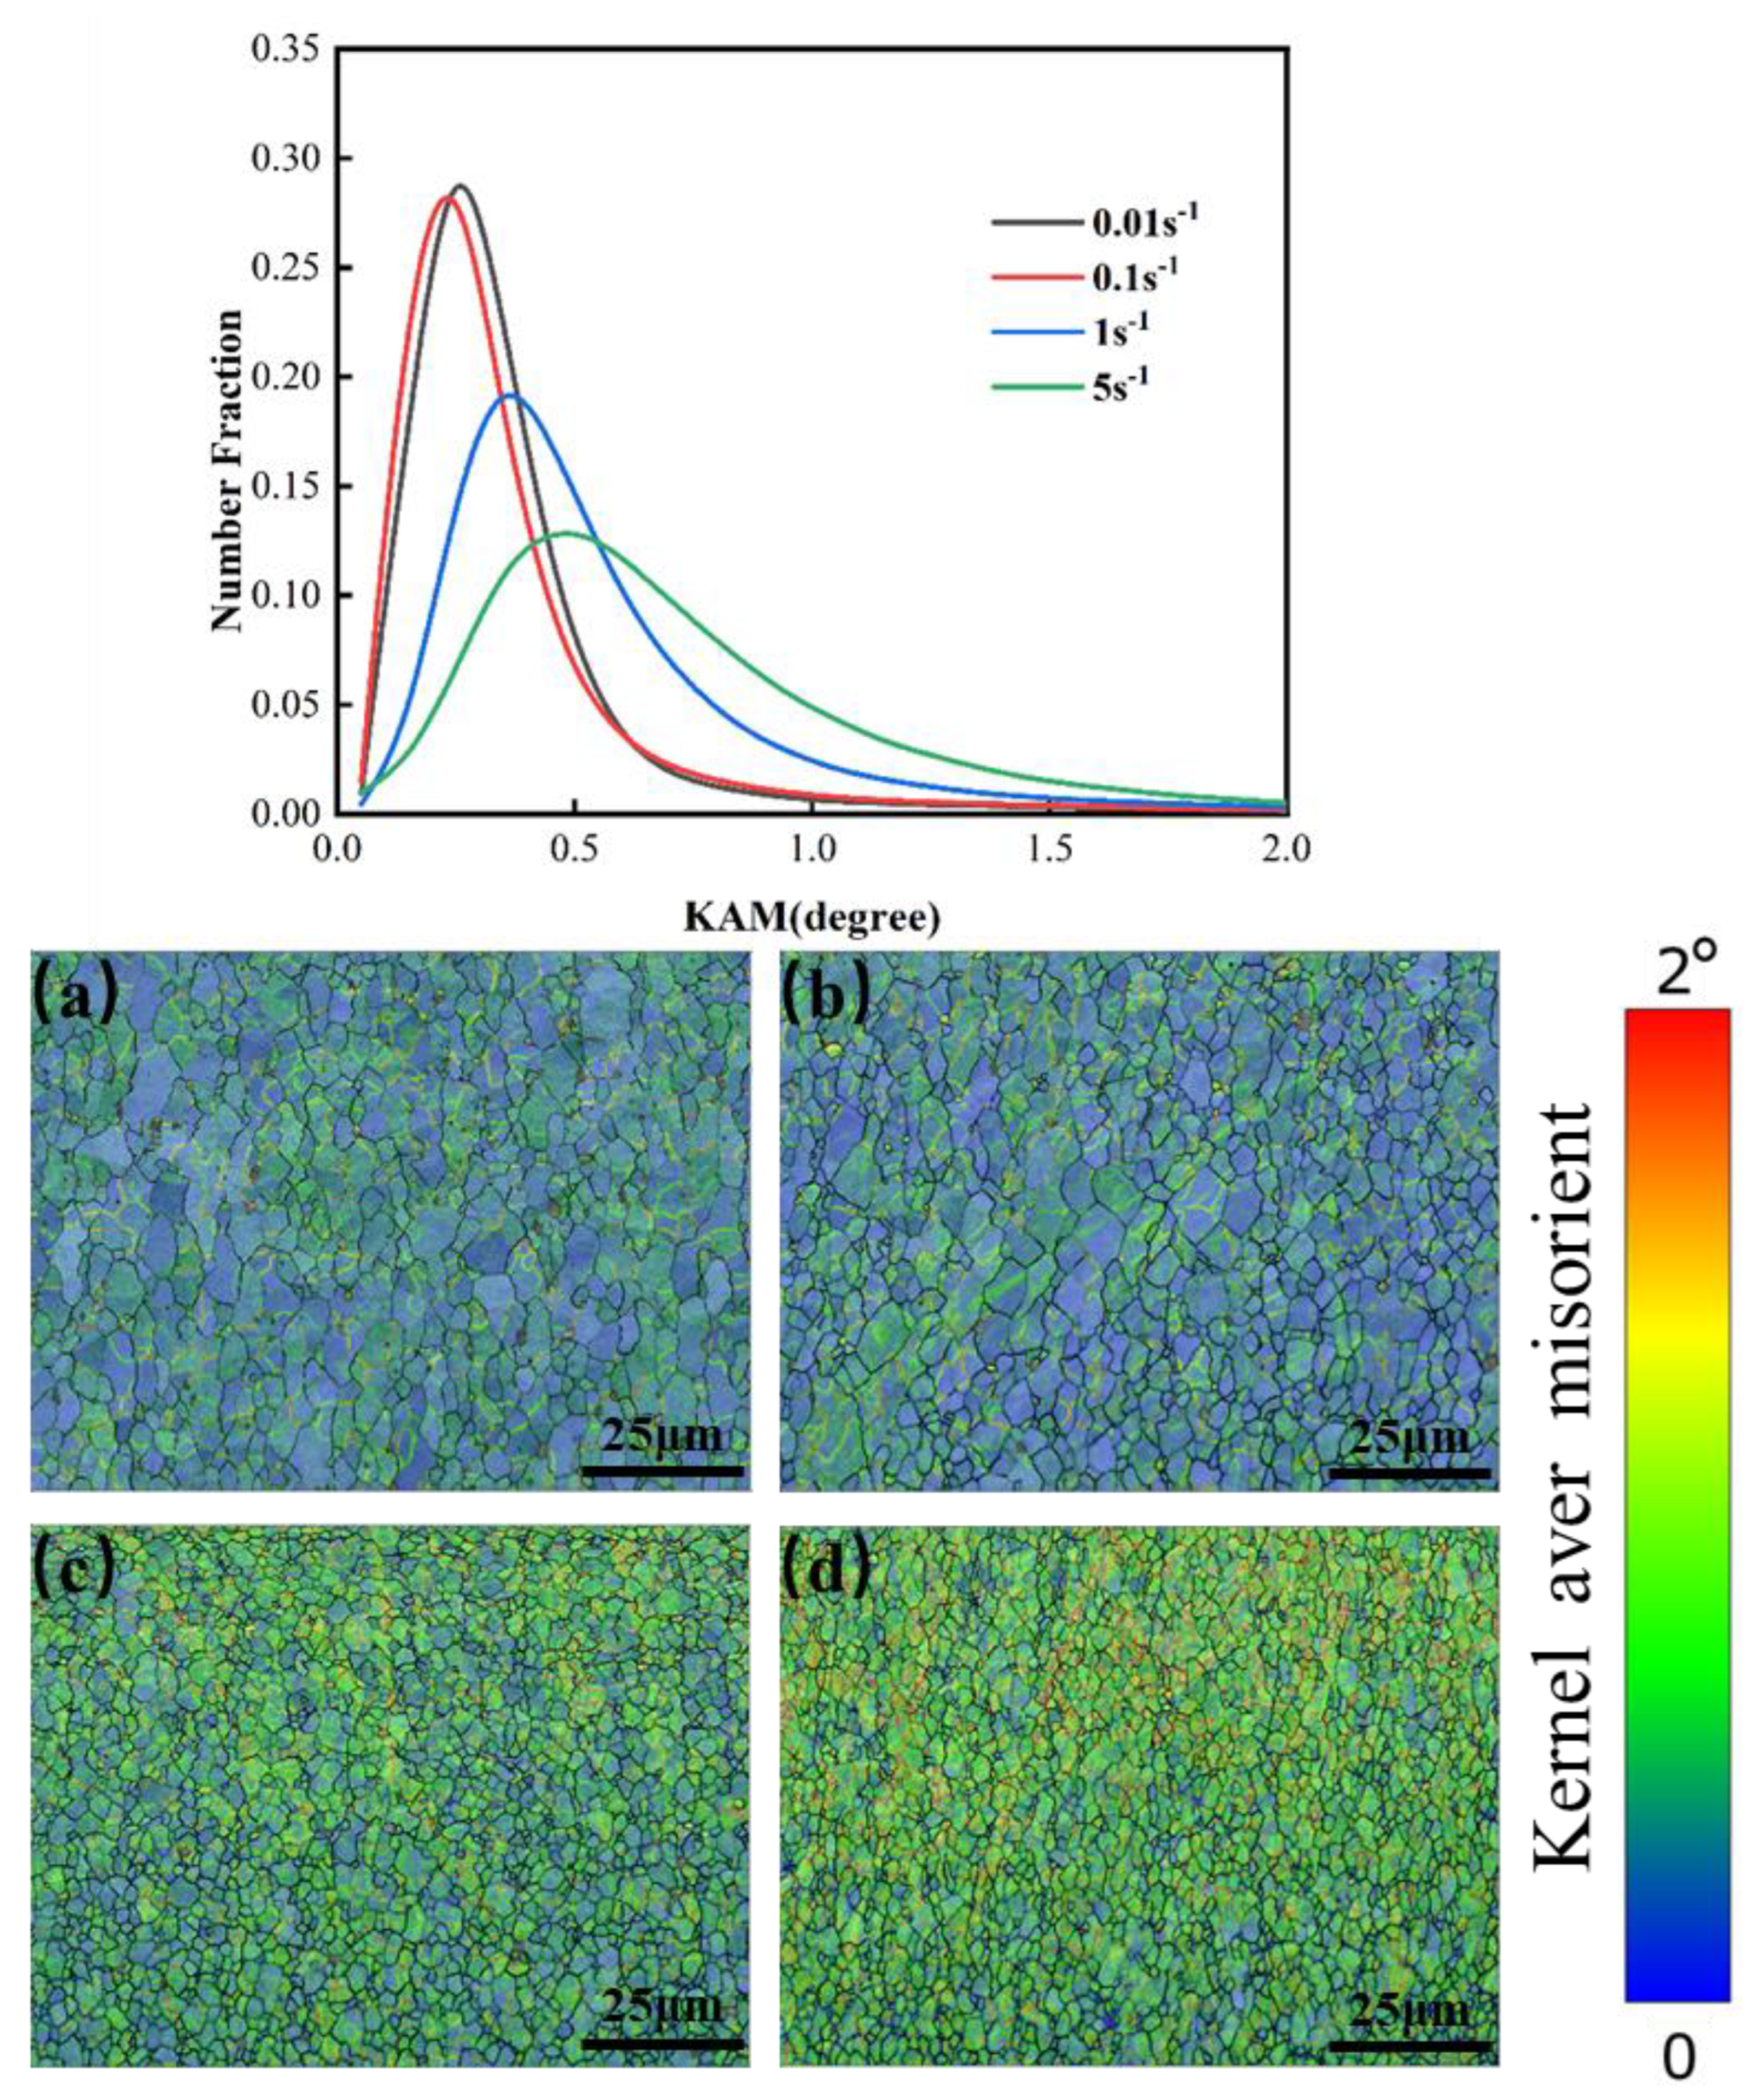
In order to establish more precise flow behavior models for Mo–1.5wt% Al2O3 and Mo–1.5wt% ZrO2 alloys, the combined effects of strain, strain rate, and temperature must be considered. Take parameter (α, Q, n, lnA) as a polynomial function of strain [22]. In this paper, a series of constitutive equations were calculated for the strain range of 0.05–0.8 in increments of 0.05, and the corresponding material constants obtained. Figure 9 and Figure 10 show the results of quintic polynomial fitting for Mo–1.5wt% Al2O3 and Mo–1.5wt% ZrO2 alloys, respectively, which could mirror the influence of material constants on strain.
Equation (12) is expressed as quintic polynomials, where the polynomial fitting parameters are shown in Table 1 and Table 2.
α = A 1 + A 2 ε + A 3 ε 2 + A 4 ε 3 + A 5 ε 4 + A 6 ε 5 n = B 1 + B 2 ε + B 3 ε 2 + B 4 ε 3 + B 5 ε 4 + B 6 ε 5 Q = C 1 + C 2 ε + C 3 ε 2 + C 4 ε 3 + C 5 ε 4 + C 6 ε 5 ln A = D 1 + D 2 ε + D 3 ε 2 + D 4 ε 3 + D 5 ε 4 + D 6 ε 5
Equation (13) can be obtained by reverse solving Equation (3). The predicted flow stress expression (Equation (14)) can be obtained by substituting the relationship between strain and material constant into Equation (13).
σ = 1 α ln Z A 1 / n + Z A 2 / n + 1 1 / 2
σ = 1 α ε ln ε ˙ e x p Q ε R T A ε 1 / n ε + ε ˙ e x p Q ε R T A ε 2 / n ε + 1 1 / 2
Figure 11 and Figure 12 show the comparison of experimental flow stresses with predicted flow stresses for Mo–1.5wt% Al2O3 alloy and Mo–1.5wt% ZrO2 alloy at certain strain rates, respectively. The calculated outcomes show that the built constitutive models were capable of precisely forecasting the flow stress during thermal deformation.
An average relative error (AARE) was utilized to calculate predictive capability of the model in order to further evaluate its dependability. It is expressed by Equation (15) [23,24]:
A A R E % = 1 N i = 1 N σ e i σ p i σ e i × 100 %
where σ p is the predicted flow stress, σ e is the experimental flow stress and N is the number of experimental data points.
Figure 13 shows the linear relationship between the experimental results and the predicted results. From the results, for Mo–1.5wt%, AARE = 4.325%, while for Mo–1.5 wt% ZrO2, AARE = 4.135%. The lower AARE values were representative of the fact that the constructed pattern had a better predictive capability for the flow stress of Mo–1.5wt% Al2O3 and Mo–1.5 wt% ZrO2 alloys.
Figure 14 shows the test peak stress and the anticipated peak stress for different deformation scenarios. It can be clearly seen that the peak stress and predicted peak stress of Mo–1.5wt% ZrO2 at different temperatures and different deformation rates were higher than those of Mo–1.5wt% Al2O3. This showed that the doping effect of ZrO2 was better. The dislocation density at high temperatures decreased due to recovery. At low strain rates, dislocations were consumed due to the occurrence of recrystallization, and the dislocation density decreased, resulting in a decrease in stress. The underlying reason was that the dynamic softening influence was enhanced due to the reduction of intergranular shear resistance [25]. At the same time, so as to prove the validity of the modified constitutive equation, the experimental peak stresses obtained at different deformation parameters before and after the modification were compared with the predicted results, as shown in Figure 14. The experimental peak stress was in good agreement with the compensated peak stress value, indicating that the compensated equations could better characterize the flow behavior of the alloys.

3.5. EBSD Analysis

The mechanism of the effect of temperature and strain rate on the thermal deformation of molybdenum alloys is quite complex. DRV and DRX are the main factors. The occurrence of the two leads to the annihilation and rearrangement of dislocations. At the same time, the energy stored in deformation also promotes the development of new grain structures. A comparison was made of the microstructural changes of Mo–1.5wt% Al2O3 and Mo–1.5wt% ZrO2 molybdenum alloys during hot compression. Taking Mo–1.5wt% ZrO2 molybdenum alloys as an example, the effect of different deformation process conditions on the microstructural evolution during hot compression was studied by means of EBSD technology. The DRV and DRX behaviors of molybdenum alloys during hot compression, and the changes of texture during deformation, were further explored by studying the characteristics of grain orientation, orientation difference and distribution of texture during hot compression.

3.5.1. Texture Analysis
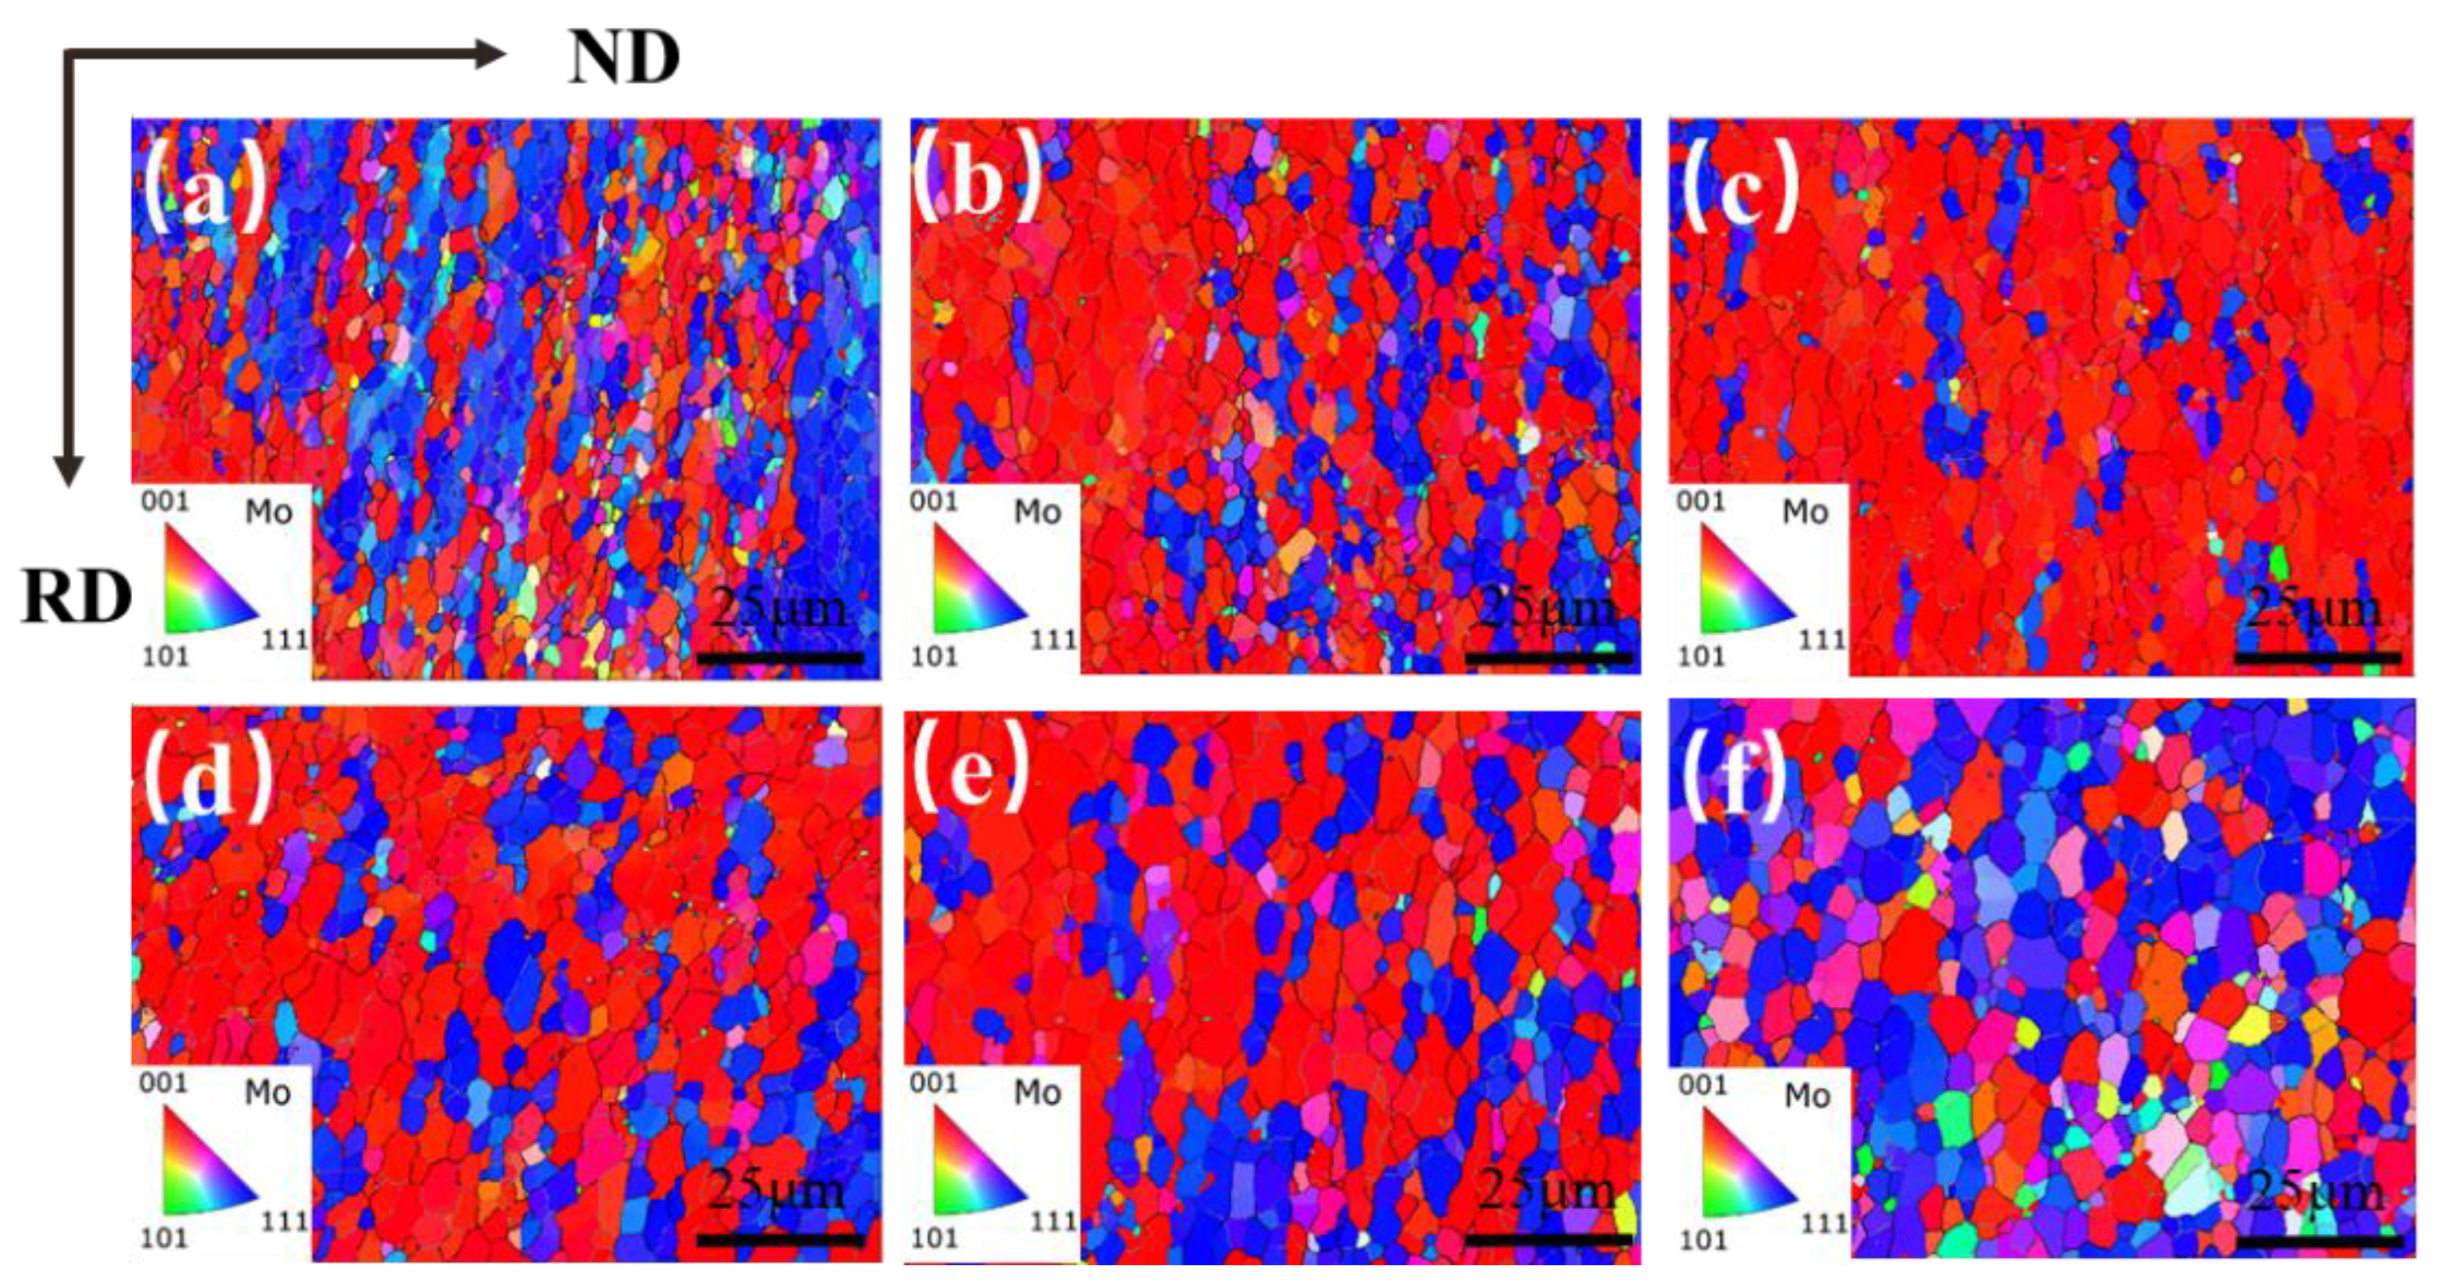
During the thermoplastic deformation of Mo alloys at a higher temperature, two main microscopic processes occur. One is the shaping deformation process, mainly based on dislocation motion, and the other is the dynamic crystallization process, mainly based on recovery, nucleation and grain growth. As these two microscopic processes are carried out simultaneously, or alternately, different texture characteristics can be presented [26]. With the increase in temperature, recrystallized grains are constantly generated, which more easily form some specific orientations or random orientations. Figure 15 and Figure 16 show the texture evolution of Mo–1.5wt% ZrO2 and Mo–1.5wt% Al2O3 molybdenum alloys at a strain rate of 0.01 s−1, a strain of 0.8, and temperatures of 1000–1500 °C. It can be seen from the pole figures that the textures of the two doped molybdenum alloys were mainly {100} texture and {111} texture. At 1000–1200 °C, as the temperature increased, the plasticity of the Mo–1.5wt% ZrO2 molybdenum alloy increased and deformation occurred more easily. As a result, the intensity of {100} texture gradually increased, while the intensity of {111} texture decreased. At 1300–1500 °C, owing to the occurrence of recrystallization, the change in the original texture was more obvious, and the intensity of {111} plane texture gradually increased. At 1500 °C, the intensity of {111} plane texture was more than that of {100} texture, becoming the main texture. The texture of the molybdenum alloy doped with ZrO2 had a higher intensity than that of the molybdenum alloy doped with Al2O3.

3.5.2. IPF Map

The grain orientation maps (IPF) of the Mo–1.5wt% ZrO2 molybdenum alloy at a strain rate of 0.01 s−1 and at a strain of 0.8 and a temperature of 1000–1500 °C is shown in Figure 17. RD (rolling direction) indicates the compression direction, and ND (normal direction) indicates the normal direction of the compression surface. The direction of the grain was parallel to the direction of compression (RD), with mainly [001] and [111] grain orientations. It can be seen from the evolution of the orientations that the percentage of grains with [111] orientation gradually increased when the temperature rose. It was mostly [001] oriented grains from 1000 °C to 1300 °C, while the [111] grain orientation occupied the main orientation from 1400 °C to 1500 °C. From 1000 °C to 1300 °C, lots of fine recrystallized grain nucleated at the original grain boundaries and sub–grain boundaries, and the molybdenum alloy underwent significant DRV, showing representative continuous dynamic recrystallization (CDRX). The grains showed [001] and [111] orientations during the deformation process, resulting in a ‘preferred orientation’. With the increase in temperature, thermal compression caused the matrix to tend to be perpendicular to the direction of compression, an orientation that was not conducive to continued deformation. At 1500 °C, more newly oriented grains appeared, due to the higher temperature.

3.5.3. Texture Composition Analysis

Figure 18 shows the texture distribution of the Mo–1.5wt% ZrO2 molybdenum alloy at a strain rate of 0.01 s−1, at a strain of 0.8 and at a temperature of 1000–1500 °C. The textures of molybdenum alloys are mainly plane texture or plate texture. The crystals slip along the most atomically dense crystal plane during plastic deformation. At the same time, the crystal and its slip surface rotate, resulting in the grain direction appearing to be a certain degree of order. It can be seen from Figure 16 and Figure 17 that there existed mainly {001} texture, {111} (110) texture and {111} (112) texture. Figure 19 shows the relative change trend of the texture composition under different conditions. It can be seen that at 0.01 s−1, the {001} texture gradually increased before 1200 °C, and the proportion of the {001} texture decreased when the recrystallization temperature was reached. Similarly, at 1200 °C, as the strain rate decreased, the degree of recrystallization increased, and the {001} texture showed an increasing trend. As the temperature rose, the content of the {001} texture first increased and then decreased, while the content of the {111} texture changed in the opposite direction. It can be seen that, at 1500 °C, there were more and more new grains with inconsistent orientation, which did not have meritocratic orientation.
Figure 20 shows the grain size distribution of the Mo–1.5wt% ZrO2 molybdenum alloy at 1000–1500 °C. The average grain sizes were 2.38 μm at 1000 °C, 2.66 μm at 1100 °C, 3.41 μm at 1200 °C, 3.62 μm at 1300 °C, 4.45 μm at 1400 °C and 4.67 μm at 1500 °C. It can be observed that the grain size at 1000–1100 °C did not change significantly. When the temperature reached 1200 °C, the sub–crystals merged to form larger grains because of the occurrence of dynamic recrystallization, and so the grain size changed significantly. When the temperature rose to 1400–1500 °C, the recrystallized grains grew up uniformly, and the average grain size increased to 4–5 μm, which was a more obvious change, compared with that below 1400 °C. As the temperature rose, the percentage of large–angle grain boundaries gradually increased due to the occurrence of recrystallization.

3.5.4. Local Orientation Difference Analysis
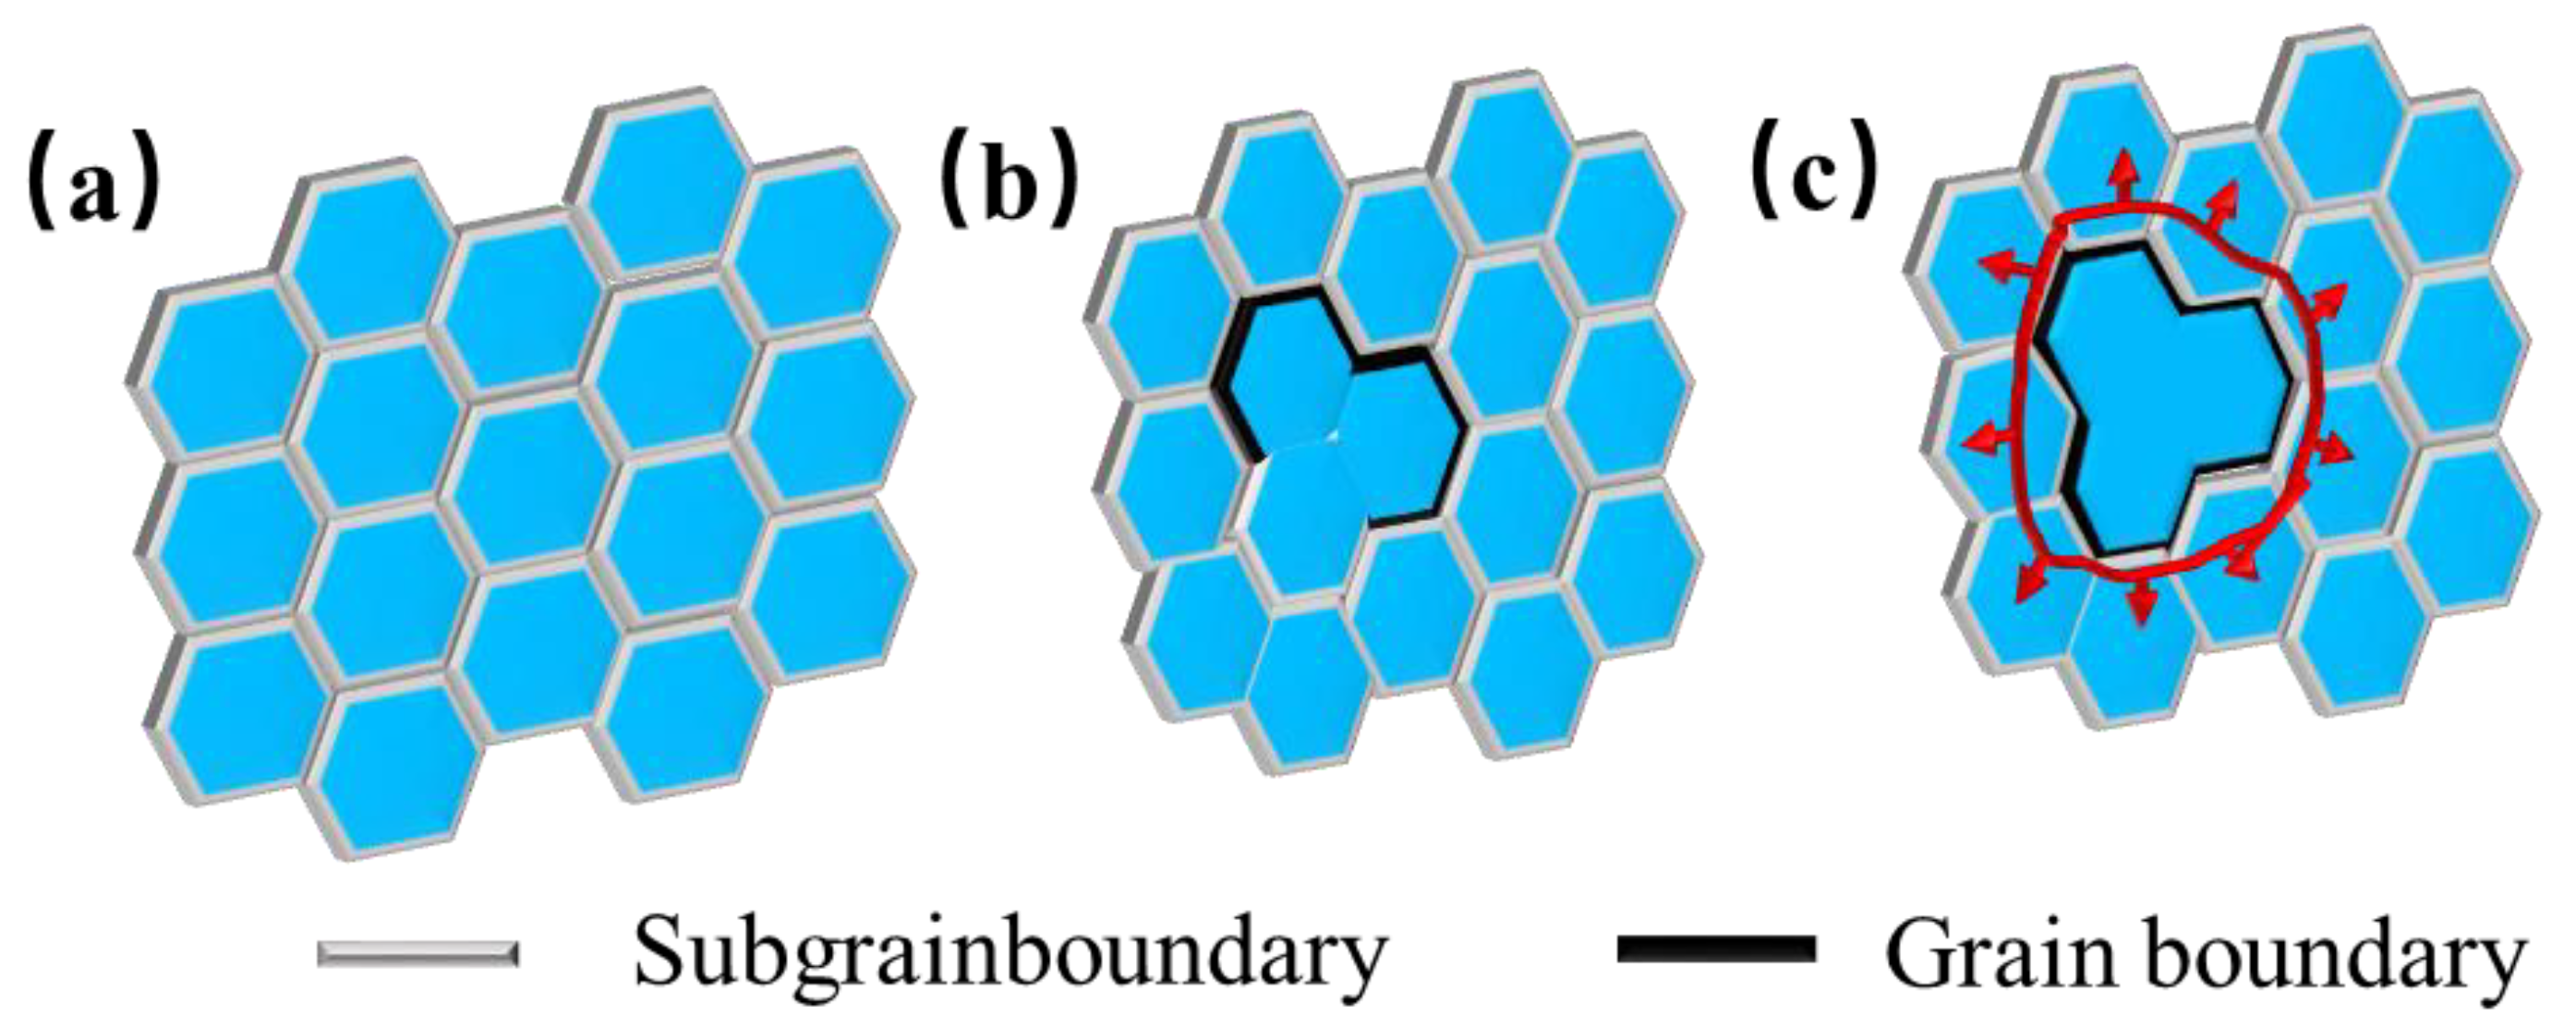
In order to analyze the dislocation density variation of molybdenum alloys, a kernel average misorientation (KAM) map was used to reflect the local strain of the specimen, which was evaluated by calculating the average orientation difference between a given point and the neighboring points in the same grain, usually less than 5° [27,28]. The higher the KAM value, the more the color tended to be red, representing the higher local plastic strain and the higher dislocation density [29,30]. Figure 21 shows the KAM curves and KAM maps at 1000 °C, 1200 °C, and 1400 °C at 0.1 s−1 deformation rate. From Figure 21, with increasing temperature, the KAM value gradually decreased, representing the smaller local plastic strain and the smaller dislocation density, which indicated that the recovery and recrystallization could lead to the decrease of dislocation density. KAM values tended to be consistent at 1200 °C and 1400 °C, so it could be judged that, above 1200 °C, the rate of recovery was basically consistent with the rate of dislocation accumulation.
The relationship between the distribution of KAM values for samples deformed at various strain rates at 1200 °C is shown in Figure 22. The dislocation density showed an increasing trend as the strain rate increased. At 1200 °C, the curve showed a wider distribution because of the existence of dislocation accumulation during the deformation process as the deformation rate increased. Moreover, with an increasing deformation rate, the reduction rate of dislocation in the recovery process was slower than the dislocation accumulation rate caused by deformation, due to the lack of recrystallization of the grain, and so the overall trend was increasing.
In summary, the relationship between dislocation density, temperature and strain rate could be found. With increasing temperature and decreasing strain rate, recovery and recrystallization accelerated and dislocation density decreased. Combined with the images of the microstructure (Figure 5), it can be seen that recrystallization began at 1200 °C. As the temperature continued to rise, the required thermal activation energy provided for the occurrence of recrystallization. When the strain rate decreased, the dislocation had a long time to slip and climb, and the degree of recrystallization gradually increased, resulting in lower dislocation density.
For metals with high stacking fault energy, the dislocation slips and climbs occur to form the dislocation wall and the sub−grain boundary. During thermal deformation, the sub–grain boundary continuously absorbs the dislocation, and the angle keeps increasing, leading to the rotation of the sub=grain, and, finally, the sub–grain transforms from the small–angle grain boundary to the large−angle grain boundary. That is, the sub–grain becomes the real grain, which is called continuous dynamic recrystallization (CDRX) [31], with the process of CDRX, shown in Figure 22. Since the dynamic recovery cannot offset the work hardening brought by the deformation, dislocations continue to be generated. Dislocations plug and rearrange at grain boundaries to form sub−grain boundaries, as shown in Figure 23a. According to the variation law of dislocation density, it can be seen that, at a lower deformation rate (0.01–0.1 s−1) and a higher temperature (above 1200 °C), CDRX occurred, and the sub–grain boundaries continued to absorb dislocations to eventually form large–angle grain boundaries, as depicted in Figure 23b,c.

4. Discussion

Figure 24 shows the microstructural development of Mo–1.5wt% ZrO2 alloy under different deformation conditions. According to the comprehensive effect of different temperature and deformation rates, combined with KAM changes, the whole deformation process can be summarized into the following three types: (i) In the first type, dis−location slippage, proliferation and their interaction increase the dislocation density, thus resulting in processing hardening. Due to low temperature and high deformation rate (1000–1200 °C, 1–5 s−1), only a small amount of dynamic recrystallization happens, the hardening effect is greater than the softening effect, and the flow stress rapidly increases. The grain is crushed by force and is relatively fine; (ii) In the second type, dynamic recovery and dynamic recrystallization cause material softening. The increase of the deformation degree increases vacancy concentration in the alloys, and the dislocation climbing causes the softening of the alloys. The softening effect and work hardening occur together in this stage, and the grain size is not uniform, some recrystallization and growth occurs, and some small grains arise. (iii) In the third type, the flow stress drops or remains stable because of softening effects being greater than work hardening, or reaching a balance. However, because of the low deformation rate and high temperature (1200–1500 °C, 0.01–0.1 s−1), the softening result caused by DRV and DRX is obvious, the work hardening effect in the deformation process is mostly eliminated, the dislocation is reduced, and it is conducive to the grain growth. Xiao [32] et al. also showed the same trend in pure molybdenum, and pointed out that this was because the higher the temperature, the higher the mobility of the grain boundary, and the more obvious is the dynamic softening degree. It can be seen that the grain boundary migration trend in Figure 20b was consistent with its description.
The texture changes of molybdenum alloy induced by recrystallization were studied under the deformation rate (0.01 s−1), a rate which is prone to dynamic recrystallization. There are two typical orientations in molybdenum alloy: one is {100} texture and the other is {111} texture, including {111} (111) and {111} (112) textures. Due to its plasticity being greatly affected by temperature, it is easy for the material to deform at low temperature, so it is easy to produce texture in the process of stress. When dynamic recrystallization (above 1200 °C) occurs, the strength of deformation texture is significantly weakened, especially {001} texture. Yu Xia et al. [26] measured the deformation texture of molybdenum alloy by XRD, and also found that pure molybdenum had <100>, <111>// deformation direction texture, and inferred that, during recrystallization, with the increase in deformation, the recrystallized grains would rotate towards the preferential slip system, resulting in random orientation of the recrystallized grains, and, thus, the texture strength would decrease [33,34]. It has been noted that doped zirconia molybdenum alloy has better deformation strengthening potential than alumina molybdenum alloy under the same preparation process, and the reasons for the two differences and the specific effects of recrystallization on the texture will be further analyzed in later work.

5. Conclusions

(1)
The rheological stress of the two molybdenum alloys increased with decreasing deformation temperature or increasing strain rate, and the effect of the molybdenum alloy doped with ZrO2 in improving thermal deformation resistance was better than that of the alloy doped with Al2O3.
(2)
The constitutive equations and activation energy diagrams of the two molybdenum alloys were established. The molybdenum alloy doped with ZrO2 (403.917 kJ/mol) had lower activation energy than that doped with Al2O3 (440.314 kJ/mol).
(3)
The textures of the two molybdenum alloys during thermal deformation were mainly {100} texture and {111} texture. The texture of the molybdenum alloy doped with ZrO2 had a higher intensity than that of the molybdenum alloy doped with the Al2O3. The intensity of {100} texture first increased and then decreased when the temperature rose, while the change law of {111} texture exhibited the opposite, with the inflection point around the recrystallization temperature.
(4)
The grain size of the Mo–1.5wt% ZrO2 alloy increased with increasing temperature. At a low strain rate and high temperature, the dislocation density decreased due to the occurrence of recrystallization. The sub–grains merged to form large–angle grain boundaries, and so the percentage of large–angle grain boundaries showed an upward trend.

Author Contributions

Conceptualization, B.W.; methodology, B.W.; validation, Y.Z., L.X., X.L. and S.W.; formal analysis, Y.Z.; investigation, B.W.; resources, Y.Z., L.X., X.L. and S.W.; data curation, B.W., Y.Z. and D.Y.; writing—original draft, B.W.; writing—review & editing, D.Y.; visualization, Y.Z.; supervision, L.X. and S.W.; project administration, Y.Z. and S.W. All authors have read and agreed to the published version of the manuscript.

Funding

This research was funded by the National Natural Science Foundation of China, grant number U1804124.

Data Availability Statement

Not applicable.

Conflicts of Interest

The authors declare no conflict of interest.

References

  1. Lin, Y.C.; Chen, M.S.; Zhang, J. Modeling of flow stress of 42CrMo steel under hot compression. J. Mater. Sci. Eng. A 2009, 499, 88–92. [Google Scholar] [CrossRef]
  2. El-Genk, M.S.; Tournier, J.-M. A review of refractory metal alloys and mechanically alloyed-oxide dispersion strengthened steels for space nuclear power systems. J. Nucl. Mater. 2004, 340, 93–112. [Google Scholar] [CrossRef]
  3. Wang, Y.; Wang, D.; Zhu, W.; Liu, H.; Zan, X. Microstructure and properties of hot–rolled 2.0 wt.% MoSi 2/rare earth oxide doped molybdenum alloys. Int. J. Refract. Met. Hard Mater. 2012, 31, 152–156. [Google Scholar] [CrossRef]
  4. Brosse, J.B.; Fillit, R.; Biscondi, M. Intrinsic intergranular brittleness of molybdenum. J. Scr. Metall. 1981, 15, 619–623. [Google Scholar] [CrossRef]
  5. Wadsworth, J.; Nieh, T.G.; Stephens, J.J. Recent advances in aerospace refractory metal alloys. J. Int. Mater. Rev. 1988, 33, 131–150. [Google Scholar] [CrossRef]
  6. Xu, Z.; Xu, L.; Xiong, N.; Yao, Y.; Li, X.; Wei, S. Dynamic recrystallization behavior of a Mo–2.0%ZrO2 alloy during hot deformation. Int. J. Refract. Met. Hard Mater. 2022, 109, 105983. [Google Scholar] [CrossRef]
  7. Wang, B.; Zhou, Y.C.; Ju, X. Research progressin oxide particle reinforced molybdenum alloys. J. Spec. Cast. Nonferrous Alloy. 2022, 42, 1102–1109. [Google Scholar] [CrossRef]
  8. Majumdar, S.; Raveendra, S.; Samajdar, I.; Bhargava, P.; Sharma, I.G. Densification and grain growth during isothermal sintering of Mo and mechanically alloyed Mo–TZM. Acta Mater. 2009, 57, 4158–4168. [Google Scholar] [CrossRef]
  9. Miller, M.K.; Kenik, E.A.; Mousa, M.S.; Russell, K.F.; Bryhan, A.J. Improvement in the ductility of molybdenum alloys due to grain boundary segregation. Scr. Mater. 2002, 46, 299–303. [Google Scholar] [CrossRef]
  10. Mueller, A.J.; Bianco, R.; Buckman, R.W. Evaluation of oxide dispersion strengthened (ODS) molybdenum and molybdenum–rhenium alloys. Int. J. Refract. Met. Hard Mater. 2000, 18, 205–211. [Google Scholar] [CrossRef] [Green Version]
  11. Liu, R.Z.; Wang, K.S.; Feng, P.F.; An, G.; Yang, Q.L.; Zhao, H. Microstructure and tensile properties of Mo alloy synthetically strengthened by nano–Y_2O_3 and nano–CeO_2. Rare Met. 2014, 33, 58–64. [Google Scholar] [CrossRef]
  12. Liu, G.; Zhang, G.J.; Jiang, F. Nanostructured high-strength molybdenum alloys with unprecedented tensile ductility. Nat. Mater. 2013, 12, 344–350. [Google Scholar] [CrossRef] [PubMed]
  13. Zhou, Y.C.; Gao, Y.M.; Wei, S.Z.; Hu, Y.J. Preparation and properties of high-strength molybdenum alloy sheets doped with Al_2O_3 particles. Rare Met. 2018, 37, 1046–1054. [Google Scholar] [CrossRef]
  14. Cui, C.; Zhu, X.; Liu, S.; Li, Q.; Zhang, M.; Zhu, G.; Wei, S. Effect of nano-sized ZrO2 on high temperature performance of Mo-ZrO2 alloy. J. Alloy. Compd. 2018, 768, 81–87. [Google Scholar] [CrossRef]
  15. Hu, P.; Zhou, Y.; Chang, T.; Yu, Z.; Wang, K.; Yang, F.; Hu, B.; Cao, W.; Yu, H. Investigation on Compression Behavior of TZM and La2O3 Doped TZM Alloys at High Temperature. J. Mater. Sci. Eng. A 2017, 687, 276–280. [Google Scholar] [CrossRef]
  16. Chaudhuri, A.; Behera, A.N.; Sarkar, A.; Kapoor, R.; Ray, R.K.; Suwas, S. Hot deformation behaviour of Mo-TZM and understanding the restoration processes involved. Acta Mater. 2019, 164, 153–164. [Google Scholar] [CrossRef]
  17. Geng, Y.; Li, X.; Zhou, H.; Zhang, Y.; Jia, Y.; Tian, B.; Liu, Y.; Volinsky, A.A.; Zhang, X.; Song, K.; et al. Effect of Ti addition on microstructure evolution and precipitation in Cu–Co–Si alloy during hot deformation. J. Alloy. Compd. 2019, 821, 153518. [Google Scholar] [CrossRef]
  18. Li, Z.; Chen, Y.; Wei, S.; Xiao, F.; Siyal, S.H.; Xu, L. Flow behavior and processing map for hot deformation of W-1.5ZrO2 alloy. J. Alloy. Compd. 2019, 802, 118–128. [Google Scholar] [CrossRef]
  19. Bobbili, R.; Madhu, V. Constitutive modeling of dynamic flow behavior of Ti-5553 alloy. J. Alloy. Compd. 2019, 787, 260–266. [Google Scholar] [CrossRef]
  20. Sellars, C.M.; Mctegart, W.J. On the mechanism of hot deformation. J. Acta Metall. 1966, 14, 1136–1138. [Google Scholar] [CrossRef]
  21. Zener, C.; Hollomon, J.H. Effect of Strain Rate Upon Plastic Flow of Steel. J. Appl. Phys. 1944, 15, 22–32. [Google Scholar] [CrossRef]
  22. Meng, Q.; Bai, C.; Xu, D. Flow behavior and processing map for hot deformation of ATI425 titanium alloy. J. Mater. Sci. Technol. 2018, 34, 105–114. [Google Scholar] [CrossRef]
  23. Maheshwari, A.K. Prediction of flow stress for hot deformation processing. J. Comput. Mater. Sci. 2013, 69, 350–358. [Google Scholar] [CrossRef]
  24. Zhang, Y.; Sun, H.; Volinsky, A.A.; Tian, B.; Song, K.; Wang, B.; Liu, Y. Hot workability and constitutive model of the Cu-Zr-Nd alloy. Vacuum 2017, 146, 35–43. [Google Scholar] [CrossRef]
  25. Zhang, B.; Dong, Y.; Devesh Kumar Misra, R.; Liu, Y.; Sun, C.; Du, L.X. High-Temperature Deformation Behavior of a Novel Hot-Rolled Transformation-Induced Plasticity Alloy: Experiments, Constitutive Modeling, and Processing Maps. J. Steel Res. Int. 2021, 92, 2000338. [Google Scholar] [CrossRef]
  26. Xia, Y.; Hu, P.; Wang, K.-S.; Li, S.-L.; Xing, H.-R.; Chang, T.; Feng, P.-F.; Li, L.-P. Microstructure and texture evolution of pure molybdenum during hot deformation. Mater. Charact. 2019, 159, 110010. [Google Scholar] [CrossRef]
  27. Chaudhuri, A.; Sarkar, A.; Suwas, S. Investigation of stress-strain response, microstructure and texture of hot deformed pure molybdenum. Int. J. Refract. Met. Hard Mater. 2018, 73, 168–182. [Google Scholar] [CrossRef]
  28. Sarkar, A.; Kapoor, R.; Verma, A.; Chakravartty, J.K.; Suri, A.K. Hot deformation behavior of Nb–1Zr–0.1C alloy in the temperature range 700–1700 °C. J. Nucl. Mater. 2012, 422, 1–7. [Google Scholar] [CrossRef]
  29. Calcagnotto, M.; Ponge, D.; Demir, E.; Raabe, D. Orientation gradients and geometrically necessary dislocations in ultrafine grained dual-phase steels studied by 2D and 3D EBSD. J. Mater. Sci. Eng. A 2010, 527, 2738–2746. [Google Scholar] [CrossRef]
  30. Mohtadi-Bonab, M.A.; Eskandari, M.; Szpunar, J.A. Texture, local misorientation, grain boundary and recrystallization fraction in pipeline steels related to hydrogen induced cracking. J. Mater. Sci. Eng. A 2015, 620, 97–106. [Google Scholar] [CrossRef]
  31. Rollett, A. Recrystallization and Related Annealing Phenomena; Elsevier: Amsterdam, The Netherlands, 1995. [Google Scholar] [CrossRef]
  32. Xiao, M.; Li, F.; Xie, H.; Wang, Y. Characterization of strengthening mechanism and hot deformation behavior of powder metallurgy molybdenum. Mater. Des. 2012, 34, 112–119. [Google Scholar] [CrossRef]
  33. Chen, Y.; Li, J.; Tang, B.; Kou, H.; Zhang, F.; Chang, H.; Zhou, L. Grain boundary character distribution and texture evolution in cold-drawn Ti–45Nb wiresl. J. Mater. Lett. 2013, 98, 254–257. [Google Scholar] [CrossRef]
  34. Hughes, D.A.; Hansen, N. High angle boundaries formed by grain subdivision mechanisms. J. Acta Mater. 1997, 45, 3871–3886. [Google Scholar] [CrossRef]
Figure 1. The method of making the molybdenum alloys.
Metals 13 00238 g001
Figure 2. Diagram of liquid–liquid doping process.
Metals 13 00238 g002
Figure 3. Thermal compression test scheme of molybdenum alloys.
Metals 13 00238 g003
Figure 4. True stress−true strain curves of Mo–1.5wt% Al2O3 and Mo–1.5wt% ZrO2 alloys: (a) 0.01 s−1, (b) 0.1 s−1, (c) 1 s−1, (d) 5 s−1.
Metals 13 00238 g004
Figure 5. SEM images of Mo–1.5wt% ZrO2 alloy at a strain rate of 0.01 s−1: (a) 1000 °C, (b) 1100 °C, (c) 1200 °C, (d) 1300 °C, (e) 1400 °C, (f) 1500 °C.
Metals 13 00238 g005
Figure 6. Relationship between parameters of Mo–1.5wt% Al2O3 alloy: (a) ln ε ˙ ln σ , (b) ln ε ˙ σ , (c) ln ε ˙ ln s i n h α σ , (d) ln s i n h α σ 1000 / T .
Metals 13 00238 g006
Figure 7. ln Z ln s i n h α σ relationship: (a) Mo–1.5wt%Al2O3, (b) Mo–1.5wt%ZrO2.
Metals 13 00238 g007
Figure 8. Relationship between parameters of Mo–1.5wt%ZrO2 alloy: (a) ln ε ˙ ln σ , (b) ln ε ˙ σ , (c) ln ε ˙ ln s i n h α σ , (d) ln s i n h α σ 1000 / T .
Metals 13 00238 g008
Figure 9. Material constants relationship between the strain of Mo–1.5wt% Al2O3 (a) α, (b) n, (c) Q, (d) lnA.
Metals 13 00238 g009
Figure 10. Material constants relationship between the strain of Mo–1.5wt% ZrO2: (a) α, (b) n, (c) Q, (d) lnA.
Metals 13 00238 g010
Figure 11. Comparison of experimental and calculated values of flow stress of Mo–1.5wt% Al2O3: (a) 0.01 s−1, (b) 0.1 s−1, (c) 1 s−1, (d) 5 s−1.
Metals 13 00238 g011
Figure 12. Comparison of experimental and calculated values of flow stress of Mo–1.5wt% ZrO2: (a) 0.01 s−1, (b) 0.1 s−1, (c) 1 s−1, (d) 5 s−1.
Metals 13 00238 g012
Figure 13. Correlation between predicted and experimental values of flow stress: (a) Mo–1.5wt% Al2O3, (b) Mo–1.5wt% ZrO2.
Metals 13 00238 g013
Figure 14. Comparison of Mo–1.5wt%Al2O3 and Mo–1.5wt%ZrO2 test and predicted peak flow stress values.
Metals 13 00238 g014
Figure 15. Pole figures of Mo–1.5wt%ZrO2 molybdenum alloy at a strain rate of 0.01 s−1: (a) 1000 °C (b) 1100 °C, (c) 1200 °C, (d) 1300 °C, (e) 1400 °C, (f) 1500 °C.
Metals 13 00238 g015
Figure 16. Pole figures of Mo–1.5wt%Al2O3 molybdenum alloy at strain rate of 0.01 s−1: (a) 1000 °C, (b) 1100 °C, (c) 1200 °C, (d) 1300 °C, (e) 1400 °C, (f) 1500 °C.
Metals 13 00238 g016
Figure 17. Grain orientation (IPF) maps of Mo–1.5wt% ZrO2 molybdenum alloy at a strain rate of 0.01 s−1: (a) 1000 °C, (b) 1100 °C, (c) 1200 °C, (d) 1300 °C, (e) 1400 °C, (f) 1500 °C.
Metals 13 00238 g017
Figure 18. TC texture composition maps for Mo–1.5wt% ZrO2 molybdenum alloy at strain rate of 0.01 s−1: (a) 1000 °C, (b) 1100 °C, (c) 1200 °C, (d) 1300 °C, (e) 1400 °C, (f) 1500 °C.
Metals 13 00238 g018
Figure 19. Variation trend of texture composition under different conditions: (a) 0.01 s−1, (b) 1200 °C.
Metals 13 00238 g019
Figure 20. Mo–1.5wt% ZrO2Molybdenum alloy (0.01 s−1 and 1000–1500 °C): (a) Grain size distribution, (b) Grain boundary orientation difference statistics.
Metals 13 00238 g020
Figure 21. KAM maps for Mo–1.5wt%ZrO2 molybdenum alloy at strain rate of 0.1 s−1: (a) 1000 °C, (b) 1200 °C, (c) 1400 °C.
Metals 13 00238 g021
Figure 22. KAM maps of Mo–1.5wt%ZrO2 molybdenum alloy at a temperature of 1200 °C: (a) 0.01 s−1, (b) 0.1 s−1, (c) 1 s−1, (d) 5 s−1.
Metals 13 00238 g022
Figure 23. Molybdenum alloy recrystallization nucleation mechanism. (a) Subgrainboundary (b) Subgrainboundary merging (c) Grain boundary formation.
Metals 13 00238 g023
Figure 24. Microstructure development of Mo–1.5wt%ZrO2 alloy under different deformation conditions.
Metals 13 00238 g024
Table 1. Polynomial fitting parameters for Mo–1.5 wt% Al2O3.
αnQlnA
A10.00471B126.04856C11010.97279D177.98867
A20.00473B2−168.03811C2−6720.96435D2−554.8083
A3−0.0402B3750.61243C328,972.90935D32433.7486
A40.13176B4−1699.7891C4−62,073.73045D4−5270.35991
A5−0.17848B51842.79951C564,177.7886D55496.05483
A60.08595B6−757.49024C6−25,393.15594D6−2191.82851
Table 2. Polynomial fitting parameters for Mo–1.5wt% ZrO2.
αnQlnA
A10.00445B123.77219C1876.85884D181.77307
A20.000601724B2−129.19618C2−5202.64628D2−651.05548
A3−0.01617B3538.00483C321,796.84917D33030.92649
A40.07302B4−1181.86117C4−46,742.41783D4−6892.99011
A5−0.11378B51268.49926C549,320.99448D57505.93055
A60.06009B6−519.82125C6−20,110.67745D6−3117.12693
Disclaimer/Publisher’s Note: The statements, opinions and data contained in all publications are solely those of the individual author(s) and contributor(s) and not of MDPI and/or the editor(s). MDPI and/or the editor(s) disclaim responsibility for any injury to people or property resulting from any ideas, methods, instructions or products referred to in the content.

