Article

Study of Tensile Deformation and Damage Law in Undermatching X80 Pipeline Steel Welded Joints

1
PipeChina West Pipeline Company, Urumqi 830013, China
2
School of Materials Science and Engineering, Beihang University, Beijing 100191, China
3
PipeChina Company, Beijing 100013, China
*
Author to whom correspondence should be addressed.
Metals 2023, 13(2), 226; https://doi.org/10.3390/met13020226
Submission received: 23 November 2022 / Revised: 17 January 2023 / Accepted: 19 January 2023 / Published: 25 January 2023
(This article belongs to the Special Issue Mechanical Properties of Metals Welding Joints)

Abstract

:
This study used a digital imaging technique (DIC) to obtain the strain distribution at various locations in undermatching X80 pipe girth-weld joints under uniaxial tensile loading. In addition, the microstructure characteristics and deformation patterns in different regions were analyzed by scanning electron microscopy (SEM). The results showed that there was strain heterogeneity between the various regions of the welded joint. Strain concentration existed only in the 12.8 mm base metal heat-affected zone (HAZ) and only in the elastic deformation stage. There was strain concentration in the weld metal (WM) and both sides of the HAZ close to the near-fracture stage, and the maximum deformation was in the WM. When ε M = 12.2%, the K C was 6.27 and the K F was 1.73, and the K F was 113% and 152% of the K C and the K G , respectively. The large number of slip strips generated indicated serious damage in the WM near the fracture stage. In the elastic deformation stage, the strain concentration of the N1 HAZ was caused by the softened ferrite. The maximum deformation of the WM near the fracture stage was caused by the large grain size and the non-uniform martensite–austenite (M–A) islands, which may also lead to better local toughness of the cover weld and further affect the fracture mechanism of the welded joint.

1. Introduction

There is a requirement to transport crude oil and gas by pipeline at a higher operating pressure to increase capacity, and X80 pipeline steel has excellent mechanical properties, economic benefits and serviceability under severe conditions such as long distances and high pressures [1,2]. Welding is the basic process for manufacturing steel pipe, and there is a large gradient of microstructures in a very small area in the welded joint. This is caused by the thermal cycling process in the welding process [3], resulting in uneven mechanical properties in the welded joint [4,5,6]. The service safety of X80 pipeline steel welded joints is affected by girth weld.
When using an extensometer to measure strain, only the strain value of the whole sample can be provided, and the strain change in local areas of the joint cannot be analyzed. This problem can be solved by using DIC [7,8]. This method has been effectively applied to the strain analysis of a variety of welded joints, including friction stir-welded aluminum alloy joints, laser-welded aluminum alloy joints, etc. [9,10,11]. In the analysis of the strain law of pipeline steel welded joints, there has been some research into strain and crack, and studies have found that crack formation and propagation is influenced by the welding process and the welding joint zone [12]. Changes in the external environment can affect the local strain and fracture behavior [2,13]. In addition, some scholars have studied matching submerged-arc-welded joints and found that the strain of different welding joints is greatly affected by the welding process [14,15]. However, the deformation characteristics of X80 steel girth-weld joints, especially the local strain rule in the WM, still need to be further clarified.
There are obvious differences in the mechanical properties and deformation behavior of girth-weld joints, which are caused by the uneven microstructures of different zones. In terms of tensile properties, there is usually a Hall–Petch relationship between the yield strength and the grain size of low-alloy steel [16]. Hard and brittle M–A islands can also affect the mechanical properties of welded joints. Yang found that the composition of M–A components made the fusion zone a fracture-risk zone with low toughness [17]. Nazmul Huda et al. studied the tensile fracture behavior of welds with different thicknesses, indicating that both cross-weld tensile specimen fracture in the fine grain HAZ and the M–A islands affect fracture behavior [18]. At present, most of the research is focused on toughness and overall tensile strength, and there is still little discussion on the deformation behavior of welded joints in the whole tensile process, nor, in particular, on undermatching X80 steel welded joints and their relationship with strain.
In this paper, the strain law, deformation behavior and microstructure characteristics of undermatching X80 steel girth-weld joints in practical application were studied. It was found that, compared with remote strain, the law of the degree of strain concentration in weld joint zones at different tensile stages was different, causing serious damage and final failure to occur in the WM. The relationship between microstructure characteristics, deformation behavior and local strain are studied to fully understand the correlation between microstructure and tensile fracture behavior of undermatching X80 pipeline steel welded joints, insufficient relevant research work having been carried out to date.

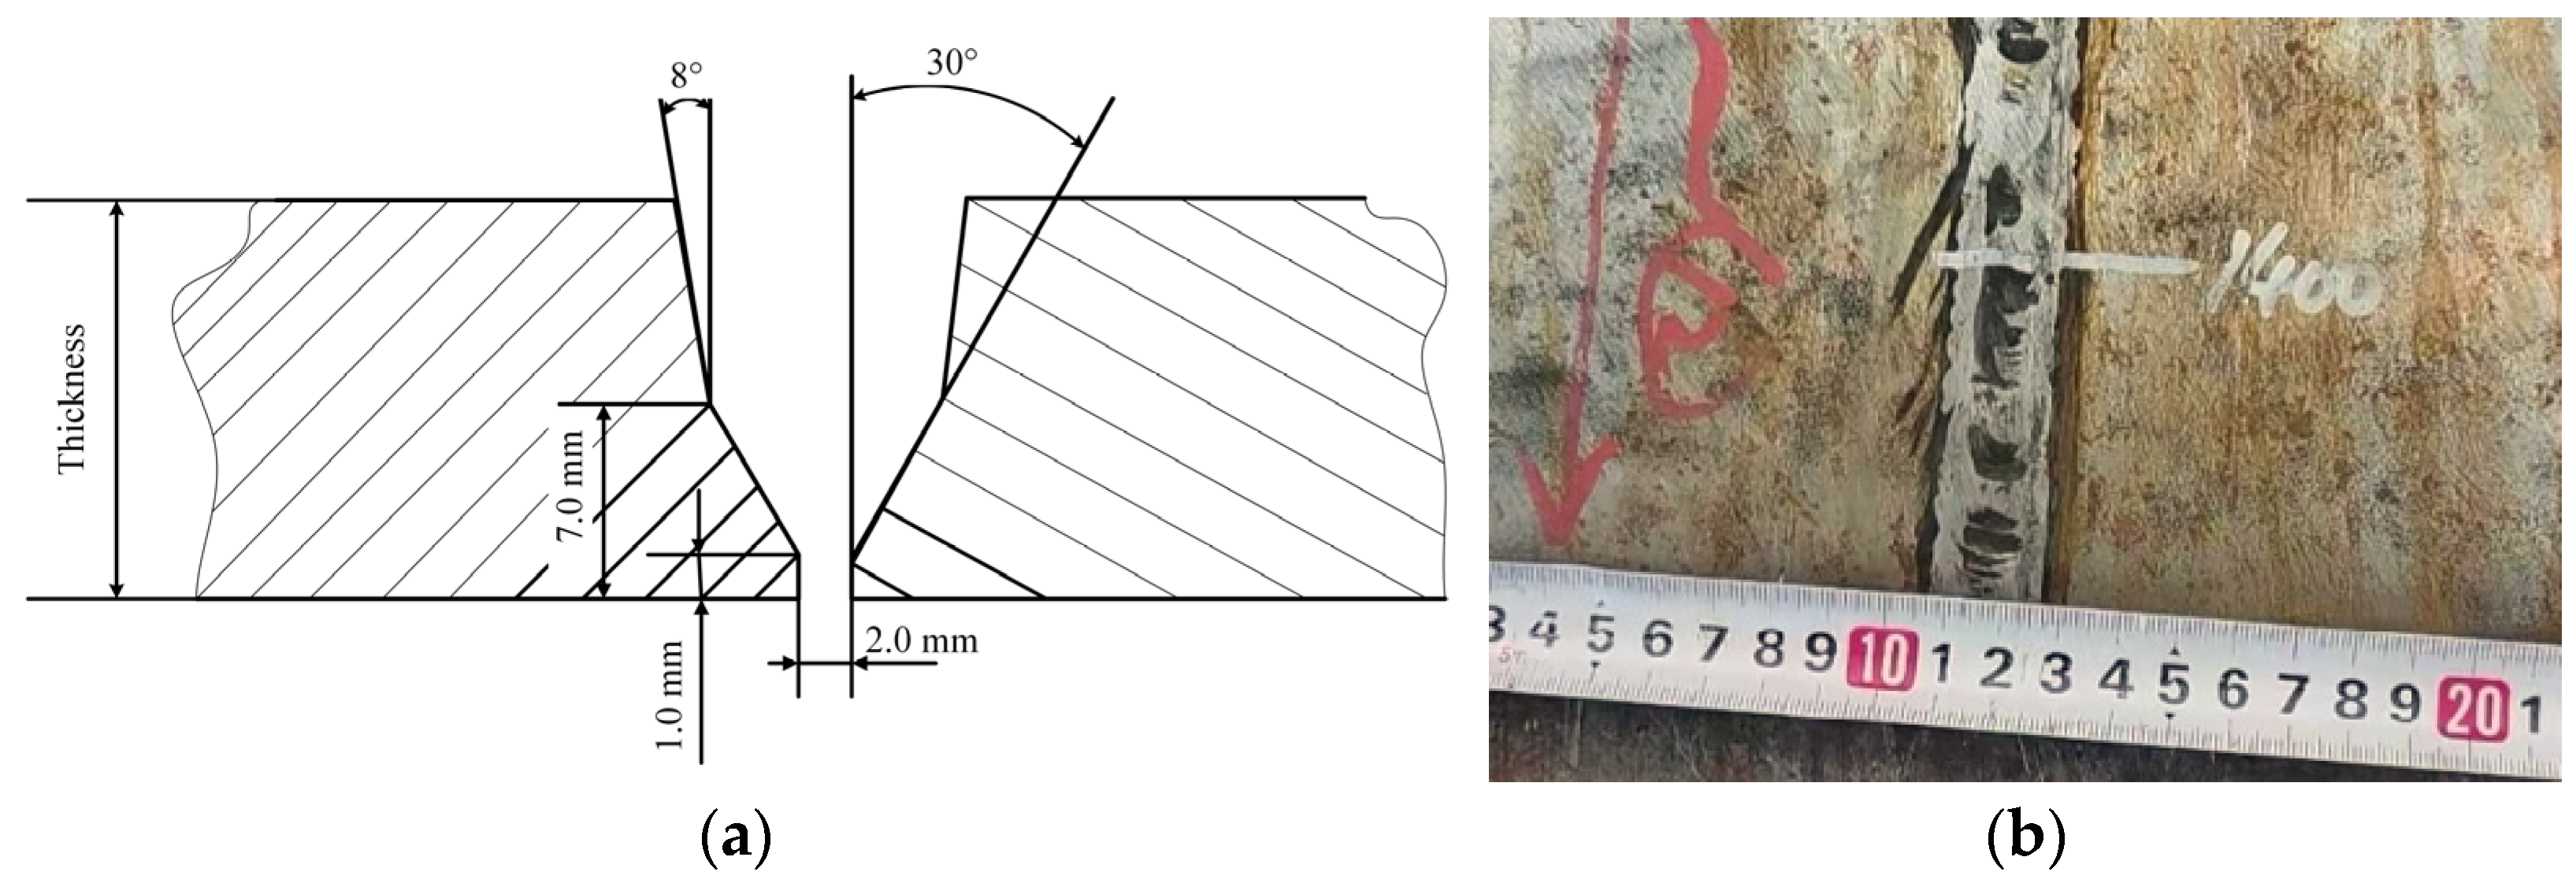
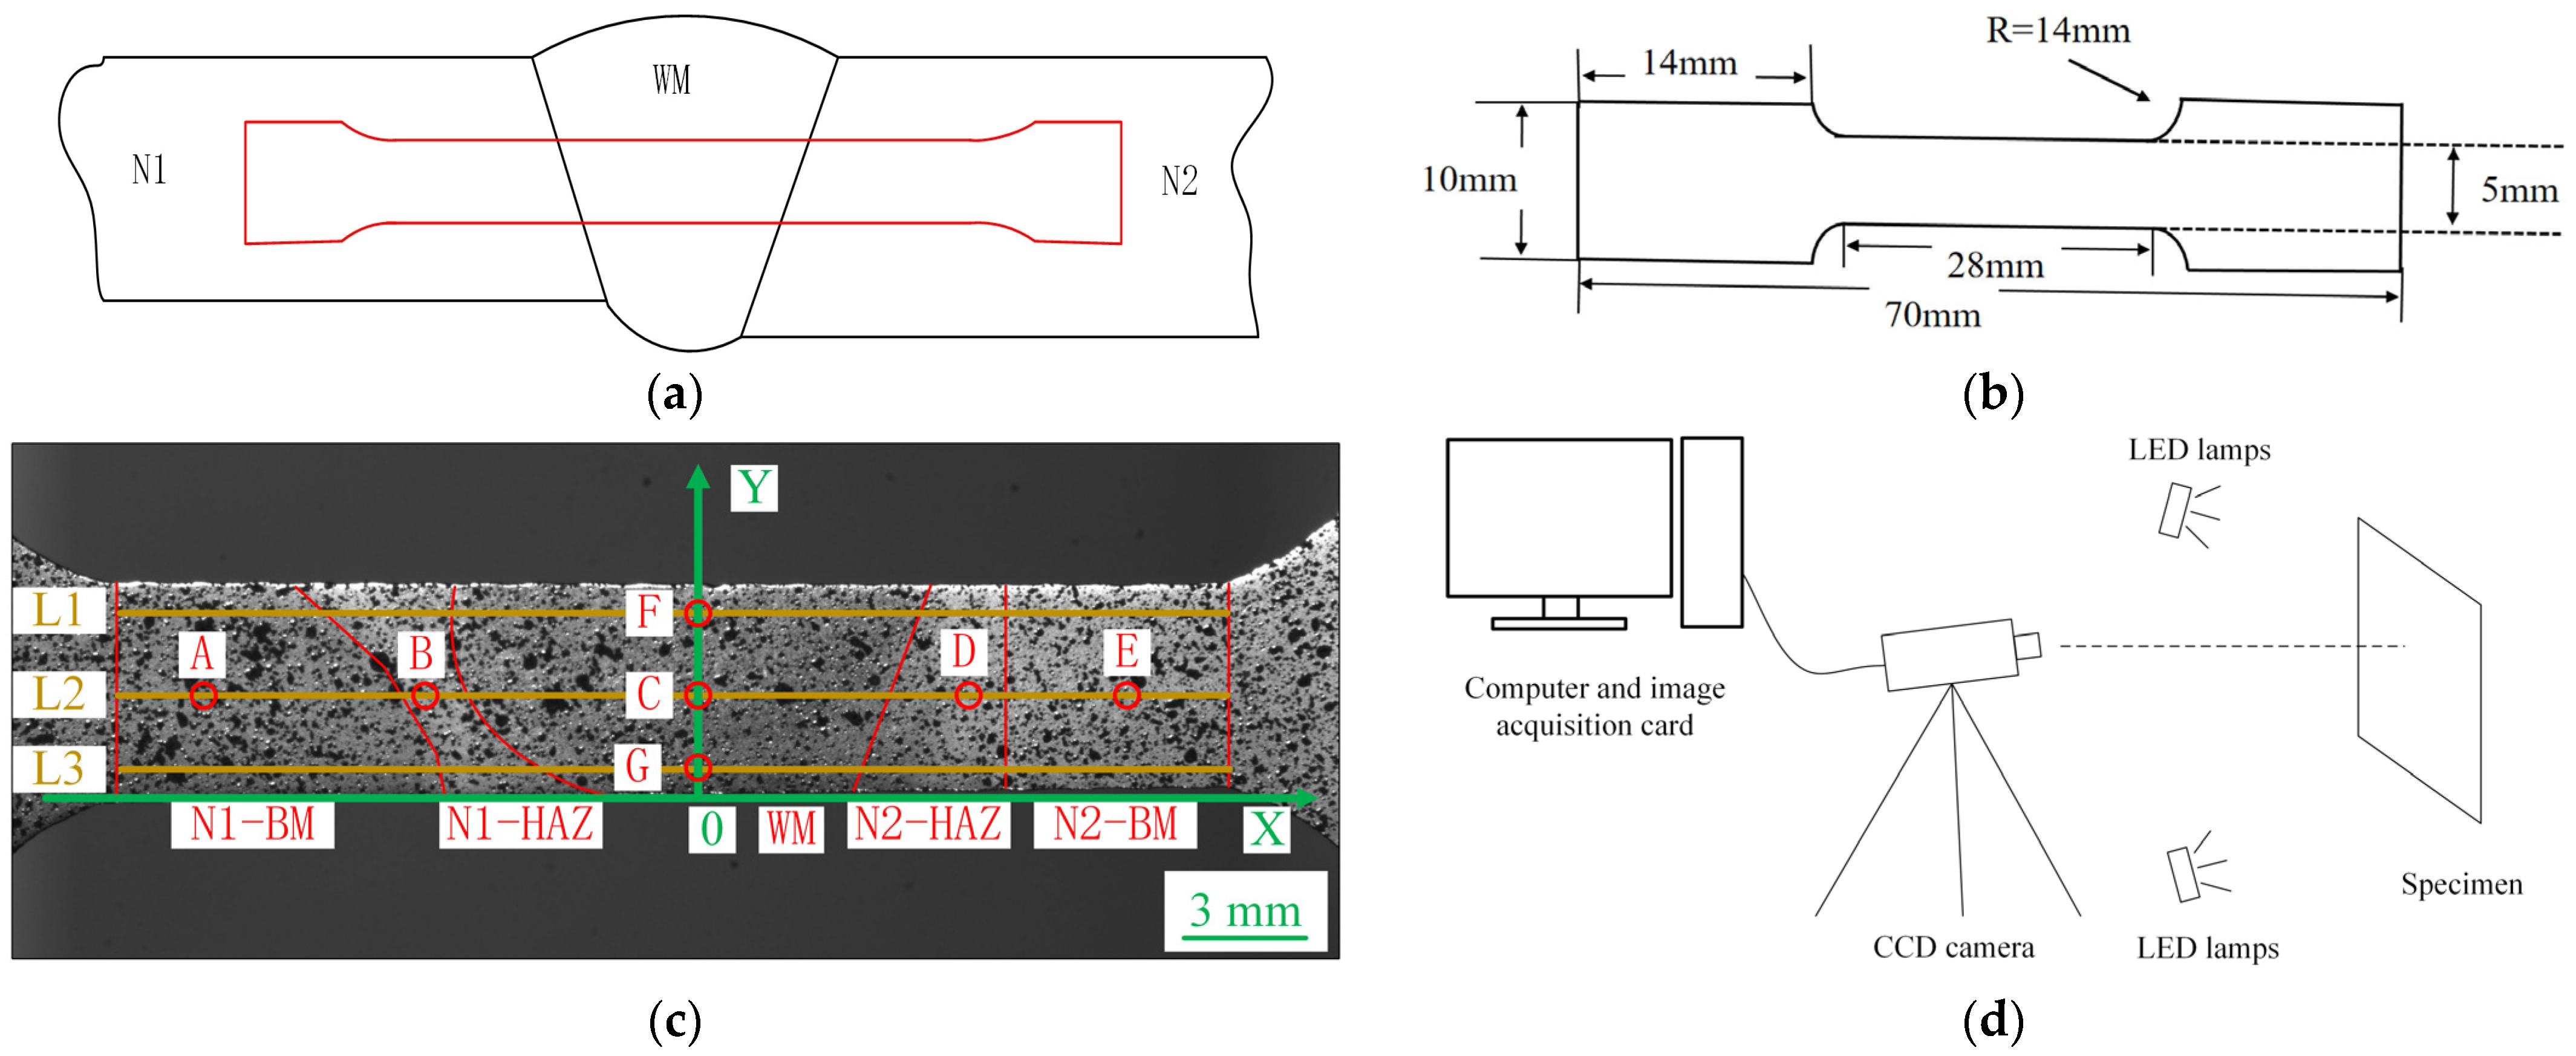
2. Materials and Methods

The test material was taken from an actual service X80 steel girth-welded joint. The base metal (BM) on both sides of the welded joint was API X80 pipeline steel with thicknesses of 12.8 mm and 15.3 mm, respectively, which were marked as N1 and N2. The yield strengths of N1 and N2 were 585 and 565 MPa, respectively, and the tensile strengths were 756 and 735 MPa, respectively. The girth-weld joint diameter was 1060 mm, which was an unequal-wall-thickness girth weld. The welding process used for the girth weld was semi-automatic welding. The welding parameters are shown in Table 1, and the groove shape and an image of the finished weld plate are shown in Figure 1. The chemical composition was analyzed by spectral analysis using a Shimadzu PDA-8000 (Shimadzu Corporation, KYOTO, Japan). The chemical composition of the studied X80 pipeline steel conformed to the API 5L standard, as shown in Table 2.
The tensile test specimen was a non-standard dogbone shape, the specimen length direction was parallel to the pipe, the WM of the girth weld specimen was located in the middle of the tensile test specimen, and the geometric shape and detailed specimen size are shown in Figure 2a,b.
For the tensile test, a DIC experimental system was used, comparing an Instron 8801 (Illinois Tool Works Inc., Norwood, MA, USA) experimental machine and a Vic-2D DIC system (ACQTEC, Shanghai, China). The image acquisition device consisted of two high-resolution 2448 × 2048 pixel CCD cameras. The angle of the two cameras in front of the sample was about 30°, and two LED lamps were used for lighting; a DIC system schematic diagram is shown in Figure 2d. The accuracy of the DIC measurements was closely related to the quality of the speckle image. Gray distribution in an image and the selection of subset size are affected by speckle in DIC analysis. Before the DIC test, matte paint was sprayed to make the pattern size 3–5 pixels to ensure the best recognition effect [19,20]. During the stretching process, image acquisition and displacement loading were carried out at the same time, and the subset size was 23 × 23 pixels, the step size was 5 pixels, the displacement loading mode was adopted at room temperature, and the loading rate was 2 mm/min. After the tensile test, the Ncorr (v1.2, Ncorr, USA) software was used to analyze and collect images [21].
In order to further determine the tensile deformation characteristics of the girth weld, the positions of the typical points of the specimen were marked. As shown in Figure 2c, the lower edge of the tensile specimen parallel section was taken as Y = 0, and the midpoint of L1 was X = 0. In addition, the Y-axis coordinate values of L1, L2 and L3 were 0.7 mm, 2.5 mm and 4.3 mm, respectively, which were marked for strain analysis from the cover welding to the backing welding. N1-BM, N1-HAZ, WM, N2-HAZ and N2-BM were used to denote the N1 BM zone, the N1 heat-affected zone, the weld metal, the N2 heat-affected zone and the N2 BM zone, respectively. Seven characteristic points were marked for strain analysis and deformation behavior.
In order to observe the deformation behavior of the sample, a method of combining the Instron 8801 testing machine (Illinois Tool Works Inc., Norwood, MA, USA) with the JSM 6010 (Japan Electronics Co., Ltd, Tokyo, Japan) SEM was used to conduct the in situ tensile test. After the sample was stretched to the different strain values, loading was stopped, and the sample was removed. The surface deformation of the sample was observed by SEM. In this study, the specimen was stretched twice, and the stress–strain curve of intermittent tension is shown in Figure 3. The first discontinuous tensile test is defined as No.1. When No.1 stopped, the sample was in the stage of uniform plastic deformation. The second discontinuous tensile test was defined as No.2. When No.2 stopped, the stress had decreased rapidly after exceeding the tensile strength, indicating that the sample was in the critical fracture stage. The deformation observation points of each zone are shown as points A–G in Figure 2c. The M–A percentage was calculated by Image-pro plus (6.0, Image-pro plus, USA).

3. Results

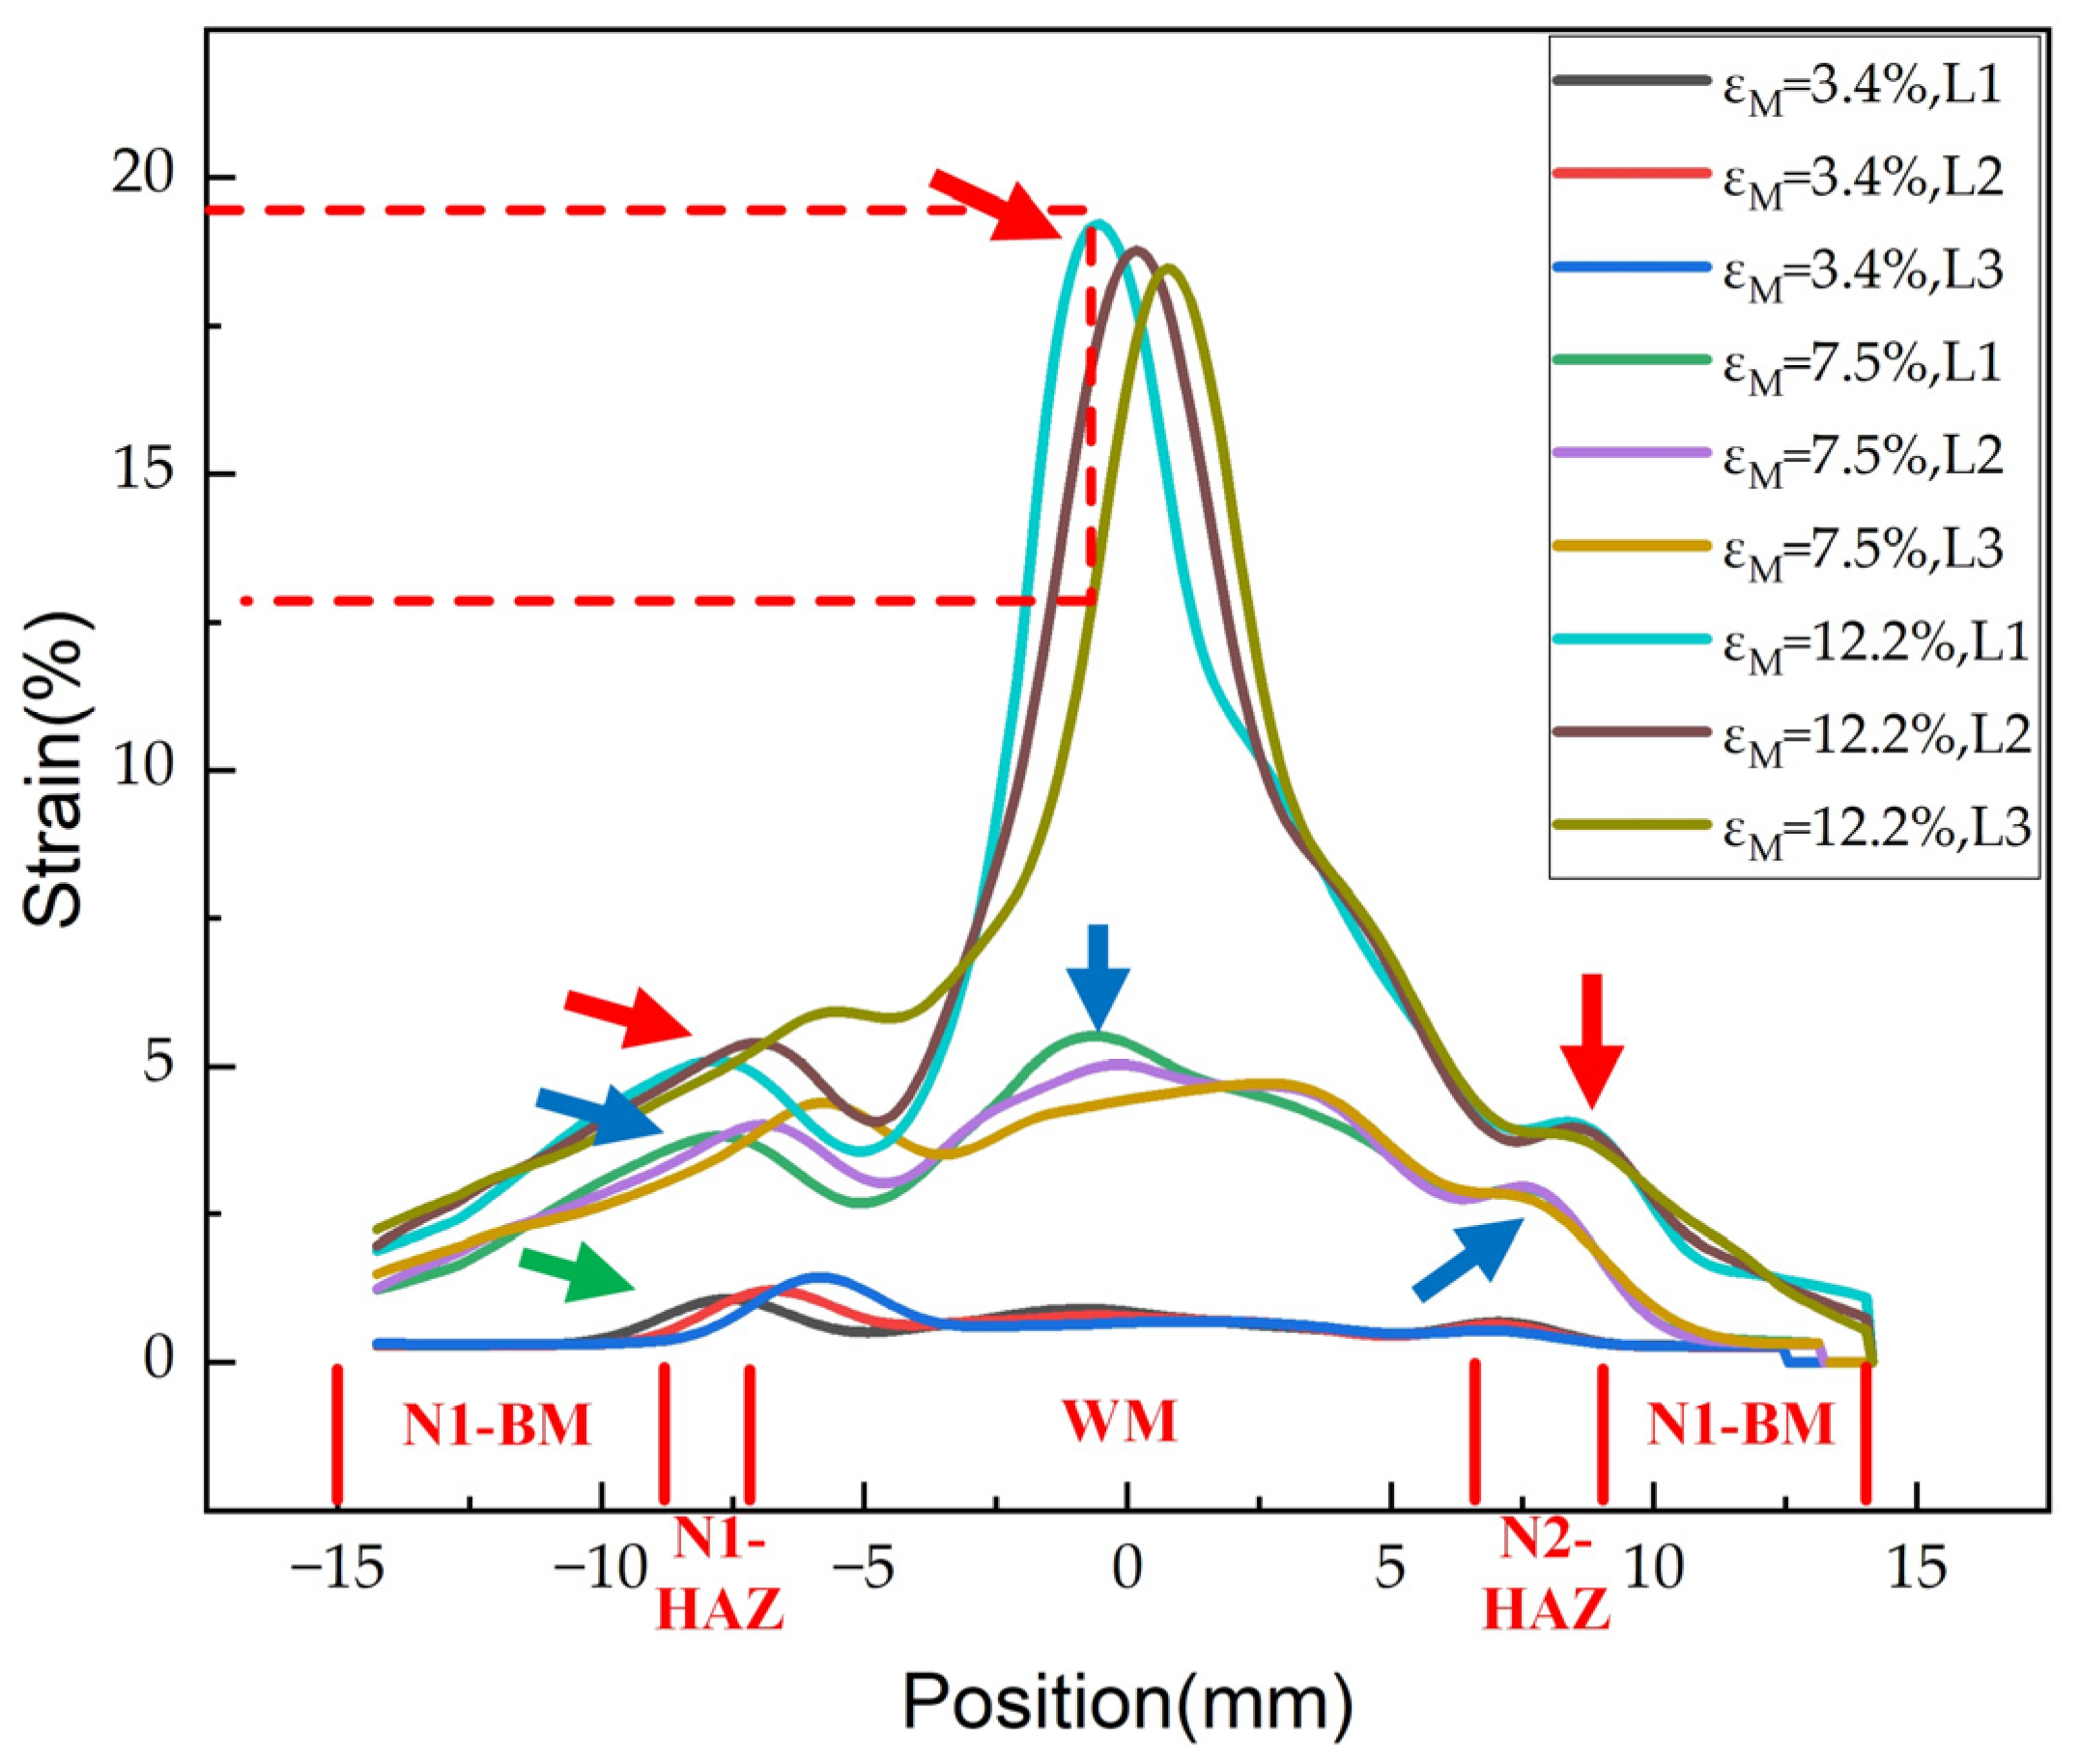
3.1. Strain Distribution of Girth-Welded Joint

In order to clarify the strain law of welded joints at different deformation times, the stress and strain curve of the sample is shown in Figure 4a. The strain was calculated using the data measured by the displacement sensor, and its strain was defined as the macroscopic strain, represented by ε M . The ε M of the specimen was shown in the tensile curve at different tensile stages. The tensile yield strength of the specimen was 497 MPa and the tensile strength was 623 MPa, which also meant that the fracture location of the specimen would be the WM. The distribution diagram of axial strain when ε M = 12.2% is shown in Figure 4b, and there was a serious strain concentration in the WM near the fracture of the tensile sample. The area of the WM in the gauge region was about 51.7 mm2 and 37.8% of the gauge region area. When the width of the WM was very small, the strain distribution and deformation behavior of the heat-affected zone and the WM changed. In this experiment, the WM area was large, and only ε M of the sample was affected. There was no obvious effect on the local strain distribution, deformation mechanism or fracture behavior in the different zones.
The strain change rule at different stages of the tensile process was inconsistent, as shown in Figure 5. At ε M = 3.4%, the sample was in the elastic stage and L1–L3 had a strain concentration area in the N1-HAZ, with the maximum strain value about 1.3%, as shown by the green arrow, and there was almost no deformation in other zones. At ε M = 7.5%, after yielding and small plastic deformation, the local strain peak appears in the WM and the HAZ on both sides of L1–L3, as shown by the blue arrow. The maximum strain of the WM and the N1-HAZ were about 5.2% and 4.1%, and the maximum strain of the N2-HAZ was about 3.1%. When ε M = 12.2%, the specimen was about to fracture, and the strain concentration phenomenon on both sides of the HAZ still existed. The maximum strain of the N1-HAZ and the N2-HAZ were 5.5% and 4.1%, respectively, which increased slightly to ε M = 7.5%. However, the maximum strain in the WM was about 18.7%, and the strain increased significantly, as shown by the red arrow.
When the X coordinates were the same, in the Y direction, the strain of the BM and the HAZ were the same, which indicated that the strain distribution in the thickness direction was more uniform during the entire tensile process. However, in the WM, the strain difference at the same position increased from 1.2% at ε M = 7.5% to 6.6% at ε M = 12.2%. With the increase in ε M , the strain difference in the thickness direction became more obvious.

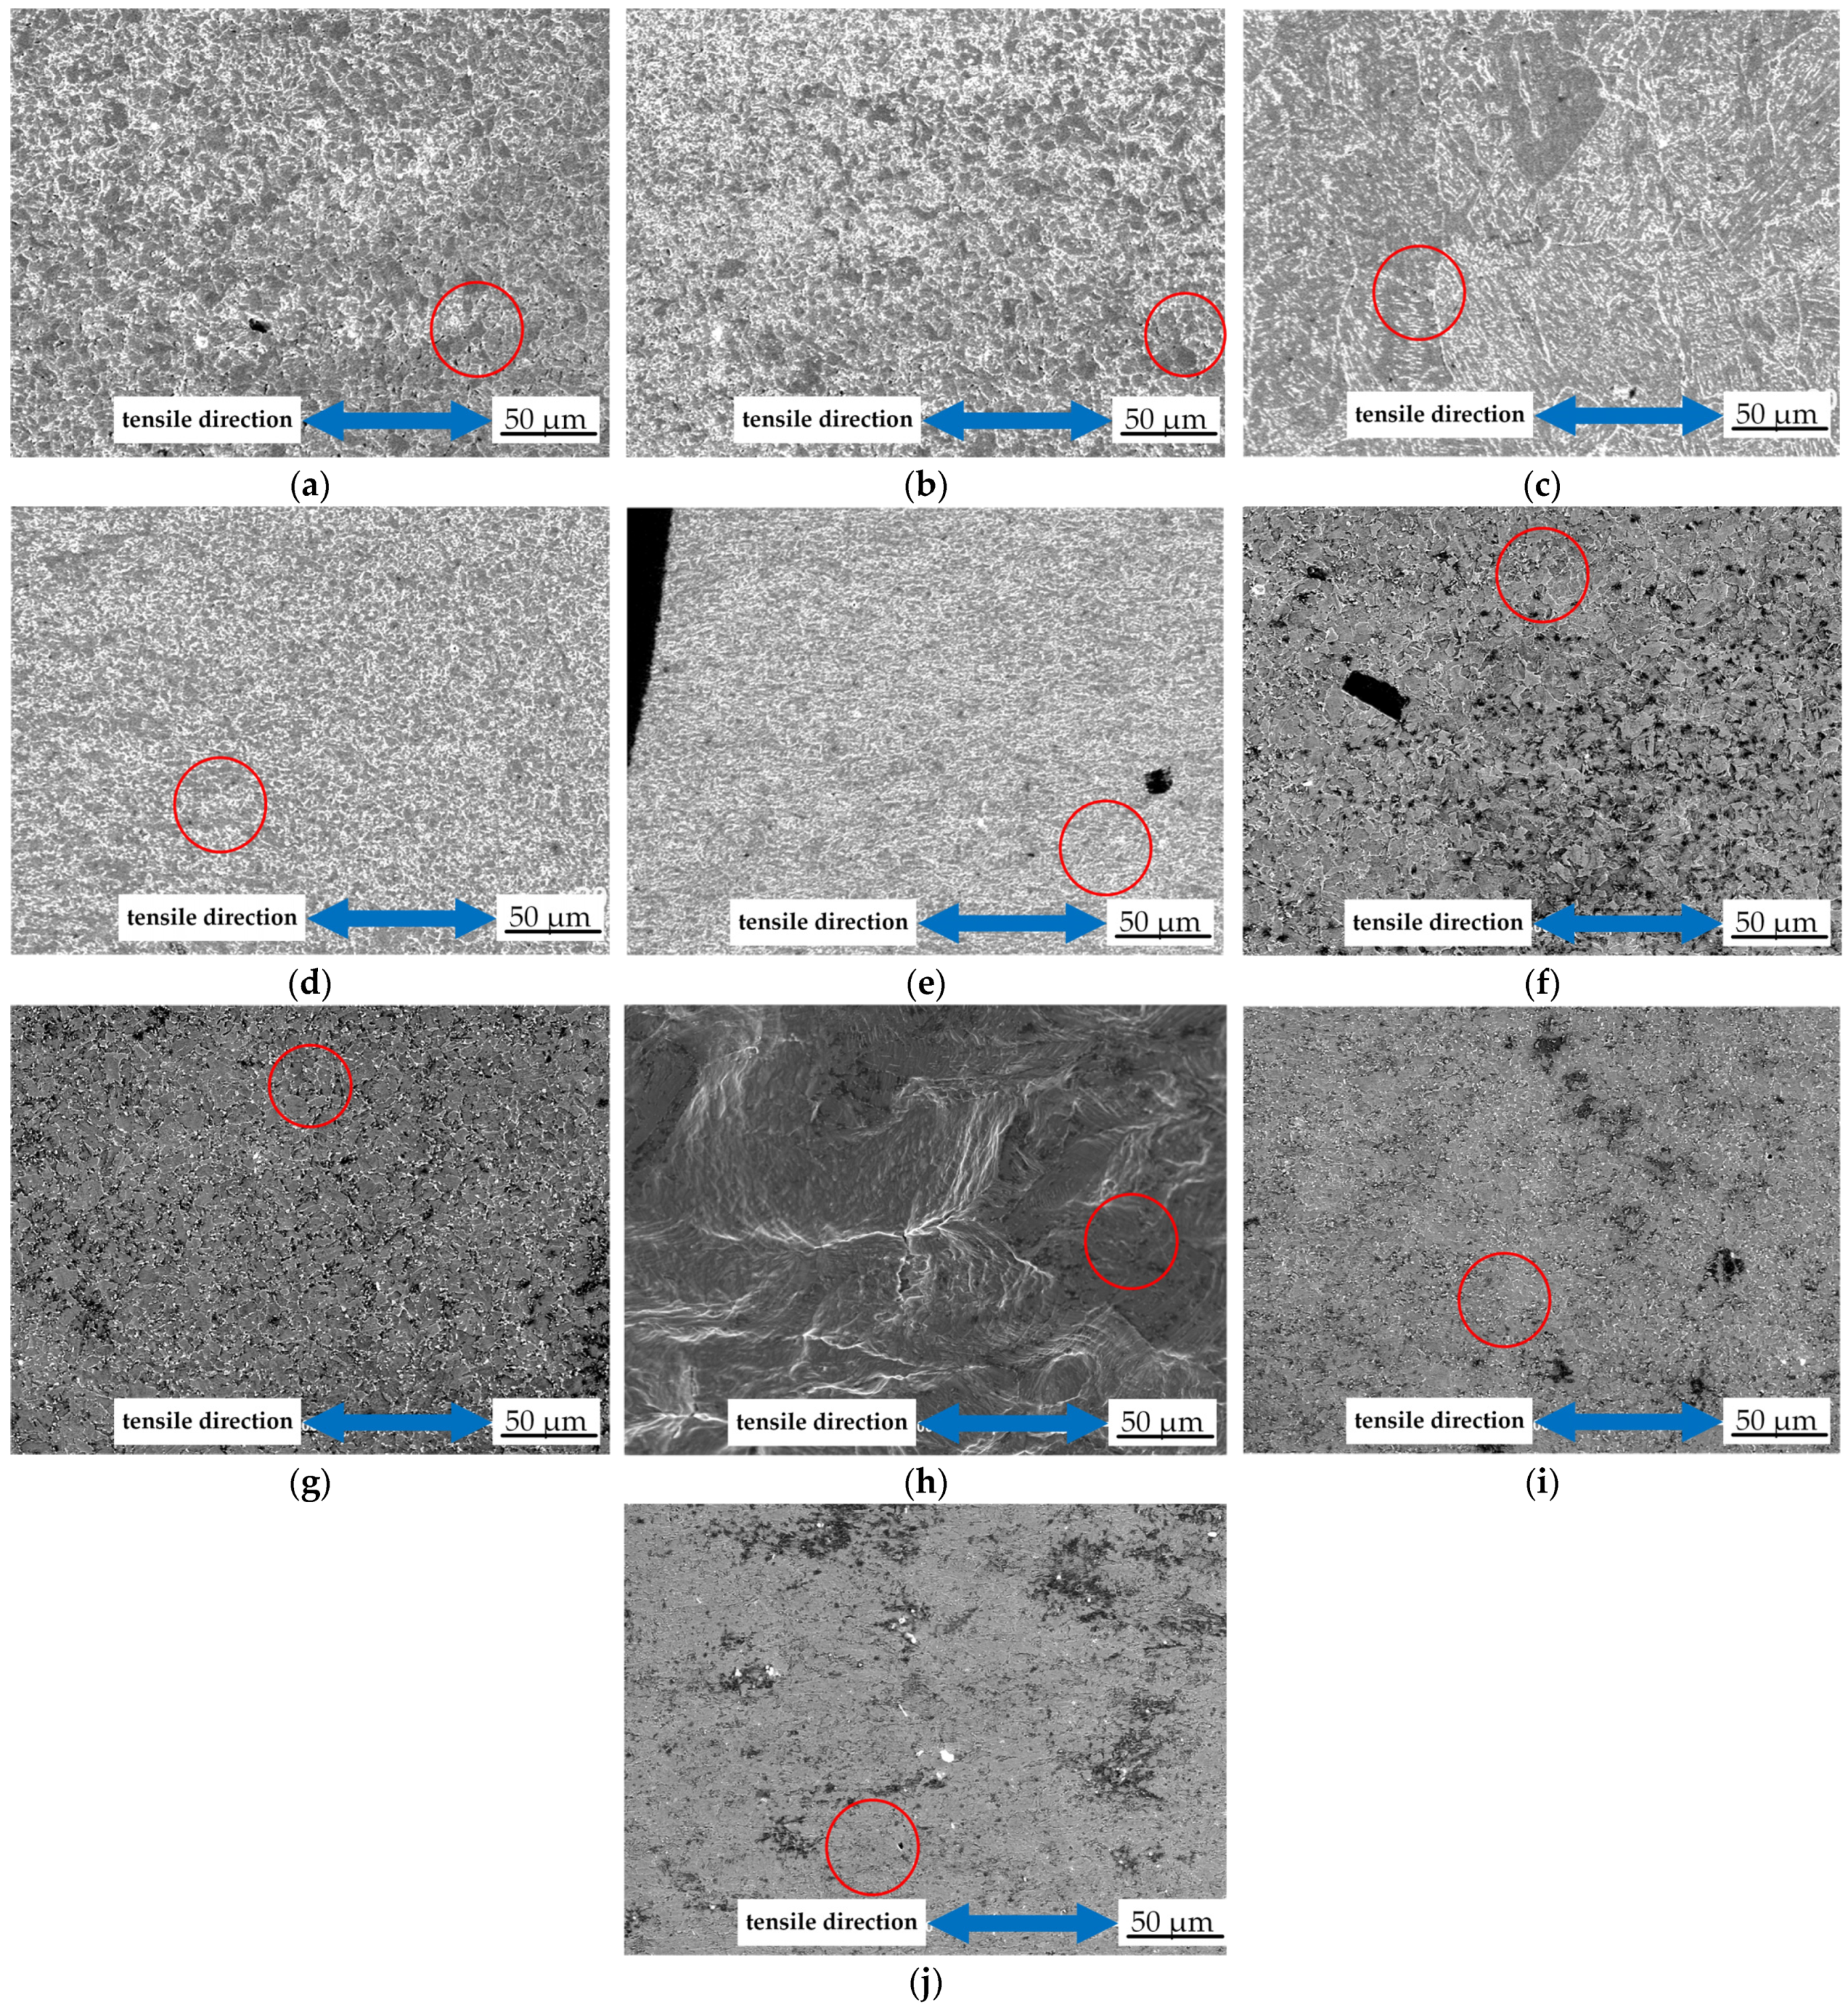
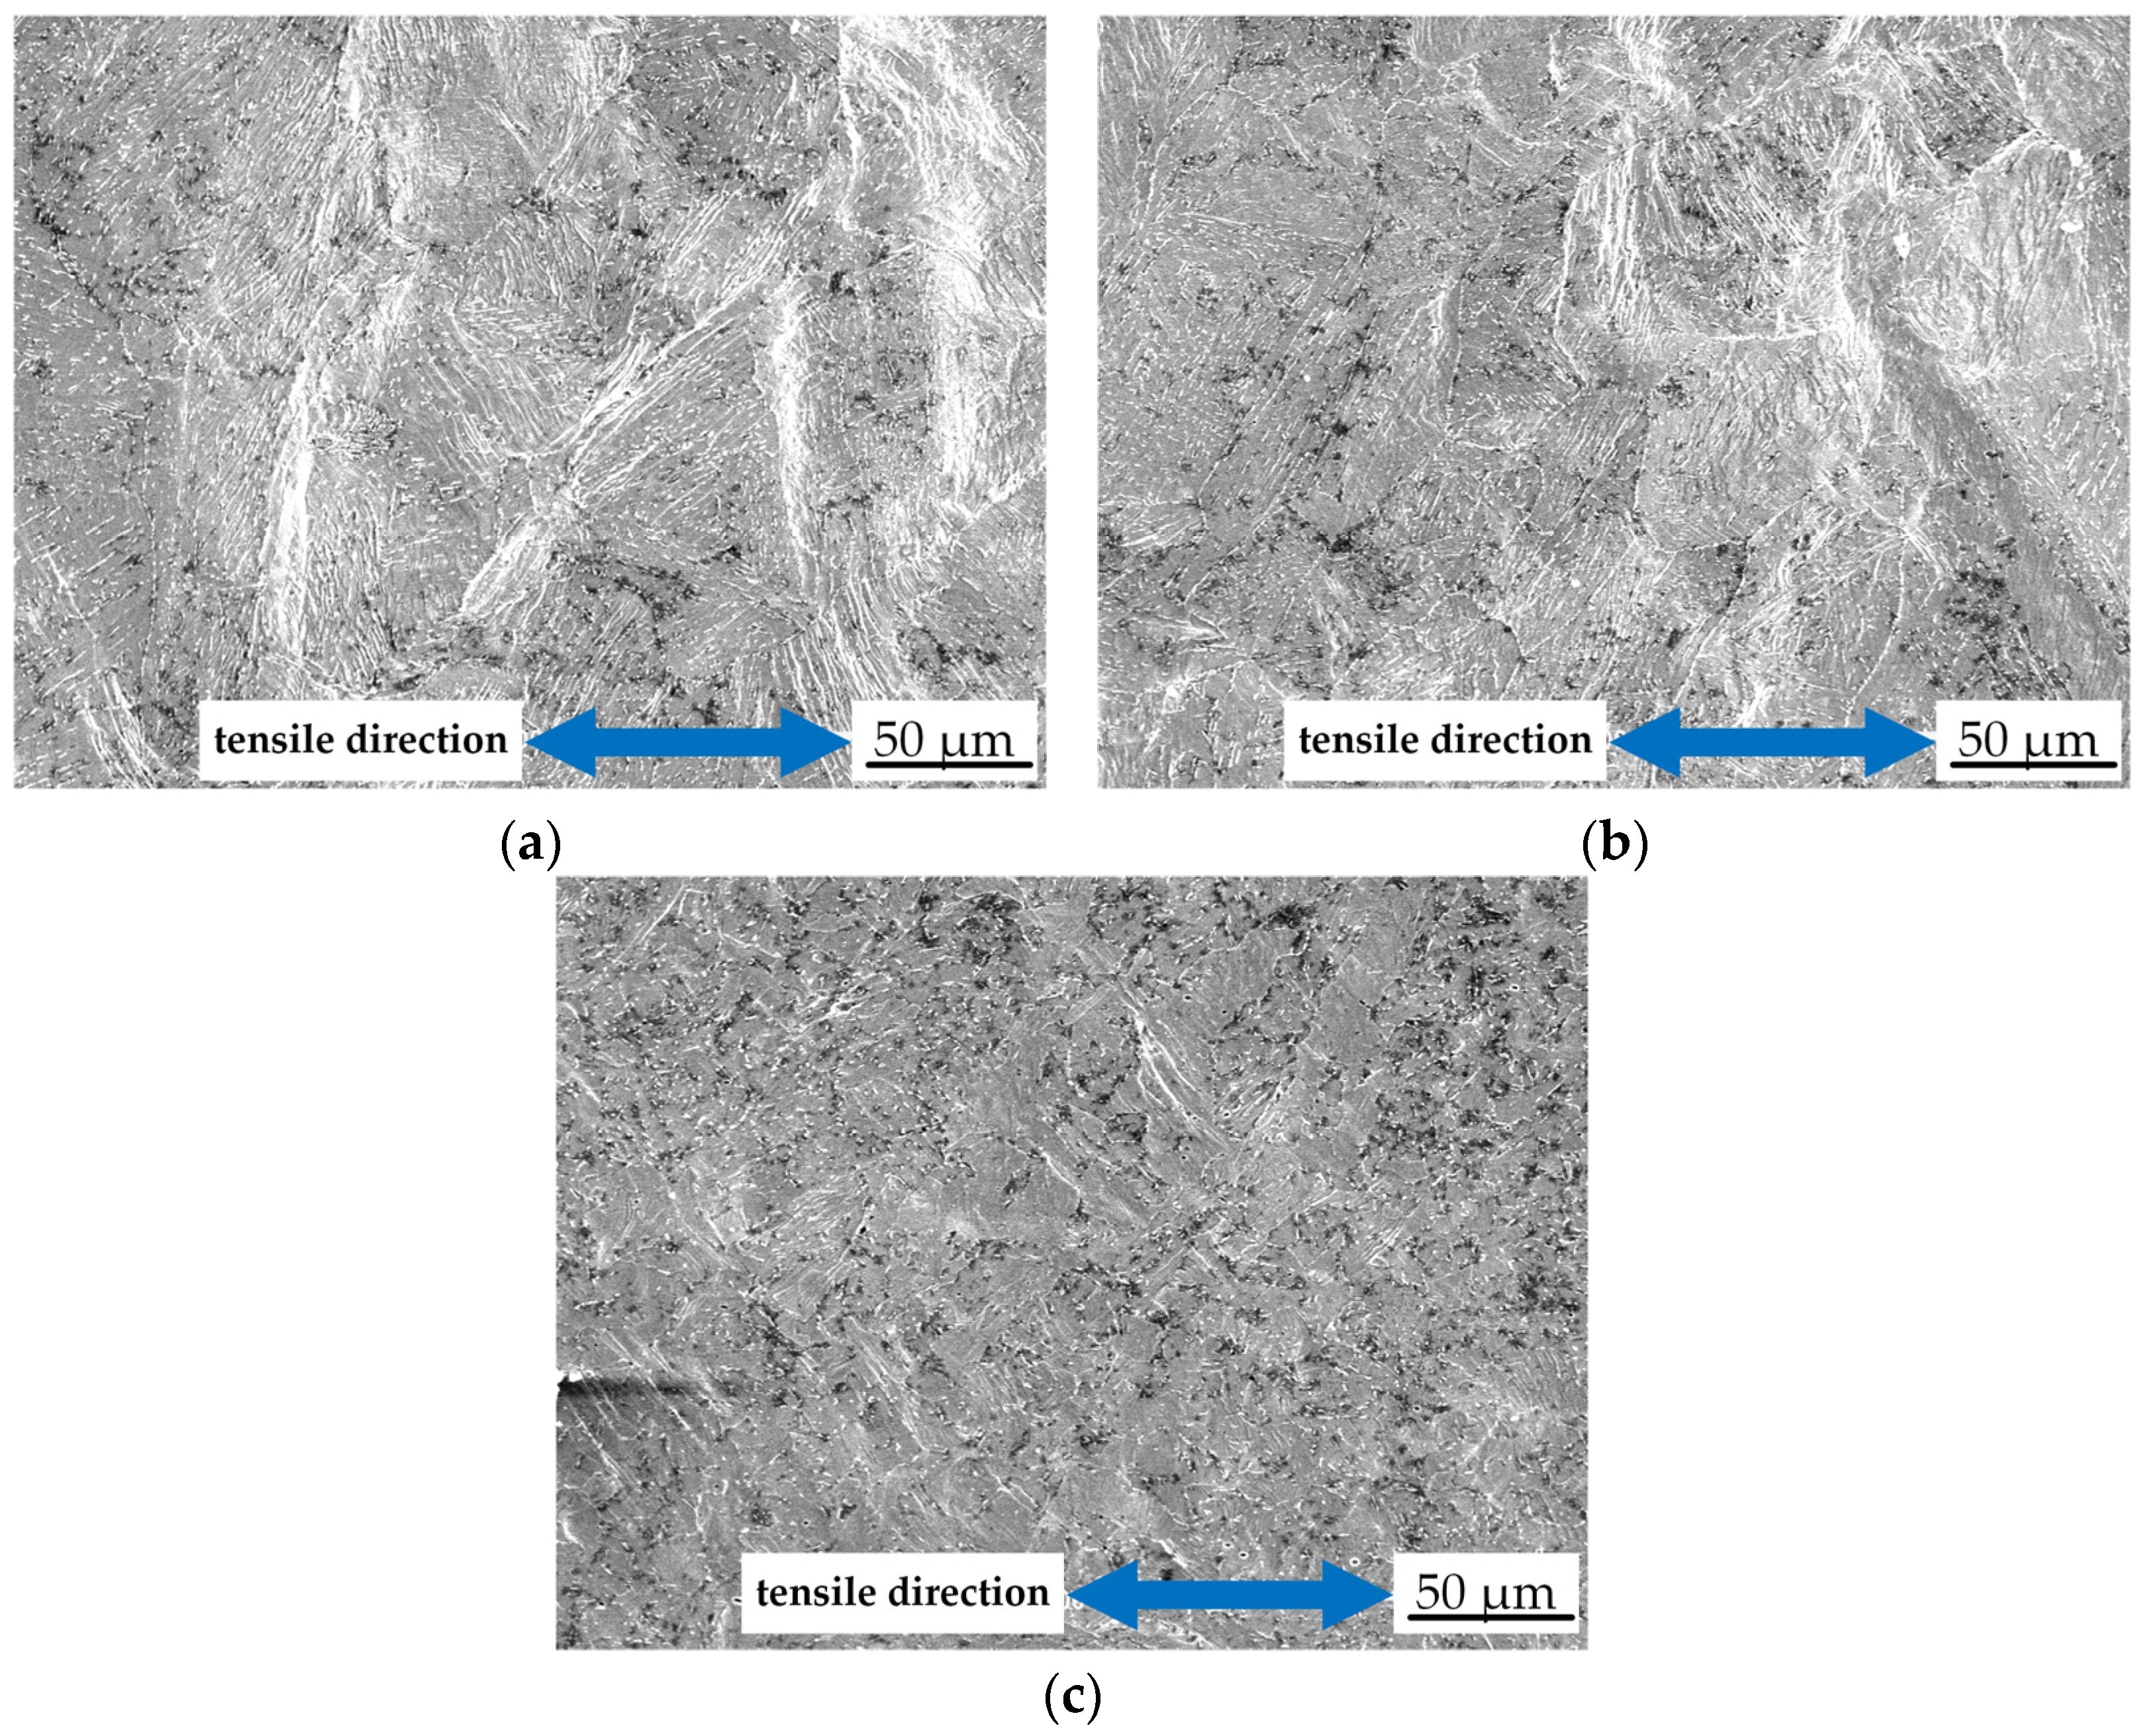
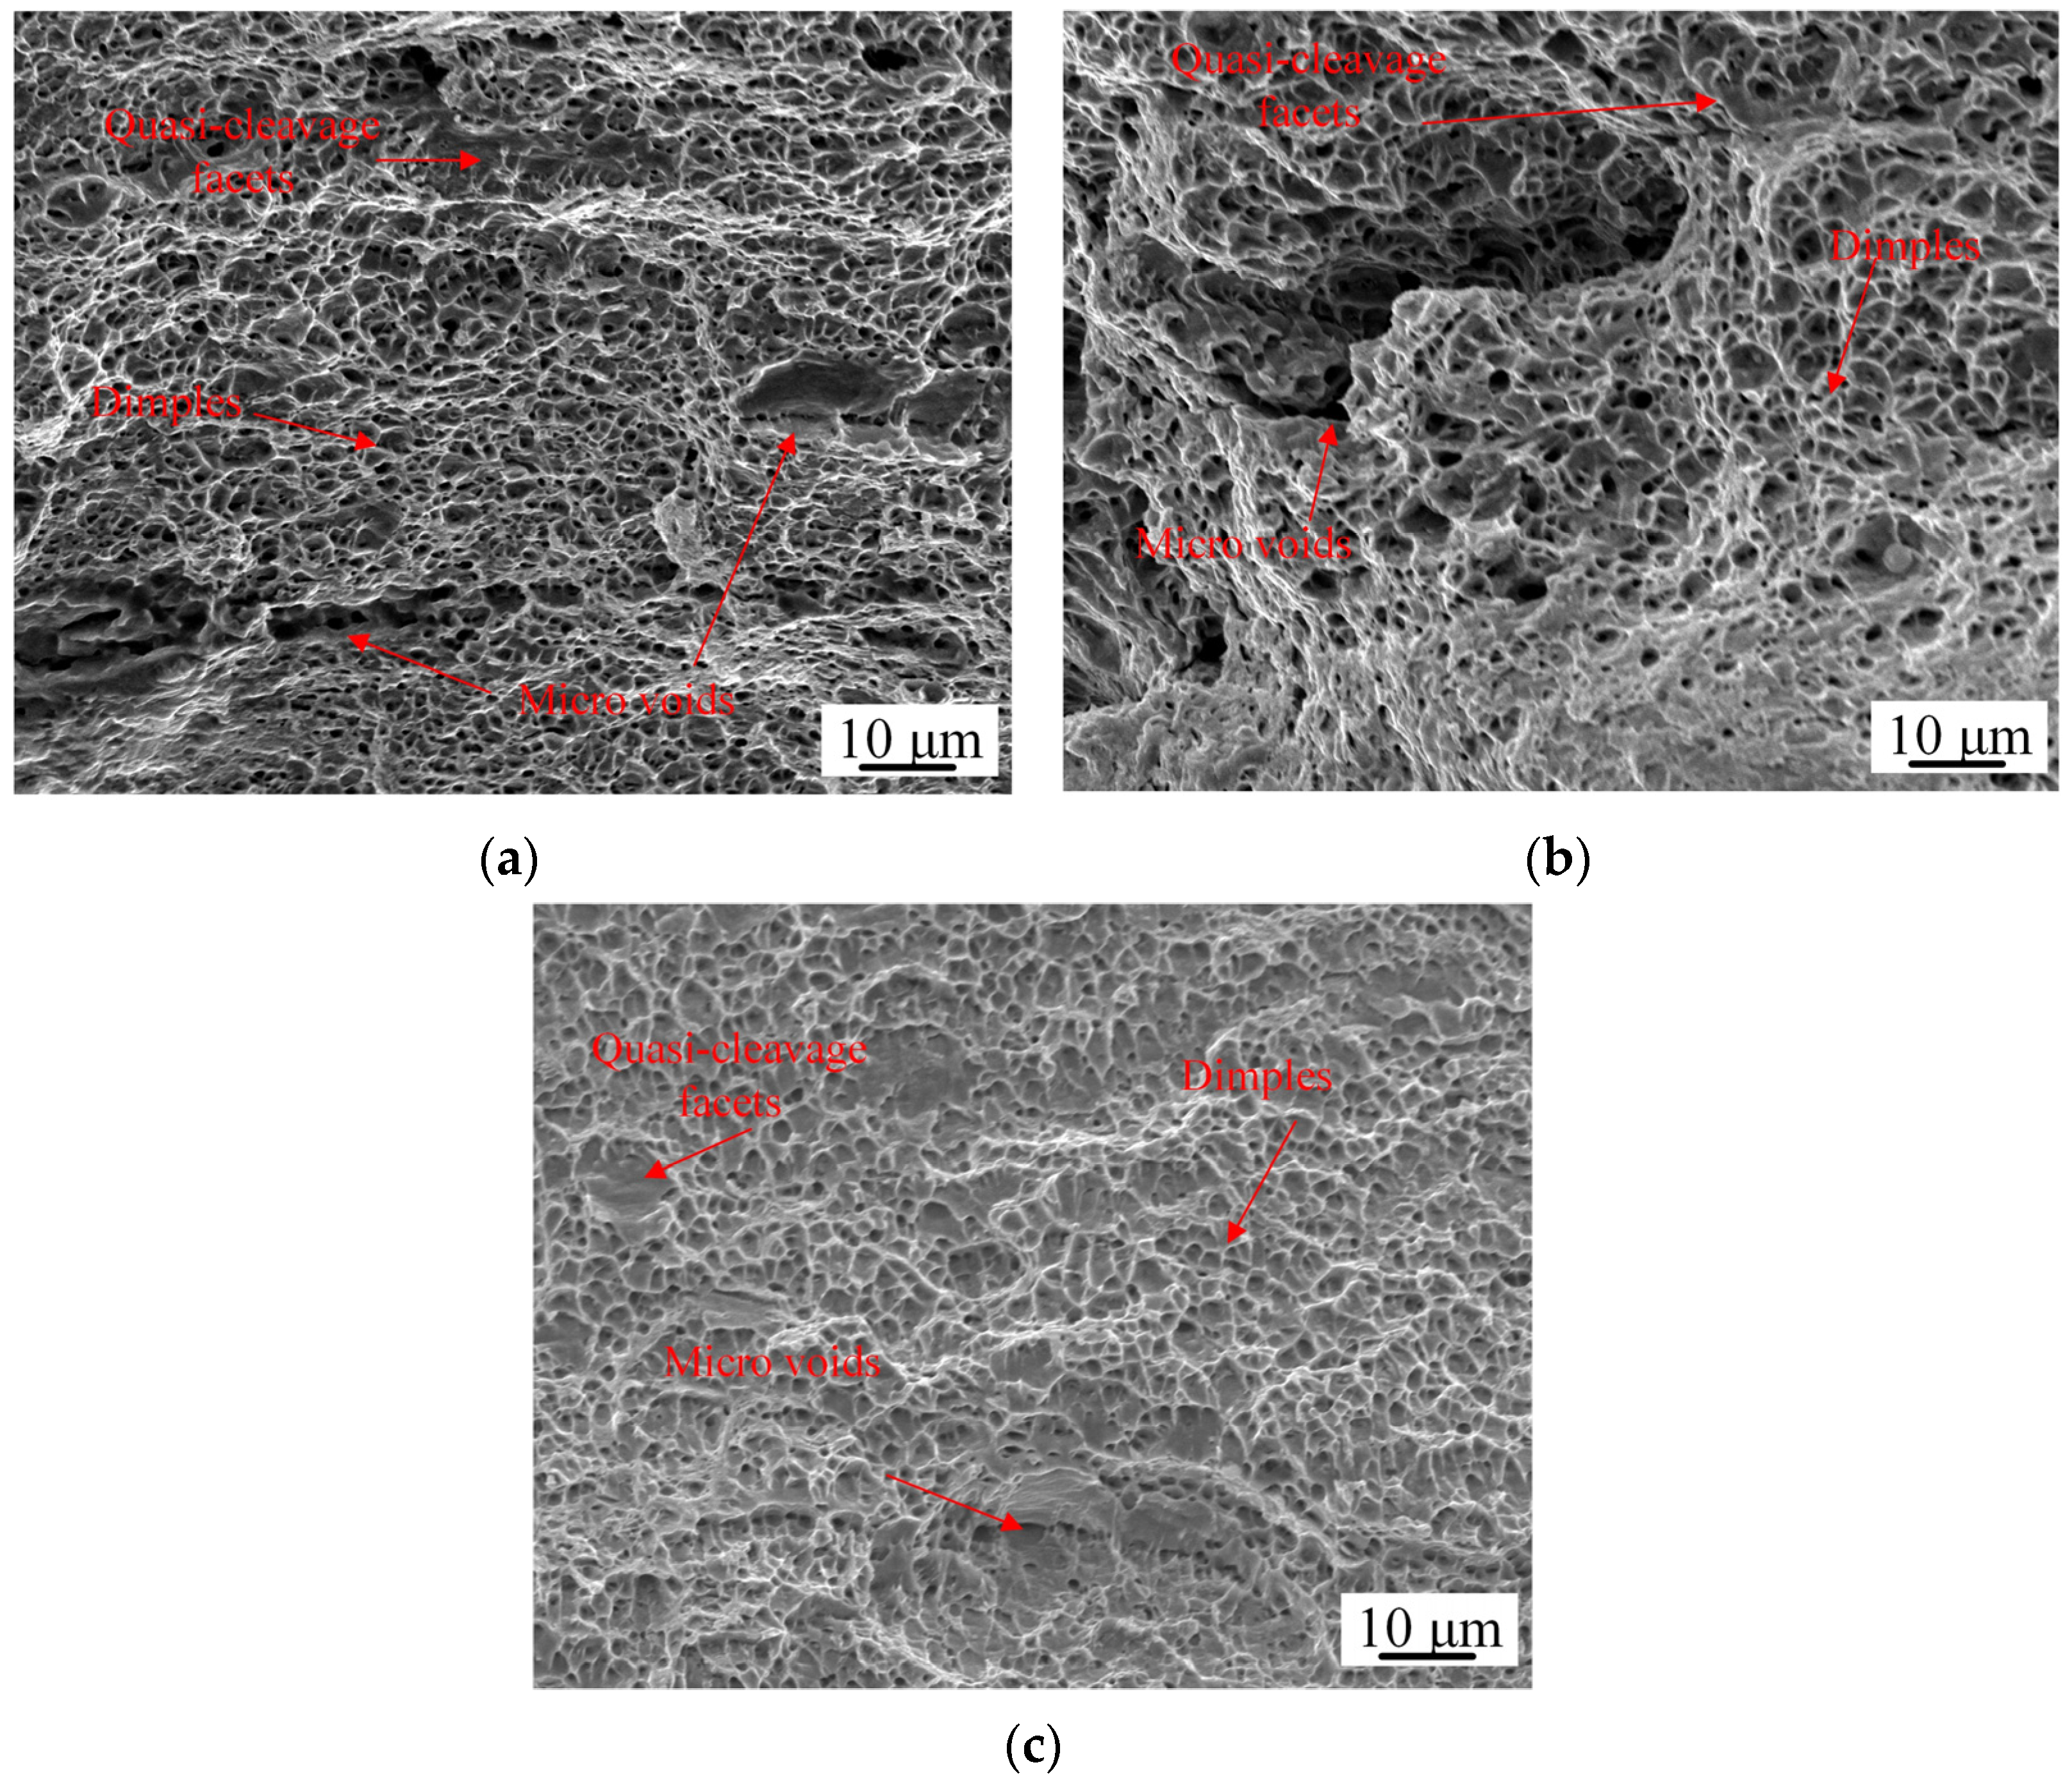
3.2. Microstructure and Deformation Behavior in Different Zones

The coordinates A, B, C, D, E, F and G were (12.18, 2.5), (6.70, 2.5), (0, 2.5), (6.73, 2.5), (10.57, 2.5), (0, 4.3) and (0, 0.7), respectively. In order to clarify the microstructure characteristics and deformation behavior of different regions, SEM was used to observe the microstructure characteristics and deformation of each check point in different tensile stages. The results are shown in Figure 6 and Figure 7. The check points of each position in Figure 6 were marked with red circles to ensure that the observed positions were the same areas. Point A and point E were composed of polygonal ferrite and granular bainite. The grain sizes of point A and point E were 12 μm and 14 μm, respectively. The content of granular bainite in point E was higher than in point A, the size of ferrite was smaller and the number of smaller sized M–A islands was greater. The number of carbides and M–A islands at the grain boundary of point B and point D increased significantly due to the welding thermal cycle, and the grain size increased unevenly. The grain sizes of point B and point D were, respectively, 9 μm and 10 μm, which were smaller than the grain size of the BM. The shape of the grains was more uniform, which was caused by different recrystallization and recovery. At the same time, the size of the M–A islands increased in both HAZs, especially in the N1-HAZ. Compared with other zones, there was larger granular bainite and lath bainite at point C, and the grain size was about 40 μm. There were more M–A islands in the grains of point C, which could also affect tensile deformation behavior. The carbides and M–A islands present at points A–G were, respectively, 10.41%, 12.99%, 13.88%, 15.01%, 14.69%, 11.88% and 13.88%.
After No.2, the morphology characteristics of points A, B, D and E showed no obvious differences from the original state, and there were no tensile holes or cracks on the surface. The increase in strain was caused by a small amount of dislocation movement and small grain deformation. At point C, white slip bands appeared after No.1, with no fixed angle to the tensile stress direction. The observation results of points A–E showed that the structural characteristics and deformation behavior were different in different zones of the same thickness.
The microstructure and deformation behavior of different thickness positions in the WM were different, as shown in Figure 7. The welding process was multi-layer and multi-pass welding, and the later pass welding could cause different thermal cycles in the microstructure of the previous pass weld, thus affecting its microstructure. As shown in Figure 7a–c, the structure types of the three points were basically the same, both being granular bainite and polygonal ferrite. The grain size and the distribution and quantity of the M–A were different. The grain at points F and C was larger, while that at point G was smaller. After No.2, slip bands appeared at points F, C and G, but the number of slip bands at point F was greater than that at points C and G, and the distribution of slip bands was denser. There were many slip bands at point F, indicating that the deformation was more serious, which could have caused the strain at this position to be higher than that at points C and G. Test No.2 caused serious deformation of the sample, and the deformation characteristics and deformation mechanism of the WM at this stage were similar to those at adjacent fractures. It could be reasonably inferred that when there was further loading, the uneven distribution of slip bands would remain until fracture, which was consistent with the strain law of the WM with different thicknesses in Figure 5.
The final fracture position of the sample was the WM. The SEM images of different thicknesses on the fracture surface are shown in Figure 8. Although there were dimples, microvoids and quasi-cleavage facts in all three positions, different fracture characteristics still existed. Specifically, at Y = 4.3 mm, the proportion of dimples and the single dimple depth were both larger, and the distribution of micropores was more concentrated. The larger microvoids indicated that the local stress changed greatly and that the deformation was uneven during the fracture process. At Y = 2.5 mm, compared with Y = 4.3 mm, the dimples area was reduced, and secondary cracks appeared together with larger-sized micropores, and the quasi-cleavage surface had no obvious change. When Y = 0.7 mm, it was closer to the root welding. There was no larger secondary crack, the depth of dimples decreased, and the quasi-cleavage area increased compared with Y = 4.3 mm and 2.5 mm.

4. Discussion

4.1. Strain Non-Uniformity in Different Zones

In order to further clarify the differences in strain concentration degree in the length and thickness directions, the local strain concentration coefficient was used to quantify the strain concentration degree of points A–E on the line Y = 2.5 and points F, C and G points, at the position X = 0. The equation calculation was based on the strain of point A. The strain concentration coefficient was [22]:
K C R ε C R ε A
where K C R is the strain concentration coefficient of each point, ε C R is the strain of points A–G and ε A is the strain of point A. The strain concentration results at each point are shown in Table 3. During the tensile process, K E < 1, indicating that the strain damage at point E was always less than at point A. The range of K B and K G was 1.58–3.00, and the strain concentration at point B was always greater than that at point D. When ε M = 3.4% and ε M = 7.5%, the KCR of the WM was between 2.00 and 2.69, which was similar to that of point B and larger than that of point D. However, when ε M = 12.2%, the WM strain concentration range was the largest. The K C R range of three points in the WM was 4.79–7.13, which was much larger than 1.42–1.94 ( K C R of the HAZ on both sides) and 0.60–1.00 ( K C R of the BM on both sides). At different thickness positions in the WM, the K F was 1.73, which was 113% and 152% of K C and K G , respectively. As ε M increased, there was an obvious difference in the degree of strain concentration in different zones and different thickness positions in the WM, which meant that the damage amount and damage behavior were inconsistent.

4.2. Effect of Microstructure Characteristics on Deformation Behavior

There were no cleavage fractures in the different zones of welded joints after severe plastic deformation (Figure 6), so the increase in strain was mainly controlled by slip. The slip behavior of the welded joints was mainly affected by the nominal deformation, the grain size and the second hard phase, and the grain size of the HAZ and the proportion of hard phase are affected by cooling rate and maximum temperature [23].
Compared with the BM, strain concentration could be found in the HAZ during the whole tensile process. Grain recovery and recrystallization caused by thermal cycling will reduce dislocation density in ferrite, thus forming soft ferrite with low hardness. Tempering also causes the diffusion of C atoms in the matrix to the grain boundary and the formation of M–A islands and carbides at the grain boundary (Figure 6b,d). Lower dislocation density and fewer solid solution C atoms caused ferrite softening, and the dislocation increased rapidly at the beginning of tension, which caused the increase in local macro deformation of the HAZ when εM ≤ 7.5%, as shown in Figure 5. However, due to the smaller grain size and the binding effect of the grain boundary carbides and M–A islands of the HAZ, the strain increased slightly at εM = 12.2%, and there were no slip bands (Figure 6g,i). The strain characteristics and the micro deformation mechanism of N1-BM and N2-BM were similar to the HAZ.
The M–A islands were distributed unevenly, and the grains were large in the WM, as shown in Figure 7. There was a high concentration of plastic strain in the soft phase around slender M–A and M–A islands. Because of the high dislocation density accumulation, the movement of dislocations could be blocked by M–A islands [24]. Carbides could also be the obstacle to dislocation movement, making deformation more difficult [25]. When εM = 3.4%, the M–A islands in the WM would hinder the movement of dislocation, making its deformation similar to that of the BM and smaller than the HAZ on both sides, as shown in Figure 5. When εM ≥ 7.5%, the negative effect of the large austenite grains of the WM on the dislocation hindrance was more obvious. According to the Hall–Petch relationship [16], the coarse grains in the WM could make the yield strength lower. On the one hand, the coarse grain could cause the multi-slip system to be more easily activated, which would result in larger local deformation. On the other hand, fewer geometrically necessary dislocations are accumulated in larger grains, which is considered to be one of the important factors causing work hardening [26]. The lower geometric dislocation density could not hinder the generation and movement of dislocations, resulting in a large number of slip bands. A large number of slip bands and tensile cracks appear at point C in the WM due to severe plastic deformation, as shown in Figure 6h.
In the thickness directions in the WM, when at the same tension stage, the number of slip bands was largest at point F, and the number of slip bands at point C and point G decreased in turn. The distribution of deformation bands was consistent with the strain distribution in Figure 5a. The different deformation amounts and deformation behavior of points F and G were also affected by their different grain sizes and their M–A islands, and the related deformation mechanism was similar to point C. The fracture mechanism was affected by different damage behaviors in different weld zones. From the fracture morphology in Figure 7, it can be seen that dimples were the main microscopic characteristic in the different thicknesses of the weld zone, which is a typical ductile fracture feature [27]. In the process of loading, the deformation mechanism was slip deformation, as shown in Figure 8. With the continuous increase in εM, the slip systems at different positions gradually started up and formed dislocation accumulations around the hard phases, such as M–A and carbides, resulting in voids. With further loading, the voids gradually connected with each other to form a large area of dimple characteristics. The amount of slip in the WM was more than that in the HAZ and the base metal zone on both sides, and the micro cracks in the WM were connected and caused WM fracture. Due to the inhomogeneity of the WM, the area with higher hardness had poor plasticity, and quasi-cleavages and micropores would appear. Compared with the position close to the cover weld (Y = 4.3 mm), the dimple area near the root weld area (Y = 0.7 mm) and the single dimple size were reduced, which proved that the plastic deformation of this area was smaller in the final fracture, as shown in Figure 5. The possible reason was that the smaller grain size and denser M–A components caused lower plastic deformation.

5. Conclusions

In order to further understand the deformation characteristics of the undermatching X80 girth-weld joint, the strain variation and damage behavior of practical X80 girth-weld joints in the tensile process were studied in detail. It was found that:
(1) 
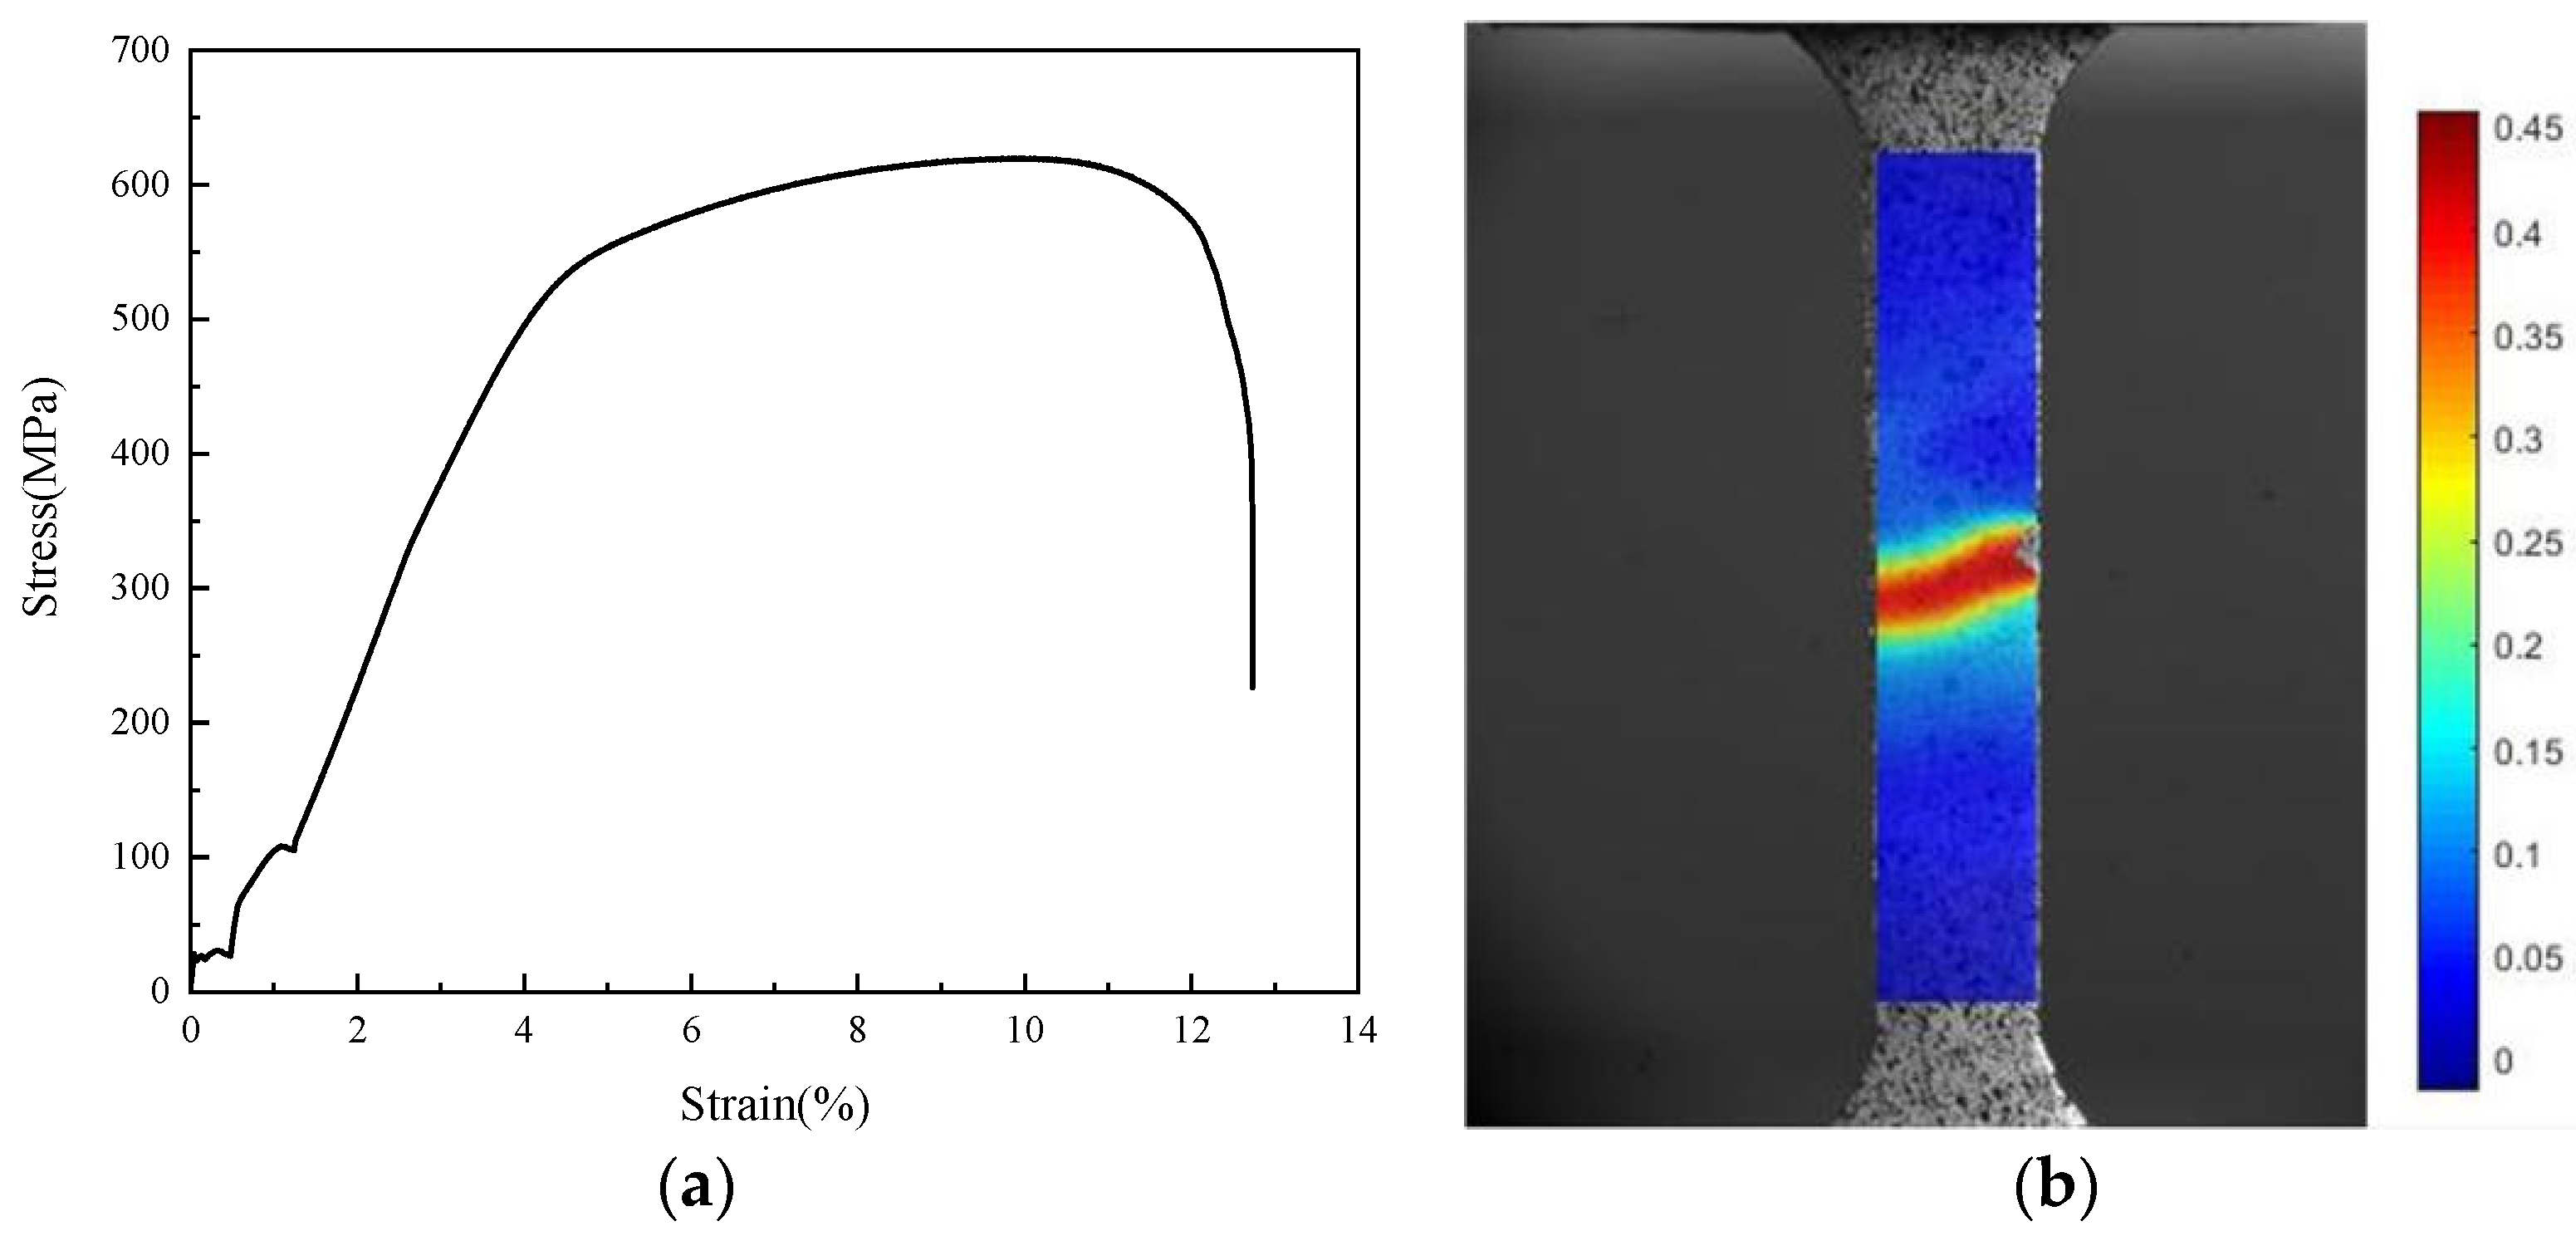
At the middle thickness of the weld joint, there was non-uniform strain between different zones of welded joint. Compared with the BM, strain concentration could be found in the HAZ and the WM. The strain concentration of the WM before fracture was the largest. When εM = 12.2%, the strain concentration coefficient at point C KC was 6.27. The strain distribution in different thickness directions of the WM was uneven. When εM = 12.2%, the KF was 1.73, which was 113% and 152% of the KC and the KG, respectively. The strain concentration of cover welding was the largest.
(2) 
In the necking stage, slip bands with multiple angles to the tensile side were generated in the WM, but there was no obvious change in the BM and the HAZ. The slip bands in the WM led to an increase in local strain. When the WM was in uniform plastic deformation stage, the number of slip bands in the cover weld was higher than that in the filler weld and backing weld areas.
(3) 
The decrease in dislocation density and the content of solidsolution-strengthening elements in ferrite grains resulted in local strain concentration at εM = 3.4%, but the fine grains and the grain boundary M–A islands and carbides prevented an obvious increase of strain at εM ≥ 7.5%. The WM was composed of coarse granular bainite and lath bainite, and the larger grain size and non-uniform M–A could not effectively hinder dislocation movement.

Author Contributions

Conceptualization, Y.Q. and S.Z.; methodology, H.J. and G.W.; software, Q.F.; writing—original draft preparation, Y.W., Y.Q. and L.D.; writing—review and editing, Y.W. and S.Z. All authors have read and agreed to the published version of the manuscript.

Funding

This research was funded by Research on Failure Mechanism of High Steel Grade Pipeline Girth Weld (No. WZXGL202105).

Data Availability Statement

Not applicable.

Conflicts of Interest

The authors declare no conflict of interest.

References

  1. Khalaj, G.; Azimzadegan, T.; Khoeini, M.; Moslem, E. Artificial neural networks application to predict the ultimate tensile strength of X70 pipeline steels. Neural. Comput. Appl. 2013, 23, 2301–2308. [Google Scholar] [CrossRef]
  2. Yue, Y.A.; Xla, B.; Kai, W.A.; Ys, C.; Qf, D.; Dw, E.; Hong, Z.A. Full-scale experimental investigation of the fracture behaviours of welding joints of APL X80 wide plate based on DIC technology. Eng. Fail. Anal. 2022, 131, 105832. [Google Scholar] [CrossRef]
  3. Midawi, A.R.H.; Simha, C.H.M.; Gerlich, A.P. Assessment of yield strength mismatch in X80 pipeline steel welds using instrumented indentation. Int. J. Pres. Ves. Pip. 2018, 168, 258–268. [Google Scholar] [CrossRef]
  4. Sharma, S.K.; Maheshwari, S. A review on welding of high strength oil and gas pipeline steels. J. Nat. Gas Sci. Eng. 2017, 38, 203–217. [Google Scholar] [CrossRef]
  5. Feistauer, E.E.; Bergmann, L.A.; Barreto, L.S.; Santos dos, J.F. Mechanical behaviour of dissimilar friction stir welded tailor welded blanks in Al-Mg alloys for Marine applications. Mater. Des. 2014, 59, 323–332. [Google Scholar] [CrossRef] [Green Version]
  6. Pandey, C.; Saini, N.; Mahapatra, M.M.; Kumar, P. Study of the fracture surface morphology of impact and tensile tested cast and forged (C&F) Grade 91 steel at room temperature for different heat treatment regimes. Eng. Fai. Ana. 2017, 17, 131–147. [Google Scholar] [CrossRef]
  7. Peng, Y.; Wu, C.; Gan, J.L.; Dong, J. Determination of the local constitutive properties of the welded steel joints using digital image correlation method. Construct. Build. Mater. 2018, 171, 485–492. [Google Scholar] [CrossRef]
  8. Agarwal, G.; Gao, H.; Amirthalingam, M. In situ strain investigation during laser welding using digital image correlation and finite-element-based numerical simulation. Sci. Technol. Weld. Joi. 2018, 23, 134–139. [Google Scholar] [CrossRef] [Green Version]
  9. Leitao, C.; Leal, R.M.; Rodrigues, D.M.; Loureiro, A.; Vilaca, P. Mechanical behaviour of similar and dissimilar AA5182-H111 and AA6016-T4 thin friction stir welds. Mater. Des. 2009, 30, 101–108. [Google Scholar] [CrossRef] [Green Version]
  10. Leitao, C.; Galvao, I.; Leal, R.M.; Rodrigues, D.M. Determination of local constitutive properties of aluminium friction stir welds using digital image correlation. Mater. Des. 2012, 33, 69–74. [Google Scholar] [CrossRef]
  11. Bai, R.X.; Wei, Y.P.; Lei, Z.K.; Jiang, H.; Tao, W.; Yan, C.; Li, X.L. Local zone-wise elastic-plastic constitutive parameters of Laser-welded aluminium alloy 6061 using digital image correlation. Optic Laser. Eng. 2018, 101, 28–34. [Google Scholar] [CrossRef]
  12. Yang, Y.; Zhang, H.; Wu, K.; Chen, P.; Liu, X. Strain capacity analysis of the mismatched welding joint with misalignments of D 1,422 mm X80 steel pipelines: An experimental and numerical investigation. J. Pip. Sci. Eng. 2021, 1, 212–224. [Google Scholar] [CrossRef]
  13. Yh, A.; Peng, Z.B. Strain response analysis of API 5L X80 pipelines with a constrained dent subjected to internal pressure. Int. J. Pres. Ves. Pip. 2021, 193, 104472. [Google Scholar] [CrossRef]
  14. Shuai, Y.; Wang, X.H.; Feng, C.; Zhu, Y.; Wang, C.L.; Sun, T.; Han, J.; Cheng, Y.F. A novel strain-based assessment method of compressive buckling of X80 corroded pipelines subjected to bending moment load. Thin. Wall. Struct. 2021, 167, 108172. [Google Scholar] [CrossRef]
  15. Wu, X.; Shuai, J.; Xu, K.; Lv, Z.; Shan, K. Determination of local true stress-strain response of X80 and Q235 girth-welded joints based on digital image correlation and numerical simulation. Int. J. Pres. Ves. Pip. 2020, 188, 104232. [Google Scholar] [CrossRef]
  16. Ren, J.K.; Chen, Q.Y.; Chen, J.; Liu, Z.Y. Enhancing strength and cryogenic toughness of high manganese TWIP steel plate by double strengthened structure design. Mat. Sci. Eng. A. 2020, 786, 139397. [Google Scholar] [CrossRef]
  17. Yang, Y.H.; Shi, L.; Xu, Z.; Lu, H.S.; Chen, X.; Wang, X. Fracture toughness of the materials in welded joint of X80 pipeline steel. Eng. Fract. Mech. 2015, 148, 337–349. [Google Scholar] [CrossRef]
  18. Huda, N.; Gianetto, J.; Ding, Y.; Lazor, R.; Gerlich, A.P. Investigation of local tensile strength and ductility properties of an X100 submerged arc seam weld. J. Mat. Sci. Eng. A 2019, 768, 138475. [Google Scholar] [CrossRef]
  19. Wang, D.Q.; Zhu, M.L.; Xuan, F.Z. Correlation of local strain with microstructures around fusion zone of a Cr-Ni-Mo-V steel welded joint. Mater. Sci. Eng. A 2017, 685, 205–212. [Google Scholar] [CrossRef]
  20. Reu, P. All about speckles: Speckle Size Measurement. Exp. Technol. 2014, 38, 1–2. [Google Scholar] [CrossRef]
  21. Blaber, J.; Adair, B.; Antoniou, A. Ncorr: Open-Source 2D Digital Image Correlation Matlab Software. Exp Mech. 2015, 55, 1105–1122. [Google Scholar] [CrossRef]
  22. Tlilan, H.; Gharaibeh, M.; Mustafa, M.; Jawarneh, A. Effect of stress triaxiality on the strain concentration factor. IJSTE. 2020, 8, 4. [Google Scholar] [CrossRef]
  23. Khalaj, G.; Pouraliakbar, H.; Ra, K.; Khalaj, M. Modeling the correlation between heat treatment, chemical composition and bainite fraction of pipeline steels by means of artificial neural networks. Neural. Netw. World. 2013, 23, 351–367. [Google Scholar] [CrossRef] [Green Version]
  24. Zhao, L.Y.; Wang, Q.F.; Shi, G.H.; Yang, X.Y.; Qiao, M.L.; Wu, J.P.; Zhang, F.C. In-depth understanding of the relationship between dislocation substructure and tensile properties in a low-carbon microalloyed steel. Mat. Sci. Eng. A 2022, 854, 143681. [Google Scholar] [CrossRef]
  25. Granberg, F.; Terentyev, D.; Nordlund, K. Interaction of dislocations with carbides in BCC Fe studied by molecular dynamics. J Nucl. Mater. 2015, 66, 283–288. [Google Scholar] [CrossRef]
  26. Liu, X.L.; Xue, Q.Q.; Wang, W.; Zhou, L.L.; Wu, X.L. Back-stress-induced strengthening and strain hardening in dual-phase steel. Mat. 2019, 7, 100376. [Google Scholar] [CrossRef]
  27. Maurya, A.K.; Chhibber, R.; Pandey, C. Heat Input Effect on Dissimilar Super Duplex Stainless Steel (UNS S32750) and Nitronic Steel (N 50) Gas Tungsten Arc Weld: Mechanism, Microstructure, and Mechanical Properties. J. Materi. Eng. Perform. 2022; in press. [Google Scholar] [CrossRef]
Figure 1. (a) Groove shape; (b) finished weld plate.
Metals 13 00226 g001
Figure 2. (a) Sampling direction; (b) sample size; (c) zone and mark point locations; (d) DIC system schematic diagram.
Metals 13 00226 g002
Figure 3. In situ observation of tensile curve.
Metals 13 00226 g003
Figure 4. (a) Tensile curve of test specimen; (b) axial strain distribution diagram of specimen at ε M = 12.2%.
Metals 13 00226 g004
Figure 5. Strain distribution of L1–L3 at ε M = 3.4%, ε M = 7.5%, ε M = 12.2%.
Metals 13 00226 g005
Figure 6. Microstructure and deformation characteristics in different zones: (a) original state at point A; (b) original state at point B; (c) original state at point C; (d) original state at point D; (e) original state at point E; (f) after No.2 at point A; (g) after No.2 at point B; (h) after No.2 at point C; (i) after No.2 at point D; (j) after No.2 at point E.
Metals 13 00226 g006
Figure 7. Deformation characteristics of observation points with different thicknesses in the WM: (a) after first stretching at point F; (b) after first tension at point C; (c) after first tension at point G.
Metals 13 00226 g007
Figure 8. Fracture surfaces of different thicknesses in the WM: (a) Y = 4.3 mm; (b) Y = 2.5 mm; (c) Y = 0.7 mm.
Metals 13 00226 g008
Table 1. Welding specifications and constant parameters.
Welding SpecificationConstant Parameters
Root welding wireER70S-G
Root welding wire diameter1.2 mm
Filler and cover welding wire E81T1-Ni1
Filler and cover welding wire diameter1.2 mm
Root welding current, A380–430
Root welding voltage, V14–18
Filler and cover welding current, A160–240
Filler and cover welding voltage, V22–28
Shielding gas 15–25%CO2 +75–85% Ar
Table 2. Chemical composition of X80 base metal steel (wt%).
CSiMnSPN
0.0650.241.840.00280.0110.005
NiNbCrMoAlTi
0.380.0570.0050.340.0240.009
Table 3. KCR of marked points at different tensile stages.
KCRεM = 3.4%εM = 7.5%εM = 12.2%
KA1.001.001.00
KB3.002.071.94
KC2.472.696.27
KD1.701.581.42
KE0.810.180.60
KF2.832.997.13
KG2.002.354.76
Disclaimer/Publisher’s Note: The statements, opinions and data contained in all publications are solely those of the individual author(s) and contributor(s) and not of MDPI and/or the editor(s). MDPI and/or the editor(s) disclaim responsibility for any injury to people or property resulting from any ideas, methods, instructions or products referred to in the content.

