Article

Influence of the Cell Type on the Physical Processes of the Mechanical Recycling of Automotive Lithium-Ion Batteries

Institute of Mechanical Process Engineering and Mineral Processing, TU Bergakademie Freiberg, 09599 Freiberg, Germany
*
Author to whom correspondence should be addressed.
Metals 2023, 13(11), 1901; https://doi.org/10.3390/met13111901
Submission received: 26 October 2023 / Revised: 9 November 2023 / Accepted: 15 November 2023 / Published: 17 November 2023

Abstract

:
Lithium-Ion Battery (LIB) manufacturers produce different cell formats (prismatic, cylindrical, pouch, etc.) with different casing materials (steel or aluminium) and cell chemistries (e.g., NMC, NCA, LFP, etc.) for application in electric vehicles. By law, these cells have to be recycled after their lifetime. This study investigates the influence of different cell types on the outcome of a standardized mechanical recycling process consisting of crushing, sieving and air classification. The aim of the study is to find out whether different cell types can be processed together or whether the recovery and product quality can be improved by processing them separately. Pouch cells require low energy consumption for crushing compared to cylindrical and prismatic cells. Steel as a casing material increases the energy requirement during crushing compared to aluminium. The particle size distribution of several product fractions varies significantly between the different cell types. During air classification, the separator, anode, and cathode show a similar separation behaviour and can be processed with the same settings, whereas for the separation of the casing metals, different settling velocities need to be applied depending on the casing material.

Graphical Abstract

1. Introduction

To reduce the carbon emissions from the traffic sector there is a change from internal combustion engine vehicles (ICEV) to electric vehicles (EV). Therefore, the demand for Lithium-Ion Batteries (LIB) will grow. At the end of an EV’s lifetime, the LIB has to be recycled. The expected amount of used LIB in Europe will be between 150–300 kt in 2030 and between 600–2500 kt in 2040 [1]. These batteries need to be recycled according to the European Legislation. Currently, the European Union proposes recycling efficiencies of 95% for Co, Cu, and Ni and 80% for Li by 2031. For the total battery, 70% recycling efficiency needs to be achieved by 2030 [2].
A LIB cell consists of one or more electrode windings, the so-called jelly rolls, or an electrode stack, which are contained in a metal casing. An electrolyte fluid fills the empty space inside the cell and ensures ion transport. There are three types of casing formats available: prismatic or cylindric hard casings, and soft pouch casings. The soft pouch casing is made of aluminium and the hard casings are made of steel or aluminium [3].
The electrode winding or stack consists of an anode and a cathode separated by a polymer foil. This separator foil typically consists of polyethylene (PE), polypropylene (PP), or a triple layer of PP-PE-PP. Some manufacturers do apply an additional ceramic coating to the separator foil to improve cell safety [4,5]. Typical separator thickness ranges from 8–40 µm [4,6]. The anode consists of a Cu foil coated most commonly with graphite [7]. The coating is attached to the foil with either a combination of carboxymethyl cellulose (CMC) and styrene-butadiene-rubber (SBR) or with polyvinylidene fluoride (PVDF) [8]. The Cu foil thickness ranges between 5–20 µm, with the majority between 8–10 µm. The total anode thicknesses lie between 80–240 µm [6]. The cathode is made of an Al foil which is coated either with a lithium metal oxide, e.g., LiCoO2 (LCO), LixMnyOz (LMO), LiNixCoyAlzO2 (NCA), LiNixMnyCozO2 (NMC), or lithium metal phosphate, e.g., LiFePO4 (LFP) [9,10,11]. For the cathode, PVDF is predominantly used as a binder [8]. The Al foil typically has a thickness between 12–15 µm; the overall range is from 10 to 25 µm. The total cathode is between 72–240 µm thick [6].
The electrolyte consists of several solvents and a conductive salt. The solvents can be highly volatile like dimethyl carbonate (DMC), diethyl carbonate (DEC), and ethyl methyl carbonate (EMC), or low volatile like ethylene carbonate (EC) and propylene carbonate (PC). A conductive salt, usually lithium hexafluorophosphate (LiPF6), is applied [12,13].
The aim of the mechanical recycling process is to liberate the different components from each other and concentrate them into different product fractions. The first step, therefore, is the shredding and the comminution, respectively [14,15]. For safe crushing, only discharged cells are fed to the shredder. Discharging is most commonly carried out with an ohmic resistor or with a brine solution [16,17]. After crushing and a subsequent drying stage to evaporate the contained solvents [18], a fine fraction is separated by sieving [14]. The fine fraction is then further treated by floatation to recover the graphite [19,20] and by hydro- or pyrometallurgical processes to recover the contained metals [21,22,23,24]. The coarse fraction is further treated by air classification to create three product fractions. A light fraction contains the separator and other plastic foils, a heavy fraction enriches the thicker casing metals, and an intermediate fraction contains the electrode foils [25].
Very few studies have investigated and compared several cell types. Most studies focus on one cell type and then vary the process parameters to see their effects. Wuschke [14] investigated the specific mechanical stress energy of the pre-crushing, i.e., shredding without reaching a final state of liberation, of prismatic cells with aluminium or steel casing. The two cell types with steel casing had a higher energy consumption (around 2.5–3.8 kWh/t) compared to the four types with aluminium casing (around 0.6–1.7 kWh/t). Lyon et al. [26] investigated the specific mechanical stress energy of a combination of rotor shears and a granulator applied to eight cells with different casing formats. The pouch cell had the lowest energy consumption (around 3 kWh/t) followed by the prismatic cells (around 4.9–5.5 kWh/t), and the cylindrical cells (around 4.1–7.8 kWh/t). The same trend could be observed by Pinegar and Smith [27], who compared cell packs from consumer LIB with prismatic cells to packs with pouch cells (9.37 kWh/t to 4.78 kWh/t).

2. Material and Methods

The data behind the figures and additional data can be found in the supplementary information [28].

2.1. Material

Ten different cell types were investigated in this study, of which three had a cylindrical format (C1–C3), six a prismatic format (P1–P6), and one was a pouch cell (Po). Three cell types had a steel casing (C1, C2, and P4), and the others had an aluminium casing. With LCO (C1, Po), LMO-NMC mixture (P4, P5), NCA (C2), NMC (P1, P2, P3, P6), and LFP (C3), the most common cathode coatings were covered. The number of cells per experiment was adjusted so that at least 400 g were processed in each experiment. An overview of the investigated cell types, their basic data, and the number of cells per experiment can be found in Table 1. Three-dimensional images of the cells can be found in the supplementary information [28].

2.2. Methods: Cell Characterisation

To characterise the different cell types, the cells were cut open and disassembled into their different components (anode, cathode, separator foil, casing metals, and casing plastics). After disassembly, the components were dried for one week at room temperature in a fume hood, and the weight loss was defined as the content of highly volatile components. The low-volatile components were not taken into consideration as those cannot be evaporated without changing the composition and the material properties of the cells due to the high temperatures required (e.g., boiling point EC 247–249 °C and 242 °C for PC [12]).

2.3. Methods Processing and Evaluation

The different cells were processed according to the first part of the process scheme that was developed by the TU Bergakademie Freiberg [14]. The process steps can be seen in Figure 1. The cells were first overdischarged with a positive thermal coefficient resistance to a State of Charge (SoC) below 0% to ensure that no short circuits would cause a thermal runaway during crushing. The Po and P4 cells already had a voltage of 0.0 V upon delivery and did not need to be discharged.
Depending on the cell size, the cells were crushed in 1–3 steps. For all cells, the last shredding step applied a fast-rotating, single-shaft rotary shear (Universal Granulator UG300, Andritz MeWa GmbH; Gechingen, Germany) with a discharge grid of 20 mm. The large prismatic cells (P4–P6) had to be pre-crushed with a self-built slow-rotating twin-shaft rotary ripper and a self-built slow-rotating twin-shaft rotary shear (TU Bergakademie Freiberg; Freiberg, Germany [14,29]) to be able to be fed to the granulator. The medium-sized prismatic cells (P2, P3) only needed pre-crushing with the slow-rotating rotary shear.
After crushing the material was dried for 14 days at room temperature in a fume hood to evaporate the highly volatile components. The longer drying time compared to the disassembled cells was chosen to allow complete drying of the larger bulk of the bigger cells. The dry material was then sieved with an EML 450 sieve machine (Haver & Boecker OHG; Oelde, Germany) to create a particle size distribution (PSD) and to separate the black mass at 1 mm. The material > 1 mm was merged again, and a settling velocity distribution analysis was recorded using a self-built zig-zag air classifier with 9 stages at a 120° angle (ZZS, TU Bergakademie Freiberg; Freiberg, Germany [14]) with 13 different air speeds from 2.0–17.7 m/s.
Manual sorting was applied to analyse the composition of the settling velocity fractions. The individual particles were separated with tweezers into the material fractions. The “anode” fraction contains the copper foil, which is still partially coated, as well as other copper particles from other parts of the cell as it was difficult after crushing to identify, unmistakenly, the origin of all the Cu particles. Especially for the nail safety device, a stronger Cu foil with a 0.1 mm thickness for P5 and P6 was impossible to separate from the anode current collector foil pieces. The “cathode” fraction contains the aluminum foil which is also partially coated. As it is optically not possible to separate the metals from the casing into different metal fractions, they are all combined into one “metals casing” fraction. The plastic fraction contains the strong plastic particles from the casing as well as all further plastic foils apart from the separator foil, e.g., the foil around the windings. Materials that did not become separated from each other or become joined together during crushing and can therefore not be allocated to one material fraction are collected in the fraction “compounds”.
For every cell type, three experiments were conducted; the values are therefore the average of the three individual experiments. The error bars in the figures state the minimum and maximum values. The only exception is the P6 cell type; here, the PSD after crushing is the average of 21 experiments and the settling velocity and composition analysis of 11 experiments, since a larger data set was available from another study.

2.4. Calculations

The mass distribution (wi) of the components within the different cell types and the products (separator, electrode, and casing) was calculated with Equation (1) by dividing the mass of the individual components (mComponent) by the total mass of the cell or product (mTotal).
w i = m C o m p o n e n t m T o t a l
The foil thickness (dFoil) of the current collector foils was determined by cutting out pieces of uncoated foil with a defined area (AFoil). The pieces were weighed and dFoil was calculated with Equation (2) by dividing the mass (mFoil) by AFoil and the density (ρAl, ρCu) of Al (2.71 g/cm3) or Cu (8.95 g/cm3).
d f o i l = m F o i l A F o i l · ρ A l , C u
Equation (3) was used to calculate the component recovery (Rc) into the different products (separator, electrodes, and casing). For the calculation, the mass of the component in the product (mi,Product) was divided by the mass of the component in the air classifier feed (mi,Feed ZZS).
R c = m i , P r o d u c t m i , F e e d   Z Z S
The cumulative component recovery (Rc,cum) at different settling velocities was calculated by Equation (4). The cumulative sum of the masses of the individual component in the light fraction of the different settling velocities (Σmi,SV) was divided by the mass of the component in the air classifier feed (mi,Feed ZZS).
R c , c u m = S V = 0 n m i , S V m i , F e e d   Z Z S
The mass recovery (Rm) was calculated with Equation (5) by dividing the mass of the individual products (mProduct) by the initial sample mass (mSample).
R m = m P r o d u c t m S a m p l e

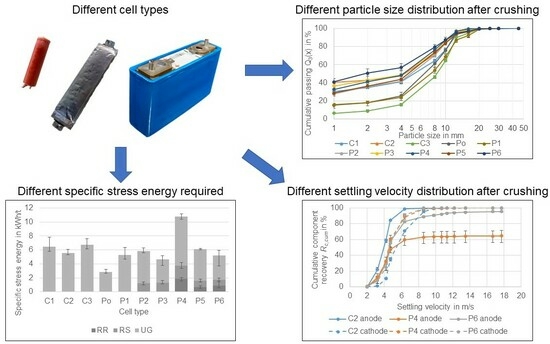
3. Results and Discussion

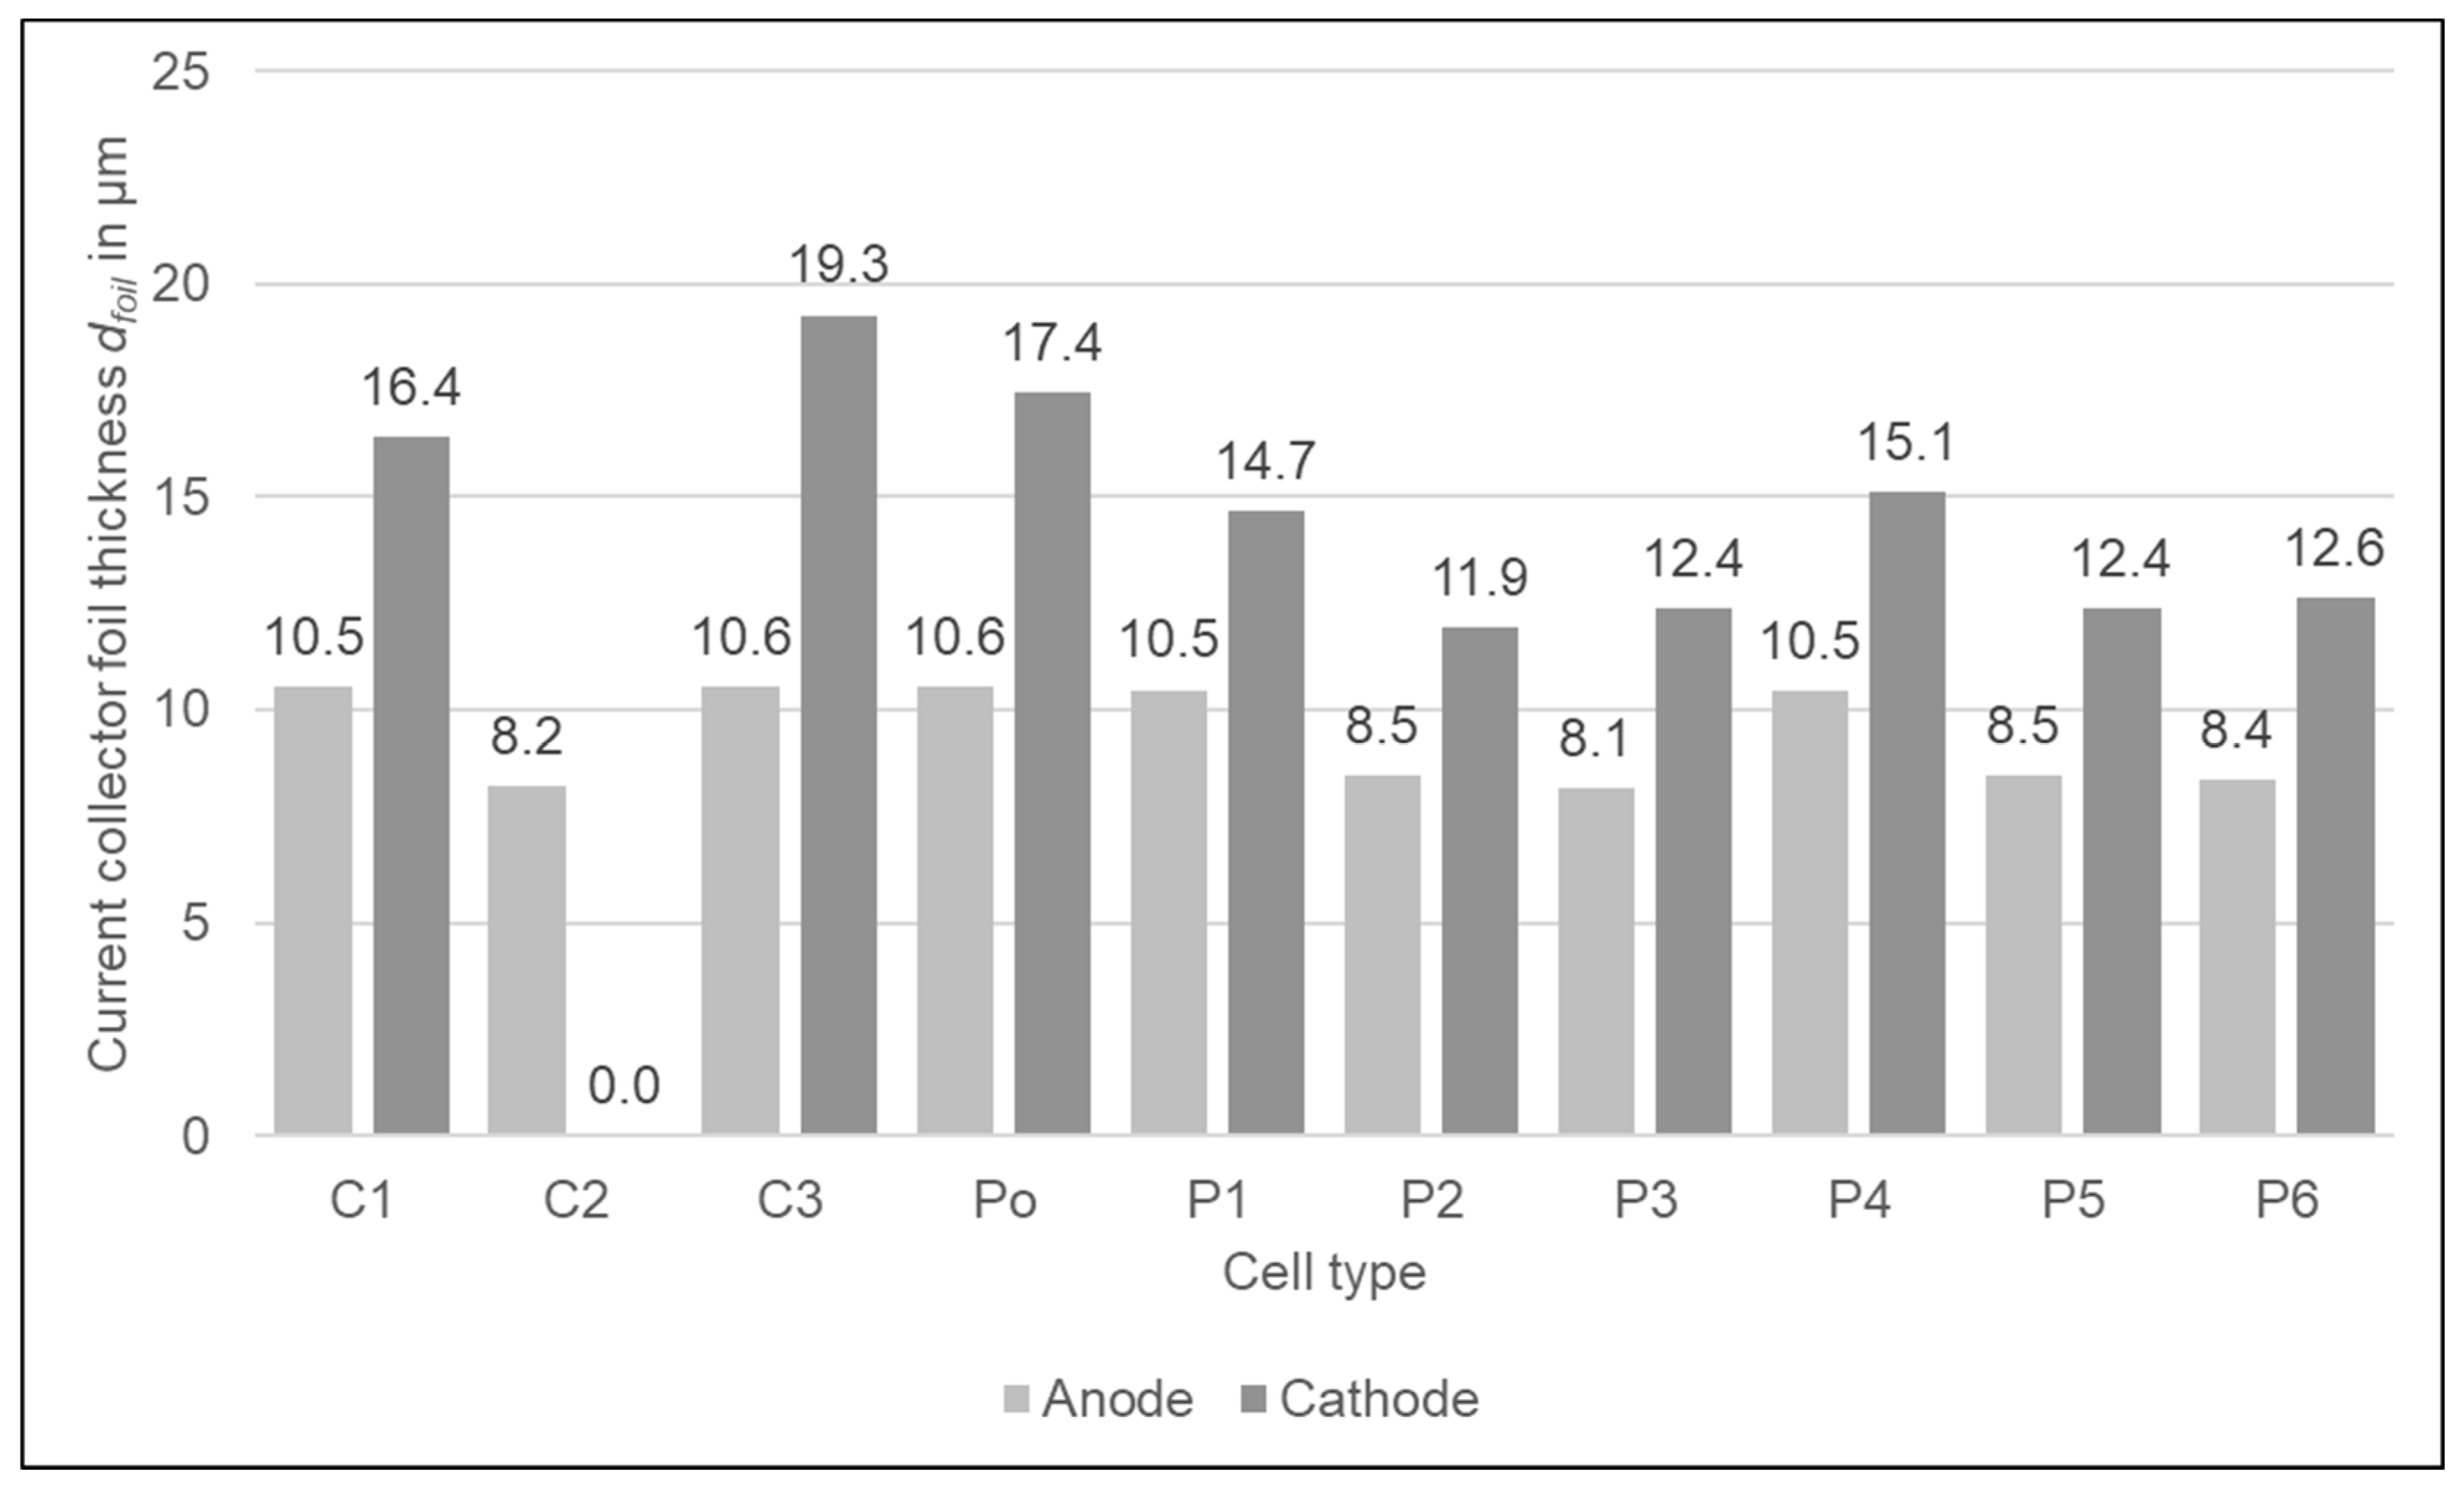
3.1. Cell Characterisation

The composition of the different cell types based on the analysis of the cut-open cells can be seen in Figure 2. It was not possible to determine the composition of all cells. For C1, the coatings of both electrodes were partially falling off or firmly attaching to the separator so that the individual weights of the anode, cathode, and separator could not be determined. Therefore, for C1 only the share of the complete jelly roll is stated. For the other cell types, only the coating of the anode was partially falling off so that the free coating could be clearly assigned to the anode. The reason for the behaviour of C1 could be either the ageing of the cell or a cell failure, as these cells originate from faulty battery modules. It is also possible that it was caused by overdischarge as described by Kaas et al. [30] because the cells already had an SoC below 0% when they were delivered. Photos of the disassembled C1 cell can be found in the supplementary information [28].
The content of volatile components that evaporate at room temperature amounts for most of the cells to around 9–10%; only P1 with 14.7% has a slightly higher value. The share of the casing metals of the Po cell is 2.7% the lowest of all cell types as it is only manufactured of the soft aluminium foil composite. The cell with the highest casing metal share of 26.4% is the P4 cell due to its steel casing. Despite the fact that the C3 has an aluminium casing, its casing metal share is 18.7% similar to that of the C2 cell (18.3%) with steel casing. The reason for that is thick aluminium and some larger alloy pieces at the top and bottom of the cell, as well as a stronger shell with 0.6 mm compared to 0.4 mm for C2. The C1 cell has a little aluminium tube in the middle of the jelly roll.
The share of the separator varies between 2.0% (C2) and 7.1% (P1). The amounts of other plastics than the separator foil vary between the different cells. Some cells only have some thin plastic pieces at the top and bottom of the cell (C1, C2) and thin foil pieces at the contacts of the electrode windings (C1, C2, C3, Po). Other cells have their windings wrapped in a thin plastic foil (C3, P1–P3, P5, P6), thick plastic pieces at the outer cell contacts (P1–P6), and retainers to keep the windings in position (P5, P6). C3 has a plastic tube in the centre of the jelly roll. The cells P1 and P4 are wrapped in plastic, whereas the cells P3, P5 and P6 have a glued plastic cover. Therefore, the plastic content ranges from 0.2% (Po) to 3.1% (P1).
The share of electrodes ranges from 21.2% (P4) to 38.3% (Po) for the anode and 26.2 (P1) to 44.0% (Po) for the cathode. The Po cell has the highest share of electrodes due to the low share of casing. For the other cell types, there is no relation between electrode share and cell format or the casing material. The P4, with the steel casing, has a 56.8% share at the lower end of the range, but so is the P1 with the aluminium casing (54%). The cylindrical cell C2 has a 70.2% electrode share at the top end of the range of all cells whereas the C3 has an average share of 62.8%. The lower the electrode share and especially the share of the cathode, as its coating contains the metals with the highest value [21], the less profit can be gained by recycling.
The foil thicknesses of the current collector foils can be found in Figure 3. For the anode current collector foils, the thickness is quite similar. C2 and P2–P6 are around 8–8.5 µm, and C3, Po, and P1 are around 10.5 µm thick which are the typical anode foil thicknesses as described by Link et al. [6]. The variation of the cathode foil thicknesses is higher. Some cell types have foil thicknesses around 12–12.5 µm (P2, P3, P5, P6) and some around 15 µm (P1, P4) which is the average of the foils available on the market. The C1 (16.4 µm), Po (17.4 µm), and the C3 type (19.3 µm) have foil thicknesses at the upper end of the market range [6]. The thickness of the C2 cell could not be determined as it could not be decoated and there is no larger partition of blank foil inside the cell.
Overall, there is already a large variation in the cell composition which is expected to have an impact on the recycling process. The higher the content of valuable components such as cathode, anode, and casing metals, the more profitable recycling will be. The more complex the composition of the cell, for example, additional components such as a nail safety device or pieces of thick plastic, the more challenging the recycling will be and the lower the product quality can be expected.

3.2. Specific Stress Energy

Due to the soft aluminium casing, the specific stress-energy needed to crush down the cells to below 20 mm is the lowest for the Po cell (2.8 kWh/t). In contrast, the highest energy is needed for the P4 cell with steel casing (10.7 kWh/t). The other prismatic cells have a similar energy requirement between 4.7–6.1 kWh/t. The three cylindrical cell types also have a similar energy consumption which is on average a bit higher than the prismatic cells with aluminium casing. Despite its aluminium casing, the C3 requires the highest specific stress-energy of cylindrical cells. One reason is the strong metal pieces at the top and bottom of the cell; the other reason is the electrode foil thickness because the C3 cell type has the thickest anode and cathode current collector foil in comparison with the other cell types. Also, the electrodes are wrapped around the plastic tube which may also influence the energy consumption. C1 and C2 with steel casing have a lower stress energy requirement than the prismatic cell with steel casing (P4) due to the lower casing thickness. C1 and C2 have a steel thickness of 0.4 mm and the thickness of P4 is twice as high at 0.8 mm. The required specific stress-energy for all cell types is shown in Figure 4, which also shows the share of the pre-crushing steps in the rotary ripper (RR) and the rotary shear (RS) that are included in the specific stress energies given.
The granulator is not a good choice to crush pouch cells alone. The gap between the crushing tools is too large and the thin foils become dragged through without much comminution. For the other cell types, the casing metal takes part in the comminution as well and cuts through the foils. After the experiment, there was still a lot of material between the rotor and the discharge grid. If pouch cells should be processed separately from other cells, a crusher with cutting stress should be applied. Further research is needed to determine whether the different crushing stresses improve comminution and how this affects the recycling process.

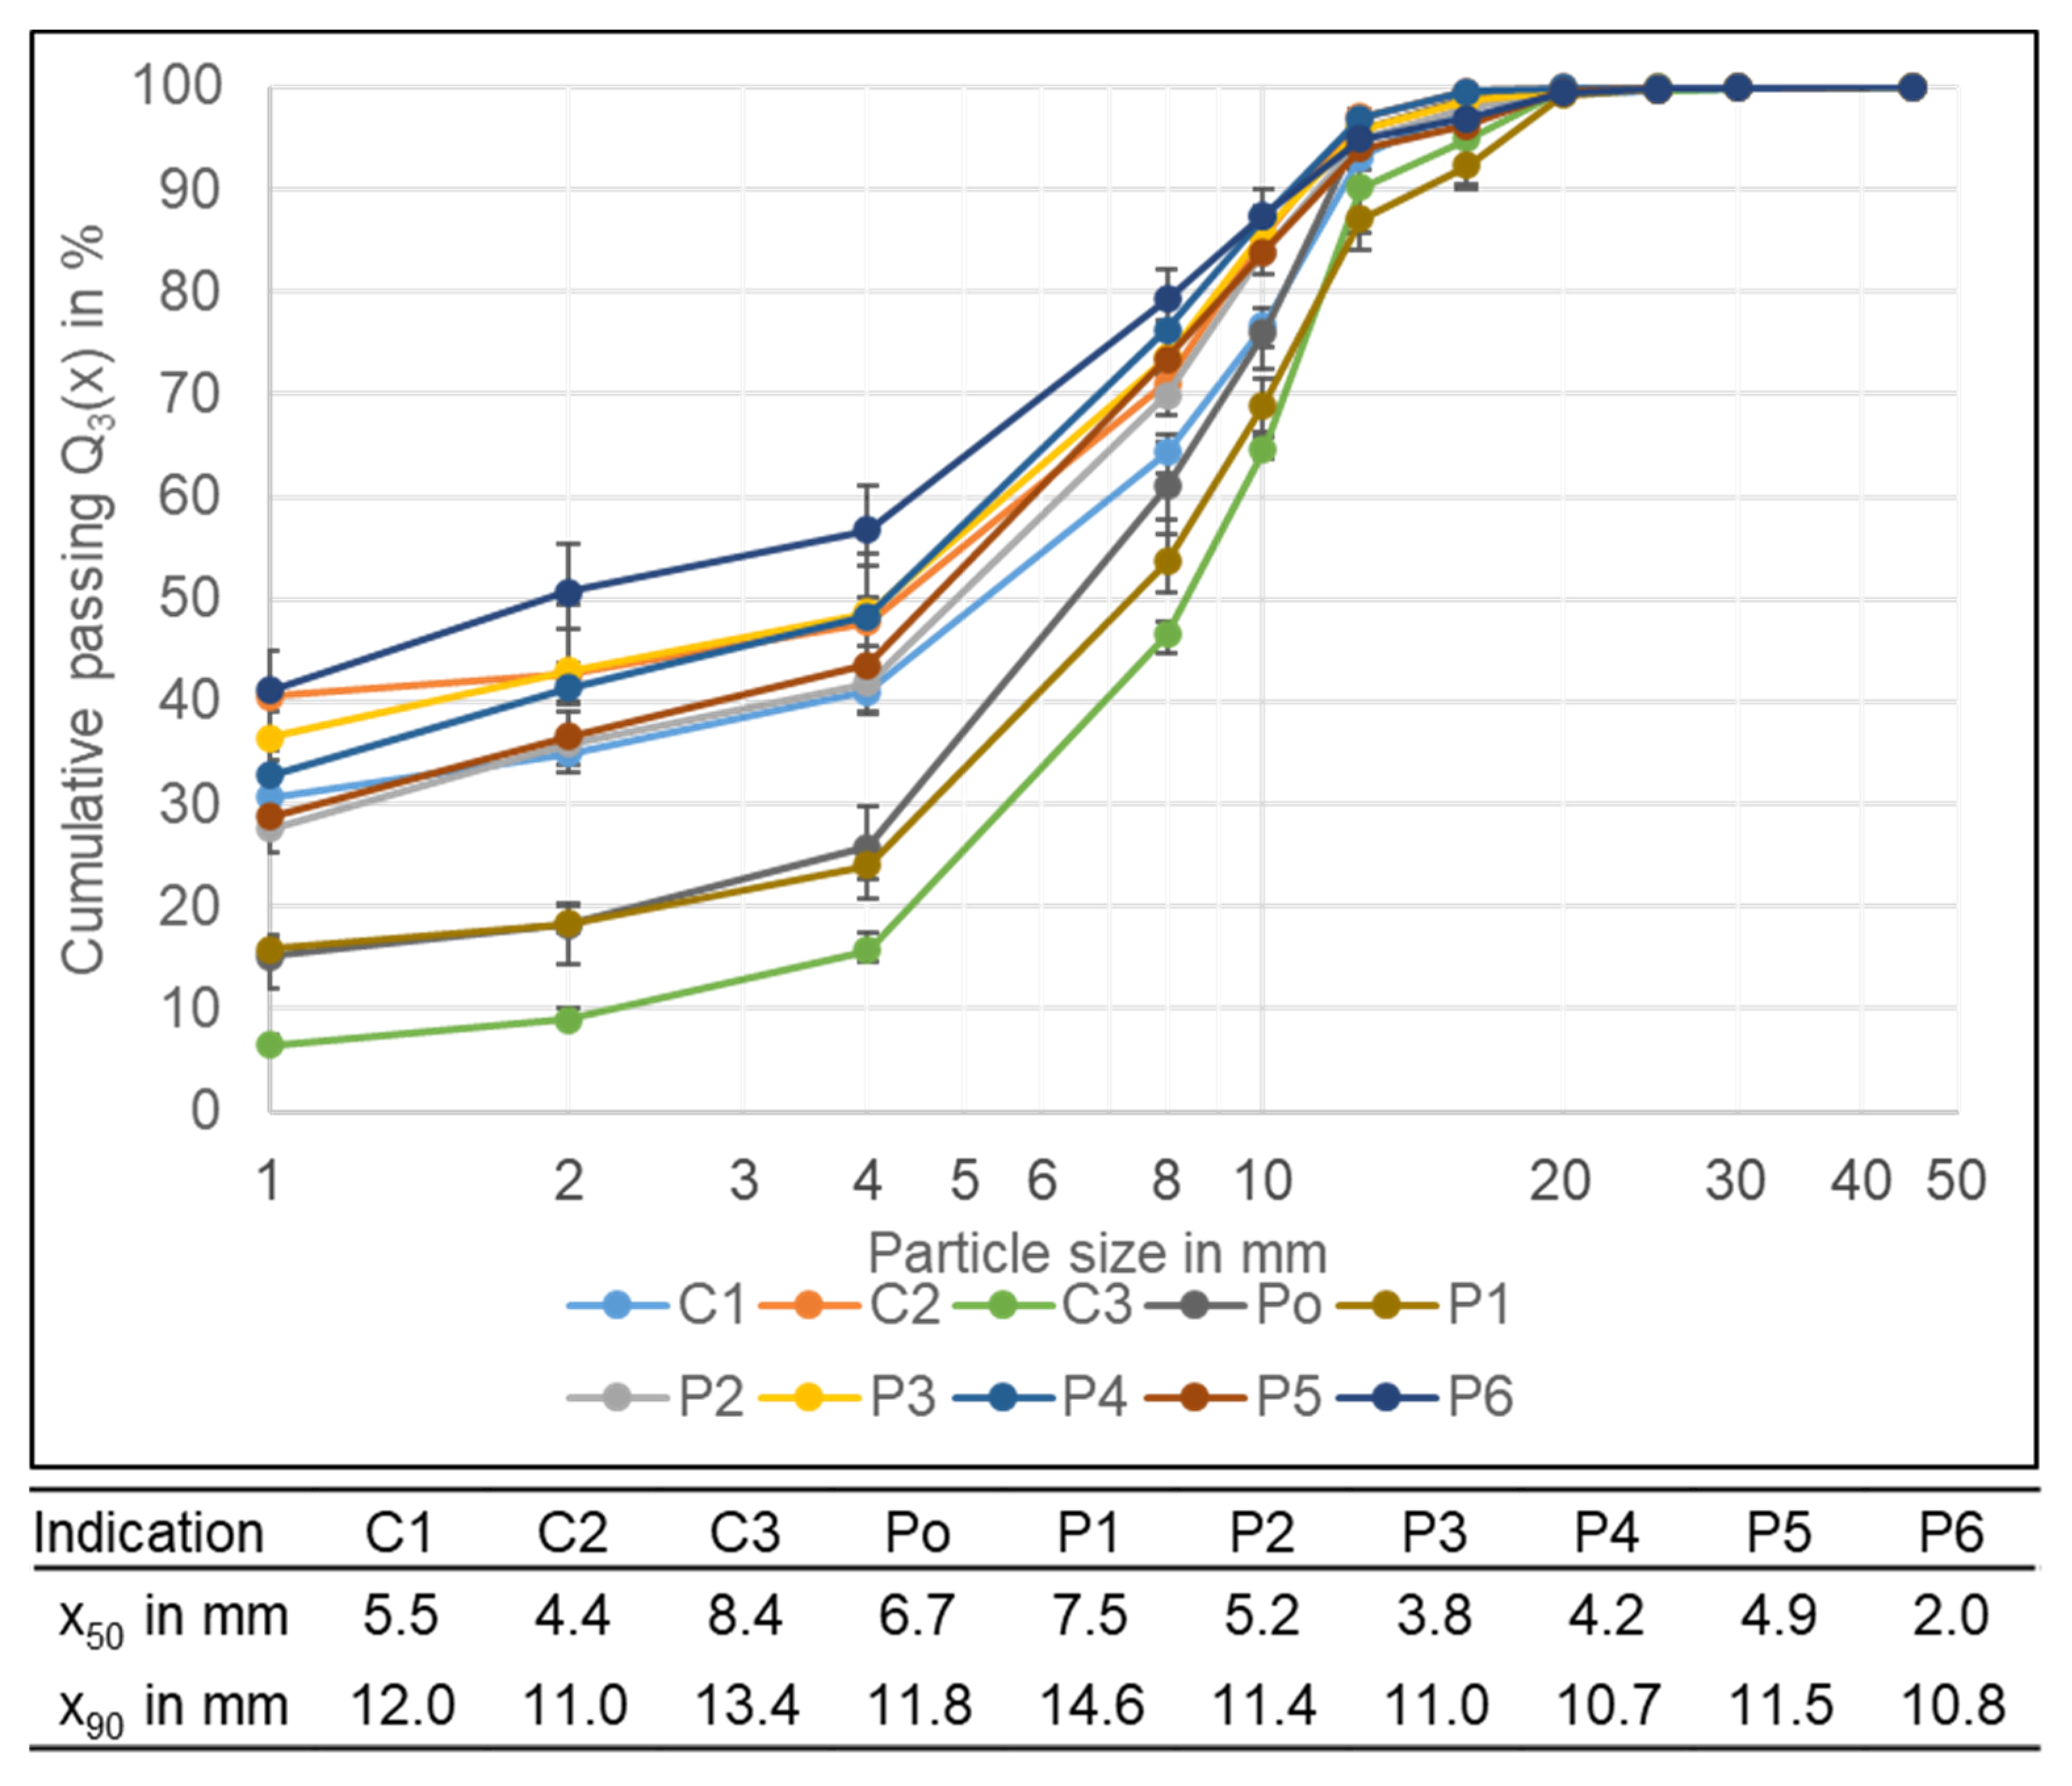
3.3. Particle Size Distribution of the Crushing Product after Drying

There is a big variation in the particle size distribution of the crushing products after drying. The coarsest PSD with a x50 of 8.4 mm has the C3 cell with LFP cathode chemistry. The reasons are probably the thicker electrode foils which do not become comminuted into small fractions. Another reason is the poor decoating of the electrode foils leading to a low share of material < 1 mm (6.5%). The Po and the P1 cell also have a high x50 value with 6.7 and 7.5 mm. For the Po, one reason is the missing strong casing particles which for the other cells play a role in comminution as well because the strong casing particles cut through the electrodes and the separator foil, creating smaller particle sizes. Also, the Po has a different anode binder. The binder was not water-soluble like the anode binders of the other cell types indicating, that PVDF was used instead of CMC and SBR. The different binder causes a poorer decoating and therefore a smaller share of < 1 mm (15.2%). The P1 also has a 15.8% low share of fines, the reason for that is unknown. For the other cell types, the x50 lies between 3.8–5.5 mm, and only the P6 is sticking out with a x50 of 2 mm. The share of particles < 1 mm varies between 27.6 and 41.1%. The lower the share of fines and the lower the decoating efficiency, the lower the expected recovery of the valuable cathode coating metals. The exact decoating efficiency and the recovery of Co, Li, and Ni should be further investigated in future research.
A difference between the cells with steel casing and those with aluminium casing is not visible. The same applies to the two hard casing formats. Figure 5 shows the PSD for the different cell types as well as the characteristic values x90 and x50. The corresponding density distributions can be found in the supplementary information [28]. The distributions are all bimodal, with the main mode at 0.5 mm and the second mode around 6–11 mm, except for the C3 cell, which has the main mode at 11 mm due to the low amount of fines created. The first mode belongs to the smallest size class and is caused by the liberated coating; the second is probably caused by the comminuted electrode foils. In general, it could be observed that the coarse particles had a flat shape due to their origin from either foils, e.g., electrode or separator foil, or the flat casing.

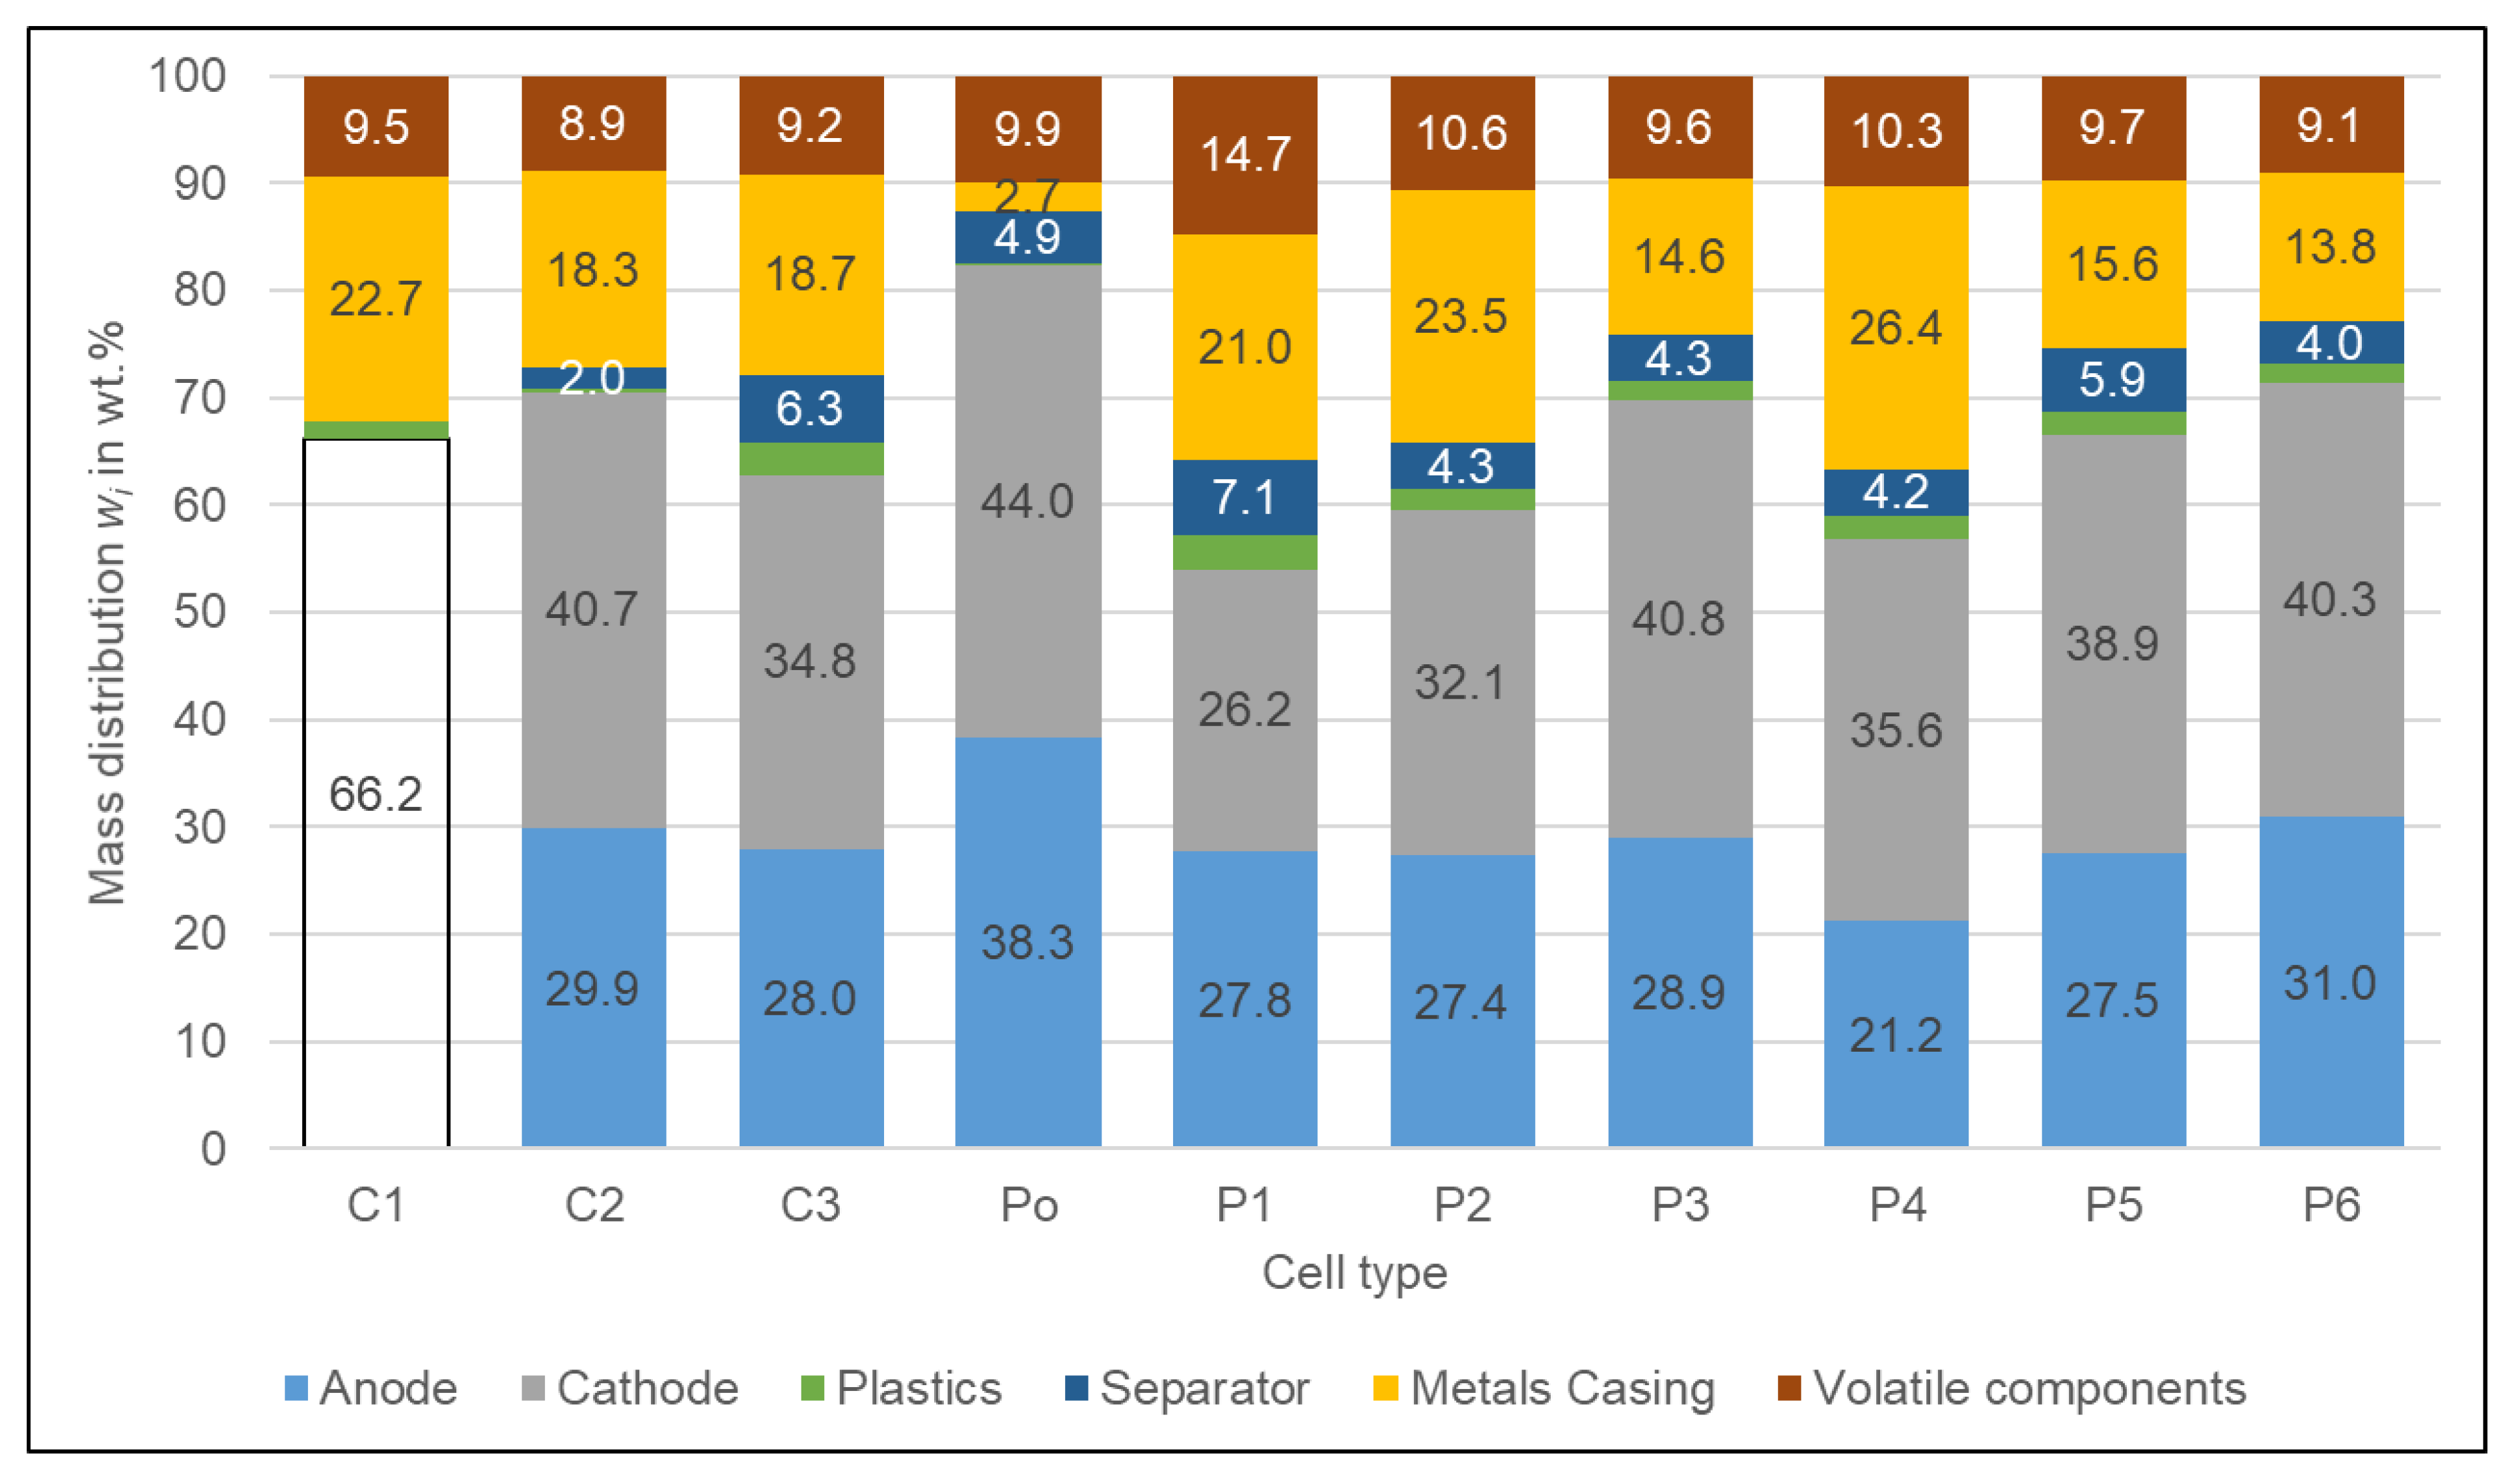
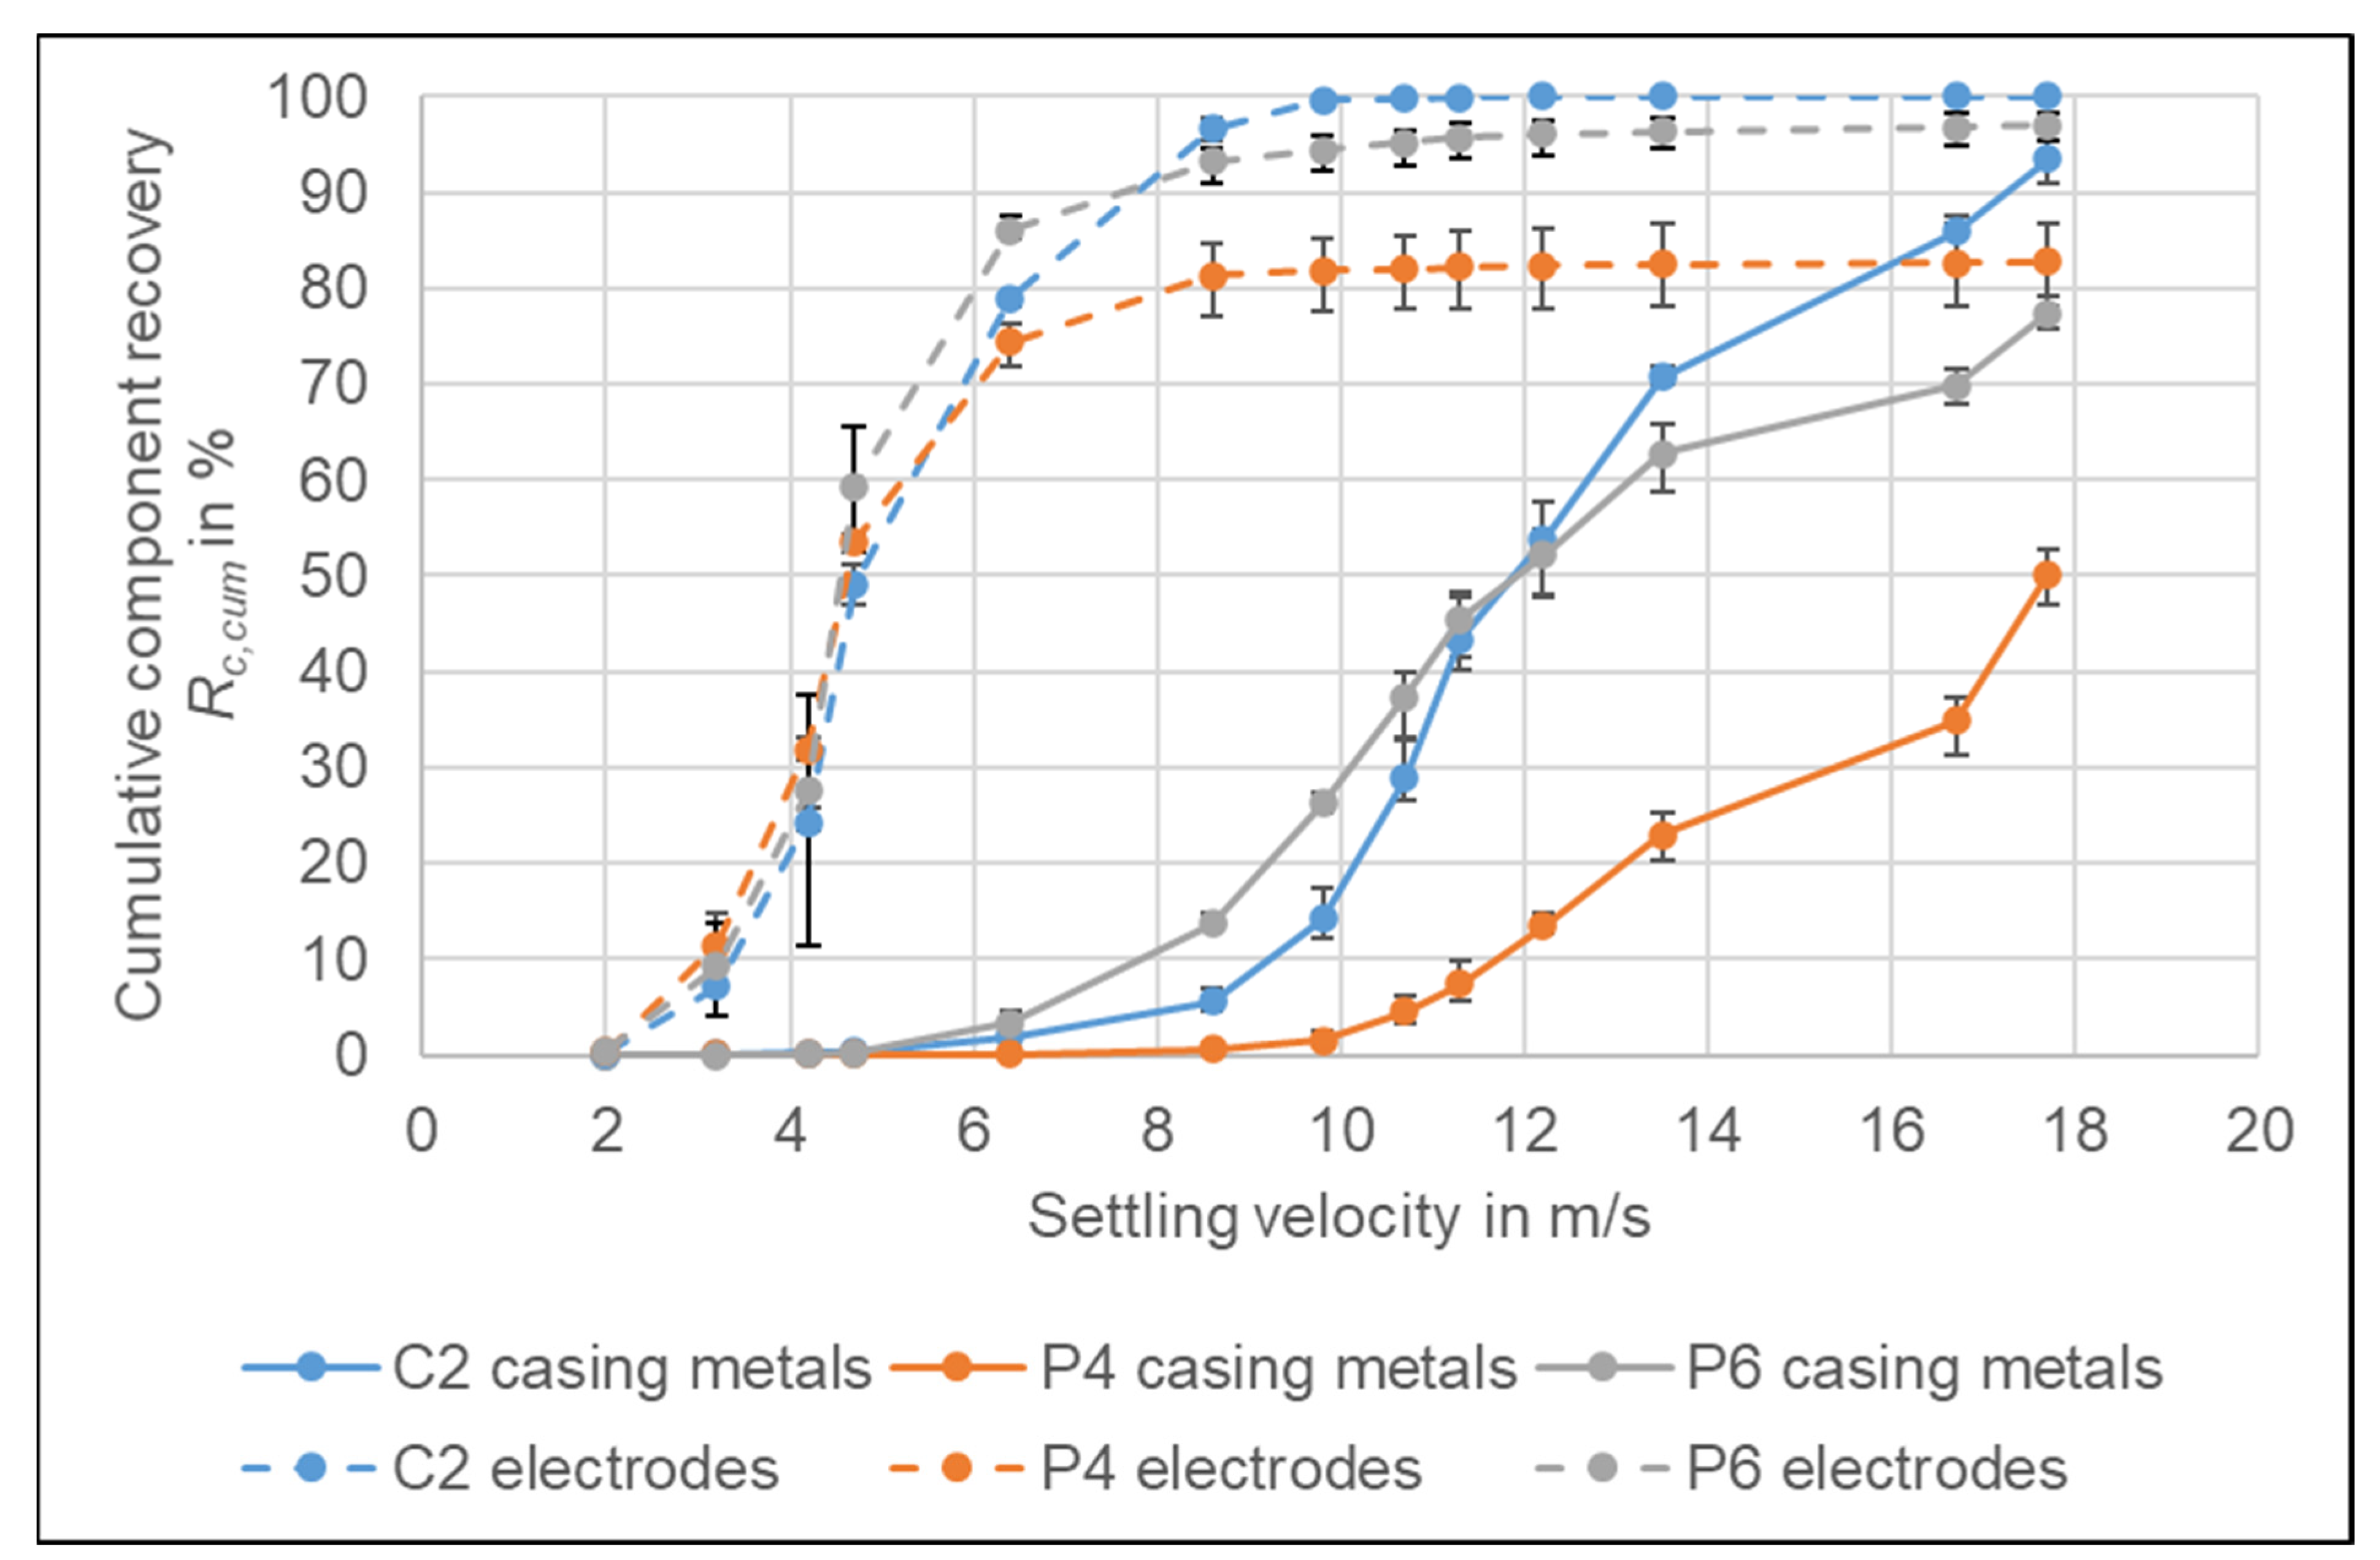
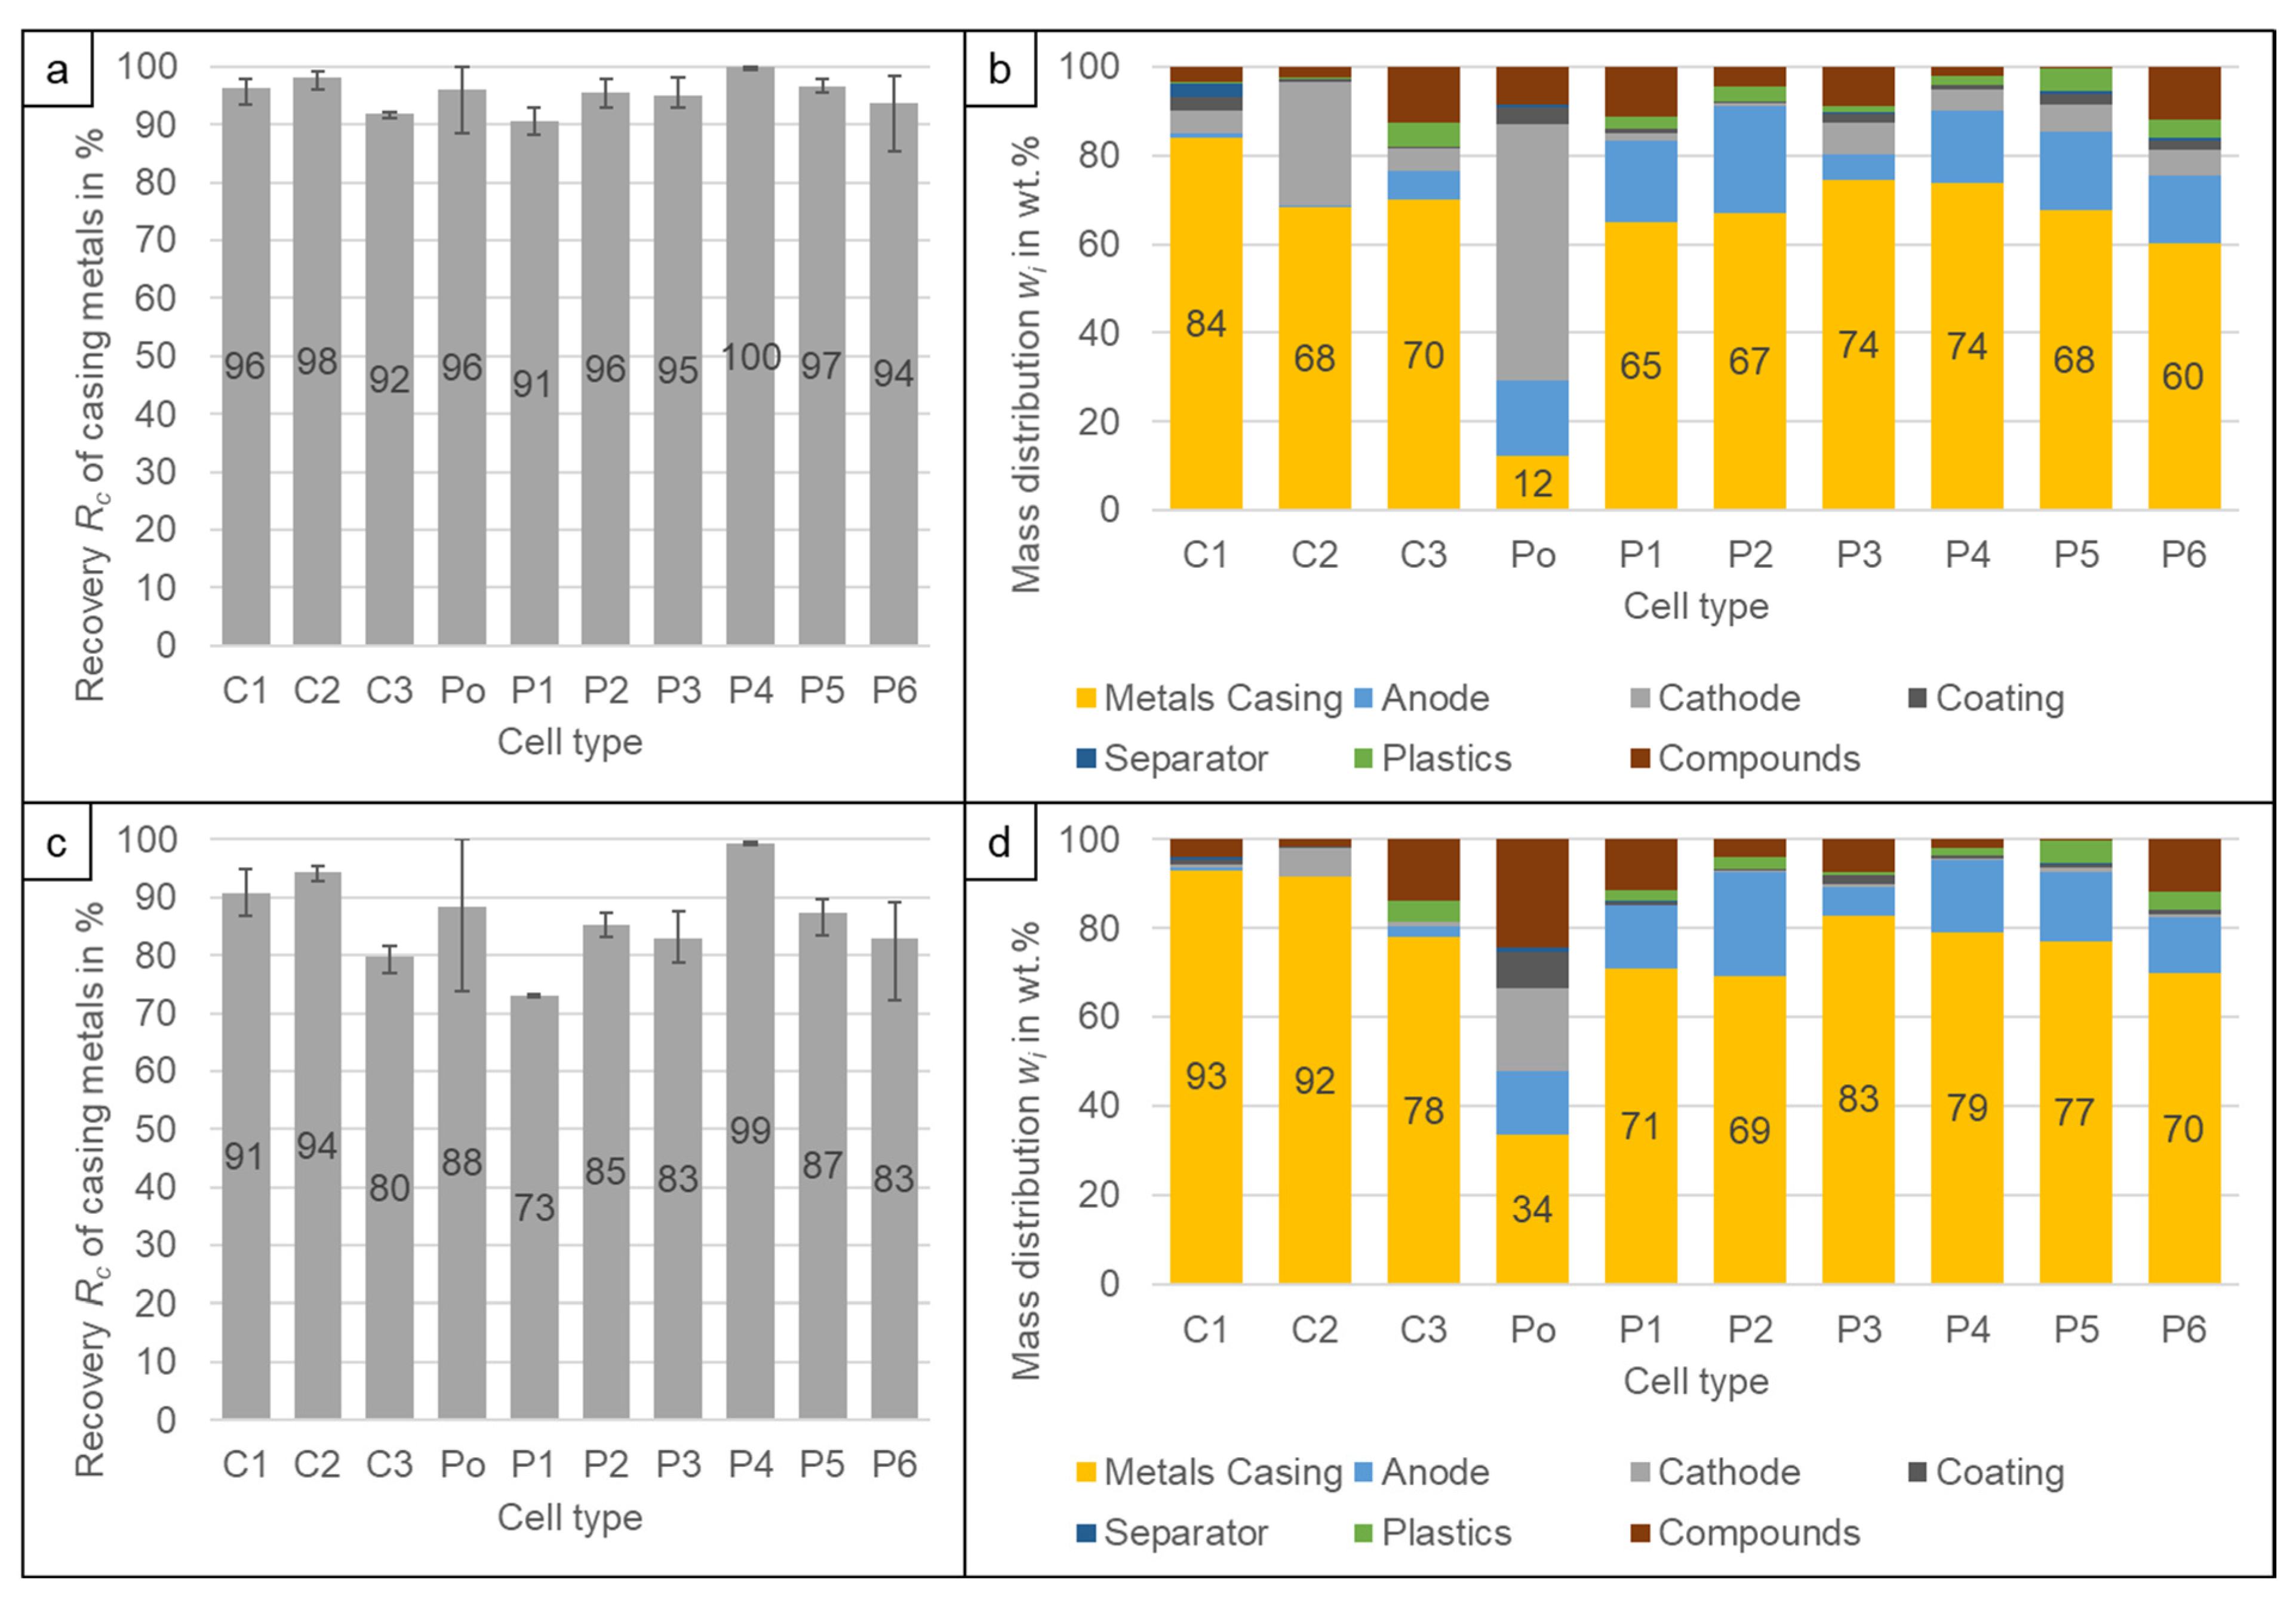
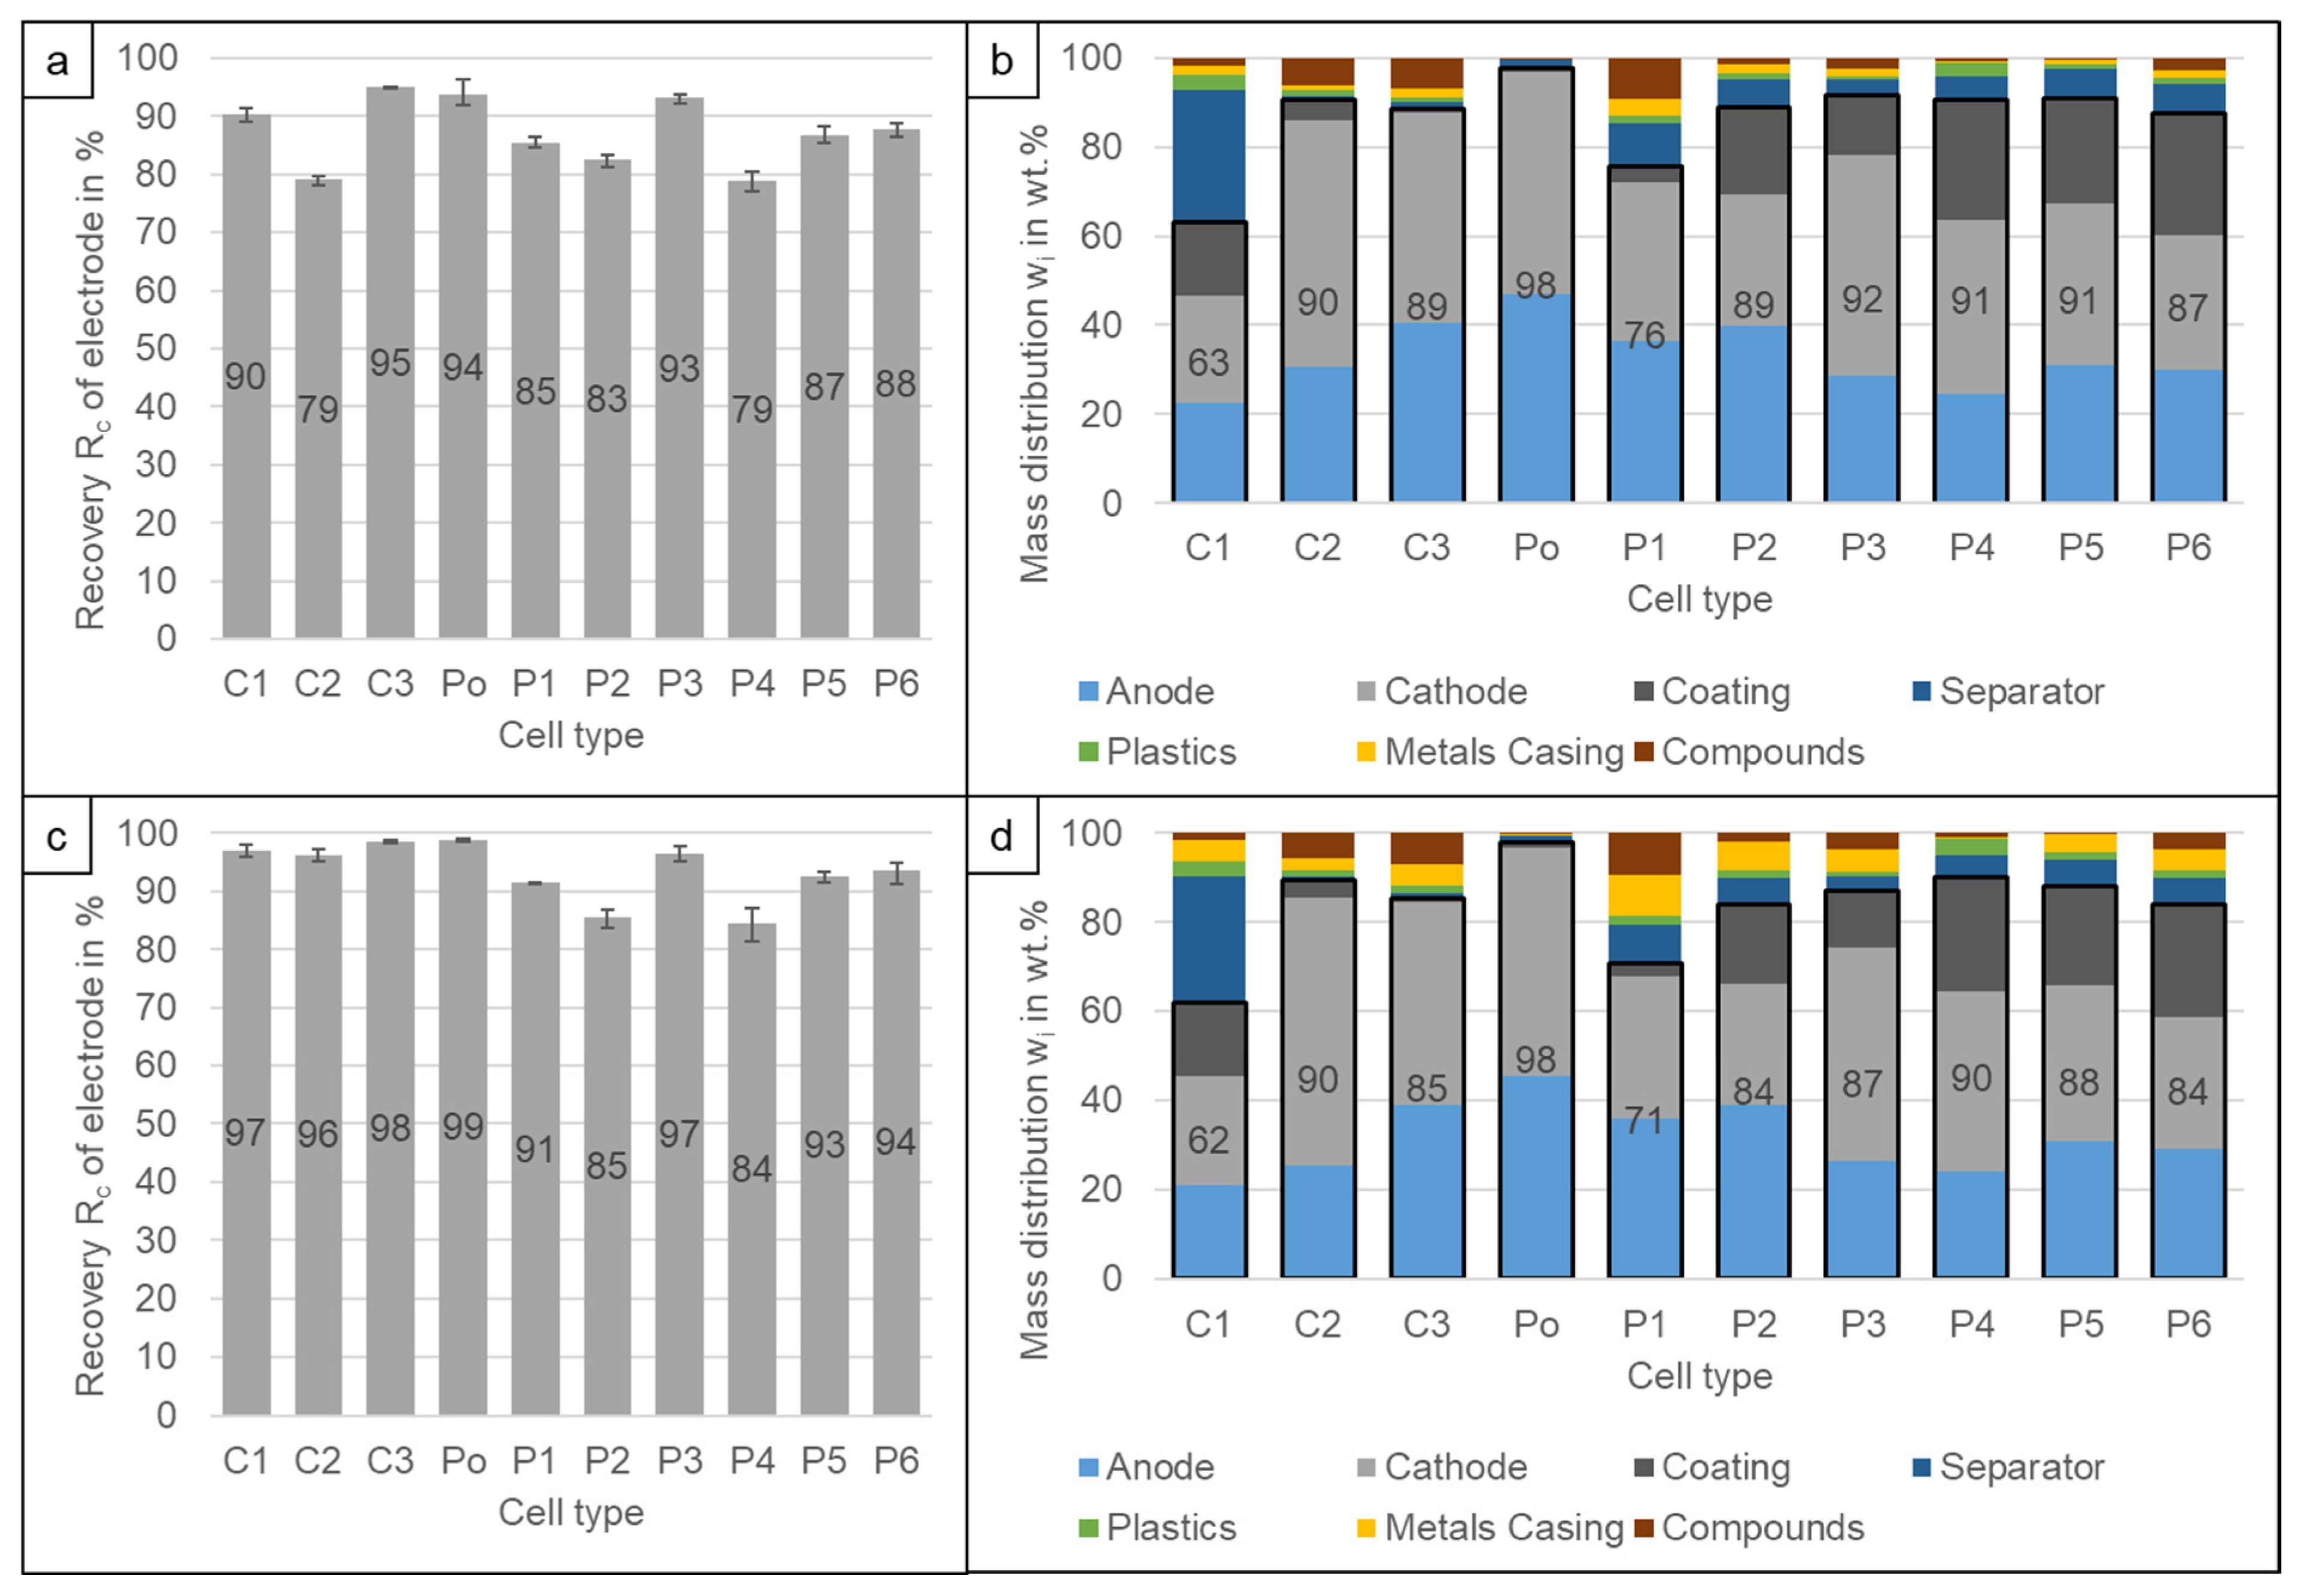
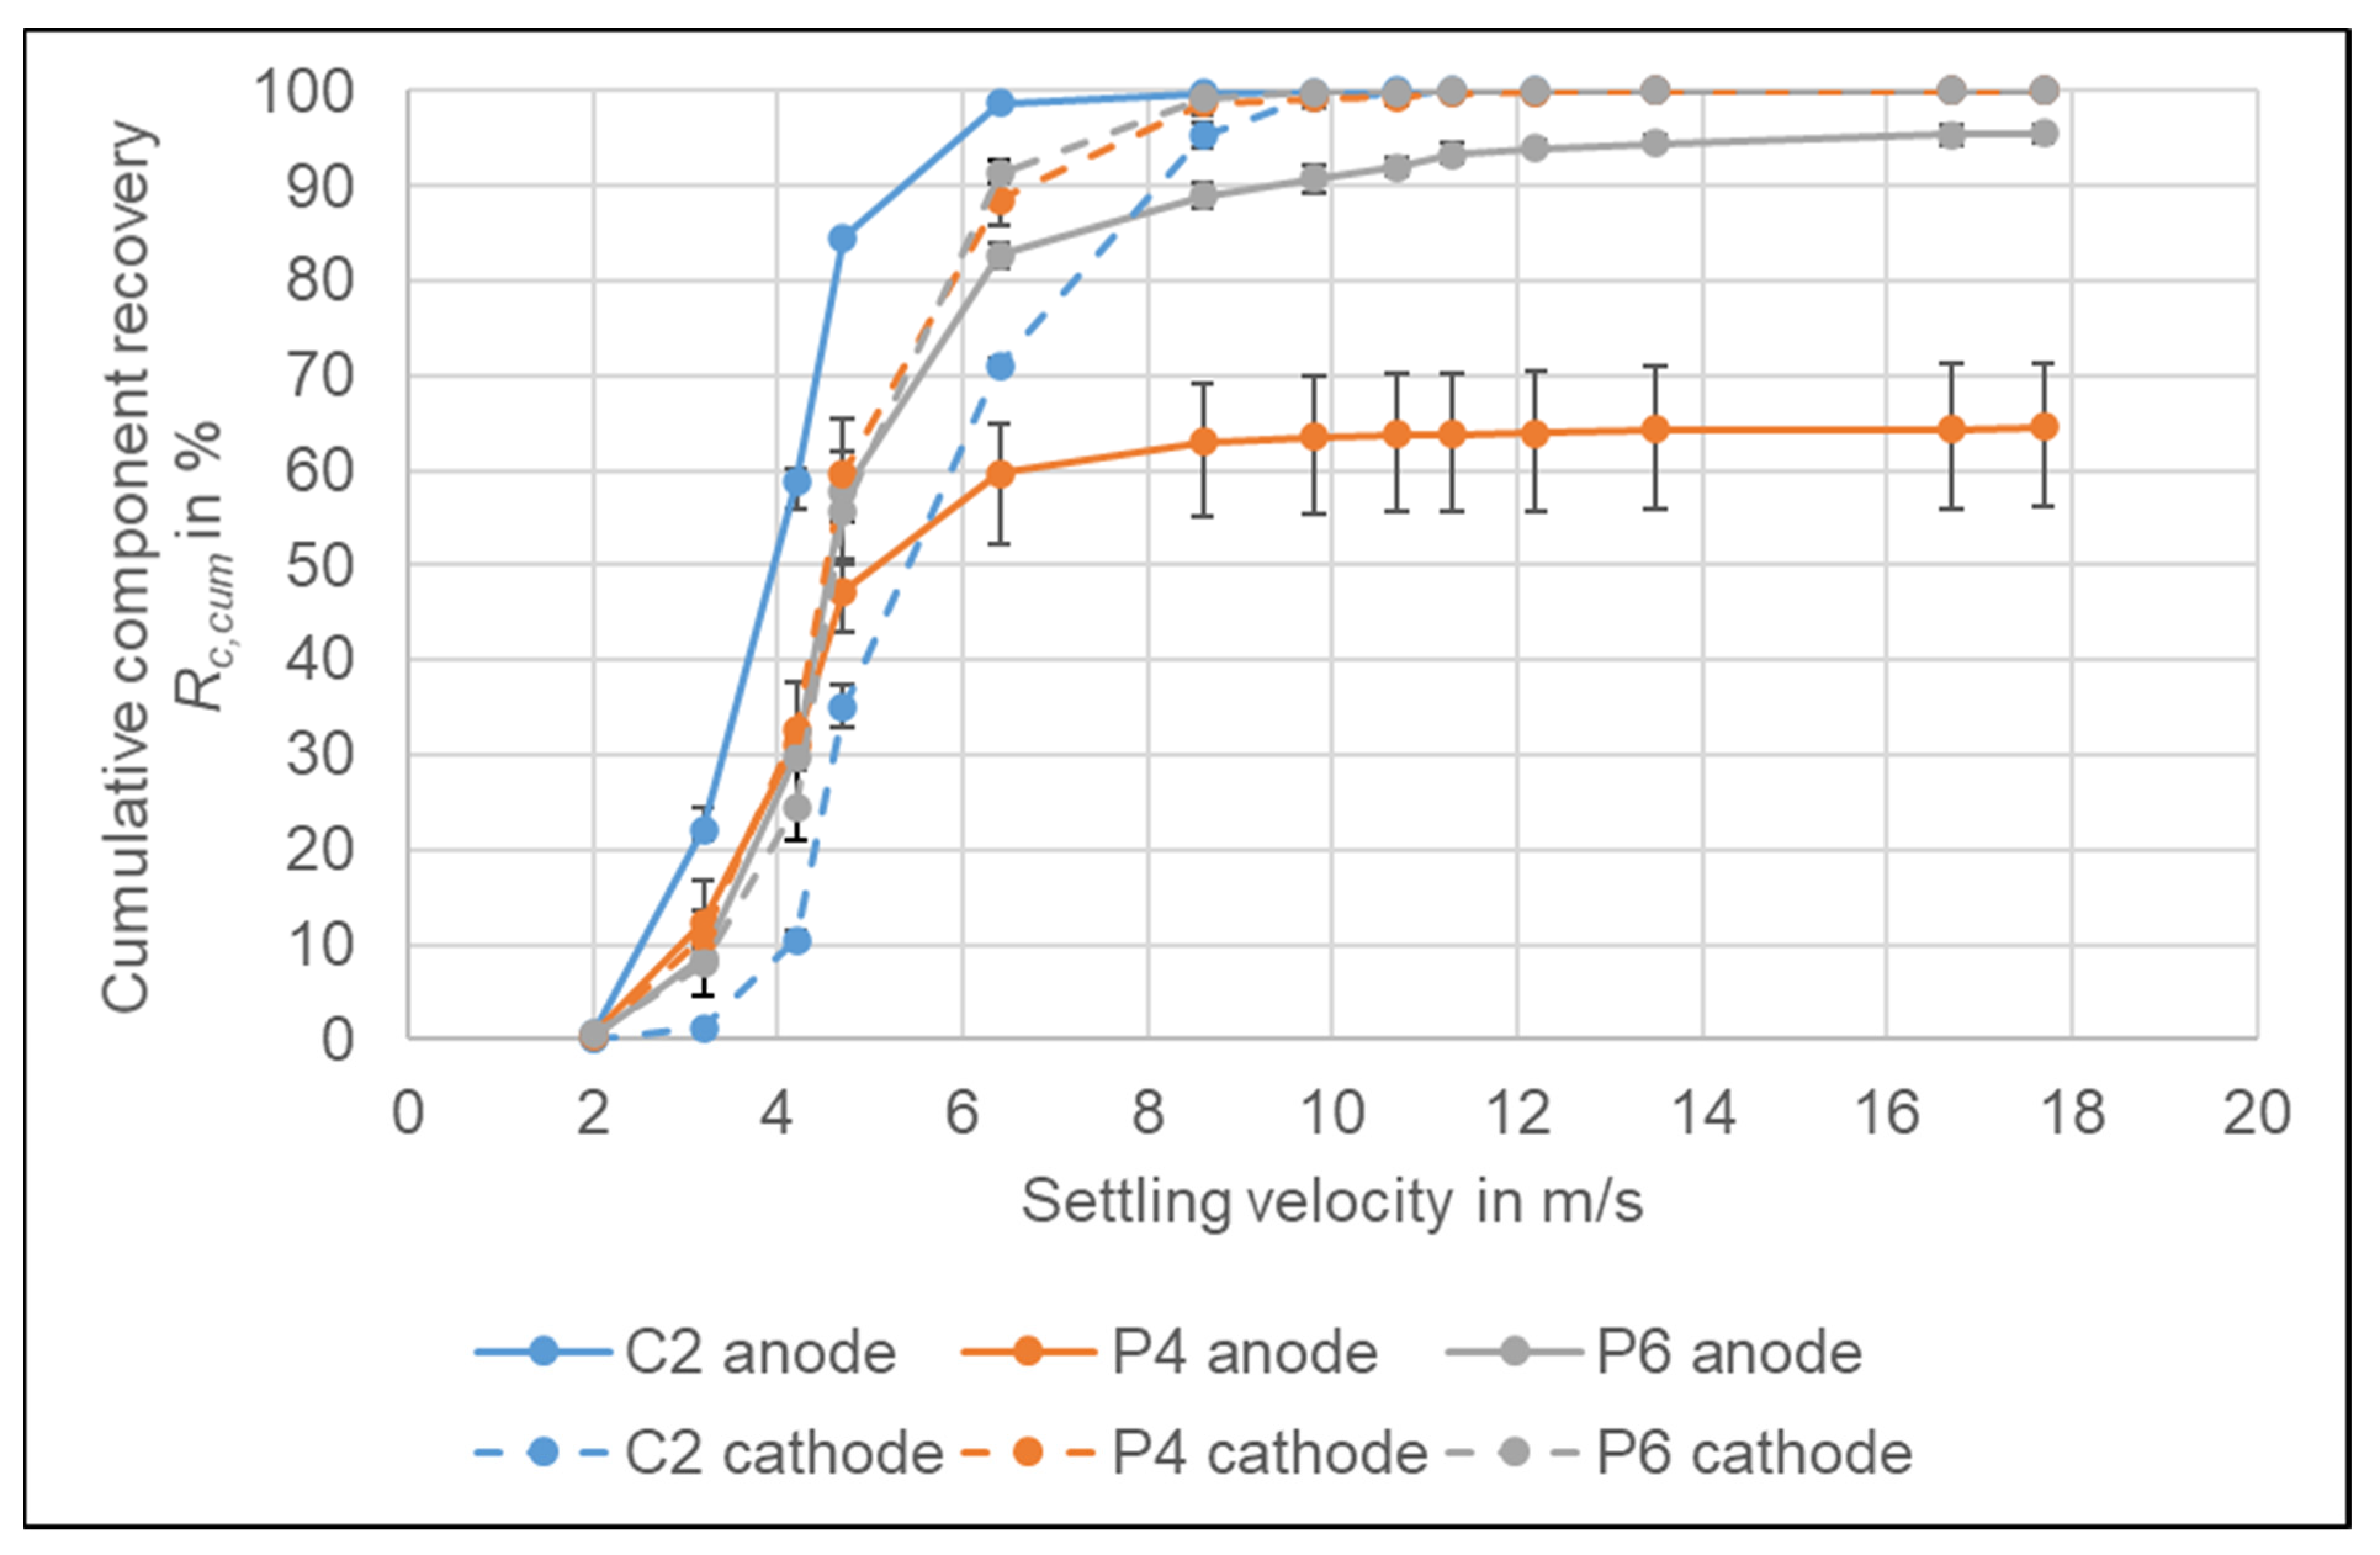
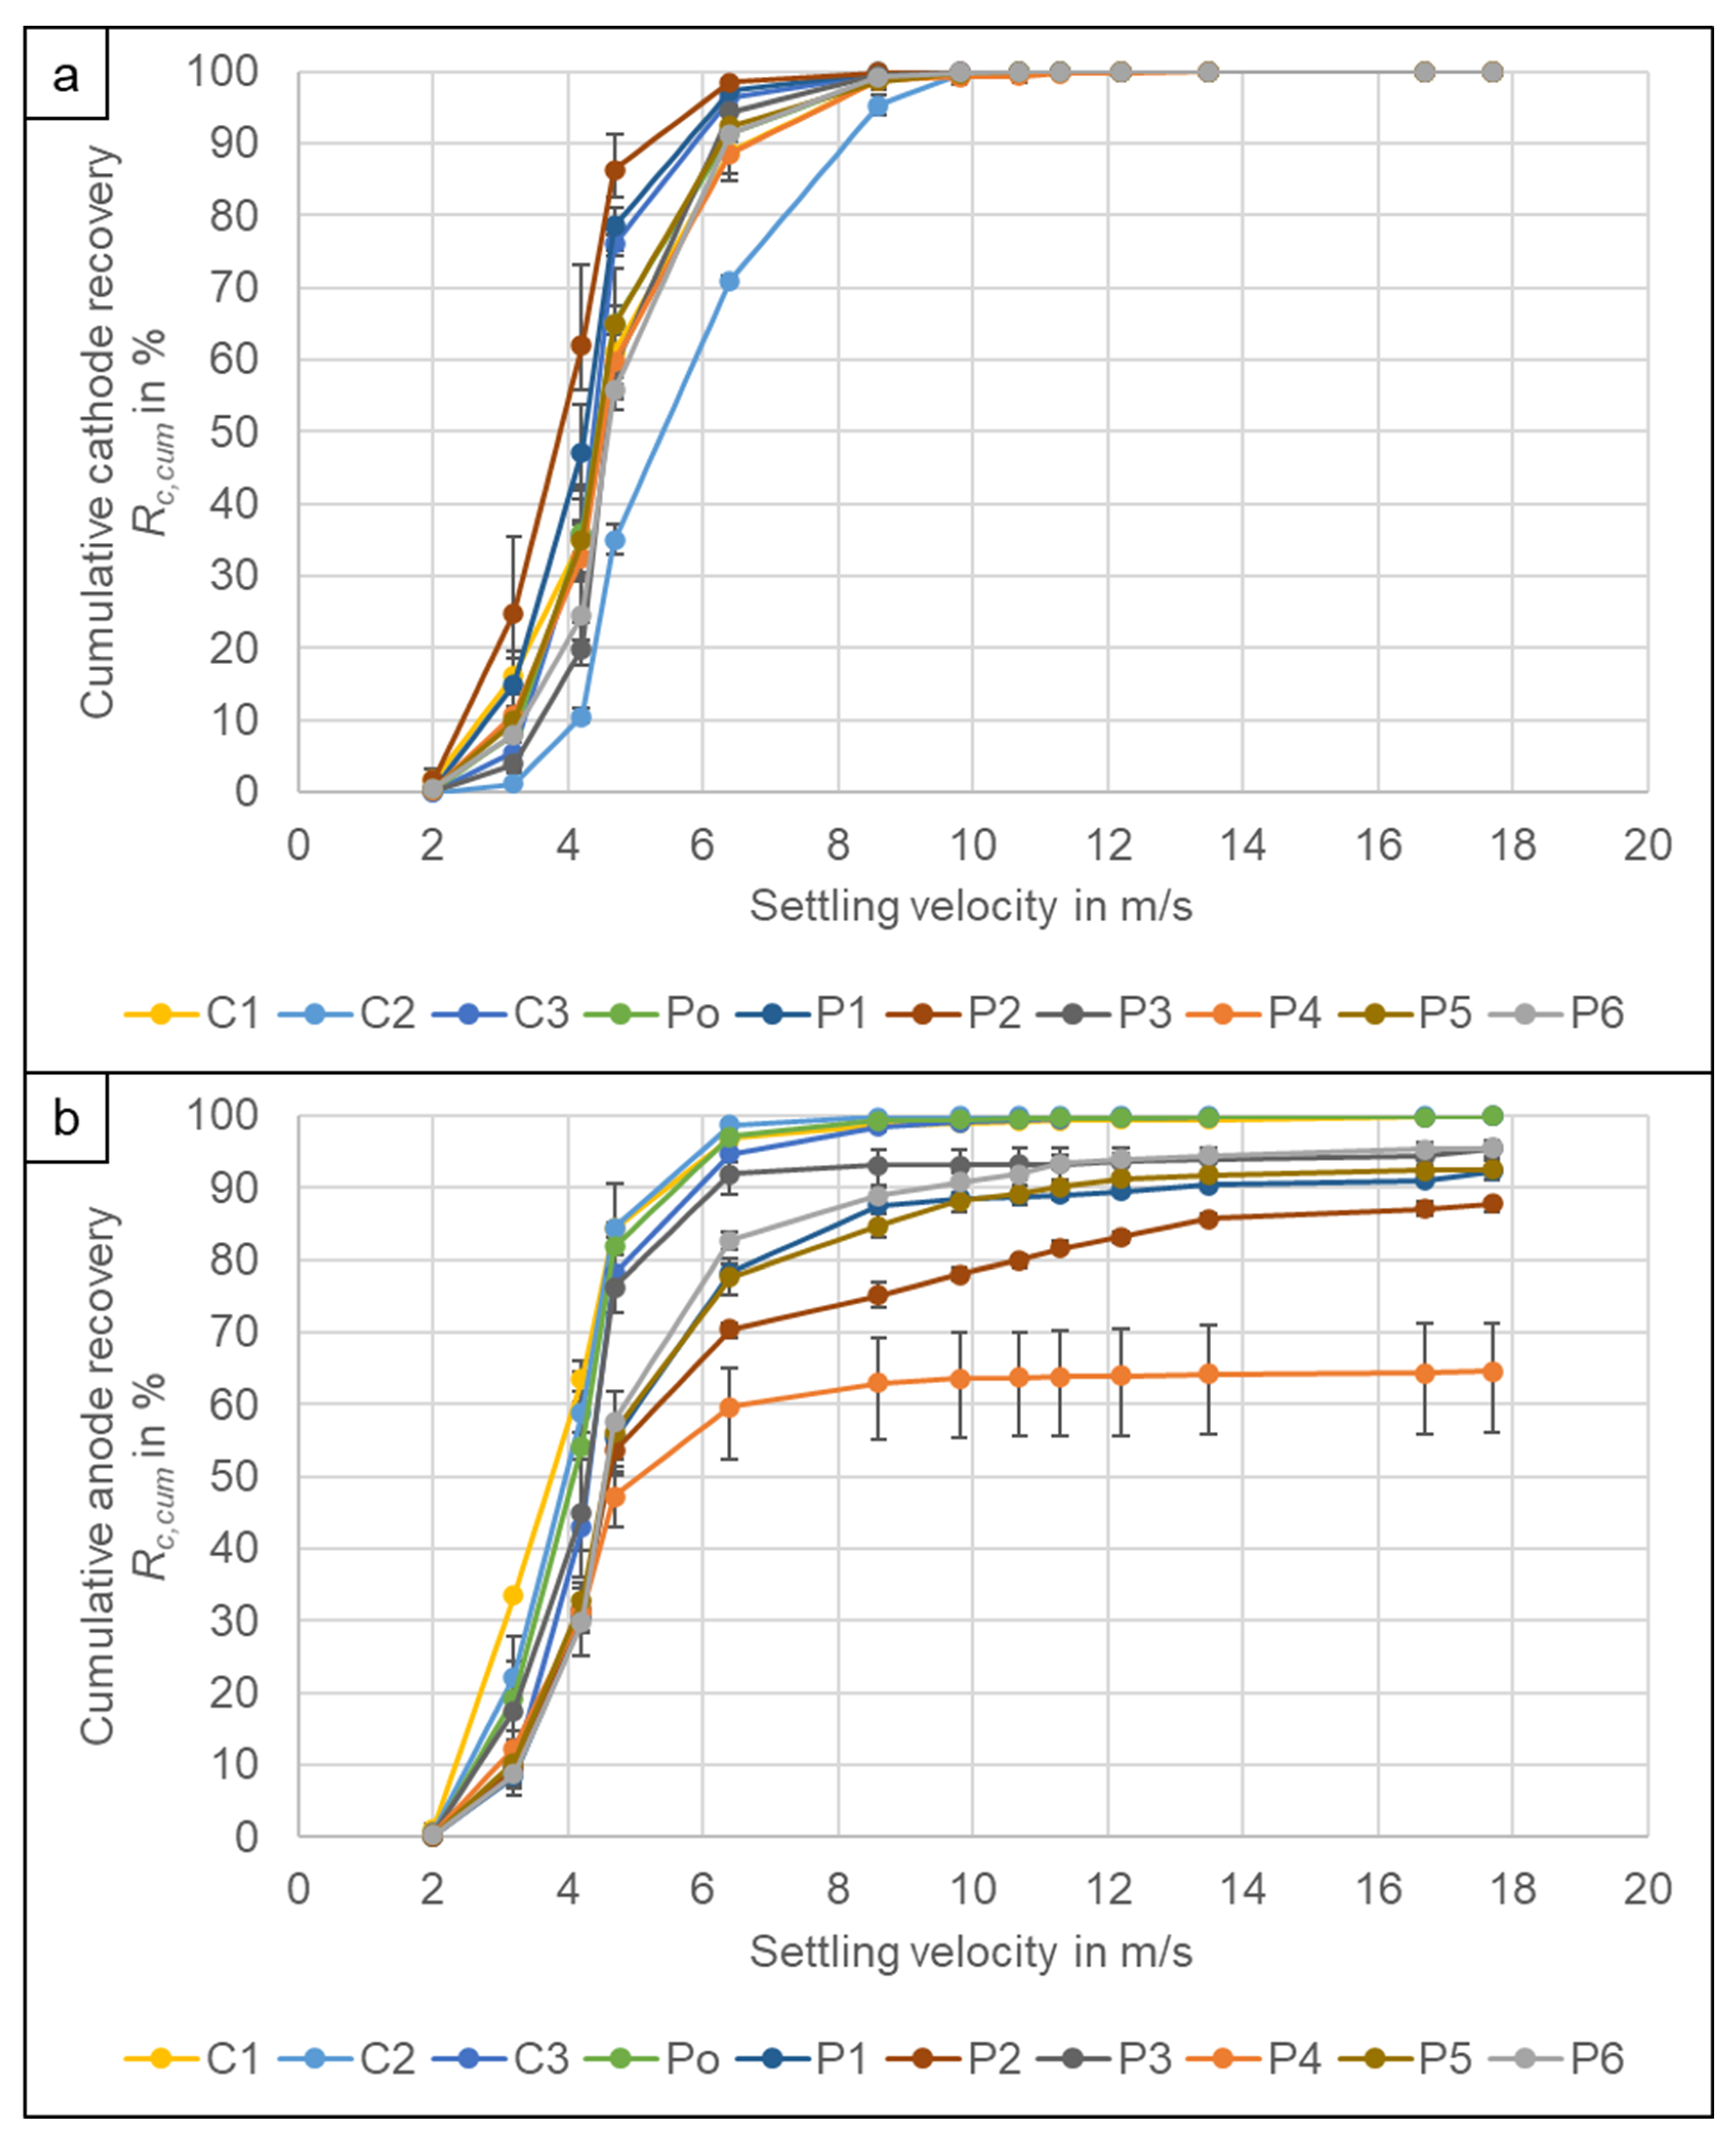
3.4. Air Classification Products

The separator foil and the other light plastic foils can be separated either with the lowest air speed (2 m/s) of the classifier or with the stage above (3.2 m/s). This has a big influence on the recovery of the separator and the composition of the separator product. From Figure 6a it can be seen, that the recovery varies between 9% (C1) and 85% (C2) for the different cell types at 2 m/s. The low recovery of C1 is probably caused by the coating attached to the separator due to the ageing of the cell. It shows a strongly divergent settling velocity distribution and the separator gets recovered at higher settling velocities. It is not known whether less-aged cells behave differently. This needs to be investigated further. It should also be investigated whether additional ageing of the other cell types also poses problems for recycling, as this reduces the recyclability. The reason for the variation of the other cells is unknown, both the foil thickness as well as the particle size of the foil debris have an influence on the separation. Despite the fact that the C2 has a ceramic layer in the separator, which increased its density, it has the best recovery. The composition probably influences the crushing behaviour leading to a different particle size which improves the separation as air classification is not only dependent on the density, but also on size and shape [25]. Increasing the airspeed to 3.2 m/s (Figure 6c) increases the recovery to Rc = 79% (Po) − 97% (C3), except for C1 with Rc = 33%. However, this leads to a significant increase of electrode foils in the separator product (Figure 6b,d). At the low air speed of 2 m/s, the content of the separator in the product ranges from w = 80% (P1) to 94% (C2), with the exemption of C1 (w = 68%). The increased speed reduces this content to w = 20% (Po) − 52% (P1). The decrease occurs for all cell types, therefore for all cell types the lowest air speed is advisable to not lose too much of the more valuable electrode material. It should be investigated if an intermediate cut velocity achieves better values. This was not possible with the air classifier. Between Rc = 0.0% (C2) to 1.6% (P2) of the cathode and between Rc = 0.05% (Po) to 1.2% (C1) of the anode are lost to the separator product. As the separator product is recovered at the lowest speed, the anode and cathode pieces that are recovered with the separator are mostly decoated so that the loss of valuable coating material is lower. This is also the reason why the cathodes of C2 and C3, which showed visually poor decoating, had the lowest recovery rates in the separator product.
For the separation of the electrode product from the casing product, two different air speeds can be applied, either 6.4 or 8.6 m/s. Figure 7 shows the recovery of the electrodes and the casing metals for P4 and P6 for the entire range of settling velocities. The two cell types are chosen to compare cells with steel and aluminium prismatic casing, as third cell type C2 is presented, which is exemplarily for a cylindrical cell with steel casing. The recoveries of the further cells can be found in the supplementary information [28]. The cumulative recoveries do not reach 100% because, at the highest velocity that was investigated, there was still material going to the heavy fraction.
From the recovery curves of the casing materials, it can be seen, that the steel casing of the P4 cell is recovered at higher velocities than the aluminium casing of the P6 cell. At 6.4 m/s already 3.3% of the casing metals of P6 are recovered whereas for the P4 only 0.1% are recovered. If the airspeed is increased to 8.6 m/s, 13.7% of the aluminium casing ends up in the light product, but still only 0.6% of the steel casing. Depending on the technology applied for the further processing of the electrode fraction, the casing metal content should be as low as possible, as it can damage the secondary crusher or mill [31]. Therefore, for the P4 cell, a higher velocity can be used to recover the casing product which decreases the loss of electrode material to the casing product as can be seen in Figure 8b,d. The content of electrodes in the casing product can be reduced from w = 22.0 to 17.1% whereas at the same time, the recovery of the steel casing is only reduced from Rc = 99.9 to 99.4% (Figure 8a,c). That the values for the electrode in the casing are still high can be explained with the analysis method. After crushing it is not possible to distinguish the Cu by its origin. Therefore, heavier Cu pieces of the casing are counted as anode. The anode and copper recovery into the casing product ranges between Rc = 1.3% (C2) and 40.3% (P4) at the lower velocity (6.4 m/s) and Rc = 0.2% (C2) and 37.0% (P5) at the higher velocity (8.6 m/s) depending on the content of strong Cu pieces in the original cells. Therefore, for most cells, an additional further separation of Cu from the casing product will be necessary. Of the cathodes, between Rc = 0.1% (P1) and 1.4% (P5) are recovered in the casing product at the higher velocity (8.6 m/s). The only exception is the C2 cell, where the recovery is Rc = 4.7% due to the higher density of the cathode pieces due to the poorer decoating. For C2, it needs to be investigated further, how the remaining cathode can be recovered from the casing product. For the lower speed (6.4 m/s) the cathode recovery increases significantly to Rc = 1.5% (P2) to 29.0% (C2) which makes a further cathode recovery from the casing product necessary for most of the cell types to avoid major losses of Ni and Co.
Despite the fact, that C1 and C2 have a steel casing as well, the difference to the cells with aluminium casings is not as high as for P4. The reason for that is probably the thinner casing. P4 had a casing thickness of 0.8 mm whereas C1 and C2 only had a thickness of 0.4 mm (Figure 3). Figure 7 shows that for C2 the recovery of the steel casing into the lighter fraction increases from Rc,cum = 1.9 to 5.6% by increasing the airspeed. Therefore, a general statement, that all cells with steel casing should be treated with a high velocity is not possible. The casing product of the Po cell (Figure 8b,d) consists mostly of electrode material and the casing metal content is only w = 12.1% at the lower air speed. For pouch cells, it is therefore not recommended to separate a casing product, but rather keep the thin aluminium casing together with the electrode fraction and separate the aluminium in a further process together with the cathode current collector foil.
Figure 9a,c shows the recovery rates of the electrode material into the electrode product for the two settling velocities presented above (Figure 7). It can be seen, that the recovery of anode, cathode and liberated coating into the electrode product ranges from Rc = 78.9% (P4) to 95.0% (C3) and increases to Rc = 84.4% (P4) to 98.8% (Po) by increasing the airspeed. At the same time, the content of the target materials in the electrode product decreases from w = 63.2% (C1) − 91.0% (P5) to w = 61.9% (C1) − 90.3% (P4) due to the higher content of casing metals (Figure 9b,d). Only the quality of the Po product remains quite constant with w = 97.8% due to the low amount of casing metals in the overall cell. The low quality of the electrode product of the C1 cell can be explained by the high share of the separator. The separator share is so high because its weight is increased by the attached coating, which can be due to cell ageing or due to the discharge procedure [30].
After the primary crushing, it is not yet possible to separate anode and cathode by means of air classification, because the settling velocity distributions of the aluminium and copper foil particles and their median are quite similar. Figure 10 shows the cumulative recoveries for the anode and cathode of C2, P4, and P6. The two electrodes of P6 show an almost uniform distribution until the settling velocity of 6.4 m/s, which corresponds to around 80% recovery, and above they only show a small difference. For P4 the two curves part at 4.7 m/s. However, the reason here is the high amount of Cu from the casing fraction which is accounted in the anode fraction as well. This casing copper could be separated from the cathode material by air classification, but not the anode copper foil. The biggest difference between anode and cathode distribution occurs for C2. If the cut is made at 4.2 m/s, the cathode product, assuming a separation of the casing at 6.4 m/s, would consist of 70.0% of the cathode, but still contain 18.6% of the anode. The anode product would consist of 41.6% of anode and 43.0% of cathode if the separator product is separated at 2 m/s. Hence, the product quality is not very high and a separation at this stage is not advisable. The reason for the similar behaviour of the two electrodes is most likely the influence of the particle shape as both have a flat foil shape. It further has to be stated that in this stage the foils still are partially coated, which significantly contributes to the mass of the individual particles. For the separation of anode and cathode, further comminution is necessary to finalize the de-coating and to reshape the particles into a more spherical shape to make the particle density the governing parameter in the airflow separation as already suggested by Wuschke [14]. This needs to be investigated further for the different cell types.
Despite the large variation in cathode current collector foil thickness (Figure 3) and the variation in decoating, there is not much difference between the settling velocity distributions of the cathodes deriving from the different cell types. Figure 11a shows the cumulative recoveries of the cathodes at different settling velocities. Only cell type C2 is sticking out. Its cathode current collector foil thickness could not be determined, but optically it has a rather thin Al foil, however higher air speeds are needed to recover the cathode of C2 compared to the other cell types. A possible reason is the poor decoating of the cathode. The material is still completely black after comminution and the attaching coating significantly increases the density of the foil particles. However, C3 and Po show poor decoating as well and their settling velocity distribution is similar to the other cell types even though C3 also has the highest Al foil thickness. It can be concluded that the foil thickness of the cathode does not play any governing role in the air separation process, parameters like particle size and shape as well as remaining coting are the dominant factors. For visual comparison, photos of the anode and cathode pieces can be found in the supplementary information [28].
The cumulative recovery of the anodes (Figure 11b) shows a larger variation than that of the cathodes despite the fact, that the current collector foil thickness only varied between 8.1–10.6 µm (Figure 3). However, this can be attributed to the influence of the Cu particles from the cell casings as the deviations mostly occur at the higher settling velocities. If a cut at 6.4 m/s is applied, some cells show a low amount of anode in the casing product with a recovery of around Rc = 1–3% (C1, C2, Po), as there are no larger Cu pieces in the original cell. Depending on the Cu content of the anode particles as well as the compounds it might be possible to reach the 95% Cu recovery requirement of the EU without recovering the Cu from the casing product. For the other cell types, the recovery of the anode in the casing fraction lies between Rc = 5.3% (C3) and 40.3% (P4). To reach the 95% recovery it is necessary to recover the Cu from the casing as well as from the electrode product in further process steps.
The separation of an air classifier is based on particle density, particle shape and particle size [25]. For the casing metals, the higher density of the steel casing resulted in a different settling velocity distribution. However, this only occurred for cell type P4, for C1 and C2 the different thicknesses compensated the density difference so that the distribution and therefore the separation was similar to that of the aluminium casings. For the cathode foils, a difference in the settling velocity was also expected due to the different foil thicknesses and different densities resulting from the different decoating efficiencies. However, only the C2 cathode showed a different behaviour due to the higher density caused by the still attached coating. It needs to be further investigated whether a different particle size or shape does compensate for the difference in density. For the anodes, the differences in separation are caused by the different shares of stronger Cu pieces within the cells as these are recovered at higher velocities. The different plastics in the cells are separated into different products depending on their shape and density. Thin plastic foils go to the separator product while thicker plastic pieces end up either in the electrode or mostly in the casing product.

3.5. Mass Recovery of Products

Figure 12 shows the distribution of the feed material into the different products. The percentage missing to 100% are losses during processing of small quantities and during sampling and analysis. Separation of the separator product was conducted for all cell types at 2 m/s and the separation of the casing product at 6.4 m/s. What can be seen is that, except for P4, the electrode product has the highest mass recovery. This was to be expected as the electrode has for most of the cell types the highest share of the cell composition (Figure 2). For P4 the casing product share (28.4%) is slightly higher than the electrode product (27.4%) due to the high share of the steel casing in the cell. The highest share of electrode products have Po (65.9%) due to the low share of metal casing and C3 (58.5%) due to the thick current collector foils used for the electrodes.
The second highest product share has either the casing product or the black mass depending on the cell type. The highest casing product share is the P4 cell (28.4%) due to the steel casing. The other cells with steel casing (C1 and C2) do not have a higher product share than the other cells, because the casing share is already similar for the cell composition (Figure 2). C3, Po and P1 have a rather low black mass product share due to the low amount of the fraction < 1 mm created. The volatile components evaporated during drying have a similar share between 7% (C1–C3) and 12% (P1). P1 has the highest product share of volatiles of all cell types as the complete cell has also the highest content of volatile components. The separator product has the lowest share due to the low amount of separator and plastic foils inside the cells. It ranges between 2 and 4%.

4. Conclusions

This study aimed to investigate the influence of the cell type on the mechanical recycling process. Therefore, ten different cell types with different casing geometry and different cell chemistry were processed in a standardized process design consisting of crushing, screening and air classification. It could be shown that the cell geometry and casing material have an influence on the required crushing energy. Prismatic cells with a steel casing require more energy than prismatic cells with an aluminium casing. Cylindrical cells require a similar crushing energy than the prismatic cells and pouch cells have a comparably low energy consumption. The particle size distribution varies quite much between the different cell types, mostly caused by the amount of material < 1 mm being created. This is caused by significant differences in the decoating for the different cell types, especially of the cathodes. So far this has only been visually investigated, the difference in decoating efficiency, black mass yield and black mass quality should be investigated further.
For the air classification, the casing material has the highest impact on the separation. Cells with a strong steel casing can be processed at higher settling velocities to separate casing and electrode material from each other. This leads to a higher electrode recovery. For the separator, the same settings for all cell types can be applied. A higher air speed would lead to higher losses of electrode material to the separator product. The cathodes show no major difference between the cell types as well. For the anode separation, there is a difference in the high settling velocities as this is affected by compact Cu particles from the casing, e.g., the nail safety device or current collectors. For those cell types where higher amounts of Cu end up in the casing product, an additional treatment of the casing fraction would be necessary to recover the Cu to meet the required recovery rate. Anode and cathode cannot be separated by air classification due to a similar settling velocity distribution. For the separation of Al and Cu, further treatment is necessary. It should therefore be investigated which influence the different cell types have on secondary crushing and separation and therefore the Cu recovery. It can be concluded, that separate recycling is only recommended for cells with a thick steel casing, where the separation of electrodes and casing can be improved with a different airspeed. For the other cell types, a separate processing does not have an advantage. For pouch cells, it is expected to be advantageous to process them together with cells with hard casing as the hard casing improves the comminution.

Author Contributions

Conceptualization, C.W., A.K. and U.A.P.; Methodology, C.W.; Investigation, C.W. and A.K.; Writing—original draft, C.W.; Writing—review & editing, A.K. and U.A.P.; Supervision, U.A.P.; Project administration, U.A.P.; Funding acquisition, U.A.P. All authors have read and agreed to the published version of the manuscript.

Funding

This research was funded by the Federal Ministry for Education and Research (BMBF), as well as the Projektträger Jülich (PTJ), with the projects DIGISORT (Digitalisation of mechanical sorting processes in mechanical battery recycling) 03XP0337 and LOWVOLMON (Monitoring of low-volatile electrolytes in the mechanical recycling process chain) 03XP0354 within the competence cluster for battery recycling (greenBatt).

Data Availability Statement

The data presented in this study are openly available in OpARA at https://doi.org/10.25532/OPARA-248 [28].

Acknowledgments

The authors would like to thank Liofit GmbH and BMW AG for providing some of the batteries. The authors would also like to thank Arjun Amruth, Seyedamir Bahreini, Bat-Ochir Battumur, Shivansh Bhandari, Anastasia Datiy, Nkwenti Hoza Giresse, Gajanan Jadhav, Arslan Nazim, and Kedar Rahul Parekh for conducting the sieve, settling velocity and composition analysis as part of their student project works. Thanks, as well to the technical and scientific staff of the Institute of Mechanical Process Engineering and Mineral Processing.

Conflicts of Interest

The authors declare no conflict of interest.

References

  1. Neef, C.; Schmaltz, T.; Thielmann, A. Recycling von Lithium-Ionen Batterien: Chancen und Herausforderungen für den Maschinen- und Anlagenbau; Fraunhofer-Institut für System- und Innovationsforschung ISI: Karlsruhe, Germany, 2021. [Google Scholar]
  2. Council of the European Union. Proposal for a Regulation of the European Parliament and of the Council Concerning Batteries and Waste Batteries, Repealing Directive 2006/66/EC and Amending Regulation (EU) No 2019/1020—Letter to the Chair of the European Parliament Committee on the Environment, Public Health and Food Safety (ENVI). 2023. Available online: https://data.consilium.europa.eu/doc/document/ST-5469-2023-INIT/en/pdf (accessed on 10 November 2023).
  3. Woehrle, T. Lithium-ion cell. In Lithium-Ion Batteries: Basics and Applications; Korthauer, R., Ed.; Springer: Berlin/Heidelberg, Germany, 2018; pp. 101–112. [Google Scholar]
  4. Weber, C.J.; Roth, M. Separators. In Lithium-Ion Batteries: Basics and Applications; Korthauer, R., Ed.; Springer: Berlin/Heidelberg, Germany, 2018; pp. 75–88. [Google Scholar]
  5. Shi, C.; Dai, J.; Shen, X.; Peng, L.; Li, C.; Wang, X.; Zhang, P. A high-temperature stable ceramic-coated separator prepared with polyimide binder/Al2O3 particles for lithium-ion batteries. J. Membr. Sci. 2016, 517, 91–99. [Google Scholar] [CrossRef]
  6. Link, S.; Neef, C.; Wicke, T. Trends in Automotive Battery Cell Design: A Statistical Analysis of Empirical Data. Batteries 2023, 9, 261. [Google Scholar] [CrossRef]
  7. Wurm, C.; Öttinger, O.; Wittkämper, S.; Zauter, R.; Vuorilehto, K. Anode materials for lithium-ion batteries. In Lithium-Ion Batteries: Basics and Applications; Korthauer, R., Ed.; Springer: Berlin/Heidelberg, Germany, 2018; pp. 43–58. [Google Scholar]
  8. Vuorilehto, K. Materials and function. In Lithium-Ion Batteries: Basics and Applications; Korthauer, R., Ed.; Springer: Berlin/Heidelberg, Germany, 2018; pp. 21–28. [Google Scholar]
  9. Thackeray, M.M. Manganese oxides for lithium batteries. Prog. Solid State Chem. 1997, 25, 1–71. [Google Scholar] [CrossRef]
  10. Nam, G.W.; Park, N.-Y.; Park, K.-J.; Yang, J.; Liu, J.; Yoon, C.S.; Sun, Y.-K. Capacity Fading of Ni-Rich NCA Cathodes: Effect of Microcracking Extent. ACS Energy Lett. 2019, 4, 2995–3001. [Google Scholar] [CrossRef]
  11. Graf, C. Cathode materials for lithium-ion batteries. In Lithium-Ion Batteries: Basics and Applications; Korthauer, R., Ed.; Springer: Berlin/Heidelberg, Germany, 2018; pp. 29–41. [Google Scholar]
  12. Hartnig, C.; Schmidt, M. Electrolytes and conducting salts. In Lithium-Ion Batteries: Basics and Applications; Korthauer, R., Ed.; Springer: Berlin/Heidelberg, Germany, 2018; pp. 59–74. [Google Scholar]
  13. Meutzner, F.; de Vivanco, M.U. Electrolytes—Technology review. In Proceedings of the AIP Conference Proceedings, Boise, ID, USA, 20–25 July 2014; p. 185. [Google Scholar]
  14. Wuschke, L. Mechanische Aufbereitung von Lithium-Ionen-Batteriezellen; TU Bergakademie Freiberg: Freiberg, Germany, 2018. [Google Scholar]
  15. Diekmann, J.; Sander, S.; Sellin, G.; Petermann, M.; Kwade, A. Crushing of Battery Modules and Cells. In Recycling of Lithium-Ion Batteries: The LithoRec Way; Kwade, A., Diekmann, J., Eds.; Springer: Berlin/Heidelberg, Germany, 2018; pp. 127–138. [Google Scholar]
  16. Windisch-Kern, S.; Gerold, E.; Nigl, T.; Jandric, A.; Altendorfer, M.; Rutrecht, B.; Scherhaufer, S.; Raupenstrauch, H.; Pomberger, R.; Antrekowitsch, H.; et al. Recycling chains for lithium-ion batteries: A critical examination of current challenges, opportunities and process dependencies. Waste Manag. 2022, 138, 125–139. [Google Scholar] [CrossRef] [PubMed]
  17. Hauck, D.; Kurrat, M. Overdischarging Lithium-Ion Batteries. In Recycling of Lithium-Ion Batteries: The LithoRec Way; Kwade, A., Diekmann, J., Eds.; Springer: Berlin/Heidelberg, Germany, 2018; pp. 53–81. [Google Scholar]
  18. Stehmann, F.; Bradtmöller, C.; Scholl, S. Separation of the Electrolyte—Thermal Drying. In Recycling of Lithium-Ion Batteries: The LithoRec Way; Kwade, A., Diekmann, J., Eds.; Springer: Berlin/Heidelberg, Germany, 2018; pp. 139–154. [Google Scholar]
  19. Vanderbruggen, A.; Sygusch, J.; Rudolph, M.; Serna-Guerrero, R. A contribution to understanding the flotation behavior of lithium metal oxides and spheroidized graphite for lithium-ion battery recycling. Colloids Surf. A Physicochem. Eng. Asp. 2021, 626, 127111. [Google Scholar] [CrossRef]
  20. Salces, A.M.; Bremerstein, I.; Rudolph, M.; Vanderbruggen, A. Joint recovery of graphite and lithium metal oxides from spent lithium-ion batteries using froth flotation and investigation on process water re-use. Miner. Eng. 2022, 184, 107670. [Google Scholar] [CrossRef]
  21. Wang, X.-T.; Gu, Z.-Y.; Ang, E.H.; Zhao, X.-X.; Wu, X.-L.; Liu, Y. Prospects for managing end-of-life lithium-ion batteries: Present and future. Interdiciplinary Mater. 2022, 1, 417–433. [Google Scholar] [CrossRef]
  22. Doose, S.M.; Julian, K.; Michalowski, P.; Kwade, A. Challenges in Ecofriendly Battery Recycling and Closed Material Cycles: A Perspective on Future Lithium Battery Generations. Metals 2021, 11, 291. [Google Scholar] [CrossRef]
  23. Velázquez-Martínez, O.; Valio, J.; Santasalo-Aarnio, A.; Reuter, M.; Serna-Guerrero, R. A Critical Review of Lithium-Ion Battery Recycling Processes from a Circular Economy Perspective. Batteries 2019, 5, 68. [Google Scholar] [CrossRef]
  24. Kaya, M. State-of-the-art lithium-ion battery recycling technologies. Circ. Econ. 2022, 1, 100015. [Google Scholar] [CrossRef]
  25. Kaas, A.; Mütze, T.; Peuker, U.A. Review on Zigzag Air Classifier. Processes 2022, 10, 764. [Google Scholar] [CrossRef]
  26. Lyon, T.; Mütze, T.; Peuker, U.A. Decoating of Electrode Foils from EOL Lithium-Ion Batteries by Electrohydraulic Fragmentation. Metals 2022, 12, 209. [Google Scholar] [CrossRef]
  27. Pinegar, H.; Smith, Y.R. End-of-Life Lithium-Ion Battery Component Mechanical Liberation and Separation. JOM 2019, 71, 4447–4456. [Google Scholar] [CrossRef]
  28. Wilke, C.; Kaas, A.; Peuker, U.A. Supplementary Information to the Publication “Influence of the Cell Type on the Physical Processes of the Mechanical Recycling of Automotive Lithium-Ion Batteries”; Technische Universität Dresden: Dresden, Germany, 2023. [Google Scholar] [CrossRef]
  29. Woldt, D. Zerkleinerung nicht-sproeder Stoffe in Rotorscheren und -reissern. Freib. Forschungshefte 2005, 887, 173. [Google Scholar]
  30. Kaas, A.; Wilke, C.; Vanderbruggen, A.; Peuker, U.A. Influence of different discharge levels on the mechanical recycling efficiency of lithium-ion batteries. Waste Manag. 2023, 172, 1–10. [Google Scholar] [CrossRef]
  31. Diekmann, J.; Hanisch, C.; Froböse, L.; Schälicke, G.; Loellhoeffel, T.; Fölster, A.-S.; Kwade, A. Ecological Recycling of Lithium-Ion Batteries from Electric Vehicles with Focus on Mechanical Processes. J. Electrochem. Soc. 2016, 164, A6184–A6191. [Google Scholar] [CrossRef]
Figure 1. Process scheme for the different cell types.
Metals 13 01901 g001
Figure 2. The composition of the different cell types determined by disassembly. For the C1 anode, cathode, and separator the exact shares could not be determined and are accounted for together (blank bar 66.2%).
Metals 13 01901 g002
Figure 3. The thickness of the current collector foils of the different cell types.
Metals 13 01901 g003
Figure 4. Required specific stress-energy in kWh/t for the comminution of the different cell types. The stated values are the sum of the stress energies of the three crushing steps RR (rotary ripper), RS (rotary shear), and UG (granulator). The results are the average values of three experiments, the error bars show the minimum and maximum values.
Metals 13 01901 g004
Figure 5. Particle size distribution of the crushing product after drying of the different cell types. Below are the corresponding characteristic values x50 and x90. The results are the average values of three experiments (21 experiments for P6), the error bars show the minimum and maximum values.
Metals 13 01901 g005
Figure 6. Recovery Rc of the separator into the separator product at (a) 2 m/s and (c) 3.2 m/s. Composition of the separator product at (b) 2 m/s and (d) 3.2 m/s. The results are the average values of three experiments (11 experiments for P6), the error bars show the minimum and maximum values.
Metals 13 01901 g006
Figure 7. Cumulative recovery Rc,cum of the casing metals and the electrodes for C2, P4 and P6. The results are the average values of three experiments (11 experiments for P6), the error bars show the minimum and maximum values.
Metals 13 01901 g007
Figure 8. Recovery Rc of casing metals into the heavy fraction i.e., the casing product at (a) >6.4 m/s and (c) >8.6 m/s. Composition of the casing product at (b) >6.4 m/s and (d) >8.6 m/s. The results are the average values of three experiments (11 experiments for P6), the error bars show the minimum and maximum values.
Metals 13 01901 g008
Figure 9. Recovery Rc of electrode material (anode, cathode and liberated coating) into the electrode product at (a) 2–6.4 m/s and (c) 2–8.6 m/s. Composition of the electrode product at (b) 2–6.4 m/s and (d) 2–8.6 m/s. The results are the average values of three experiments (11 experiments for P6), the error bars show the minimum and maximum values. The stated values at the composition are the electrode share marked by the boxed area.
Metals 13 01901 g009
Figure 10. Cumulative recovery Rc,cum of anode and cathode for C2, P4 and P6. The results are the average values of three experiments (11 experiments for P6), the error bars show the minimum and maximum values.
Metals 13 01901 g010
Figure 11. Cumulative recovery Rc,cum of the (a) cathodes and (b) anodes of the different cell types. The results are the average values of three experiments (11 experiments for P6), the error bars show the minimum and maximum values.
Metals 13 01901 g011
Figure 12. Mass recovery Rm into the different products for the different cell types. The results are the average values of three experiments.
Metals 13 01901 g012
Table 1. Data of the investigated cell types.
IndicationC1C2C3PoP1P2P3P4P5P6
Cell typeCylindricCylindricCylindricPouchPrismaticPrismaticPrismaticPrismaticPrismaticPrismatic
Chemistry LCONCALFPLCONMC 111NMC 111NMC 433LMO + NMCLMO + NMCNMC 111
Voltage in Vn.a.3.63.33.7n.a.n.a.n.a.n.a.3.933.68
Capacity in Ahn.a.545n.a.2037506094
Casing materialSteelSteelAluminiumAluminiumAluminiumAluminiumAluminiumSteelAluminiumAluminium
Casing thickness in mm0.40.40.60.10.50.90.80.80.90.9
Number of windings111Stacked122244
Cell length
in mm
---140120173148173173173
Cell width in mm---9.512.51926.5454545
Cell height
in mm
657011842858791100125125
Cell diameter
in mm
182132-------
Cell weight in g4468197196270663794170618302035
Cells per experiment9622211111
Disclaimer/Publisher’s Note: The statements, opinions and data contained in all publications are solely those of the individual author(s) and contributor(s) and not of MDPI and/or the editor(s). MDPI and/or the editor(s) disclaim responsibility for any injury to people or property resulting from any ideas, methods, instructions or products referred to in the content.

