Article

Deep Learning-Based Understanding of Defects in Continuous Casting Product

1
State Key Laboratory for Advanced Metals and Materials, University of Science and Technology Beijing, Beijing 100083, China
2
Collaborative Innovation Center of Steel Technology, University of Science and Technology Beijing, Beijing 100083, China
3
Department of Metallurgical, Materials and Biomedical Engineering, University of Texas at El Paso, El Paso, TX 79968, USA
4
Yangjiang Branch, Guangdong Laboratory for Materials Science and Technology (Yangjiang Advanced Alloys Laboratory), Yangjiang 529500, China
*
Author to whom correspondence should be addressed.
Metals 2023, 13(11), 1809; https://doi.org/10.3390/met13111809
Submission received: 19 September 2023 / Revised: 17 October 2023 / Accepted: 19 October 2023 / Published: 27 October 2023
(This article belongs to the Special Issue Advances in High-Strength Low-Alloy Steels (2nd Edition))

Abstract

:
A novel YOLOv5 network is presented in this paper to quantify the degree of defects in continuously cast billets. The proposed network addresses the challenges posed by noise or dirty spots and different defect sizes in the images of these billets. The CBAM-YOLOv5 network integrates the channel and spatial attention of the Convolutional Block Attention Module (CBAM) with the C3 layer of the YOLOv5 network structure to better fuse channel and spatial information, with focus on the defect target, and improve the network’s detection capability, particularly for different levels of segregation. As a result, the feature pyramid is improved. The feature map obtained after the fourth down-sampling of the backbone network is fed into the feature pyramid through CBAM to improve the perceptual field of the target and reduce information loss during the fusion process. Finally, a self-built dataset of continuously cast billets collected from different sources is used, and several experiments are conducted using this database. The experimental results show that the average accuracy (mAP) of the network is 93.7%, which can achieve intelligent rating.

1. Introduction

Since its inception in the 1950s, continuous casting technology has experienced significant development in the steel industry, gradually becoming a mainstream steel production process. Continuous casting involves the process of transforming liquid steel into solid continuous cast products through cooling and solidification within a continuous casting machine [1]. In the course of continuous casting production, due to various factors, different types of defects may be present in the products, such as segregation, cracks, central porosity, shrinkage, and bubbles. These defects can have a substantial impact on the performance of steel products, such as tensile properties, toughness, corrosion resistance, wear resistance, and fatigue strength [2,3,4,5,6,7,8,9,10,11]. Therefore, characterization of the defects is of great importance.
Currently, the macroscopic inspection of continuous casting products is mostly performed using the acid etching method. Ratings of the slabs are usually based on manual comparison between the cross sectional images of the etched slabs and the standard charts, as in the case for the Chinese National Standard YB/T 4003-2016 [12] and the Mannesmann rating method [13]. Such approaches depend strongly on the operator who made the comparation. The SSAB steel plant [14] attempted to evaluate the same group of cast slabs using the Mannesmann standard, the two operators gave very different results. In contrast, the Rapp [15] standard divides the segregation in the slabs into dispersive dots and a continuous line. The quality of the slab was evaluated based on the number of dots within a given length. While the Mannesmann and Rapp standards have limitations in that they can only be used to grade the slabs where the segregation tends to form a line, the Chinese National Standard also give the standard charts of billets where the defects are widely scattered.
The use of automated digital identification and rating is a new development trend which can save the effort needed for manual inspection. However, such an approach places stringent demands on image quality as the captured images can be influenced by factors such as lighting, noise, and other environmental variables. Sometimes, defects lack distinct features, making them prone to confusion with background elements or stains. To reduce the impact of uneven lighting, Xi et al. [16]. proposed a new framework for surface inspection. Zhao et al. [17] proposed a discriminant manifold regularized local descriptor to conduct the defect classification for steel surfaces. To detect pinholes in billets, Choi [18] proposed a Gabor filter combination to extract defect candidates and define morphological features. But, it is difficult to determine which feature is the most important in different images. It strongly depends on error handling and the difference between the target and the background.
The use of artificial intelligence methods instead of manual inspection is a recent trend. Information is extracted for processing and analysis by computer vision technology, and the advantages of this method are a high efficiency, high accuracy, and low human factor. Traditional computer image processing methods, of which the recognition effect depends on the difference between the target and the background, are only suitable for processing simple backgrounds.
To obtain the location and types of defects directly, it is more effective to combine production with object detection algorithms. Tao et al. [19] designed a novel cascaded autoencoder architecture to segment and localize defects on a metallic surface. However, this method cannot distinguish defects with complex backgrounds. Lin et al. [20] adopted the faster region-based convolutional neural network (Faster-RCNN) [21] for defect detection on steel surfaces. However, the processing speed significantly restricts its practical application in real-time industrial inspection. In contrast to Fast R-CNN, YOLO is a one-stage method that has a faster processing speed while maintaining similar detection capabilities. Yang et al. [22] proposed the application of YOLOv5 to the field of steel pipe weld defect detection and compared it with Faster R-CNN; YOLOv5 is much faster than Faster R-CNN and has a similar detection accuracy. But, there are difficulties in applying YOLOv5 to the detection of defects. To improve the detection capabilities of the model, Li [23], Yao [24], Chen [25], and Zheng [26] have made improvements to the structure of the model, including changing the network structure, incorporating another model, and adding self attention, and achieved better results.
This article extends the evaluation method for billets based on image detection techniques. By comparing real images and standard charts in the Chinese national standards YB/T 4002-2013 [27], we graded the defects of corresponding billets manually first and then trained a model using the data for an automatic grading based on the YOLOv5 method. In addition, we added CBAM attention to evaluate the billets, improving the accuracy and robustness of the method. This module improves the feature extraction capability of the YOLOv5 backbone network. This helps to minimize information loss during transmission and enhances the ability to detect defects.

2. Methodology

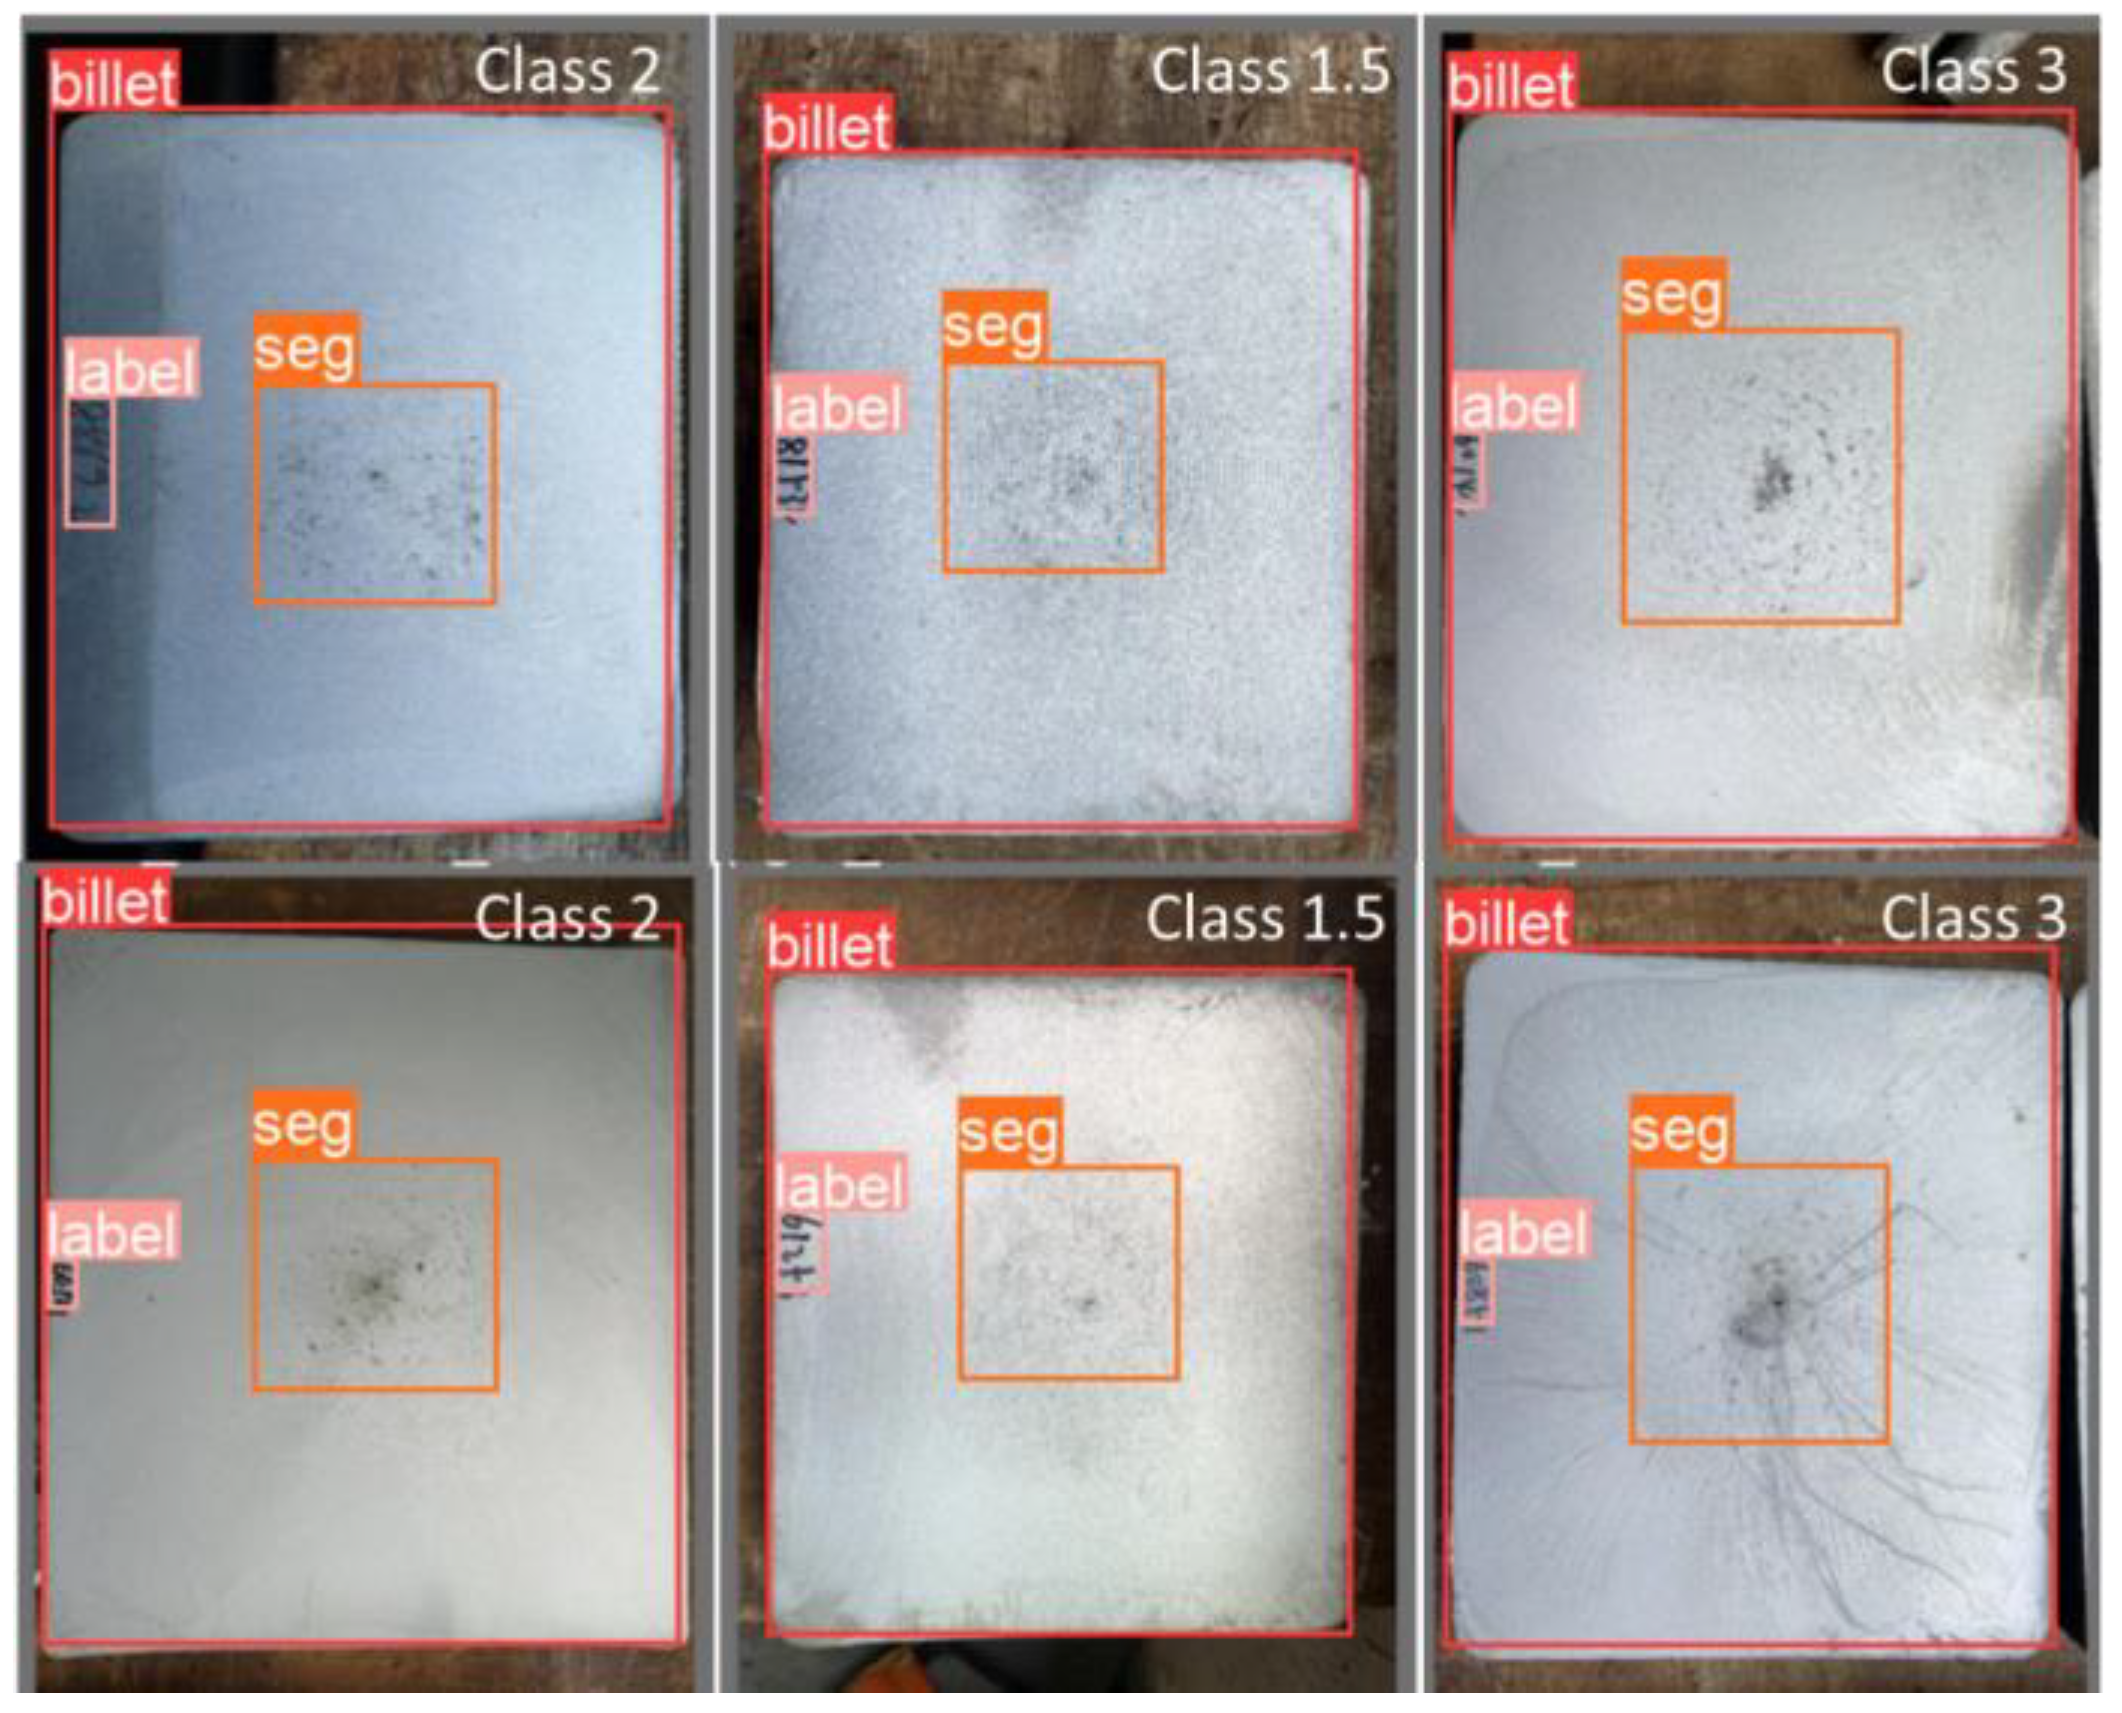
2.1. Evaluation Method

In this study, hot acid was used to etch the billets of rebar steels and bainitic rail steels to obtain the defect area. The Chinese standard YB/T4002-2013 [27] was used to determine the defect level of the billets. When rating the other sizes of billet, the ratio of the defect area and the billet area can be used as the standard of rating since the area and the number of pixels have the same proportional transformation relationship. Therefore, the ratio of the number of pixels contained in the shrink hole to the number of pixels contained in the billet was used as a rating parameter for the defect grade. In actual production, because of the use of a hot acid etching treatment, the segregation after corrosion is often masked by the pot region, which appears as a porous area in the image. On the other hand, the spot itself is caused by segregation, which is the reason we selected the porous region for grading.
In situations where the size of the billet is not provided in the images, a standard reference image is used as a basis for comparison in order to rate defects. The aspect ratio of the generated defect area anchor box and the billet detection anchor box are compared, as illustrated in Figure 1. To achieve precise grading for industrial production, the Lagrange interpolation method is used to determine half-grades. If the defect area ratio falls between two adjacent grades, it is rated as a half-grade, with values ranging from 0, 0.5, 1, 1.5, to 4. The numerical results are as follows in Table 1.

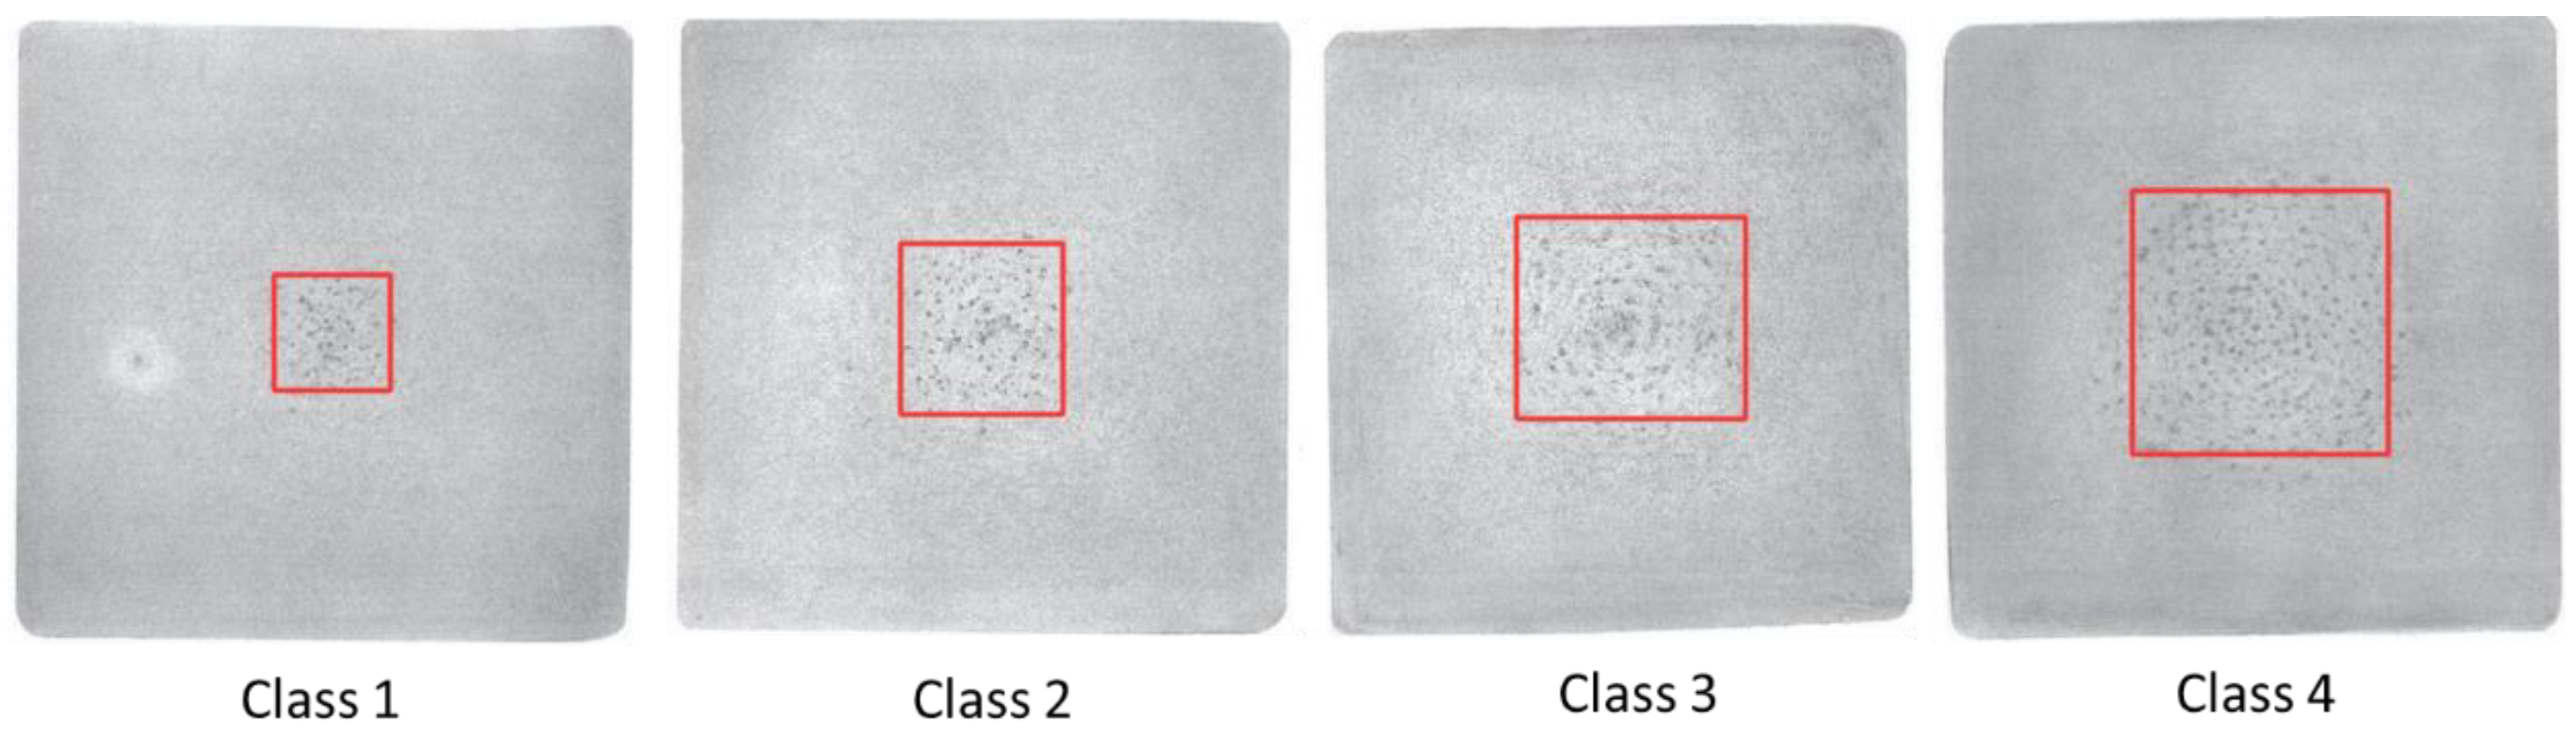
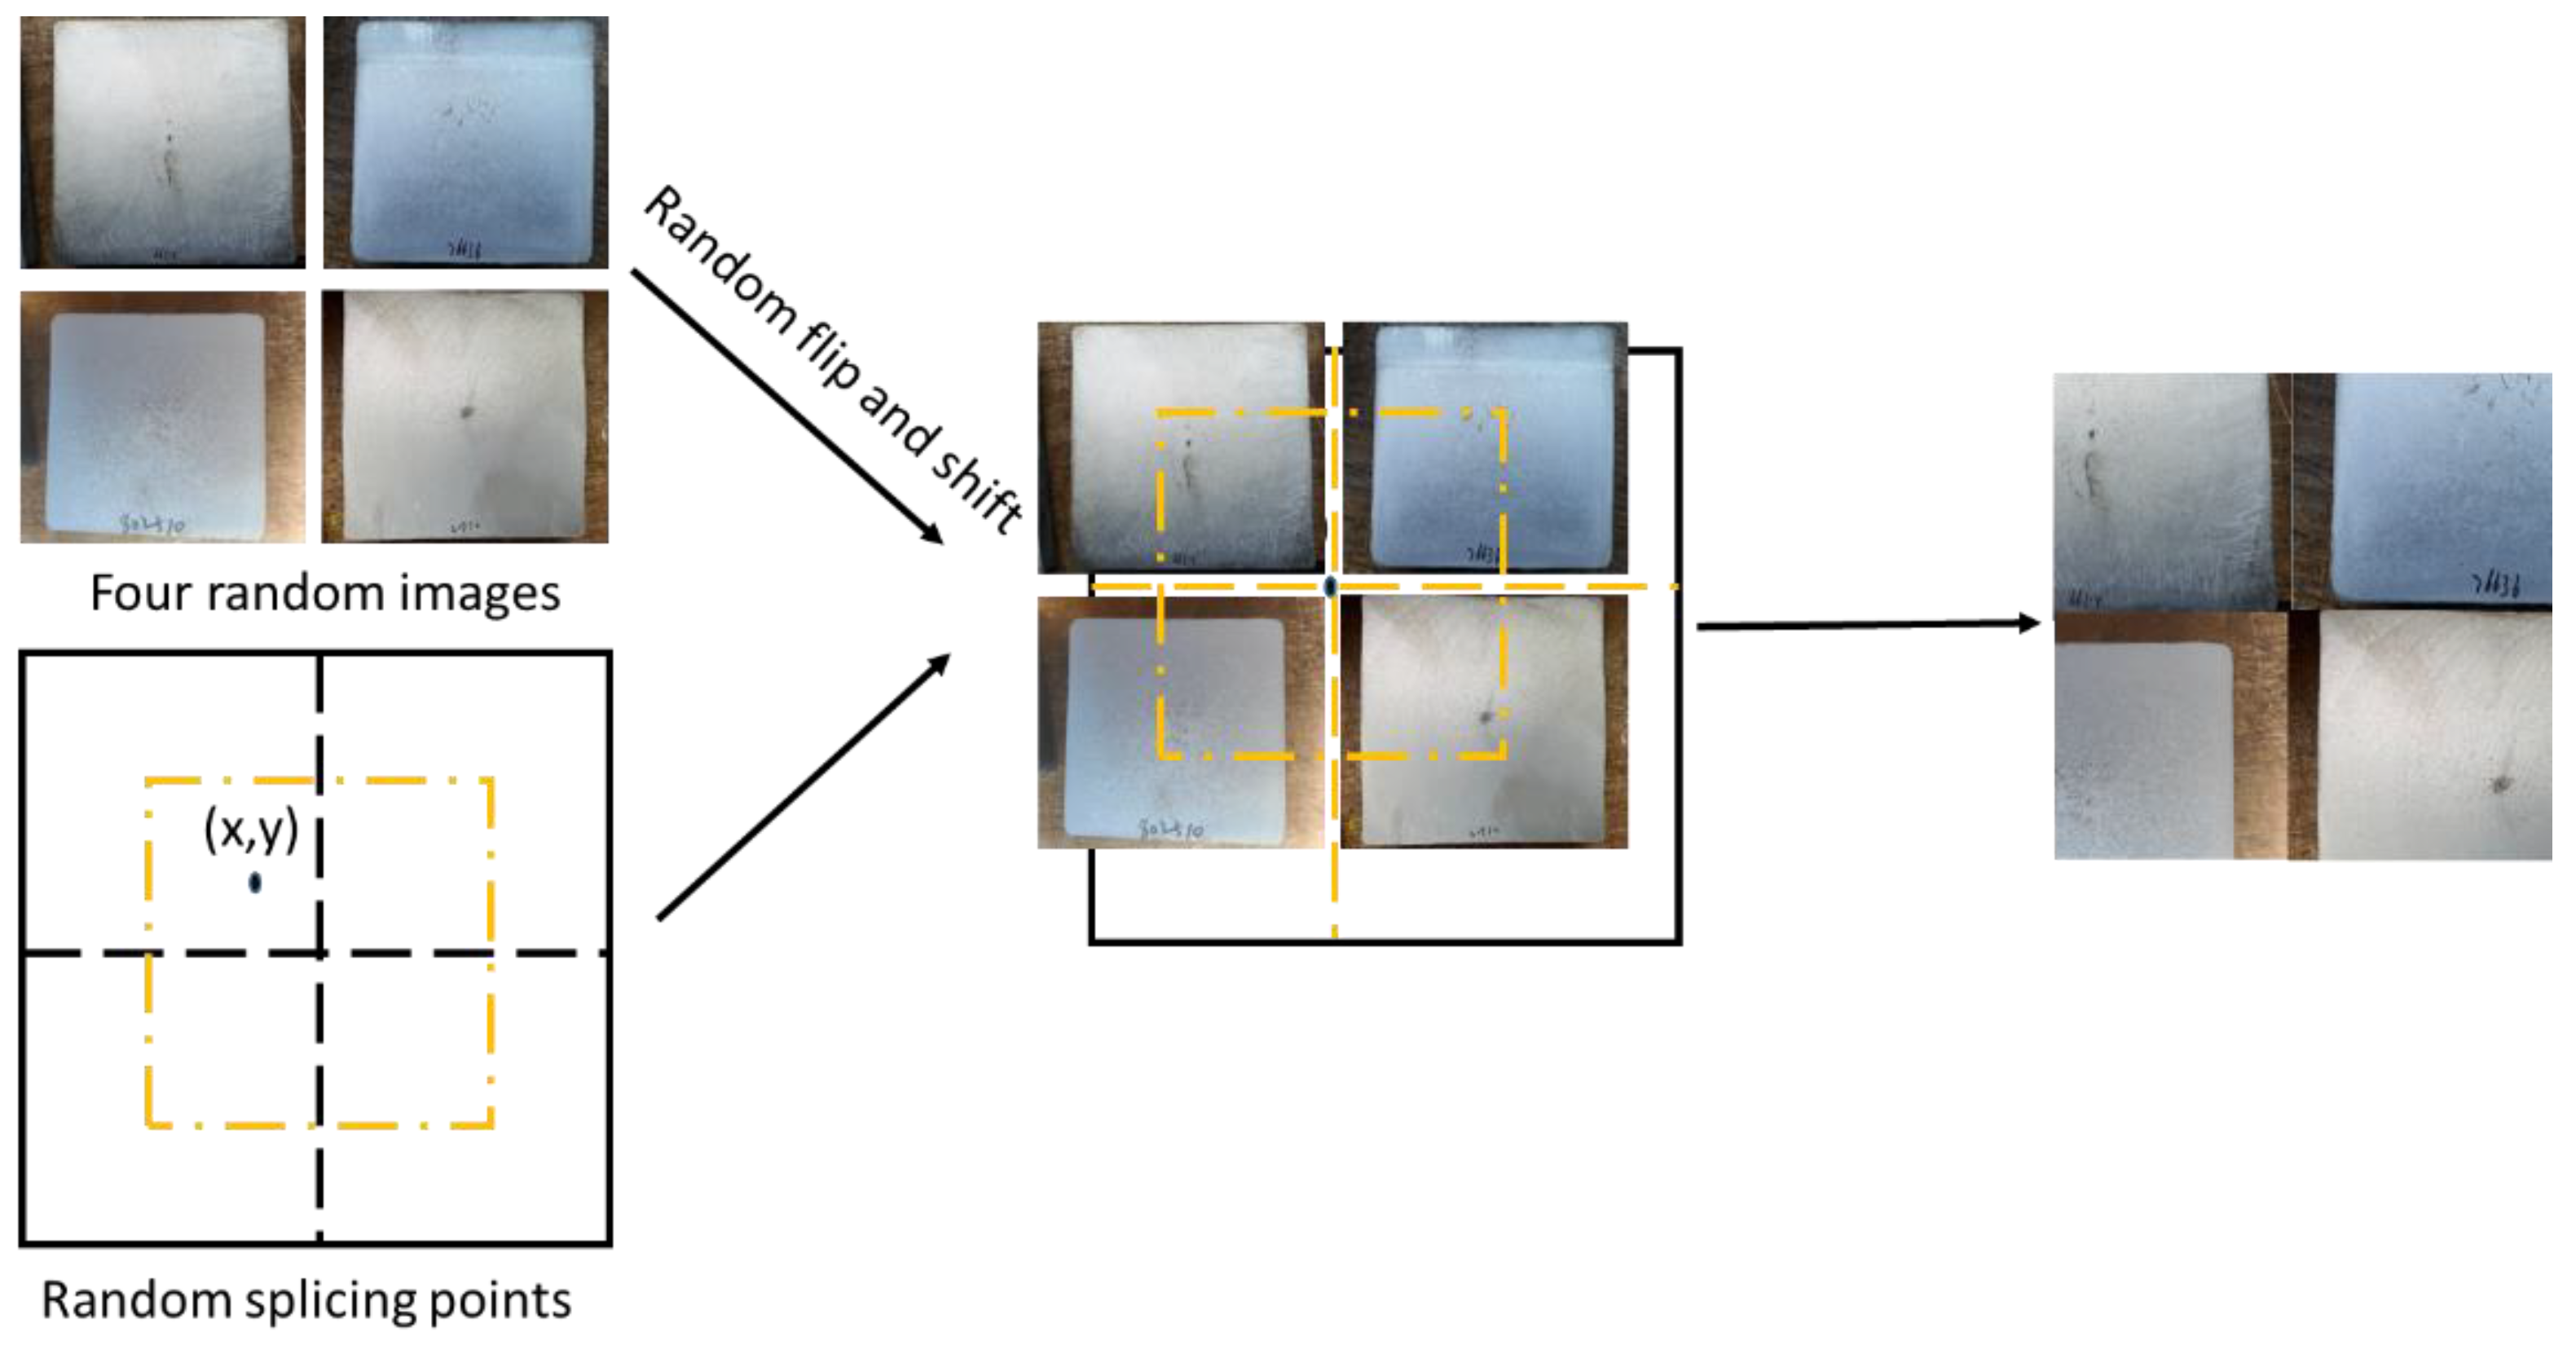
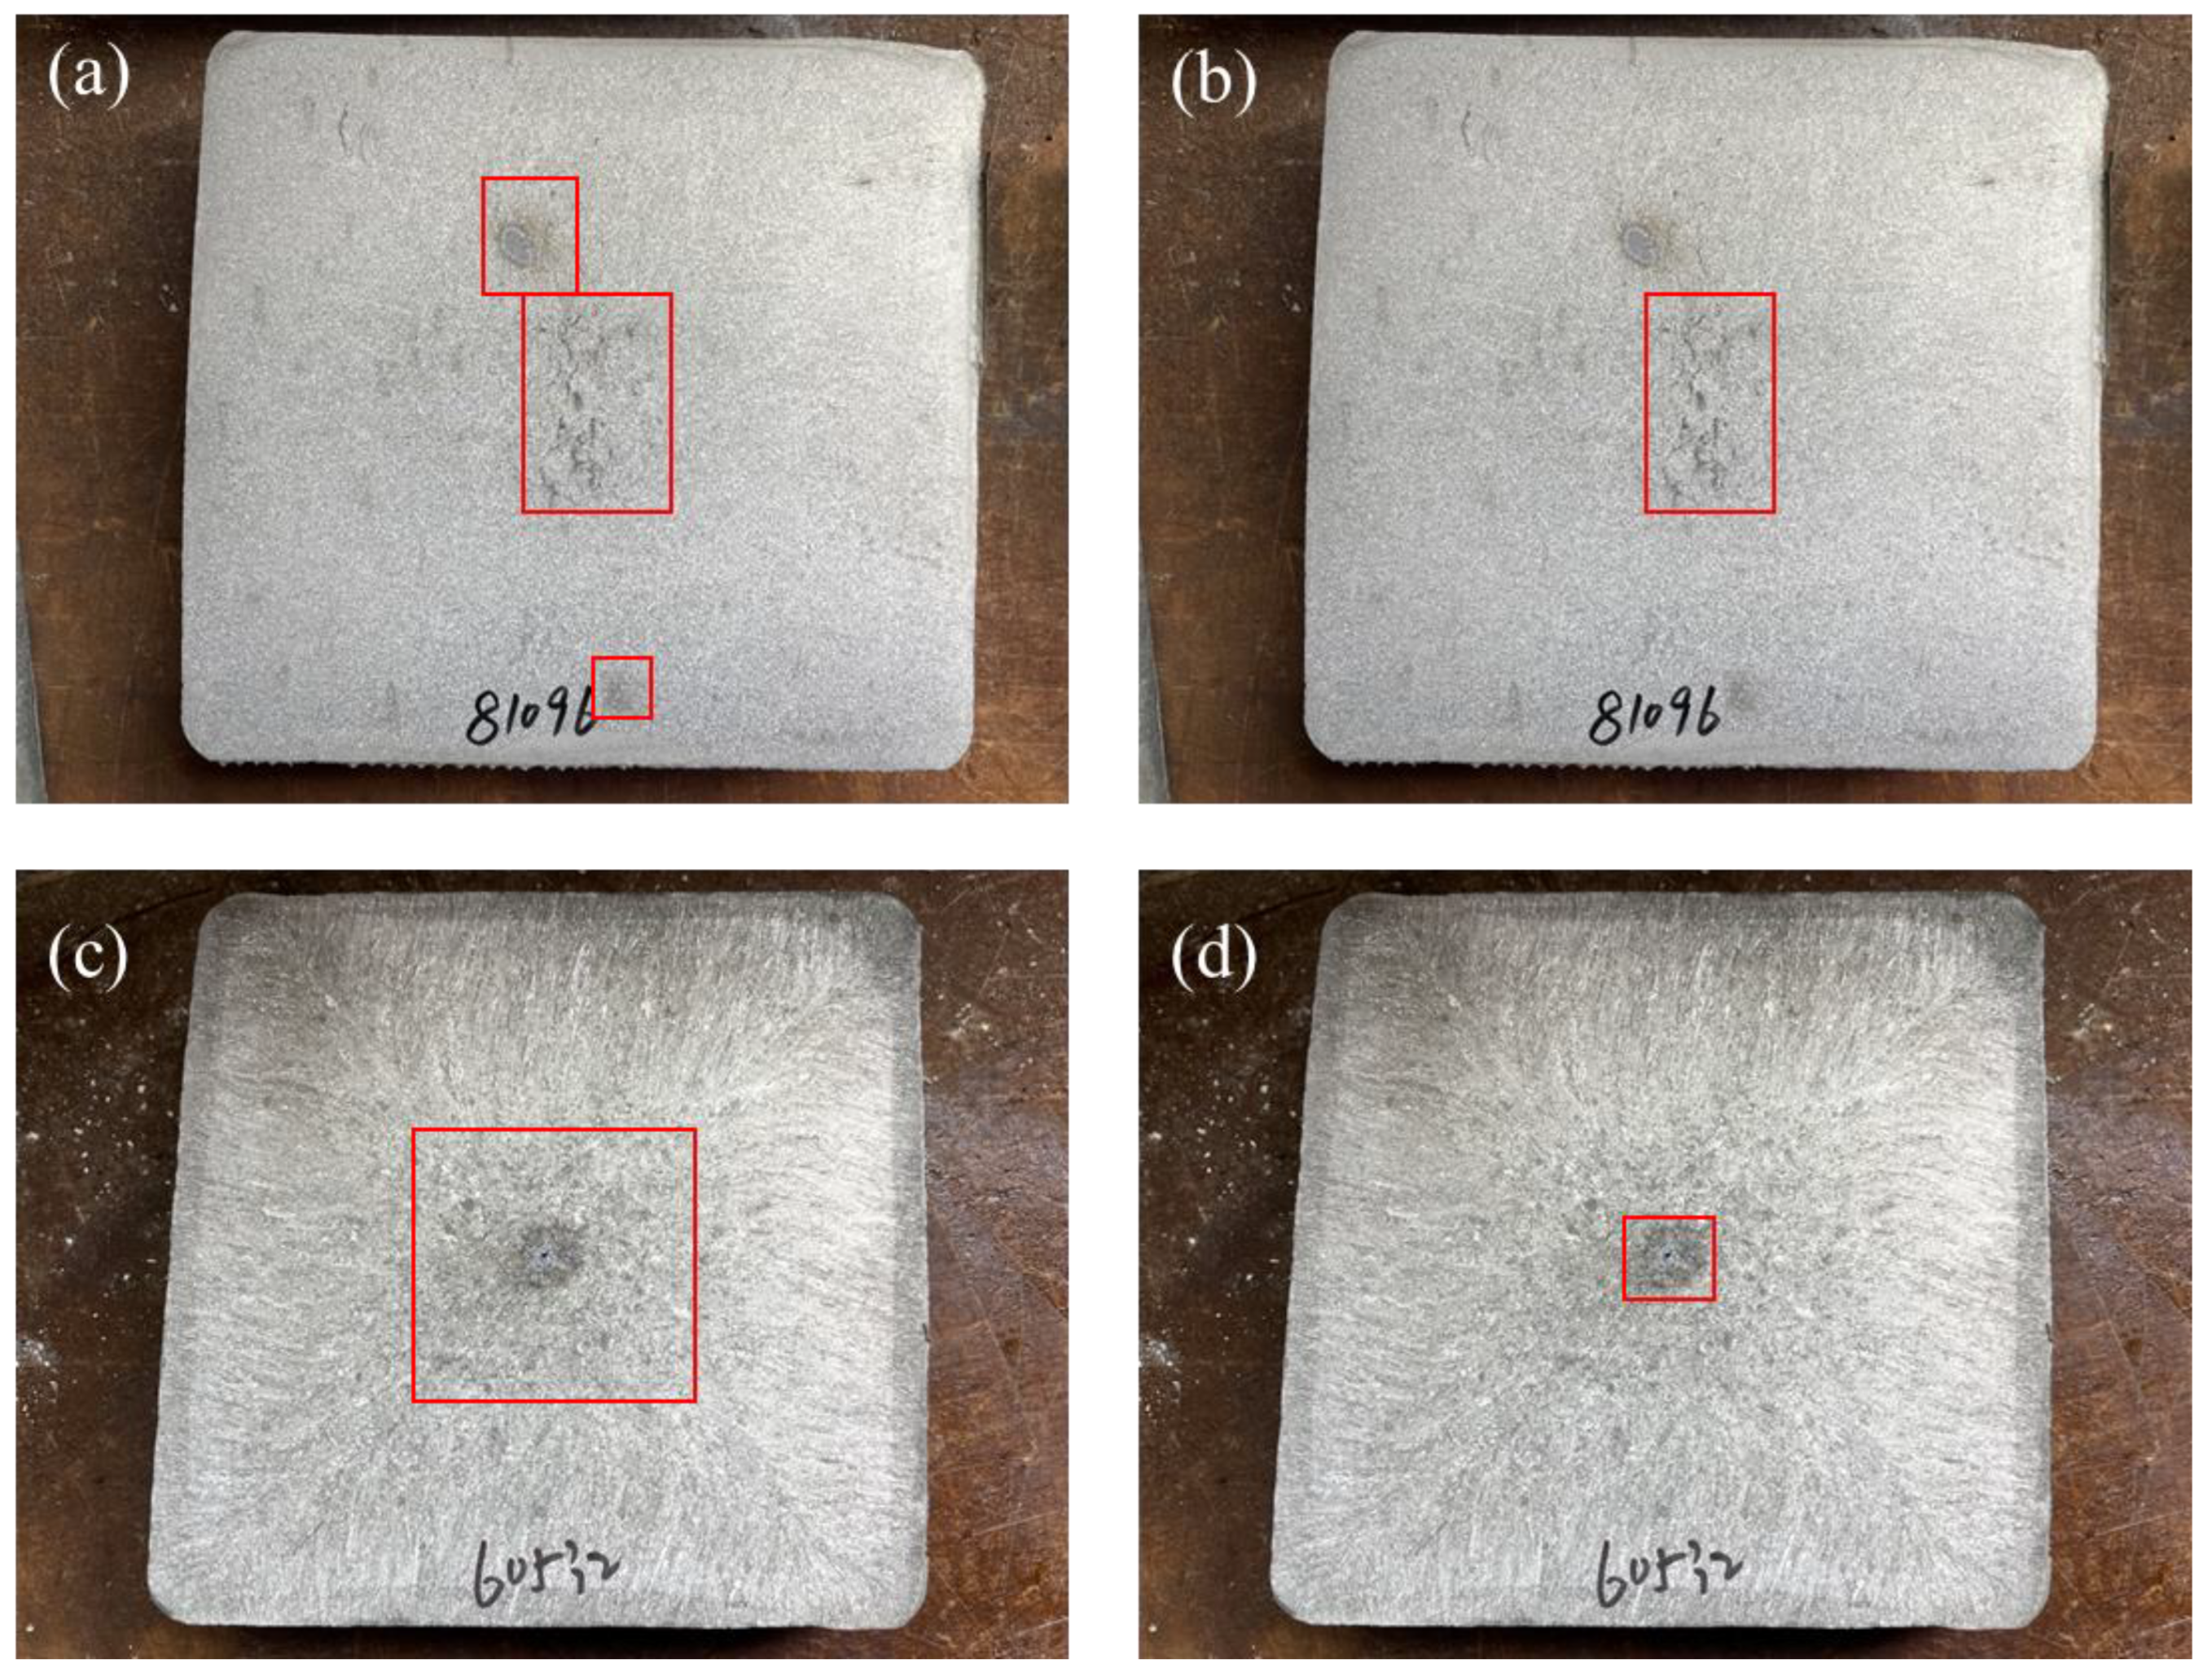
2.2. Data Set of Continuous Cast Billets

The slabs were sampled from an industrial production, and then were completely polished and smoothed. To make this distinction, we use billet to refer to the material used in the experiment. The surface defects of the billets were obtained by hot acid etching: they were immersed in a solution of water and hydrochloric acid AR (about 36%) with a volume ratio of 1:1 and etched at 80 °C for 30 min. Afterwards, they were immediately cleaned with water and dried. A total of 267 images of different billet samples were collected with a resolution of 4096 × 3048. The images were then labeled by the software LabelImg (https://pypi.org/project/labelImg/ (accessed on 17 October 2023), which includes the defect area as a whole and the location of the billets since there is no scale to the images. In order to enrich the background information of the detected target and improve network robustness, the collected images were expanded by data enhancement techniques. Data enhancement methods commonly include image cropping, image scaling, color transformation and flipping, rotation, etc [28]. Cutmix data augmentation [29] takes a portion of the image from the training set and fills the intercepted area with pixel values from other areas in a random manner. Theoretically similar to Cutmix, Mosaic data augmentation [30] selects four images from the training dataset, flips or scales them, changes the brightness, and stitches images together into one image according to randomly selected stitching points. This process is shown in Figure 2. The method inputs four images into the network for training at one time, which enriches the background information and improves the robustness of the network. This process also adds many small targets by random scaling, which enriches the dataset of small targets.
After preprocessing, the images were divided into training data and validation data, with a ratio of 7:3. The training data were used to train the deep neural network, and the validation data were used to evaluate the performance of the model during the training process.

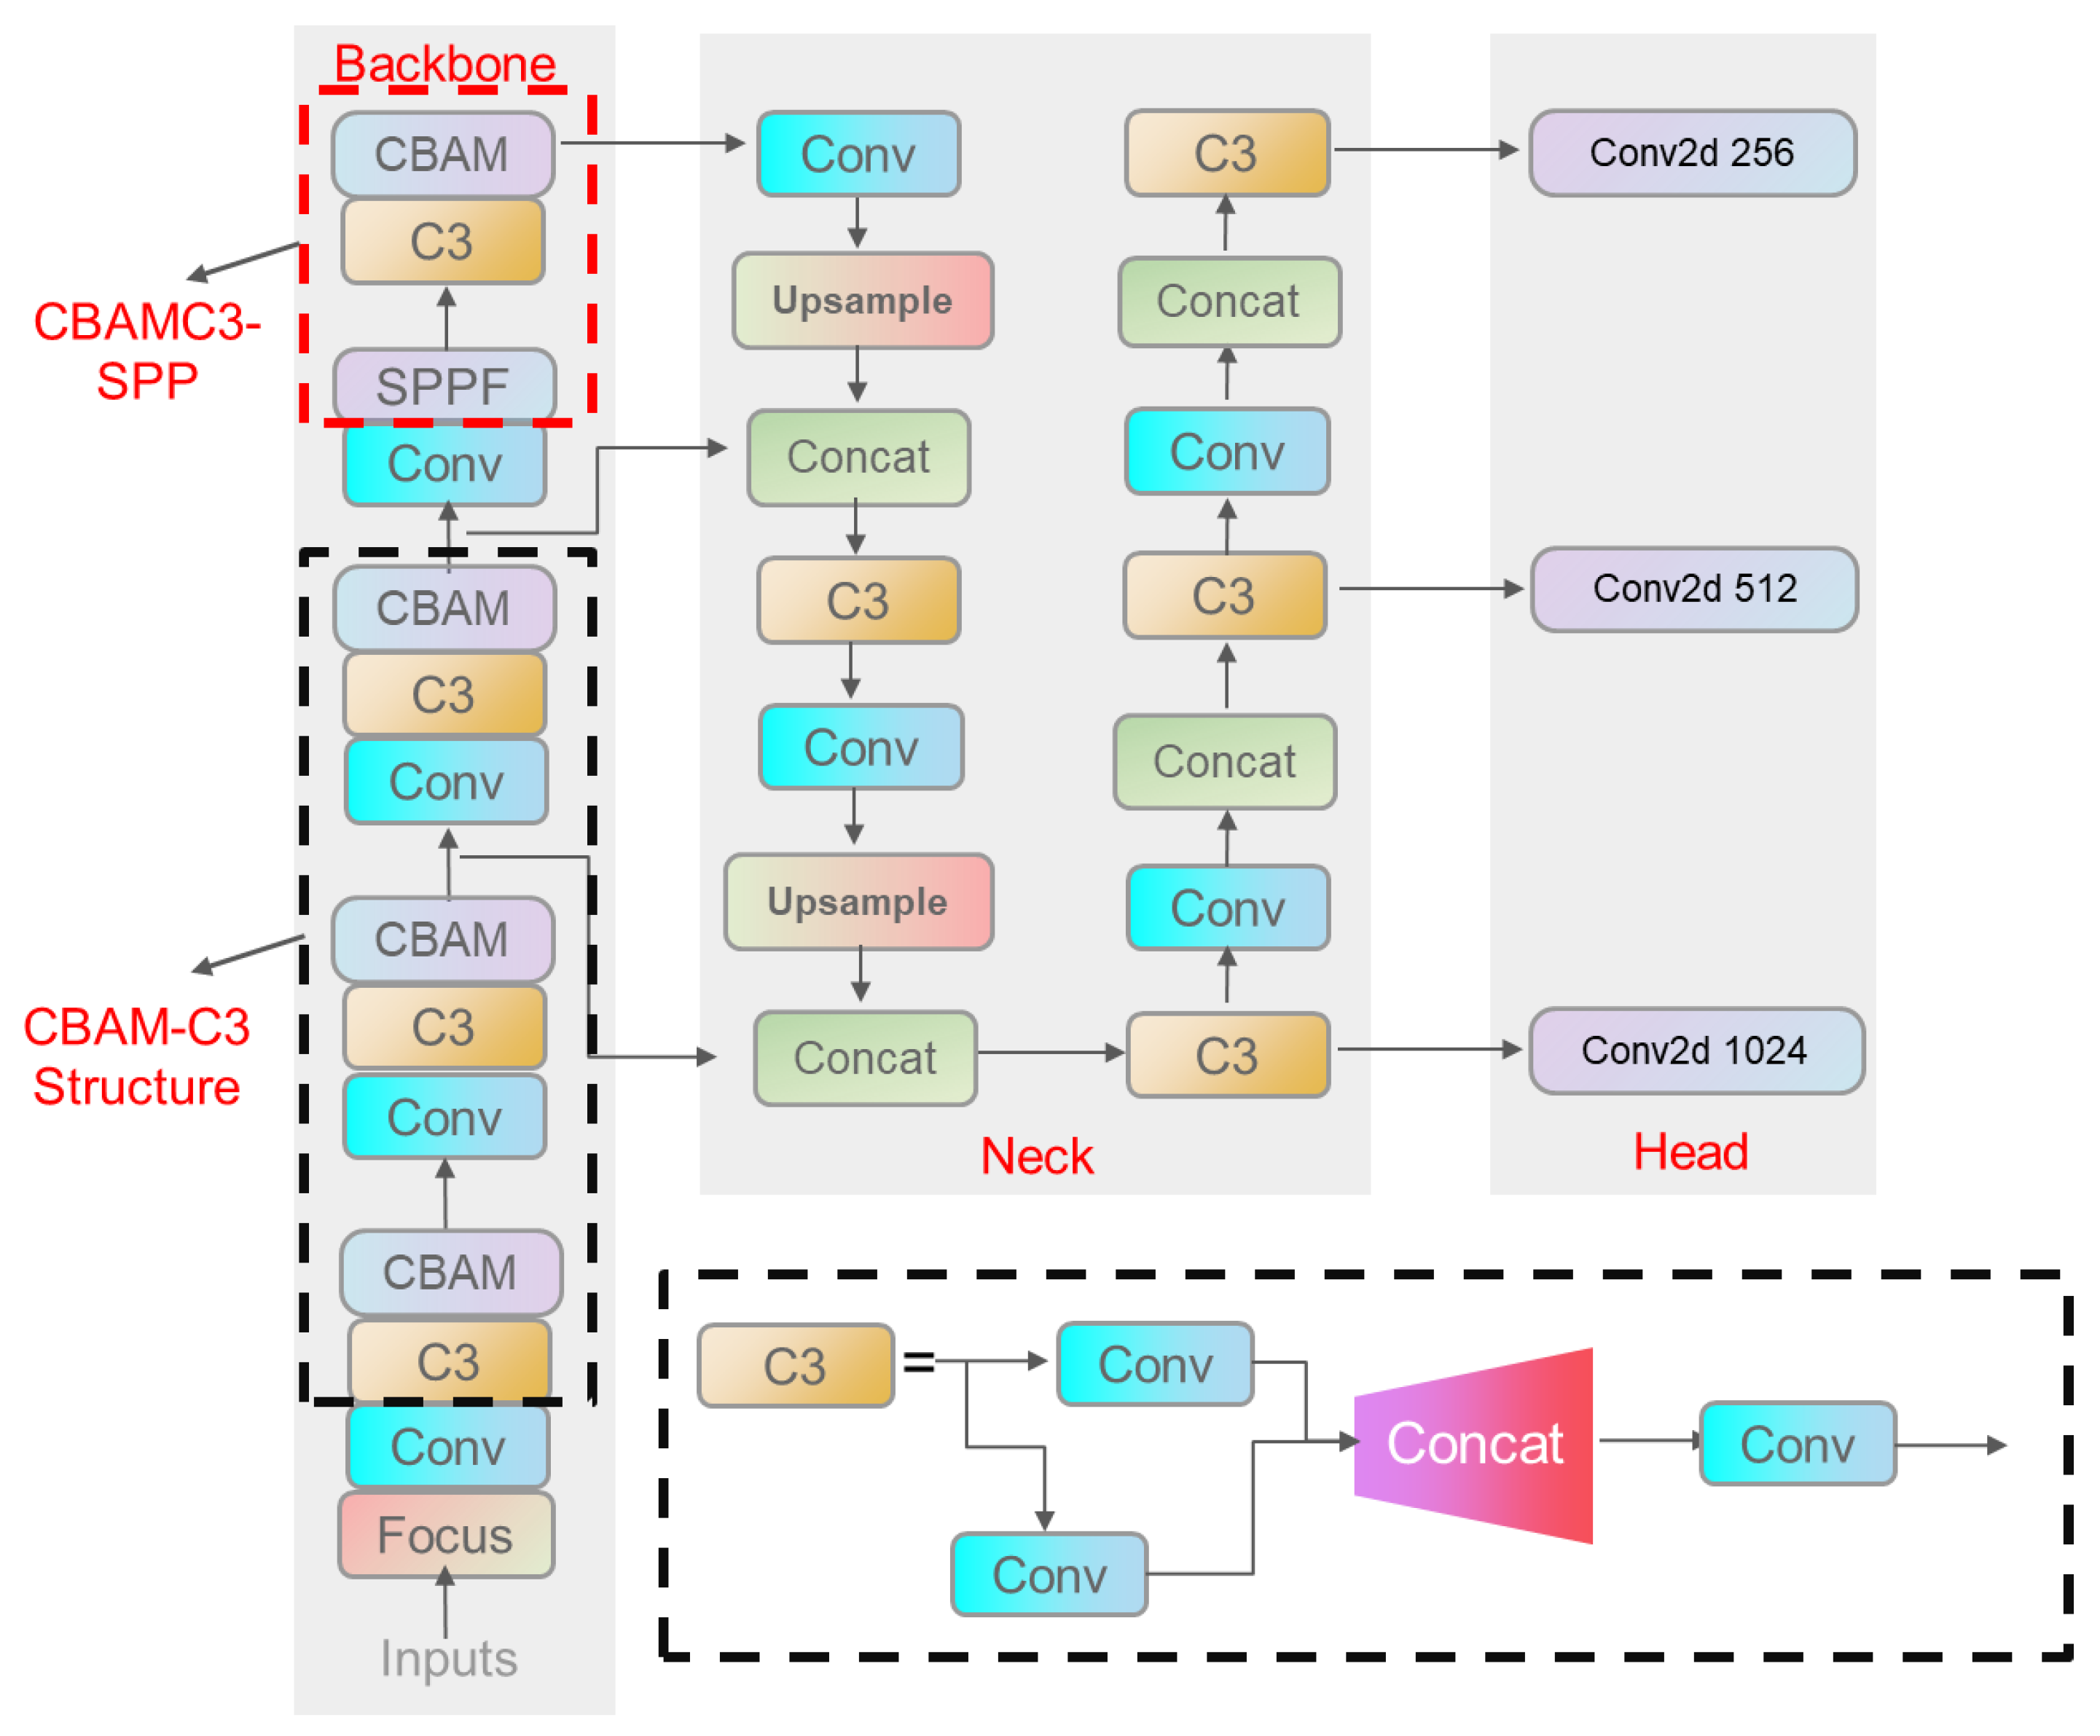
2.3. The YOLOv5 Algorithm

The schematic diagram of the YOLOv5 network architecture is shown in Figure 3, which consists of four parts: the network input, the feature extraction backbone network, the feature fusion neck network, and the network output [31]. The backbone serves as the foundation for understanding the input image’s content, the neck network component further processes and refines feature maps before they are used for object detection, and the output network is used to identify and locate objects within the image.

2.4. Convolutional Block Attention Module
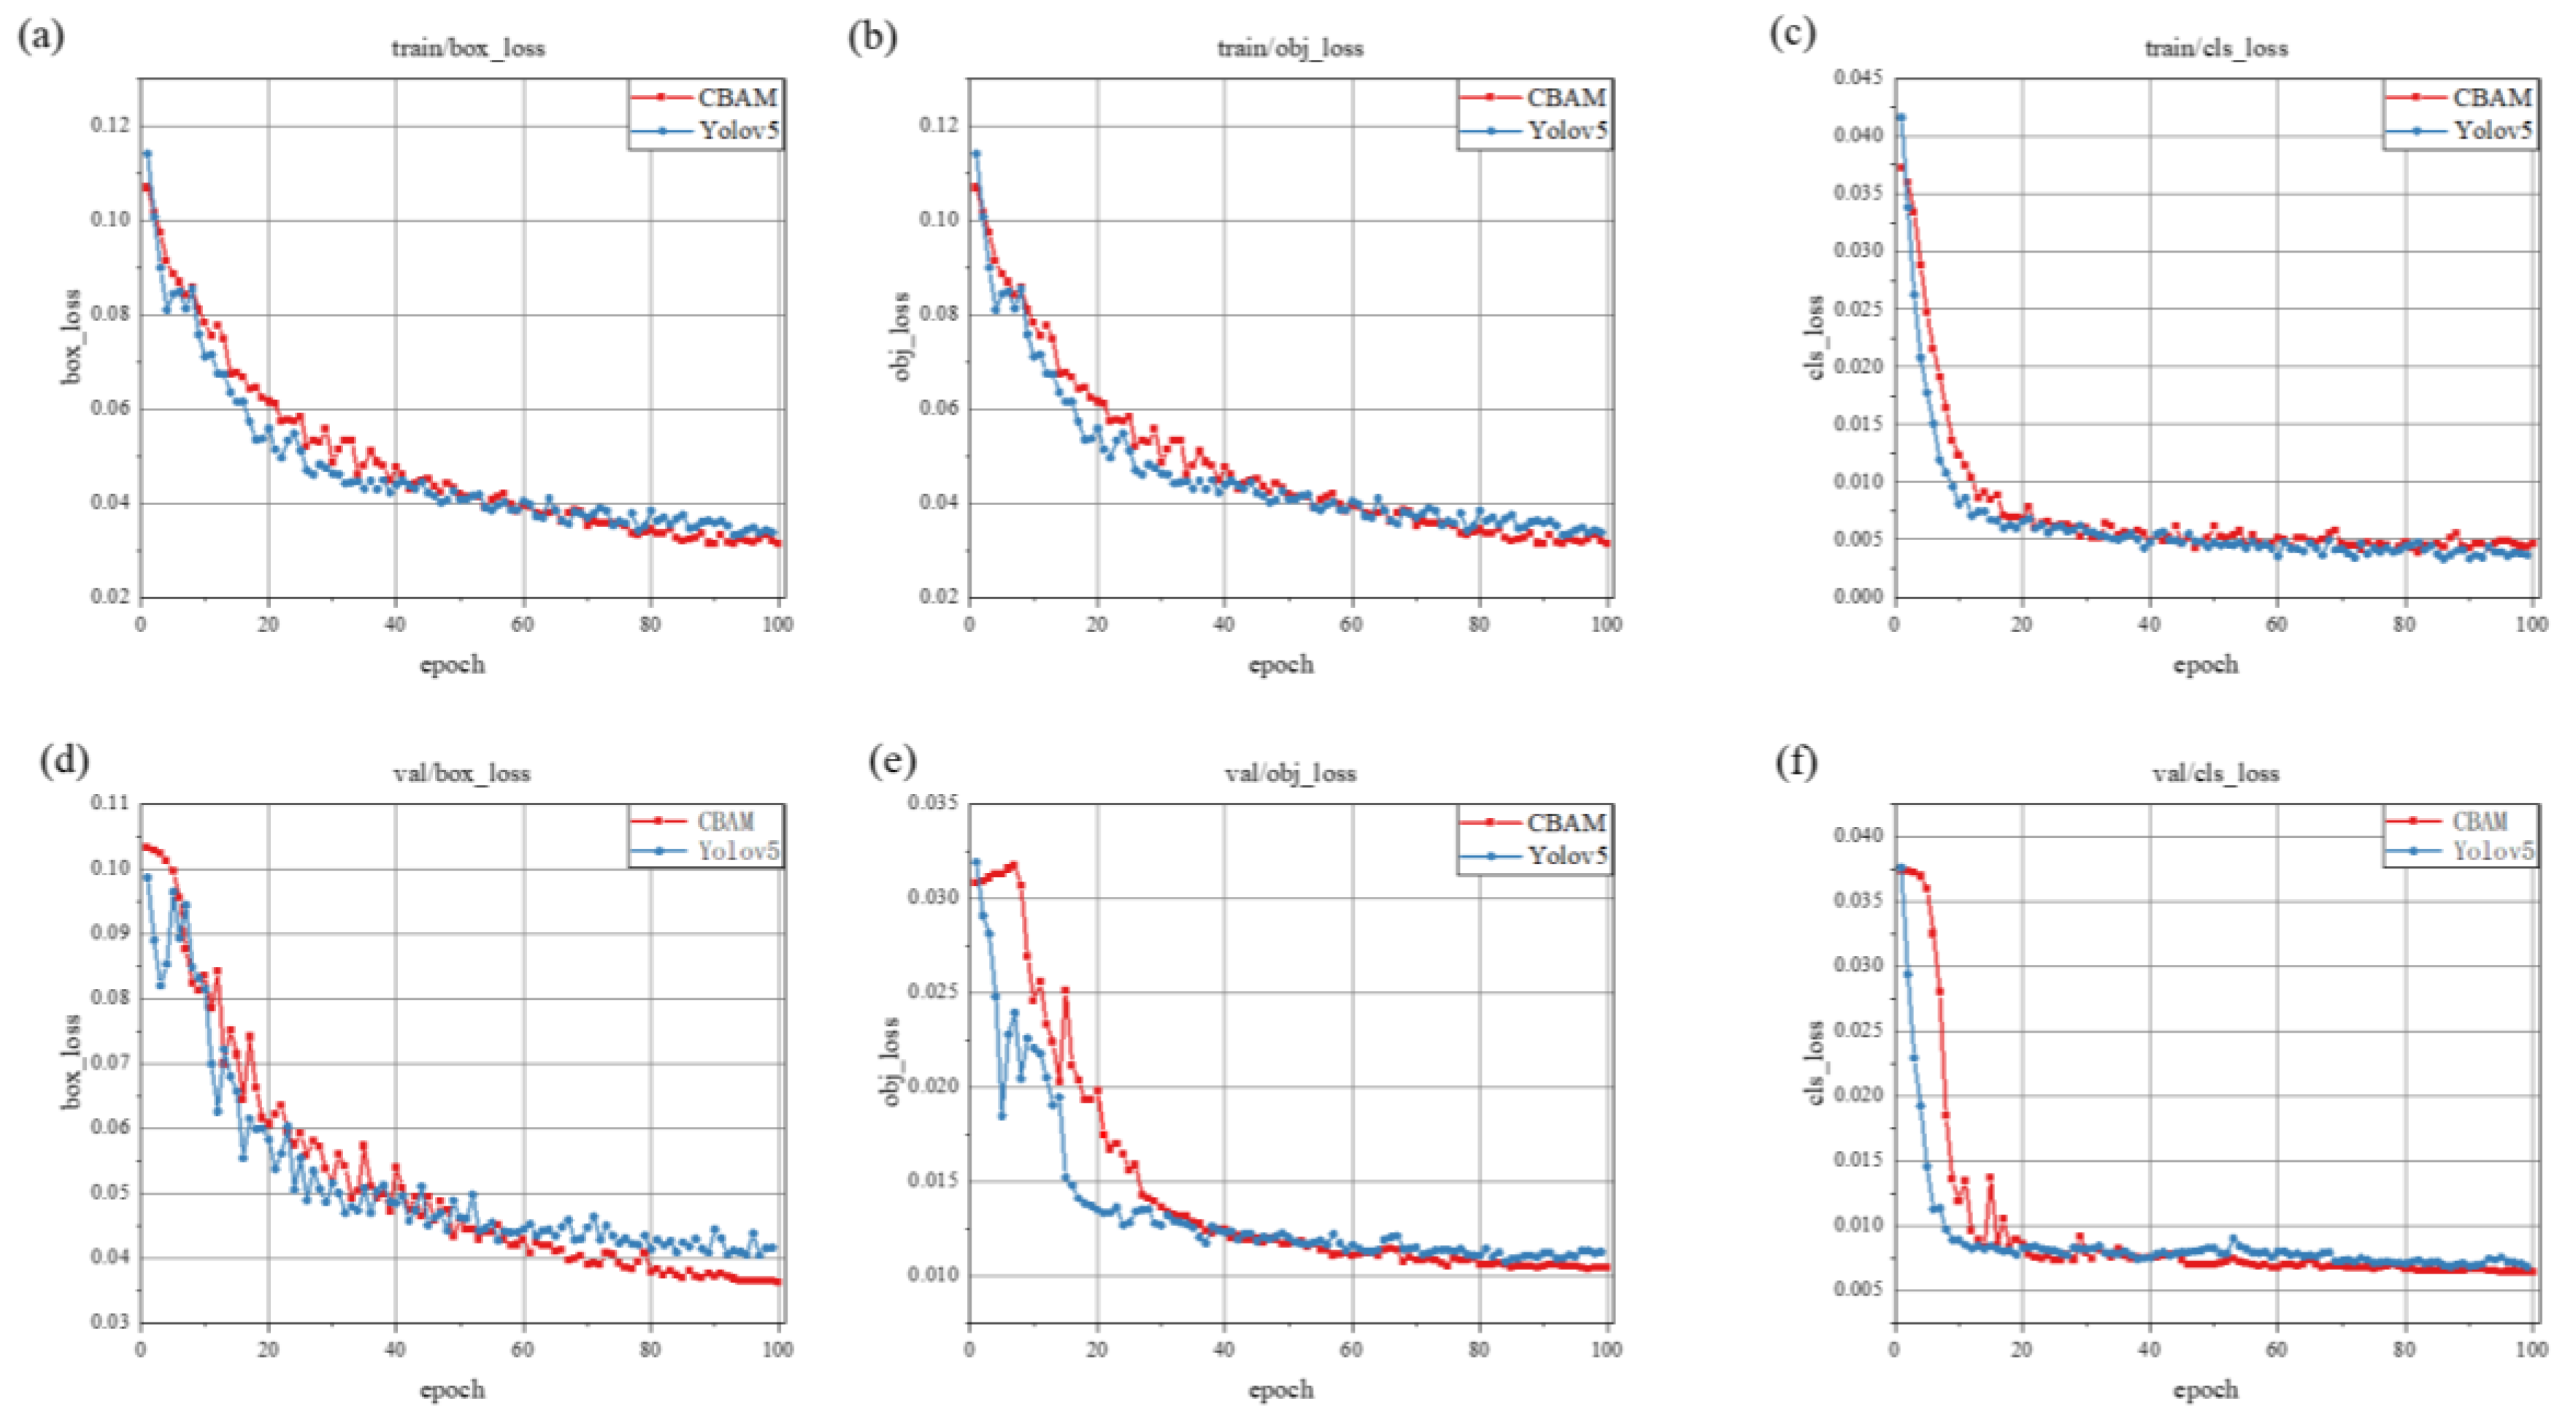
Clausen [32] et al. proposed the Convolutional Block Attention Module (CBAM): a simple and effective attention module for feed-forward convolutional neural networks. It is a lightweight and general-purpose module. It can be seamlessly integrated into any CNN architecture and can be trained end-to-end with the underlying CNN with the structure, as shown in Figure 4. The model structure is modified using CBAM, which is added after each C3 module of the backbone network to better fuse channel and spatial information, focus on defective targets, and improve network detection, especially for different bias points, in addition to improving the feature pyramid. The feature map after the fourth down-sampling of the backbone network is injected into the feature pyramid through the CBAM module to improve the perceptual field of the target and reduce the information loss in the fusion process, as Figure 5 shows.
The convolutional neural network is responsible for performing down-sampling operations that increase the number of channels while reducing the width and height of the input objects. To further enhance the ability to capture and utilize important information, channel attention can be applied. Channel attention allows the network to determine the importance of different channels and combine them in a weighted manner to emphasize the most informative channels. Channel attention calculates the weight of each channel M c R c × 1 × 1 according to the equation:
M c F = σ ( W 1 W 2 F a v g c + W 1 W 2 F m a x c )
The input feature map F has dimensions of R c × H × W , where c is the number of channels and H and W are the height and width of the feature map, F a v g c and F m a x c are the feature maps W1 and W2 after average pooling and maximum pooling, respectively, which represent the two-layer weights of multilayer perception, and σ is the sigmoid activation function.
Then, the feature map after channel attention is passed through a spatial attention mechanism. This involves applying average pooling and maximum pooling operations to the channel-attended feature map, resulting in two new feature maps. These two feature maps are then concatenated and passed through a 7 × 7 convolutional layer to obtain a final feature map and, finally, the final feature map is output by sigmoid activation function. The spatial attention is shown in Equation (2):
M s F = σ ( f 7 × 7 ( [ F a v g s ; F a v g s ] ) )
where f 7 × 7 denotes the convolution operation with a filter size of seven.

2.5. Loss Function

The purpose of loss function is to evaluate the similarity between the predicted output of a neural network and the intended output. The smaller the value of loss function, the closer the predicted output is to the desired output. In this study, cross-entropy loss is used as the classification loss. The overall loss function is a weighted sum of the position loss, confidence loss, and classification loss, which is used to guide the network optimization process and update the network parameters. The optimization process continues until the value of the loss function reaches the minimum. At this point, the network has learned the mapping relationship between the input and output and can accurately detect the defect in the cast billet images. The classification loss represents the probability of belonging to a certain category, where the location loss Lbox is defined as [33]:
L b o x = 1 I o U + ρ 2 A , B c 2 + α v
where I o U (Intersection over Union) is the intersection of the prediction box and the real box in series, and the larger the I o U , the closer the actual prediction.
ρ is the Euclidean distance between the coordinates of the center point of the detection box A and the prediction box B. c is the diagonal distance of the minimum box surrounding them; α is the weight; υ is used to measure the consistency of the aspect ratio between A and B. I o U is defined as (4) and I o U is illustrated as shown in Figure 6.
I o U = A B A B
where A is the real box, B is the prediction box, A     B is the intersection, and A     B is the union of A and B; α and v are defined as:
α = v 1 I O U + v
v = 4 π 2 a r c t a n w B h B a r c t a n w h 2
The classification loss and confidence loss in this study both use the binary cross-entropy loss function, which is defined as follows:
L c l s = L o b j = 1 n   y n × ln x n + 1 y n × ln 1 x n
where n is the total number of bounding boxes or detection anchors, y n is the target value, and x n is the predicted confidence score for the nth bounding box. This score represents the model’s confidence in detecting an object within that box. The classification loss and confidence loss guide the training process to improve the model’s ability to classify objects correctly and predict confidence scores accurately for each bounding box.
To validate the performance of the CBAM-YOLOv5 detection model, the mean accuracy (mAP), precision (P), and recall (R) were used. Accuracy is the ratio of accurately identified positive classes to all predicted positive classes, and recall is the ratio of correctly identified positive classes to all positive classes, which are defined as
P = T P F P + N P
R = T P F N + N P
where TP is the correctly identified defect, FP is the defect of the identified background, and FN is the unidentifiable defect.
The mAP is defined as
A P = 0 1 P r d r
m A P = 1 k i = 1 k A P ( i )
where AP contains the area of the P-R curve surrounded by precision and recall, and mAP indicates the network model detection performance of the AP average for each category measure.

3. Results and Discussion

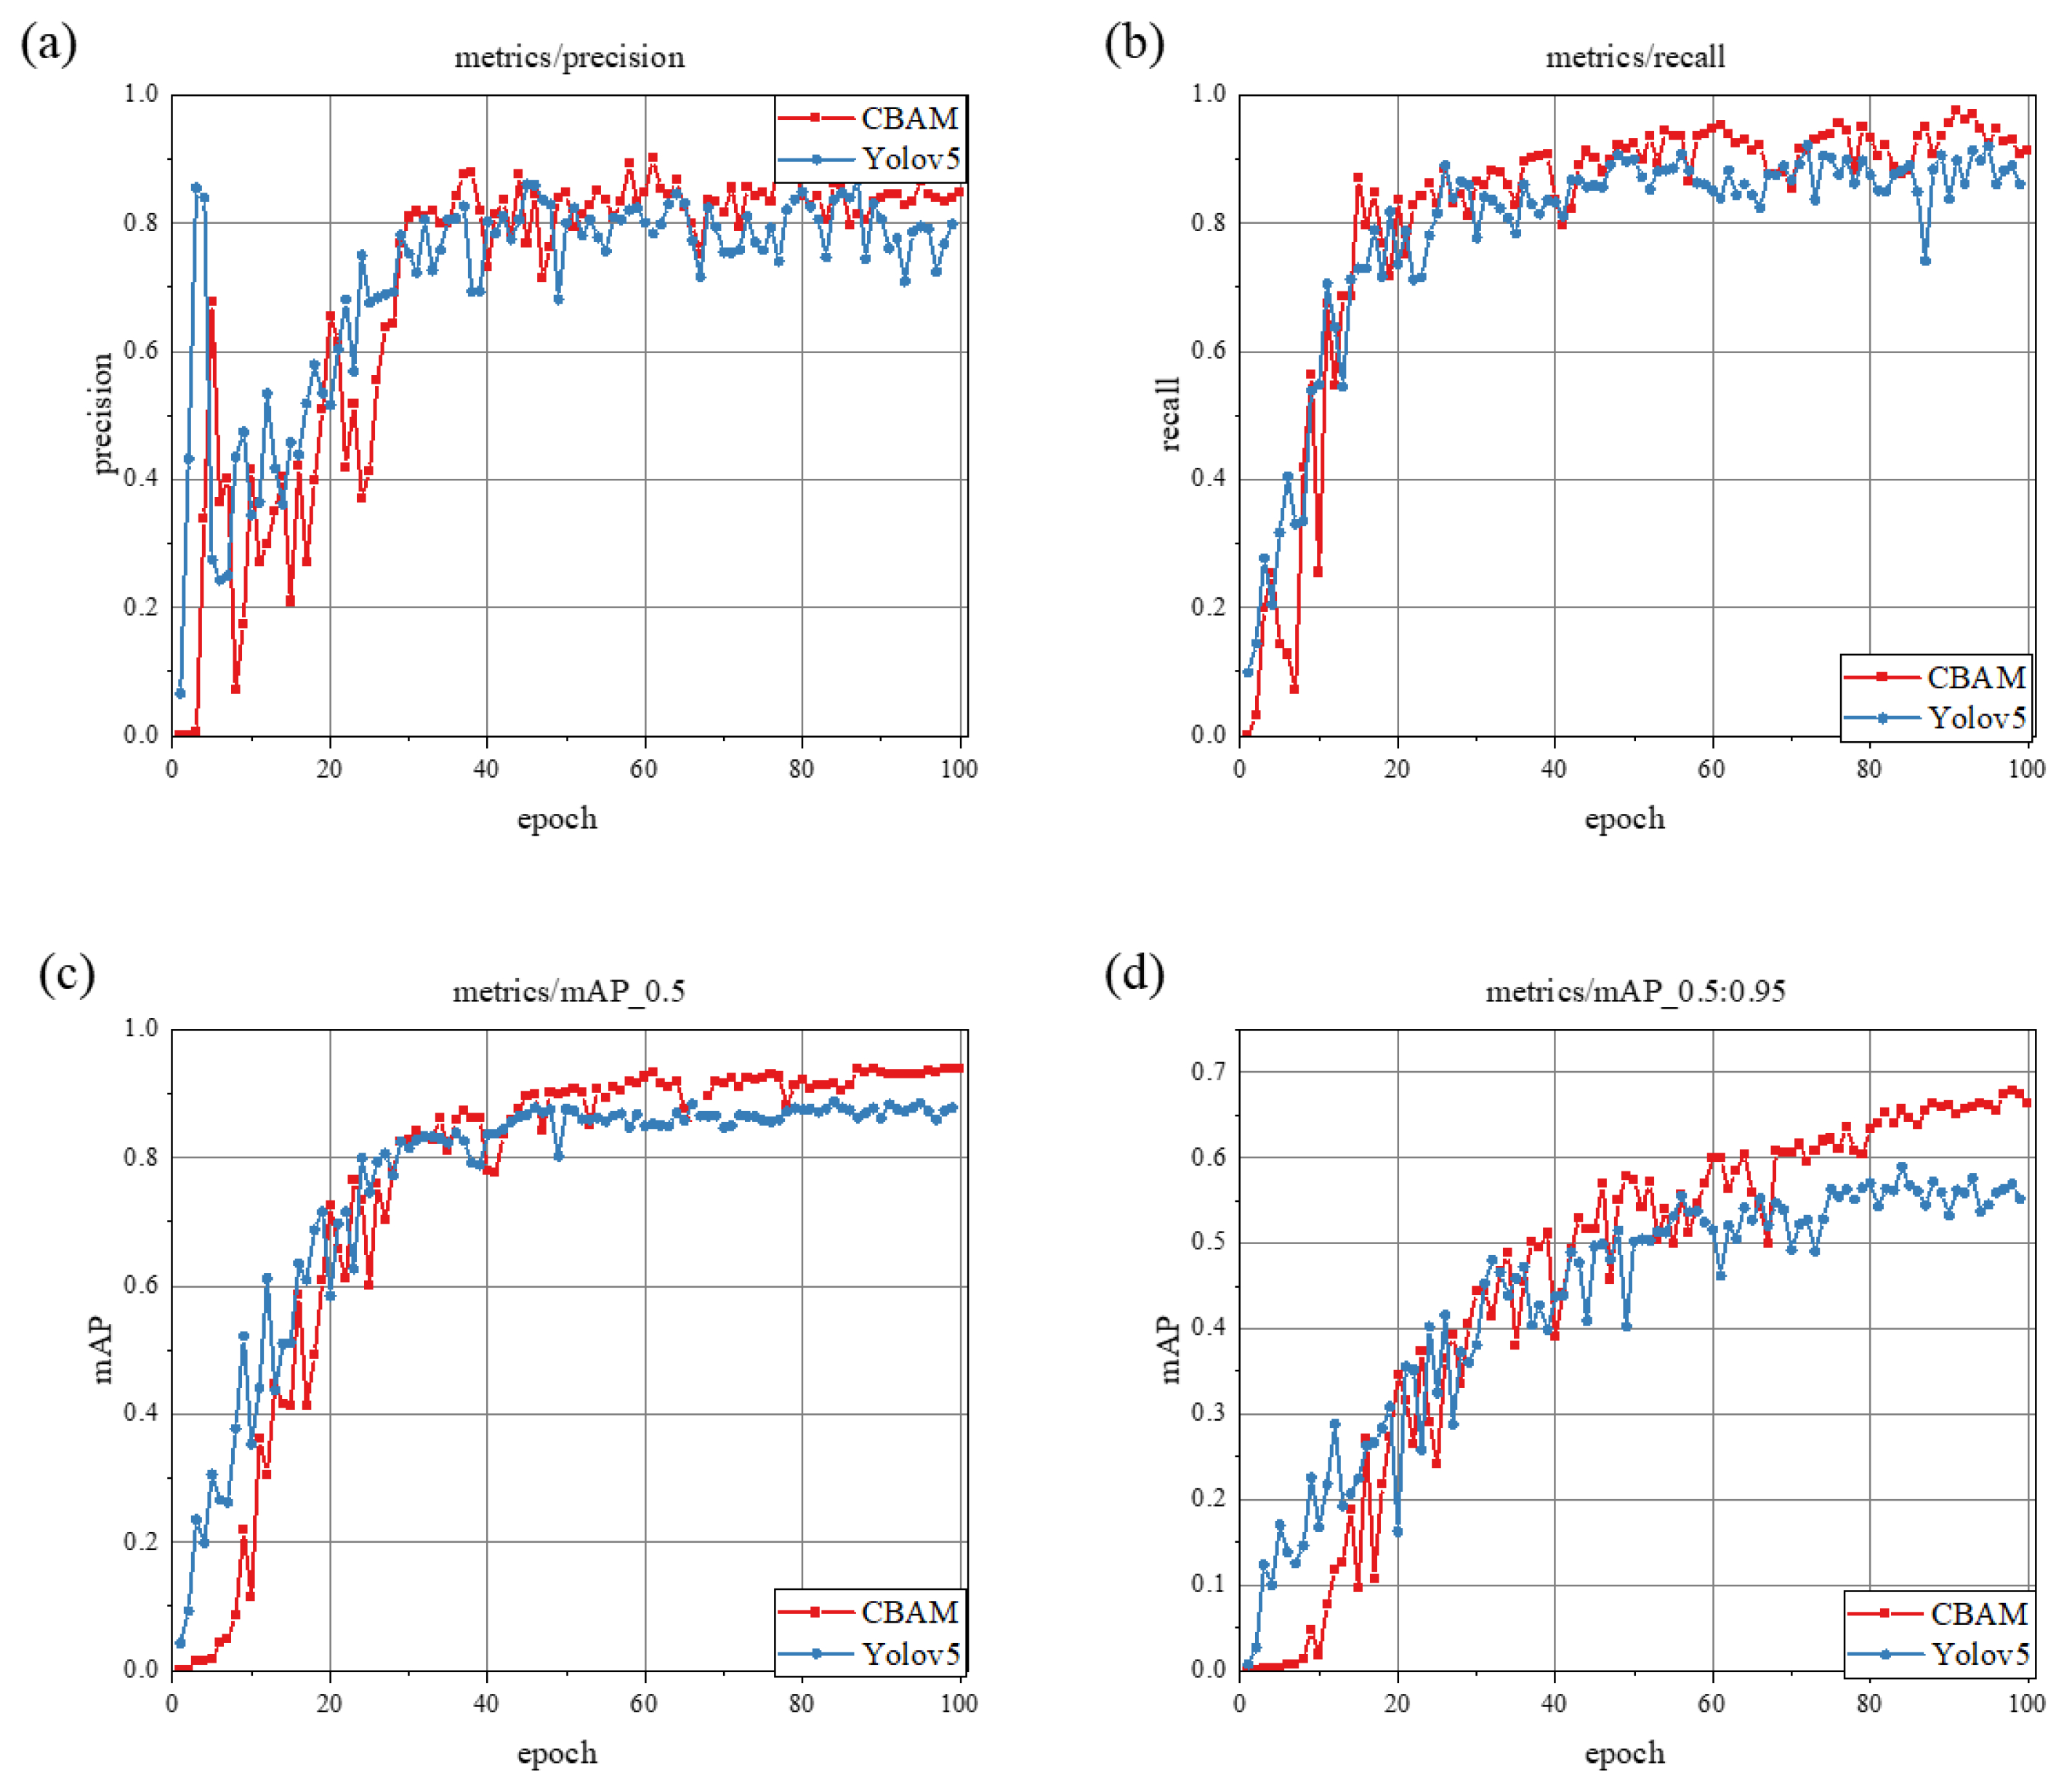
3.1. Comparison Results of Different Attention Modules

To further explore the effect of introducing CBAM in YOLOv5, we introduced different attention modules in the neck of YOLOv5, such as Efficient-Channel-Attention (ECA), Coordinate-Attention (CA), and Squeeze-and-Excitation (SE). The experimental results are shown in Table 2.
In view of the complex and gradual backgrounds of defects and the fact that defect sizes and types can be different, for fast generation in industrial environments, some scratches and dirty spots are also easily recognized as defect features. Therefore, a CBAM-YOLOv5 defect detection network based on YOLOv5 is proposed by combining the optical properties of cast images, defect imaging characteristics, and detection requirements to achieve more efficient identification.
Moreover, two improvements were made to YOLOv5, and ablation experiments were conducted to evaluate the impact of each improvement and their combination. The experimental results are presented in Table 3. The mAP of the original YOLOv5 model is the lowest (84.1%), which does not meet detection requirements. However, after incorporating the CBAM attention module, the mAP increased to 91.0%, indicating that the CBAM attention improved the detection capability for defects. When the CBAMC3 module was added after SPP, the mAP was 92.3% alone, while the combination of SPP channels and the CBAM spatial attention produced a mAP of 93.7%, suggesting that the combination of the two enhancements significantly improved the detection of defects. This improvement was achieved through better feature representation and feature fusion. The combination of the two enhancements improved feature extraction by the backbone network, incorporated more semantic information into the pyramid layer during feature fusion, and reduced information loss during transmission.
Compared to the other attention modules, we found that the best performance was achieved by introducing the CBAM module in YOLOv5. Specifically, the two CBAM-YOLOv5’s reached 91.06% and 90.02%, respectively, which were 1.32% and 1.19% higher than the worst model (YOLOv5-ECA). Thus, we improved the performance of the model by introducing the CBAM attention mechanism.
The loss of the model during the training process, shown in Figure 7a–c, shows the training loss of the original YOLOv5s model. Figure 7d–f shows the training loss using the improved CBAM-YOLOv5 model. The loss curve represents the model’s performance during training iterations. It should show a gradual decrease in the loss over time. When the loss plateaus, it suggests that the model has reached a stable state. Models that exhibit a rapid descent and achieve lower final loss values are generally preferred. In the initial stage of training, the loss decreases rapidly due to the high learning rate of the model. When the training rounds exceed 50 rounds, the confidence loss of the original model starts to improve on the test set and overfitting occurs, and the rest of the losses fluctuate less. And, the improved model gradually stabilizes the loss curve after 80 training rounds, and the model works better.
Figure 8 shows the accuracy. As recall increases, the number of training rounds increases. At the time of stabilization, the mAP of the original YOLOv5s model is 84.1%, while the mAP of the improved CBAM-YOLOv5 model is 93.7%, with an accuracy improvement of 9.6%.
The performance of the deep learning model is affected by different training parameters, including the input image size, period, batch size, learning rate, and the optimizer used. In addition, different confidence thresholds are set and tested when the learning rate is 0.01 and 0.01. In addition, different confidence thresholds were set and it was tested that the learning rate was better when it was 0.01. A confidence threshold of 0.5 was chosen as the parameter for the model detection experiments. In order to verify whether the above parameters are optimal, the improved CBAM-YOLOv5 was tested several times based on the self-built continuous casting billet defect data set, and the above parameters were adjusted to observe the performance changes. The experimental results are shown in Table 4.
In our experiments, we found that the variation in the loss function tends to stabilize as the period approaches 100. Thus, the rounds are set to 100 in this paper. Table 4 shows that Exp5 has the highest mAP, which also validates the settings of the experimental parameters in this paper.
In industrial production, the surface of the billets is often not entirely ideal and may contain dirt spots or complex backgrounds. Figure 9 demonstrates the recognition performance of the YOLOv5 model and the CBAM-YOLOv5 model on complex backgrounds and dirty spots. The CBAM incorporates a feature called Channel Attention, which dynamically re-weights the importance of different channels in the network, allowing the model to focus on defect features. In addition, the CBAM integrates Spatial Attention, which emphasizes important spatial regions within an image. This enables the model to suppress irrelevant background information and concentrate on the defect regions. By attending to specific spatial regions, the model becomes more robust in the presence of complex backgrounds.
In contrast to Figure 8a,b, the original YOLOv5 model classifies dirty spots as defects and marks them, while the CBAM-YOLOv5 model extracts defect features to distinguish them from dirty spots. Figure 8c,d compares the performance of the models in complex environments, and the cbam-YOLOv5 model exhibits superior detection capabilities compared to the original model.

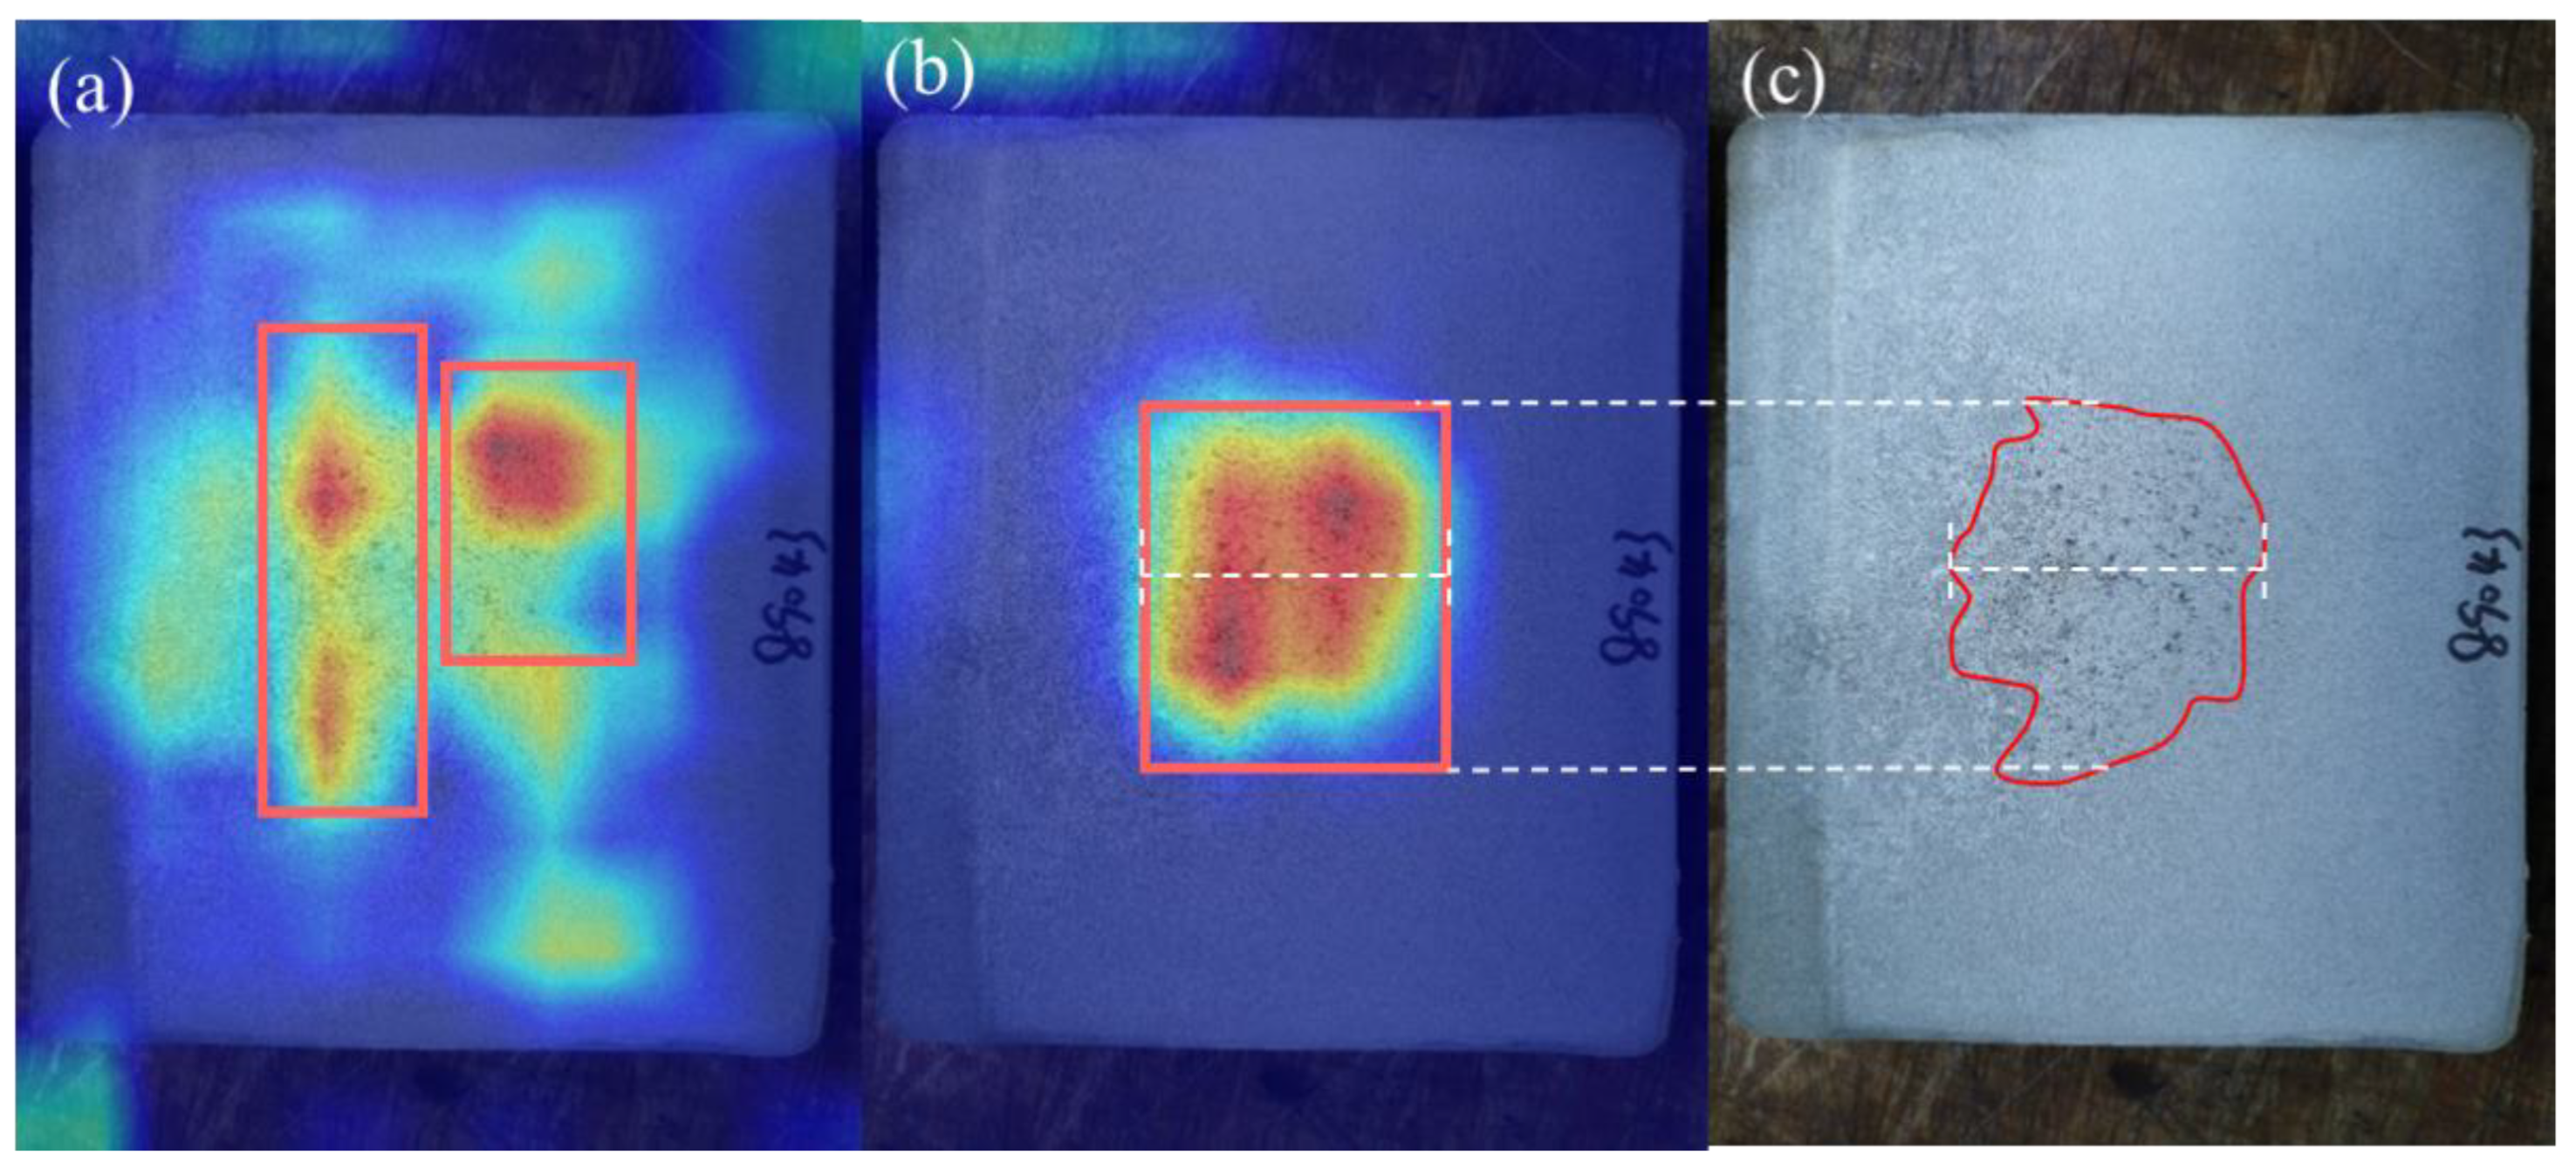
3.2. Visualizing Knowledge of CNNs via Grad-CAM

A common issue with traditional neural networks is the challenge in providing an explanation for the decision made, often labeled as a “black box”. Recent efforts have been made to address this issue and explain outputs, such as the CAM (Class Activation Mapping) [34] and GradCAM (Gradient-weighted Class Activation Mapping) techniques [35].
Finally, to evaluate the effect of the model, a Grad-CAM visualization is used to analyze the attention mechanism and improve interpretability, as shown in Figure 10. Figure 10a displays the heat map without the attention mechanism, indicating difficulties in recognizing defects due to their similarity to the background. In contrast, Figure 10b demonstrates the image after adding CBAM, revealing that the attention mechanism prioritizes the center of the image and improves the accuracy of defect recognition while reducing mislabeling.
The GradCAM generates a heatmap that highlights the regions in the input image where the model’s attention is concentrated. This heatmap is superimposed on the original image, making it visually evident where the model is making its predictions. By examining the heatmap, one can easily identify the areas within the image that are most relevant to the model’s defect detection decision. This localization is crucial for understanding which parts of the image the model considers when identifying defects. This verification method validates the model’s effectiveness and highlights the importance of attention mechanisms in improving recognition accuracy and robustness. Typically, the area in Figure 10c would be manually measured and the longest edge would be compared to the cast billet’s dimensions for calculation. In contrast, our method in Figure 10b directly frames the largest area and allows the computer to calculate the rating. This method significantly speeds up the rating process while maintaining the same level of accuracy as manual measurement. Moreover, this method produces numerical data, avoiding human subjectivity in the rating process.
As shown in Figure 11 for the CBAM-YOLOv5 inspection effect, in the cast billets, both the defect area and the billet as a whole are marked in order to achieve the rating requirements. Since the scale information is not given in the figure, the pixel scale is used as the basis for the size division, and the defect area is compared with the overall size of the billet according to the values given in Table 1, with an aim of obtaining the defect grade automatically.

4. Conclusions

This study proposes a detection and evaluation method for the analysis of segregation in billets that addresses challenges such as a varying defect size and complex background. A CBAM-YOLOv5 network was used which incorporated SPP and CBAM mechanisms to extract important features and reduce interference from background information. The modified network achieves a high detection accuracy for cast billet defects, with a mAP of 93.7%, which is an improvement of 9.6% over the original model. The study also improves the interpretability of the model using GradCAM to demonstrate the role of the attention mechanism in defect detection. In addition, the identified defect areas are compared to the cast billet area to obtain the defect score, which reduces subjectivity and randomness compared to manual measurement and better meets industry needs.

Author Contributions

Z.D.: Methodology, Visualization, Investigation, Software, Writing—original draft. J.Z.: Methodology, Investigation, Writing—review and editing. R.D.K.M.: Reading, Writing—review and editing. F.G.: Funding acquisition, Validation. Z.X.: Funding acquisition, Writing—review and editing. X.W.: Validation. X.L.: Funding acquisition, Validation. J.W.: Funding acquisition, Writing—review and editing. C.S.: Conceptualization, Supervision, Methodology, Investigation. All authors have read and agreed to the published version of the manuscript.

Funding

This research was funded by the National Key R&D Program of China, grant number 2021YFB3703500; Guangdong Provincial Science and Technology Special Fund Project, grant number SDZX2021007; the Fundamental Research Funds for the Central Universities (No. FRF-BD-22-02); the National Natural Science Foundation of China, grant number 51901014; Science and Technology Plan Project of Jinan, grant number No. 202214015.

Data Availability Statement

Data available on request from the authors.

Conflicts of Interest

The authors declare no conflict of interest.

References

  1. Flemings, M.C. Our Understanding of Macrosegregation: Past and Present. ISIJ Int. 2000, 40, 833–841. [Google Scholar] [CrossRef]
  2. Ning, H.; Li, X.; Meng, L.; Jiang, A.; Ya, B.; Ji, S.; Zhang, W.; Du, J.; Zhang, X. Effect of Ni and Mo on microstructure and mechanical properties of grey cast iron. Mater. Technol. 2023, 38, 2172991. [Google Scholar] [CrossRef]
  3. Guo, L.; Su, X.; Dai, L.; Wang, L.; Sun, Q.; Fan, C.; Wang, Y.; Li, X. Strain ageing embrittlement behaviour of X80 self-shielded flux-cored girth weld metal. Mater. Technol. 2023, 38, 2164978. [Google Scholar] [CrossRef]
  4. Yang, C.; Xu, H.; Wang, Y.; Li, F.; Mao, H.; Liu, S. Hot Tearing analysis and process optimisation of the fire face of Al-Cu alloy cylinder head based on MAGMA numerical simulation. Mater. Technol. 2023, 38, 2165245. [Google Scholar] [CrossRef]
  5. Li, Q.; Zuo, H.; Feng, J.; Sun, Y.; Li, Z.; He, L.; Li, H. Strain rate and temperature sensitivity on the flow behaviour of a duplex stainless steel during hot deformation. Mater. Technol. 2023, 38, 2166216. [Google Scholar] [CrossRef]
  6. Misra, R.D.K. Strong and ductile texture-free ultrafine-grained magnesium alloy via three-axial forging. Mater. Lett. 2023, 331, 133443. [Google Scholar] [CrossRef]
  7. Misra, R.D.K. Enabling manufacturing of multi-axial forging-induced ultrafine-grained strong and ductile magnesium alloys: A perspective of process-structure-property paradigm. Mater. Technol. 2023, 38, 2189769. [Google Scholar] [CrossRef]
  8. Wang, L.; Li, J.; Liu, Z.Q.; Li, S.; Yang, Y.; Misra, R.; Tian, Z. Towards strength-ductility synergy in nanosheets strengthened titanium matrix composites through laser power bed fusion of MXene/Ti composite powder. Mater. Technol. 2023, 38, 2181680. [Google Scholar] [CrossRef]
  9. Niu, G.; Zurob, H.S.; Misra, R.D.K.; Tang, Q.; Zhang, Z.; Nguyen, M.-T.; Wang, L.; Wu, H.; Zou, Y. Superior fracture toughness in a high-strength austenitic steel with heterogeneous lamellar microstructure. Acta Mater. 2022, 226, 117642. [Google Scholar] [CrossRef]
  10. Misra, R.D.K.; Challa, V.S.A.; Injeti, V.S.Y. Phase reversion-induced nanostructured austenitic alloys: An overview. Mater. Technol. 2022, 37, 437–449. [Google Scholar] [CrossRef]
  11. Liu, Z.; Xie, Z.; Luo, D.; Zhou, W.; Guo, H.; Shang, C. Influence of central segregation on the welding microstructure and properties of FH40 cryogenic steel. Chin. J. Eng. 2023, 45, 1335–1341. [Google Scholar] [CrossRef]
  12. YB/T 4002-2016; Standard Diagrams for Macrostructure and Defect in Continuous Casting Slab. National Steel Standardization Technical Committee of the People’s Republic of China: Beijing, China, 2016.
  13. SN 960: 2009; Classification of Defects in Materials-Standard Charts and Sample Guide. SMS Demag AG Mannesmann: Düsseldorf, Germany, 2009.
  14. Abraham, S.; Cottrel, J.; Raines, J.; Wang, Y.; Bodnar, R.; Wilder, S.; Peters, J. Development of an Image Analysis Technique for Quantitative Evaluation of Centerline Segregation in As-Cast Products. In Proceedings of the 2016 AISTech Conference Proceedings, Pittsburgh, PA, USA, 16–19 May 2016. [Google Scholar]
  15. Rapp, S. Requirements of the MAOP Rule and Its Implications to Pipe Procurement. In Proceedings of the INGAA Foundation Best Practices in Line Pipe Procurement and Manufacturing Workshop, Houston, TX, USA, 9 June 2010. [Google Scholar]
  16. Xi, J.; Shentu, L.; Hu, J.; Li, M. Automated surface inspection for steel products using computer vision approach. Appl. Opt. 2017, 56, 184–192. [Google Scholar] [CrossRef] [PubMed]
  17. Zhao, J.; Peng, Y.; Yan, Y. Steel Surface Defect Classification Based on Discriminant Manifold Regularized Local Descriptor. IEEE Access 2018, 6, 71719–71731. [Google Scholar] [CrossRef]
  18. Choi, D.C.; Jeon, Y.J.; Kim, S.H.; Moon, S.; Yun, J.P.; Kim, S.W. Detection of pinholes in steel billets using Gabor Filter combination and morphological Features. ISIJ Int. 2017, 57, 1045–1053. [Google Scholar] [CrossRef]
  19. Tao, X.; Zhang, D.; Ma, W.; Liu, X.; Xu, D. Automatic metallic surface defect detection and recognition with convolutional neural networks. Appl. Sci. 2018, 8, 1575. [Google Scholar] [CrossRef]
  20. Lin, W.Y.; Lin, C.Y.; Chen, G.S.; Hsu, C.Y. Steel surface defects detection based on deep learning. In International Conference on Applied Human Factors and Ergonomics; Springer: Berlin/Heidelberg, Germany, 2018; pp. 141–149. [Google Scholar]
  21. Ren, S.; He, K.; Girshick, R.; Sun, J. Faster r-CNN: Towards Real-Time Object Detection with Region Proposal Networks. In Proceedings of the Advances in Neural Information Processing Systems, Montreal, QC, Canada, 7–12 December 2015; pp. 91–99. [Google Scholar]
  22. Chen, Y.; Hong, Z.; Liao, Y.; Zhu, M.; Han, T.; Shen, Q. Automatic Detection of Display Defects for Smart Meters Based on Deep Learning; Faculty of Electrical Engineering and Computing, University of Zagreb: Zagreb, Croatia, 2021. [Google Scholar]
  23. Li, J.Y.; Su, Z.F.; Geng, J.H.; Yin, Y. Real-Time Detection of Steel Strip Surface Defects Based on Improved YOLO Detection Network. IFAC-PapersOnLine 2018, 51, 76–81. [Google Scholar] [CrossRef]
  24. Yao, J.; Qi, J.; Zhang, J.; Shao, H.; Yang, J.; Li, X. A Real-Time Detection Algorithm for Kiwifruit Defects Based on YOLOv5. Electronics 2021, 10, 1711. [Google Scholar] [CrossRef]
  25. Yang, D.; Cui, Y.; Yu, Z.; Yuan, H. Deep Learning Based Steel Pipe Weld Defect Detection. Appl. Artif. Intell. 2021, 35, 1237–1249. [Google Scholar] [CrossRef]
  26. Zheng, D.; Li, L.; Zheng, S.; Chai, X.; Zhao, S.; Tong, Q.; Guo, L. Comput Intel Neurosci, 2021. Computational Intel a Defect Detection Method for Rail Surface and Fasteners Based on Deep Convolutional Neural Network. Ligence Neurosci. 2021, 2021, 2565500. [Google Scholar]
  27. YB/T 4002-2013; Standard Diagrams for Macrostructure and Defects in Continuous Casting Billets. National Steel Standardization Technical Committee of the People’s Republic of China: Beijing, China, 2013.
  28. Kou, X.P.; Liu, S.J.; Cheng, K.Q.; Qian, Y. Development of a YOLO-V3-based model for detecting defects on steel strip surface. Measurement 2021, 182, 109454. [Google Scholar] [CrossRef]
  29. Yun, S.; Han, D.; Chun, S.; Choe, J.; Yoo, Y. CutMix: Regularization Strategy to Train Strong Classifiers with Localizable Features. In Proceedings of the International Conference on Computer Vision, Chongqing, China, 10–12 July 2020. [Google Scholar]
  30. Zhang, H.; Cisse, M.; Dauphin, Y.N.; Lopez-Paz, D. Mixup: Beyond Empirical Risk Minimization. arXiv 2017, arXiv:1710.09412. [Google Scholar]
  31. Zhao, Z.; Yang, X.; Zhou, Y.; Sun, Q.; Ge, Z.; Liu, D. Real-time detection of particleboard surface defects based on improved YOLOV5 target detection. Sci. Rep. 2021, 11, 21777. [Google Scholar] [CrossRef] [PubMed]
  32. Clausen, H.; Grov, G.; Aspinall, D. CBAM: A Contextual Model for Network Anomaly Detection. Computers 2021, 10, 79. [Google Scholar] [CrossRef]
  33. Li, J.; Yang, Y. HM-YOLOv5: A fast and accurate network for defect detection of hot-pressed light guide plates. Eng. Appl. Artif. Intell. 2023, 117, 105529. [Google Scholar] [CrossRef]
  34. Zhou, B.; Khosla, A.; Lapedriza, A.; Oliva, A.; Torralba, A. Learning Deep Features for Discriminative Localization. In Proceedings of the IEEE Conference on Computer Vision and Pattern Recognition, Las Vegas, NV, USA, 27–30 June 2016; pp. 2921–2929. [Google Scholar]
  35. Selvaraju, R.R.; Cogswell, M.; Das, A.; Vedantam, R.; Parikh, D.; Batra, D. Grad-Cam: Visual Explanations from Deep Networks via Gradient-Based Localization. In Proceedings of the 2017 IEEE International Conference on Computer Vision (ICCV), Venice, Italy, 22–29 October 2017; pp. 618–626. [Google Scholar]
Figure 1. Recognition of defective images in the corresponding standard. The red area represents the detected defect region.
Metals 13 01809 g001
Figure 2. Schematic of mosaic data enhancement.
Metals 13 01809 g002
Figure 3. Illustration of YOLOv5 structure [31].
Metals 13 01809 g003
Figure 4. Schematic diagram of CBAM attention structure [29].
Metals 13 01809 g004
Figure 5. Structure of CBAM-YOLOv5 model.
Metals 13 01809 g005
Figure 6. I o U calculation schematic diagram.
Metals 13 01809 g006
Figure 7. Variation of box loss, object loss, and classification loss of the model during the training process. (ac) Loss curve of the original YOLOv5 model. (df) Loss curve of the CBAM-YOLOv5 model.
Metals 13 01809 g007
Figure 8. Precision (P), recall (R), and mAP variation in the model during the training process, the red line represents the CBAM-YOLOv5 model, and the blue line represents the original YOLOv5 model:(a) Precision, (b) Recall, (c,d) mAP with different IoU.
Metals 13 01809 g008
Figure 9. Recognition with dirty spots by (a) YOLOv5, (b) CBAM-YOLOv5. Recognition with complex background by (c) YOLOv5, (d) CBAM-YOLOv5. The red area represents the detected defect region.
Metals 13 01809 g009
Figure 10. Grad-CAM heat map for visual validation of both models. (a) Visualization results of the original YOLOv5 model, (b) visualization results of the CBAM-YOLOv5 model, and (c) defect area marked manually.
Metals 13 01809 g010
Figure 11. Detection results of CBAM-YOLOv5 model.
Metals 13 01809 g011
Table 1. Scales expanded after Lagrange interpolation.
Defect LevelDefect Detection Box Length Ratio/%
00
0.50 < L ≤ 13.45
113.45 < L ≤ 19.73
1.519.73 < L ≤ 23.21
223.21 < L ≤ 26.67
2.526.67 < L ≤ 31.35
331.35 < L ≤ 36.90
3.536.90 < L ≤ 39.42
439.42 < L
Table 2. Insertion of experimental results from different attention mechanisms.
ModelAttention MechanismsmAP/%
YOLOv5None84.1
ECA86.5
SE90.1
CA87.8
CBAM91.0
Table 3. Results of ablation experiments.
ModelAttention MechanismsmAP/%
YOLOv5YOLOv584.1
YOLOv5 + Neck CBAMCBAM behind C3 layer91.0
YOLOv5 + SPP CBAMC3CBAM after SPP92.3
CBAM-YOLOv5Combined with the above93.7
Table 4. Adjustment of hyperparameter.
NumLearning RateOptimizerIoUmAP/%
Exp10.1SGD0.493.1
Exp20.1SGD0.592.6
Exp30.1SGD0.692.4
Exp40.1Adam0.592.2
Exp50.01SGD0.493.7
Exp60.01SGD0.593.0
Exp70.01SGD0.692.7
Exp80.01Adam0.592.1
Disclaimer/Publisher’s Note: The statements, opinions and data contained in all publications are solely those of the individual author(s) and contributor(s) and not of MDPI and/or the editor(s). MDPI and/or the editor(s) disclaim responsibility for any injury to people or property resulting from any ideas, methods, instructions or products referred to in the content.

