Article

A Methodology to Define the Niyama Criterion Reinforced with the Solid Fraction Analysis: Application to Sand Casting of Steel Bars

by
María Carmen Manjabacas
1,2 and
Valentín Miguel
1,2,*
1
Higher Technical School of Industrial Engineering of Albacete, University of Castilla-La Mancha, 02071 Albacete, Spain
2
Regional Development Institute, Science and Engineering of Materials, University of Castilla-La Mancha, 02071 Albacete, Spain
*
Author to whom correspondence should be addressed.
Metals 2023, 13(10), 1777; https://doi.org/10.3390/met13101777
Submission received: 28 September 2023 / Revised: 15 October 2023 / Accepted: 18 October 2023 / Published: 20 October 2023
(This article belongs to the Special Issue Solidification and Casting of Metals and Alloys)

Abstract

:
Niyama and solid fraction criteria are used to predict the solidification porosity and microporosity in computing simulation of casting processes. The solid fraction permits us to determine the areas that solidify last and that are a candidate for presenting porosity if a feeding system is not correctly designed. The Niyama criterion is locally obtained based on the thermal and cooling gradients at a point of the liquid casting. The Niyama value at a casting point varies rapidly from low rates to high ones during the last part of the metal solidification, which demands that the percentage of solidification of the metal is defined to determine the Niyama number. In addition, the Niyama threshold that establishes the soundness of the workpiece can vary according to the nature of the metal or the casting system. In this paper, a methodology to determine the solidification percentage is presented. The method is based on the Niyama number evolution during the solidification process at different key points. These points are validated by the solid fraction criterion as healthy or, on the contrary, as candidates for containing porosity. In addition, some considerations of the solid fraction criterion are visited since the threshold value for which the isolation of the last solidification areas can be defined is not clear. The research is validated by the empirical casting criteria existing in the literature for obtaining sound parts and applied to low-carbon steel bars produced by sand casting.

1. Introduction

Porosity existing in cast parts can be harmful depending on the size, number and distribution of the pores existing in them [1,2,3]. Only in the cases in which pores are small and very uniformly distributed may their influence on the mechanical properties of the part be not significant, for example, in the casting of thin plates [4]. There are several origins of the pore formation: gases coming from the chemical reaction of different elements in the casting system, air introduced with the metal pouring, entrapment of air existing in the mold cavity, gases dissolved in the metal at high temperatures and, finally, empty areas created as the metal shrinks during the solidification. There are different solutions to minimize pore formation depending on its origin, and, in any case, it is important to predict it.
Shrinkage porosity appears in parts of the casting that are isolated from the rest as it is impossible to compensate for the solidification contraction by any medium. By FEM simulation, controlling solid fraction evolution of the metal during its solidification permits us to detect the parts of the metal casting that solidify last. Thus, according to the system, an analysis of critical areas can be stated and modifications to the design formulated [5]. Other criteria based on thermal parameters can be implemented by FEM, such as the local temperature gradient, G, the metal cooling rate, R, the solidification velocity, vs, the total freezing time, tf, and the local solidification time, ts. Different criteria based on a combination of those parameters have been defined and experimented with in the literature [6,7]. With these criteria, it is possible to obtain shrinkage porosity indicators at each point of the casting during the solidification process by FEM software. The most known of these criteria is the Niyama number, Ny, defined as N y = G / R [8]. Niyama et al. demonstrated that points of the casting with an Ny value lower than that which is critical should present microporosity. Even above the critical number, a range of values reveals the existence of microporosity [9]. The criterion was built under the statement that links the Ny value and the pressure drop in the mushy zone [8,10]. Although the Ny critical value depends on the material, and, particularly, Niyama et al. obtained values in the range 0.9–1.5 K1/2 min1/2 cm−1, they stated for steel a value of 1 K1/2 min1/2 cm−1 as the critical one.
The critical Niyama value depends on the units in which it is defined, and sometimes Ny expressed according to its classical definition must be multiplied by 775 or divided by 1.29 if expressed as K1/2 s1/2 m−1 or K1/2 min1/2 mm−1, respectively. The Niyama criterion has some constraints: it does not consider pore nucleation and gravity action on it; the Ny threshold value is shape dependent [11] and generally unknown; and it is a qualitative criterion that does not provide the quantity of shrinkage porosity that forms [6,12]. Due to the last limitation, Carlson and Beckermann [12] defined a dimensionless Niyama criterion. Other authors proposed other parameters, such as the rate of transition of the alloy from a semisolid to solid state, establishing for cast iron a strong relationship between that parameter and the formation of shrinkage cavities [13].
Definitely, each material will have its own critical Ny value, usually determined by specific casting experiments [14]. In addition, Ny value strongly depends on the temperature at which it is evaluated, and, thus, it is important to define that. Some authors recommend evaluating Ny at a temperature that is 10% of the solidification range, TL − TS, above the solidus temperature, i.e., T N y 0.9 = T S + 0.1 ( T L T S ) [15], according to the criterion defined by Carlson and Beckermann [16,17]. Nevertheless, based on some experiences, other authors state that the temperature at which Ny should be obtained could be different, although near the end of the metal solidification [14]. Finally, although some advances have been made in determining the threshold Ny for different alloys, this value is not known for all alloys or all steel [18].
Some FEM simulation software gives an Ny value for each point considering only one temperature, which is sometimes unknown or difficult to select with respect to the solidification percentage that it represents [19]. Other applications give Ny for any temperature, for example, VULCAN (Quantech ATZ S.A., Barcelona, Spain). Inspire Cast (Altair Engineering Inc., Troy, MI, USA) permits the Niyama value to be evaluated once the registers of the thermal gradient and the cooling rate have been obtained since only a unique value for T N y 0.85 is given directly through the results interface. This is a valuable option since it is possible to analyze the Ny value evolution during the solidification of any selected point. Moreover, this permits TNy to be fixed according to other complementary analyses. Wang et al. [20] employed FEM software for casting simulation based on a CAD/CAE integrated system to optimize the casting process by the interaction among the different existent moduli. That system could calculate and display hot spots to optimize the risering system by means of an active intelligent mode. Definitely, the advances of the casting numerical simulation permit the casting production to be guided [21], and specific procedures have been applied by some authors in order to eliminate or reduce the shrinkage porosity [22].
In this work, a sand casting process for obtaining a low-carbon steel bar is analyzed.
The empiric fundamentals taken into consideration to calculate the gating system are established in [5]. The filling system was dimensioned to fulfill the requirement of achieving a solid fraction that equals zero at the end of the mold filling. The casting system was analyzed by FEM simulation, and it was probed so that the filling system led us to obtain a part without typical defects linked to the filling process, i.e., the empirical and computer simulation results were coherent [5]. The feeding system was based on the typical thermal and volume criteria and shape factor design established in the literature and based on empirical experiments to obtain sound pieces [4,23,24,25,26,27,28]. The considerations applied are established in Appendix A.
The length of the bar permitted the location of several risers to be analyzed. With respect to the feeding system, the dimension, number and location of the risers were experimented on by FEM, taking into account the solid fraction criterion. Aspects such as the mold end effect and the real heating transmitter surfaces were taken into account. For these, different solutions were analyzed, and the solution corresponding to the empirical one was probed as the optimal one [5].
The action of the filling system as a functional riser was demonstrated to be negligible since the gate solidified very fast, and the rest of the filling system remained isolated during the early solidification. In addition, it was demonstrated that the riser part joints work in a correct way, avoiding the isolation of the molten metal in the riser from the part during the solidification process; however, the riser necking sections are probably not enough to provide the necessary material into the part.
A deep analysis related to the application of the Niyama criterion was carried out. For that, the coherence between the solid fraction and Niyama criterion was taken into account to define the solidification considerations at different points of the casting system. The evolution of the Niyama number during the solidification was analyzed at those points, and, according to the expected results, the analysis criteria were defined. In addition, a methodology was planned to define the thresholds of the Niyama and solid fraction criteria for a correct analysis.

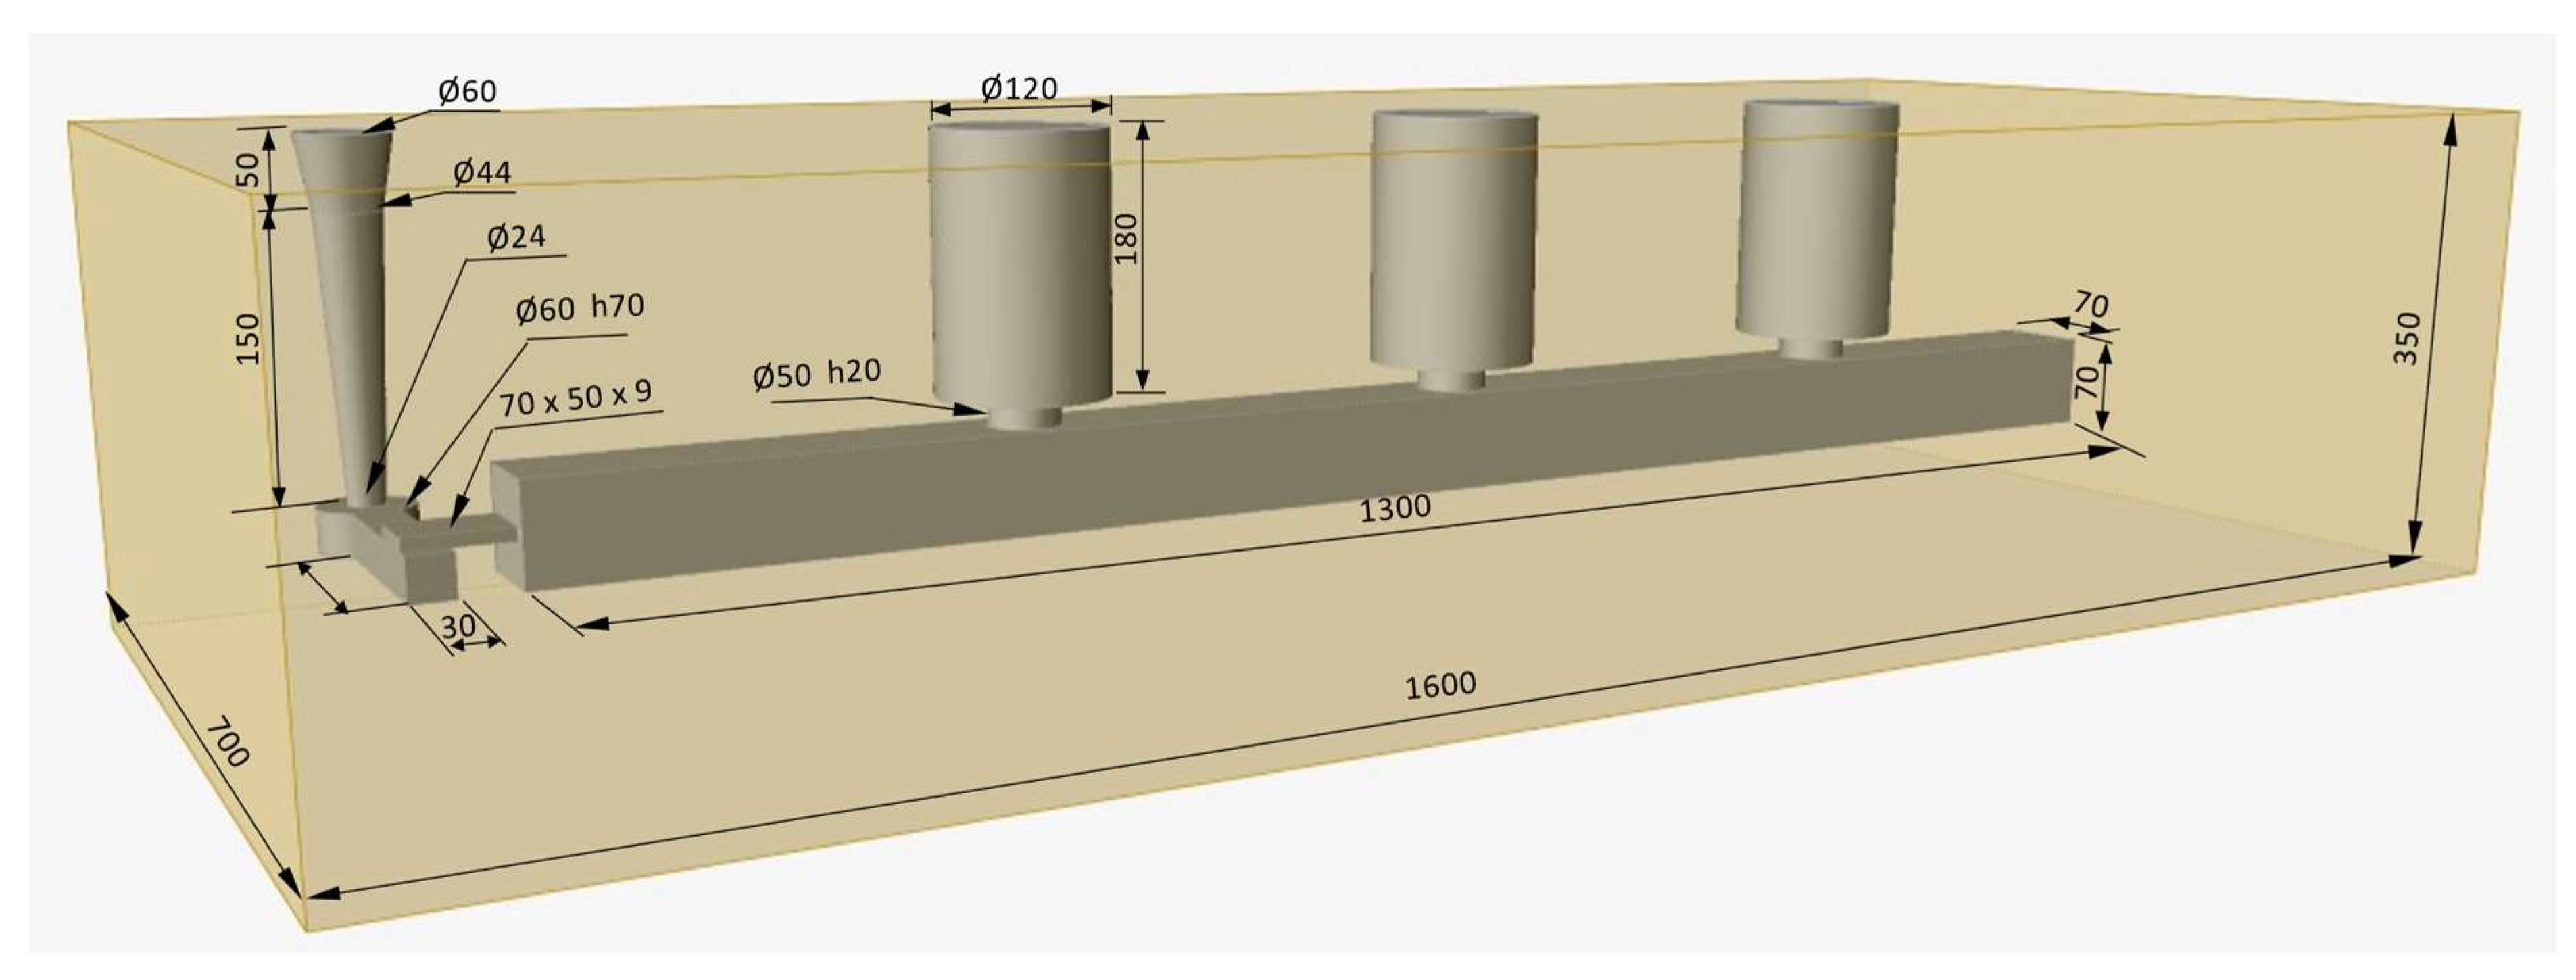
2. Materials and Methods

A sand casting system for producing a 1.0331 low-carbon steel bar, 1300 mm long, was considered for simulation by FEM by VULCAN® (Quantech ATZ S.A., Barcelona, Spain) and Inspire Cast (Altair Engineering Inc., Troy, MI, USA). The section of the bar was 70 × 70 mm2. A green sand mold was selected; the filling and the feeding systems were designed according to classical rules, leading to sound pieces being obtained. The details of the system can be observed in Figure 1. The mold has a thermal conductivity that is variable with the temperature, according to Table 1. The conductive and convective heat transfer coefficients of the mold are also included in Table 1 [29]. The chemical composition of the steel is defined in Table 2, and its thermal properties are collected in Table 3 [29]. The solid fraction, SF, for the steel varies linearly from 1772.7 K, SF = 1, to 1800.2 K, SF = 0. The dynamic viscosity also varies linearly from 0.0059 to 0.0067 kg/(m·s) and between 1873 and 1825 K, respectively [29].
With respect to the casting technological conditions, it can be highlighted that the metal was overheated by 100 K, i.e., the pouring temperature was 1900 K. The initial temperature of the mold was 293 K, i.e., room temperature. The filling time was 15 s, which implies consideration of the threshold of velocities recommended by some authors to avoid turbulences during the filling process [4]. From this point of view, the well, i.e., the sprue–runner transition, designed in the system is not the best, but it was selected for its simplicity since no influence was expected on the goal of the present research.

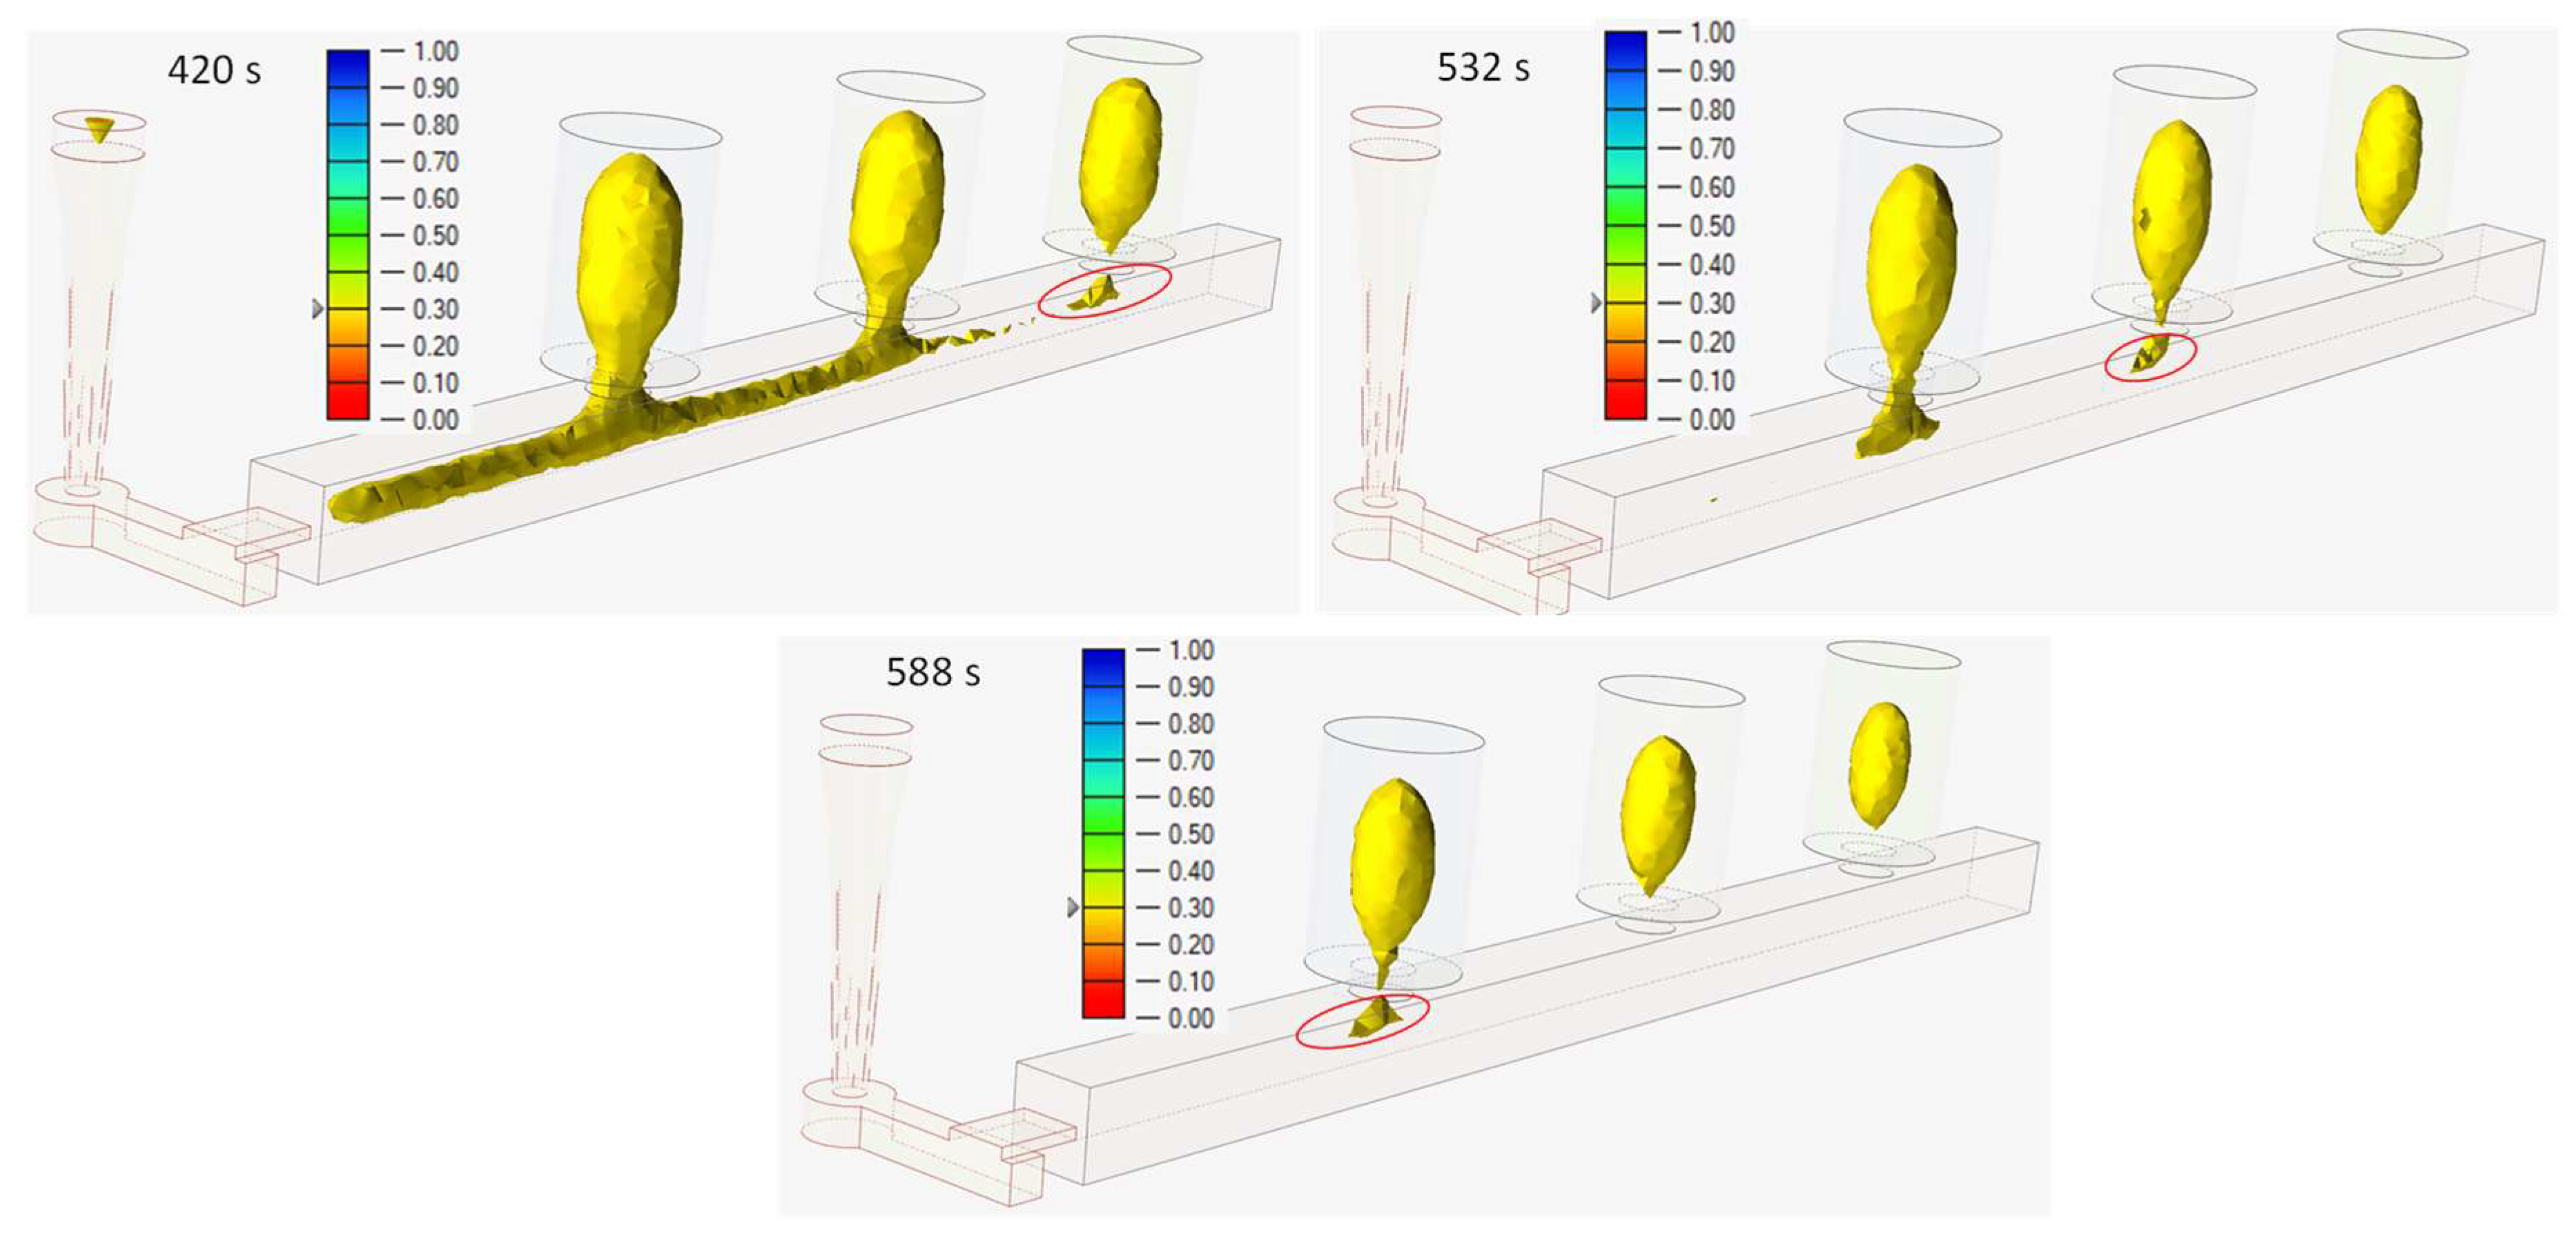
FEM Simulation of Solid Fraction during the Solidification

FEM simulations were carried out by means of Inspire Cast (Altair Engineering Inc., Troy, MI, USA). This software permitted us to obtain, among other results, the solid fraction evolution, SF, during the solidification of the molten metal into the mold cavity. To analyze the solid fraction evolution, it is important to fix a threshold above which the liquid material existing in the mushy areas cannot go through the interdendritic channels from one part to another. The level of solidification at which this happens depends on the metal’s natural property, and it is very important to determine the reference value since it can influence the results obtained. In Figure 2, the SF evolution during the solidification can be observed for two different threshold levels, 0.70 and 0.90. For the analysis, it should be considered that the white color represents the areas in which the SF was higher than 0.70 or 0.90. Usually, most metals are probed to have an SF threshold value between these two. As can be observed, there was hardly any influence of the level considered in the analysis on the critical isolated points of the molten metal that remain isolated during the last instants of the solidification process (areas rounded in red color in Figure 2). The only difference found was the size of the critical areas, which, as expected, was slightly greater for the lowest threshold experienced, i.e., 0.70. Logically, the reference solidification times in the analysis were lower for the minor SF limit. Only if the SF limit value was very low, could a substantial qualitative difference be observed in the SF analysis, shown in Figure 3. In Figure 3, for an SF reference of 0.30, it can be observed that some areas below the risers turn into isolated zones and might constitute critical points that present metal empty areas as a consequence of the shrinkage phenomenon that would not be compensated by molten metal in the neighborhood. Nevertheless, this last analysis lacks interest since a critical SF of 0.30 is excessively low.

3. Description of the Methodology Employed for Ny Analysis

Seven points of the casting system were selected for the analysis, shown in Figure 4i. All the points correspond to the central section of the casting system since the material belonging to this section solidifies last. Points 1 and 2 are located in places that are supposed to be covered by the feeding distance according to the empirical criteria applied; the only difference is that point 1 remains just in the center of the distance inter-risers, and point 2 is located at the extreme of the bar just out of the end workpiece zone. Point 3 is intermediate to the gate and the first riser, and nearer to the filling system, just where the SF criterion establishes the possibility of finding areas that have experienced shrinkage. The location of the first riser is at a distance from the extreme greater than the empirical rules recommend. Point 4 is placed just at the top of a riser in which, according to the SF criterion, the solidification takes place before that in the center of the riser. This means no shrinkage porosity is expected in this area. Point 5 is located just under a riser, and it is expected to be sound if the neck riser is correctly designed. Point 6 is just into the last solidification area in the riser that will remain totally isolated at the end of the solidification process. This supposes that a large empty area will form there, and the point selected should present a low Ny value. Finally, point 7 is into the end workpiece effect of the bar, and, according to the directional solidification fundamentals, it is expected to be a sound point.
Thus, the methodology consists of obtaining the Ny value at different TNy values, defined according to Equation (1).
T N y 1 δ = T S + δ ( T L T S )
The values adopted for δ were 0.2, 0.15, 0.10 and 0.05, which means that Ny was determined at temperatures at which the solidification process was completed up to 80, 85, 90 and 95%, approximately. Taking into consideration the expected results supported by the SF analysis, shown in Figure 2, it will be decided whether the Niyama values obtained show some coherence.

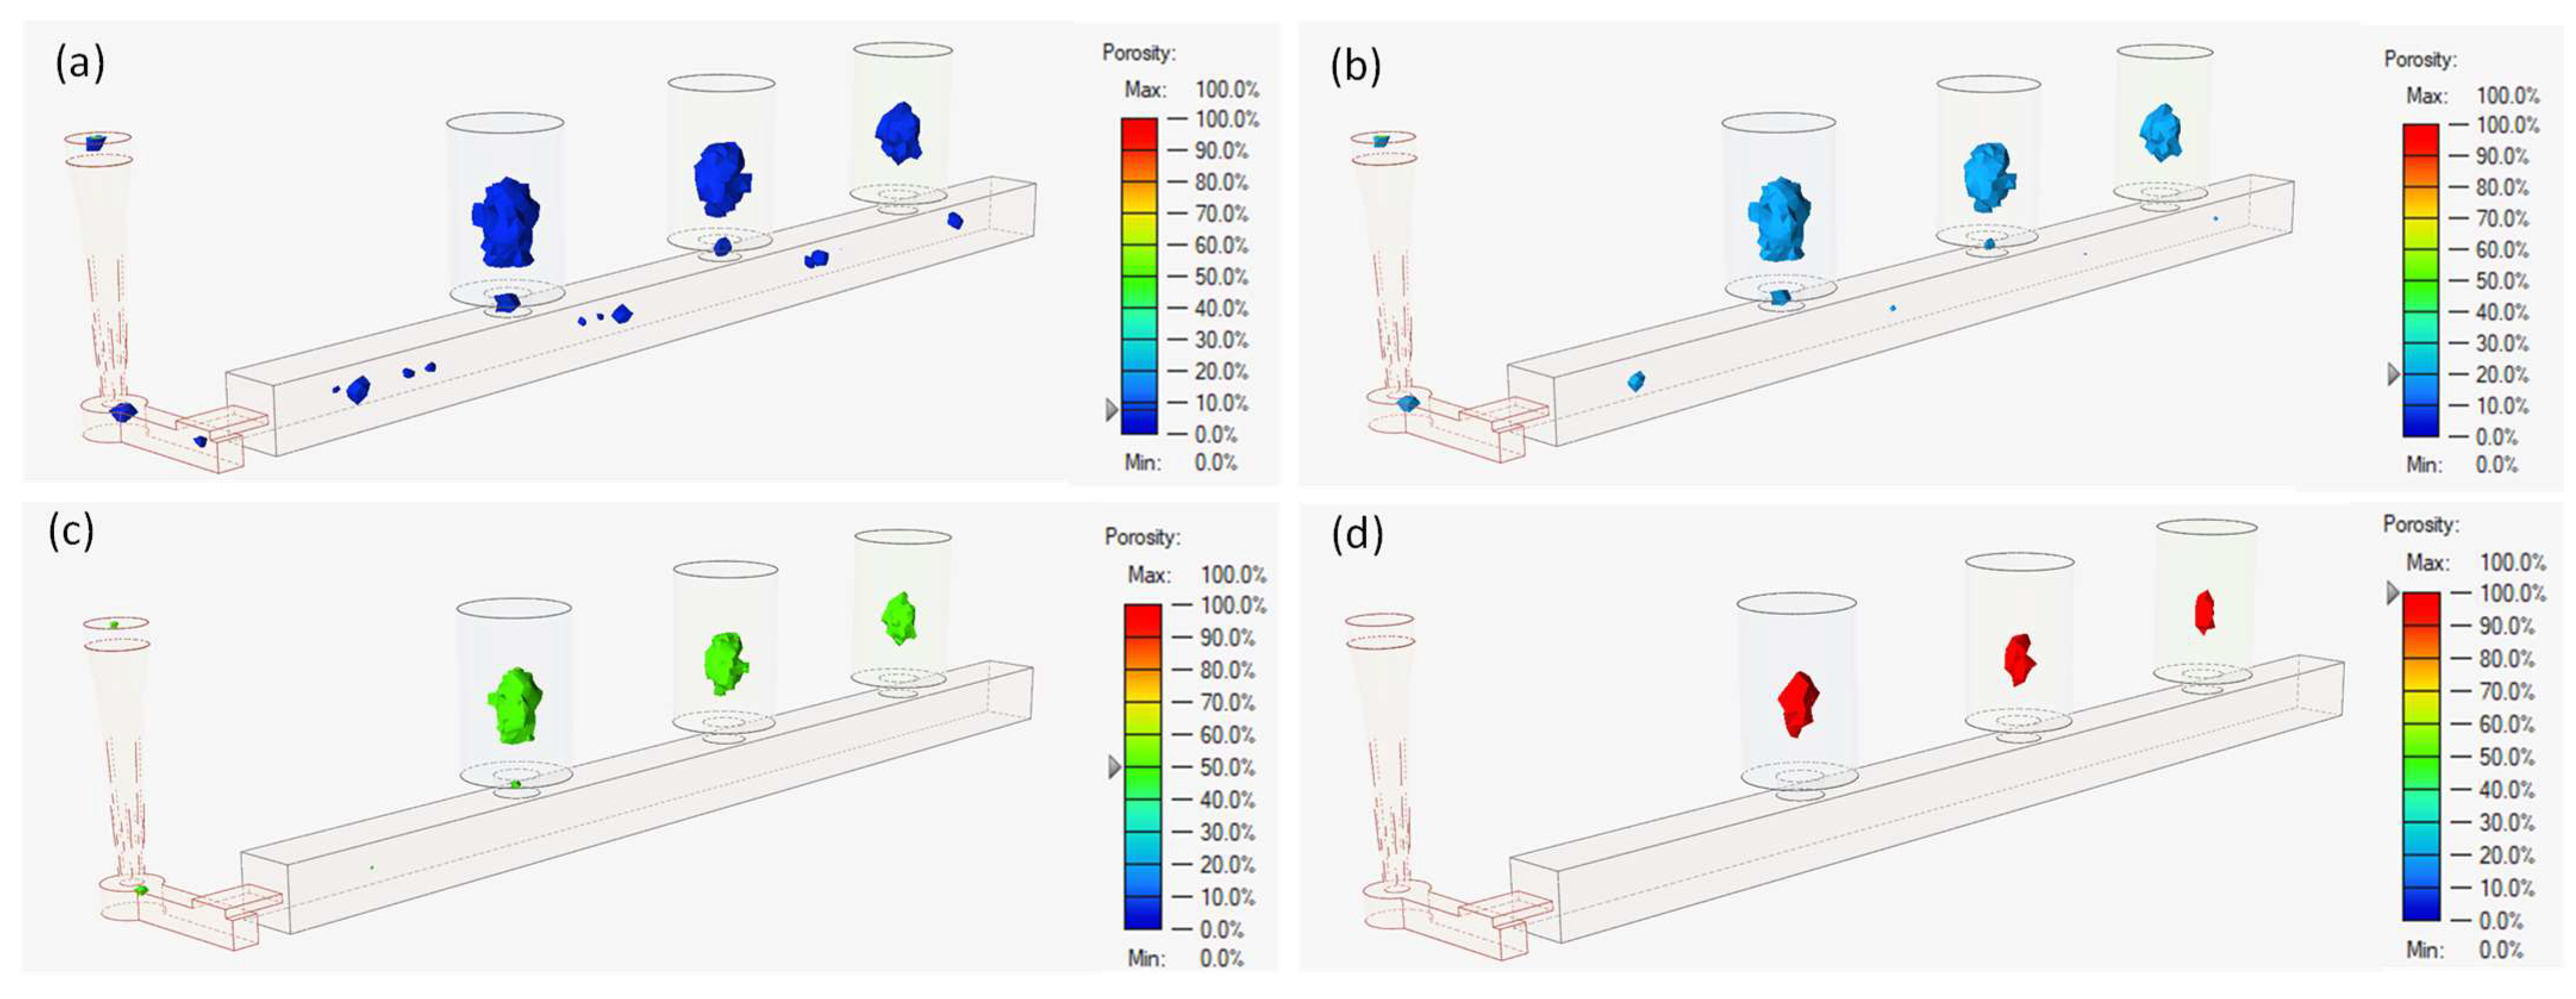
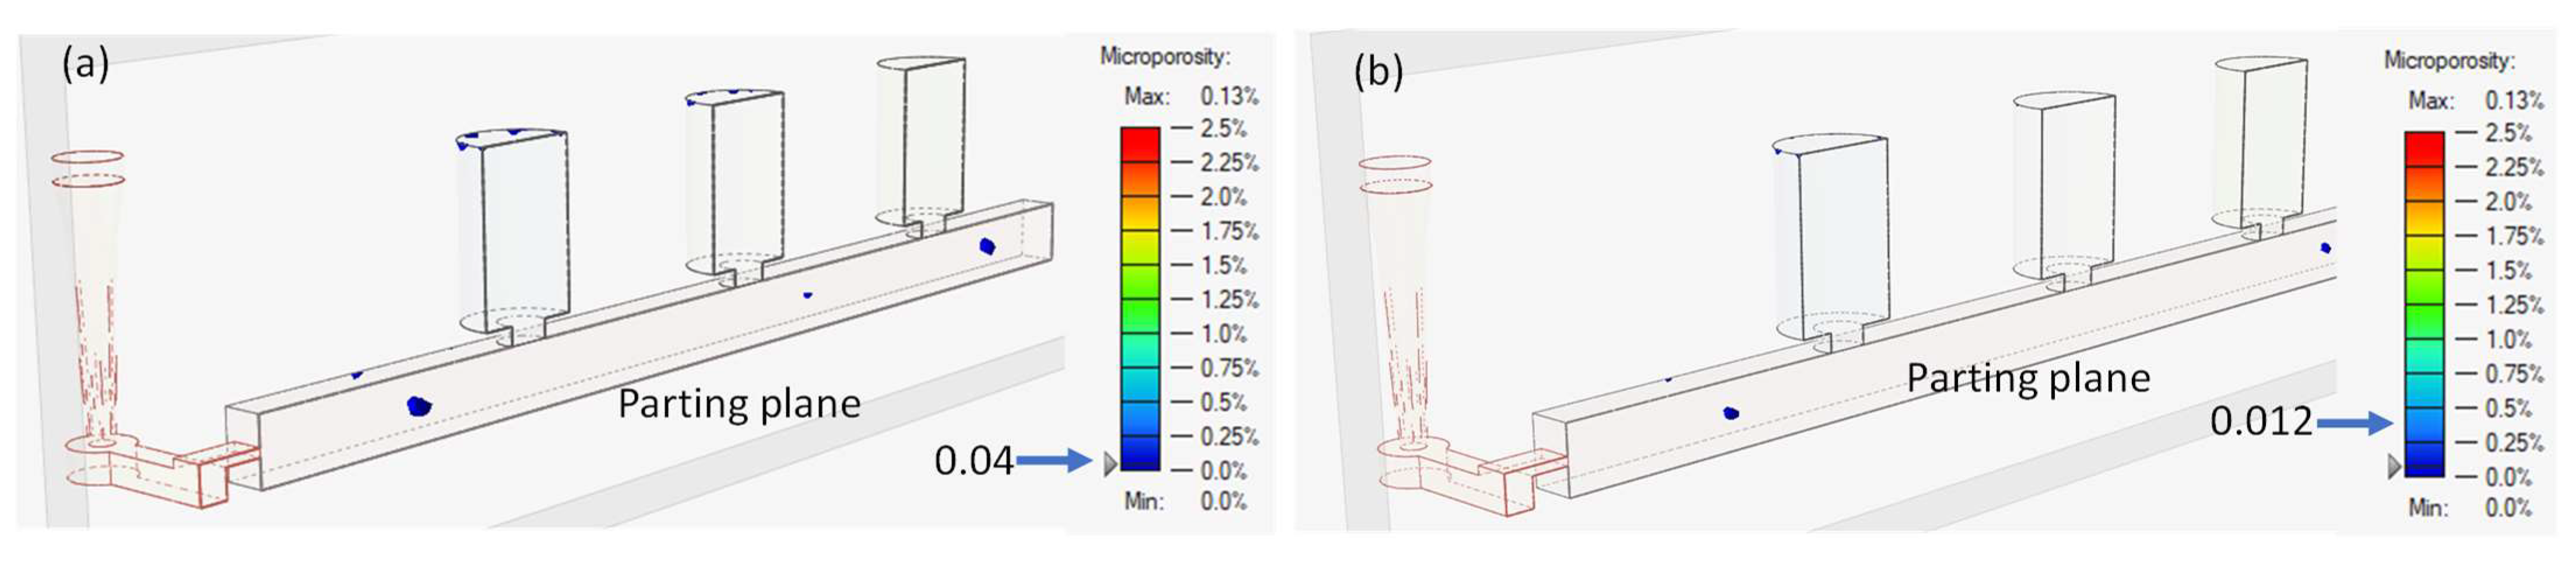
4. Results and Discussion

In Figure 4, the metal cooling temperature curves belonging to the points analyzed are drawn in a blue color. The starting temperature corresponds to the instant at which the filling process has just finished, and, logically, it is not the same for the different points considered. As expected, point 3 presents the highest temperature after the filling process since the hottest metal enters through the first extreme of the bar, near point 3. The values corresponding to the other points are explained similarly, with 7 and 1 being the points with the lowest initial temperature just after the mold filling. Thus, the maximum difference in temperature between points 3 and 7 is 75 °C. The Ny evolution during the solidification is represented in an orange color. It can be seen that an abrupt change from 0 to very high values exists in the last part of the metal solidification, i.e., at temperatures near Ts, or the solvus temperature. Thus, it is very difficult to set graphically the Ny value corresponding to a determined temperature in the last part of the metal solidification process. In detail, it is necessary to determine the time step corresponding to the temperature T N y 1 δ in the metal cooling curve and to obtain the value of the Ny for this time step in the Niyama curve. In Figure 4, vertical dotted lines intersecting the x-axis represent the values corresponding to the time step of the metal cooling temperature function at the y-axis values of T Ny 0 . 8 ,   T Ny 0 . 85 ,   T Ny 0 . 9   and   T Ny 0 . 95 . Thus, the intersections of the dotted lines with the Niyama function permit Ny values to be found for the temperatures indicated before. Due to the difficulty of determining graphically the Ny values corresponding to each point i at temperatures near the end of solidification, Nyi, those were obtained analytically and are indicated in table form in Figure 4.
According to the Ny results corresponding to points 6 and 7, T Ny 0 . 9 is the only valid possibility since the Ny for this temperature clearly justifies the expectations about the porosity response of the system in those areas. Thus, Ny7 is above 775 K1/2 s1/2 m−1 only from T Ny 0 . 9 onwards; meanwhile, Ny6 remains below that value up to T Ny 0 . 95 . The criterion of taking T Ny 0 . 9 as the reference to consider Ny in the rest of the points is coherent as well. Thus, the results of points 1 and 2 indicate that these areas will lack porosity, which is coherent with the dimensioning of the feeding system according to the empirical and traditional rules. Ny3 reveals the existence of porosity. The distance of the first riser from the extreme of the bar is larger than the corresponding one according to the empirical rules. The design in this part of the bar was specifically established to evaluate the behavior of an area of the part that it is supposed to solidify last according to the directional solidification principles [25]. In addition, no end effect was expected due to the proximity of the part and the filling system at this extreme of the bar. Nevertheless, the filling system sometimes acts with a riser function as it is filling continuously with hot metal. However, the SF analysis showed that the gate freezes faster than the bar, and some isolated zones appear without the possibility of being fed the corresponding shrinkage, as shown in Figure 2. Consequently, some porosity can appear. Thus, the Ny3 value at 90% of the solidification process is coherent with the expected results, being clearly much lower than 775 K1/2 s1/2 m−1. Even Ny at 95% is close to that value.
Ny5 indicates the probable presence of porosity just below the riser. This result is not compatible either with the SF criterion or with the traditional empiric criteria, shown in Appendix A. The simulation of the SF established that the riser necking is a hot spot since the SF value is lower than that existing on both sides of the necking area, part and riser. This means that the piece is no longer isolated during the solidification. However, it is possible that the narrow path limited by the necking area is not sufficient to guarantee the transport of enough liquid through the fine interdendritic channels. This statement is confirmed by the results shown in Figure 3, in which it can be seen that the track of connection between the risers and the piece is very narrow. In addition, the thermal gradient is interrupted, and some authors consider that the Niyama criterion is only applicable in limited conditions for directional solidification [30].
With respect to points 4 and 6, inside of the riser, it can be observed that the evolution of the Ny value is clearly more gradual at the beginning of the transition during the solidification, shown in Figure 4d,f, even though, in the case of point 4, the Niyama evolution presents a stepped shape around a value of 500 K1/2 s1/2 m−1. At this point, the metal arrives colder than at the rest of the riser since this area fills last. In addition, the solidification is faster due to the heat transfer convection of metal–air and conduction existing. All this means that no severe surface shrinkage is expected in comparison to at the top of the sprue, which usually is the last part of the filling system to solidify. Thus, Ny4 is only 5% larger than the critical Ny value, and no conclusive statements can be made for this point. Obviously, Ny6 is very low up to T Ny 0 . 9 , indicating a severe porosity in this part, as expected. Logically, points 4 and 6 were only employed for testing the results since, technologically speaking, they lack interest.
The methodology applied permitted us to establish a relationship between the Niyama threshold and the temperature at which this should be evaluated in order to obtain results coherent with those expected in the solid fraction analysis and others. In this case, the results obtained for low-carbon steel are totally coherent with those established by other authors. Carlson et al. [16] established the temperature N y 0.9 to determine the Niyama value as a criterion for evaluating the porosity in steel casting, which coincides with the value demonstrated herein. All the results obtained are those expected, taking into account that the filling and feeding systems were established according to the classical empirical rules published in the literature [4,5,16,17,23,27,28,31,32]. Thus, very low Ny values were obtained in the area highly distanced from any riser, point 3, and in the inner areas of the risers, point 6, denoting empty volume in those zones; these parts either do not fulfill the classical rules of the feeding system design or take part of their own feeding system, being the last part that solidifies, totally isolated from any liquid part of the casting. In this last case, it reflects that the feeding system works suitably. The areas that solidify sooner, such as those near the end of the bar, point 7, and the surfaces of the risers, point 4, give high Ny values which correspond to zones without porosity. In addition, these areas present the lowest metal temperature at the end of the filling process. Finally, the points covered by the feeding distance but in the middle of the inter-riser length or similar, points 2 and 1, present values of Ny above the threshold one, but close to it, which means that some microporosity can appear.
Figure 5 depicts the results of porosity obtained by FEM simulation using Inspire Cast (Altair Engineering Inc., Troy, MI, USA). The areas shown correspond to those for which the empty volume is at least the value, expressed as a percentage, selected by the arrow existing in the bar legend. The areas involved are coherent with the Niyama analysis previously carried out. Thus, if Figure 5a,b are compared, it can be deduced that there is only a small area in the bar with a percentage of empty volume lower than 20%, which corresponds with the Niyama prediction. No areas with a higher empty volume level than 20% appear in the bar. Only the inner central part of the risers and some very small areas in the riser necking present values of 50%. Obviously, the central part of the risers contains a high level of shrinkage porosity with a large area which is totally empty.
Related to microporosity, this one only appears in punctual areas in the bar, in the parting plane and in the bar surface, as can be appreciated in Figure 6a for a value of 0.04% of empty volume in those areas. Only two small areas with a maximum empty volume of 0.13% can be observed in Figure 6b. In addition, these two areas do not correspond with the points under the Niyama analysis, although they are placed near points 3 and 1, respectively. The microporosity detected can be justified if the compromised Ny values obtained for points away from risers (points 1 and 2) are taken into account. The Ny values of those points are close to the critical established Niyama number, which denotes the possibility of microporosity appearance. Nevertheless, microporosity is not relevant in the system analyzed.
The methodology can be applied to other materials for which the definition of the threshold value is inaccurate and/or for which the temperature to evaluate Ny is not clear [9,14,33,34,35,36,37].

5. Conclusions

A methodology to determine the FEM criteria to select the Niyama value in a sand casting process has been established. For that, the design of the system was carried out according to the empirical principles existing in the literature for low-carbon steel casting. Ny evolution during the last solidification of the casting system was analyzed in key areas of the part, along with the solid fraction criterion. The temperature for evaluating the Niyama number should be the one corresponding to 90% of the solidification process. Thus, the results obtained are coherent with those expected and with the results obtained by other authors for the alloy experimented on herein. Thus, very low Ny values were obtained in an area greatly distanced from any riser and in the inner areas of the risers, denoting porosity in those parts; these parts either do not fulfill the classical rules of the feeding system design or take part of their own feeding system. In this last case, it reflects that the feeding system works suitably. The areas that solidify sooner, such as those near the end of the bar, and the surfaces of the risers, give high Ny values that correspond to zones without porosity. Finally, the points covered by the feeding distance present values of Ny above the threshold one, but close to it, establishing that some microporosity can appear.
This methodology may be applied to define other Niyama thresholds and solidification percentages corresponding to other alloys if some experimental or empirical rules are known concerning the casting of those materials.

Author Contributions

Conceptualization, M.C.M. and V.M.; methodology, M.C.M. and V.M.; software, M.C.M. and V.M.; validation, M.C.M. and V.M.; formal analysis, M.C.M. and V.M.; investigation, M.C.M. and V.M; resources, M.C.M. and V.M; data curation, M.C.M. and V.M.; writing—original draft preparation, M.C.M.; writing—review and editing, V.M.; visualization, M.C.M. and V.M; supervision, V.M; project administration, M.C.M. and V.M.; funding acquisition, M.C.M. and V.M. All authors have read and agreed to the published version of the manuscript.

Funding

This research received no external funding.

Data Availability Statement

The data used to support the findings of this study can be shared under request.

Acknowledgments

The authors acknowledge the technical assistance of the support team of ALTAIR Spain.

Conflicts of Interest

The authors declare no conflict of interest.

Appendix A

In this appendix, the criteria and rules for designing the feeding system in sand casting of low-carbon steel bars are collected.
The cooling modulus of the risers, Mr, is worked out according to Chvorinovs’s rule and considering 20% of oversize with respect to the part modulus [37], Mp, Equation (A1). Vr, Vp, Sr and Sp represent the volume and the surface of the riser and the part, respectively. A height-to-diameter ratio of the risers, Hr/Dr, of 1.5 is proposed to guarantee a suitable local metal pressure [4,23].
M r = V r S r = 1.2 M p = 1.2 V p S p
The heat transfer surface of the riser is the lateral one, and the top surface, i.e., the bottom surface, is not considered as a cooling path. With respect to the workpiece, for the heat transfer surface calculus, the lateral surface in the gating system on extreme side of the bar is excluded for a similar reason to the one described above.
It is discovered that with three risers the volume criterion for the feeding system, Vr, is fulfilled, according to Equation (A2). A riser efficiency, ξ , of 14% [4] is considered. The low-carbon steel conductivity coefficient, α, is included in Equation (A2).
V r = α ξ ( V r + V p )
The riser neck is designed taking into account the considerations established in Equation (A3) for the height, hn, and the diameter, Dn, as a function of the dimensions of the riser hr and Dr, respectively [31].
h n < D r 2 D n = h n + 0.2 D r
The location of the risers is set taking into consideration the empirical criteria existing in the literature [4,23,24,25,28,32]. Taking into account these considerations, the risers are distributed in the system in order to guarantee the feeding action, Lr, through the piece. Particularly, the Johnson and Loper rule is fulfilled, Equation (A4). In addition, an end effect, EZL, at the extreme of the bar is considered according to [28] with a ratio width/thickness equals 1 for the workpiece.
L r ( m m ) = 80 M 84

References

  1. Hardin, R.A.; Beckermann, C. Effect of Porosity on Deformation, Damage, and Fracture of Cast Steel. Metall. Mater. Trans. A 2013, 44, 5316–5332. [Google Scholar] [CrossRef]
  2. Hardin, R.A.; Beckermann, C. Effect of Porosity on the Stiffness of Cast Steel. Metall. Mater. Trans. A 2007, 38, 2992–3006. [Google Scholar] [CrossRef]
  3. Hardin, R.A.; Beckermann, C. Prediction of the Fatigue Life of Cast Steel Containing Shrinkage Porosity. Metall. Mater. Trans. A 2009, 40, 581–597. [Google Scholar] [CrossRef]
  4. Campbell, J. Complete Casting Handbook: Metal Casting Processes, Metallurgy, Techniques and Design, 2nd ed.; Butterworth-Heinemann: Oxford, UK, 2015; ISBN 9780444635099. [Google Scholar]
  5. Miguel-Eguía, V.; Manjabacas-Tendero, M.C.; Medina-Ríos, N. Prediction of the Effectiveness of the Feeding System of Carbon Steel Sand Castings Using the Solid Fraction Criterion. Application to Square Bars. Int. J. Mater Product Tech. 2016, 53, 28–41. [Google Scholar] [CrossRef]
  6. Tavakoli, R. On the Prediction of Shrinkage Defects by Thermal Criterion Functions. Int. J. Adv. Manuf. Tech. 2014, 74, 569–579. [Google Scholar] [CrossRef]
  7. Lourenço, A.R. Numerical Modelling of Shrinkage Defects Induced by the Feeding Flow in Aluminium Castings. Ph.D. Thesis, University of Gent, Gent, Belgium, 2007. Available online: https://repositorio-aberto.up.pt/bitstream/10216/122834/2/358133.pdf (accessed on 25 August 2023).
  8. Niyama, E.; Uchida, T.; Morikawa, M.; Saito, S. A Method of Shrinkage Prediction and its Application to Steel Casting Practice. Int. Cast Met. J. 1982, 7, 52–63. [Google Scholar]
  9. Khaled, I. Prediction of Shrinkage Porosity in Ti-46Al-8Nb Tilt-Casting Using the Niyama Criterion Function. Int. J. Metalcast. 2013, 7, 35–42. [Google Scholar] [CrossRef]
  10. Ivanina, E.S.; Monastyrskiy, V.P.; Ershov, M.Y. Quantitative Estimation of Formation of Shrinkage Porosity by the Niyama Criterion. Inorg. Mater. Appl. Res. 2022, 13, 100–105. [Google Scholar] [CrossRef]
  11. Abootorabi, A.; Korojy, B.; Jabbareh, M.A. Effect of Mould Design on the Niyama Criteria during Solidification of CH3C 80t Ingot. Ironmak. Steelmak. 2020, 47, 722–730. [Google Scholar] [CrossRef]
  12. Carlson, K.D.; Beckermann, C. Prediction of Shrinkage Pore Volume Fraction Using a Dimensionless Niyama Criterion. Metall. Mater. Trans. A Phys. Metall. Mater. Sci. 2009, 40, 163–175. [Google Scholar] [CrossRef]
  13. Dwulat, R.; Janerka, K. Evaluation of the Metallurgical Quality of Nodular Cast Iron in the Production Conditions of a Foundry. J. Manuf. Mater. Process. 2023, 7, 18. [Google Scholar] [CrossRef]
  14. Ignaszak, Z. Discussion on Usability of the Niyama Criterion for Porosity Predicting in Cast Iron Castings. Arch. Foundry Eng. 2017, 17, 196–204. [Google Scholar] [CrossRef]
  15. Díez-Rodríguez, D. Gradient Based Porosity Calculation in Casting Simulation. Master´s. Thesis, Poli-technical University of Catalunya, Barcelona, Spain, 2017. Available online: https://upcommons.upc.edu/bitstream/handle/2117/113965/DanielDiez-TFM.pdf (accessed on 25 August 2023).
  16. Carlson, K.D.; Ou, S.; Hardin, R.A.; Beckermann, C. Development of New Feeding-Distance Rules Using Casting Simulation: Part I. Methodology. Metall. Mater. Trans. B 2002, 33, 731–740. [Google Scholar] [CrossRef]
  17. Ou, S.; Carlson, K.D.; Hardin, R.A.; Beckermann, C. Development of New Feeding-Distance Rules Using Casting Simulation: Part II. The New Rules. Metall. Mater. Trans. B 2002, 33, 741–755. [Google Scholar] [CrossRef]
  18. Jain, N.; Carlson, K.D.; Beckermann, C. Round Robin Study to Assess Variations in Casting Simulation Niyama Criterion Predictions. In Proceedings of the 61st SFSA Technical and Operating Conference; paper 5.5.; Steel Founders’ Society of America, Chicago, IL, USA, 2007; Available online: https://user.engineering.uiowa.edu/~becker/documents.dir/sfsa/2007-5.5_niyama.pdf (accessed on 12 September 2023).
  19. Ding, H.; Jin, X.; Chen, T.; Li, H. Study on Casting Defect Control of Austenitic 304 Complex Structural Parts. Int. J. Met. 2023, 17, 1427–1438. [Google Scholar] [CrossRef]
  20. Wang, T.; Zhou, J.; Wang, L.; Zhang, Z.; Zhang, H.; Xia, X. Research and Development of Gating and Riser Process Optimization Integrated System for Steel Casting. Int. J. Met. 2023, 17, 2452–2468. [Google Scholar] [CrossRef]
  21. You, L.; Yao, L.; Li, X.; Jia, G.; Lv, G. Numerical Simulation and Casting Process Optimization of Cast Steel Node. International J. Adv. Manuf. Tech. 2023, 126, 5215–5225. [Google Scholar] [CrossRef]
  22. Liu, J.; Yang, L.; Fang, X.; Li, B.; Yang, Y.; Fang, L.; Hu, Z. Numerical Simulation and Optimization of Shell Mould Casting Process for Leaf Spring Bracket. China Foundry 2020, 17, 35–41. [Google Scholar] [CrossRef]
  23. Beeley, P. Foundry Technology, 2nd ed.; Butterworth-Heinemann: Madras, India, 2001. [Google Scholar]
  24. Jain, P.L. Principles of Foundry Technology, 5th ed.; Tata McGraw-Hill: New Delhi, India, 2009. [Google Scholar]
  25. Wlodawer, R. Directional Solidification of Steel Castings; Pergamon Press: Oxford, UK, 1966. [Google Scholar]
  26. Campbell, J. Castings, 2nd ed.; Elsevier Butterworth-Heinemann: Cornwall, UK, 2003. [Google Scholar]
  27. Campbell, J. Castings Practice. The 10 Rules of Castings; Elsevier Buttherworth-Heinemann: King’s Lynn, UK, 2004. [Google Scholar]
  28. Steel Founders’ Society of America. Feeding & Risering Guidelines for Steel Castings; Steel Founders’ Society of America: Crystal Lake, IL, USA, 2001. [Google Scholar]
  29. Altair, Altair Inspire Cast Version 2022.1.1; Altair Engineering Inc.: Troy, MI, USA, 2022.
  30. Spittle, J.A.; Brown, S.G.R.; Sullivan, J.G. Application of Criteria Functions to the Prediction of Microporosity Levels in Castings. In Proceedings of the Fourth Decennial International Conference on Solidification Processing, Sheffield, UK, 7–10 July 1997; pp. 251–255. [Google Scholar]
  31. Viswanathan, S.; Apelian, D.; Donahue R., J.; DasGupta, B.; Gywn, M.; Jorstad, J.L.; Monroe, R.W.; Sahoo, M.; Prucha, T.E.; Twarog, D. ASM Handbook, 9th ed.; ASM International: Materials Park, OH, USA, 2008; Volume 15. [Google Scholar]
  32. Pellini, W.S. Factors which Determine Riser Adequacy and Feeding Range. Am. Foundrymen’S Soc. Trans. 1953, 61, 61–80. [Google Scholar]
  33. Li, J.; Chen, R.; Ma, Y.; Ke, W. Characterization and Prediction of Microporosity Defect in Sand Cast WE54 Alloy Castings. J. Mater. Sci. Technol. 2014, 30, 991–997. [Google Scholar] [CrossRef]
  34. Carlson, K.D.; Beckermann, C. Use of the Niyama Criterion to Predict Shrinkage-Related Leaks in High-Nickel Steel and Nickel-Based Alloy Castings. In Proceedings of the 62nd SFSA Technical and Operating Conference; Steel Founders’ Society of America, Crystal Lake, IL, USA, 2008; Available online: https://user.engineering.uiowa.edu/~becker/documents.dir/sfsa/2008-5.6_nileakers.pdf (accessed on 10 August 2023).
  35. Kang, M.; Gao, H.; Wang, J.; Ling, L.; Sun, B. Prediction of Microporosity in Complex Thin-Wall Castings with the Dimensionless Niyama Criterion. Materials 2013, 6, 1789–1802. [Google Scholar] [CrossRef] [PubMed]
  36. Liotti, E.; Previtali, B. Study of the Validity of the Niyama Criteria Function Applied to the Alloy AlSi7Mg. La Metall. Ital. 2006, 9, 33–37. [Google Scholar]
  37. Jeancolas, M. Donnés Générales Sur Le Masselottage Des Piéces Molées En Sable. Fonderie 1961, 341, 43–56. [Google Scholar]
Figure 1. Sand casting system to obtain a low-carbon steel bar.
Metals 13 01777 g001
Figure 2. Solid fraction evolution considering two reference values that establish the SF limit above which no liquid transport is allowed: (a) SF reference value equals 0.70 and (b) SF reference value equals 0.90.
Metals 13 01777 g002
Figure 3. Three different instants of the solid fraction evolution analysis taking into consideration an SF reference value of 0.30. The red laces indicate isolated regions with an SF lower than 0.30 during the solidification.
Metals 13 01777 g003
Figure 4. Metal cooling temperature curves and Niyama value evolution for the different points 1 to 7 (ag) of the casting system (h); (i) indicates the Ny values corresponding to every point at the temperatures of T N y 0.8 , T N y 0.85 , T N y 0.9 and T N y 0.95 .
Metals 13 01777 g004aMetals 13 01777 g004b
Figure 5. Porosity mapping with the areas that present an empty volume of at least (a) 10%, (b) 20%, (c) 50% and (d) 100%.
Metals 13 01777 g005
Figure 6. Microporosity mapping. (a) The microporosity areas contain at least 0.04% of empty volume; (b) capture for a level of 0.012% empty areas. The maximum empty volume is 0.13% for only two punctual areas in the bar.
Metals 13 01777 g006
Table 1. Thermal properties of the green sand mold considered in FEM simulation (from Materials library of Inspire Cast) [29].
Thermal Conductivity
W/(m K)
Conductive Heat Transfer Coefficient
W/(m2 K)
Convective Heat Transfer Coefficient
W/(m2 K)
0.5 from 298.15 to 473.15 K4001000
0.51 at 673.15 K
0.59 at 973.15 K
0.77 at 1273.2 K
Table 2. Chemical composition (% weight) of 1.0331 carbon steel.
CSiMnPS
≤0.10Traces0.30–0.600.0450.045
Table 3. Thermal conductivity of 1.0331 carbon steel (Materials library of Inspire Cast) [29].
Thermal Conductivity
(W/(mK)
27.6 at 1123 K
27.2 at 1223 K
28.85 at 1323 K
29.85 at 1423 K
29.7 at 1523 K
29.85 at 1723 K
30 at 1873 K
Disclaimer/Publisher’s Note: The statements, opinions and data contained in all publications are solely those of the individual author(s) and contributor(s) and not of MDPI and/or the editor(s). MDPI and/or the editor(s) disclaim responsibility for any injury to people or property resulting from any ideas, methods, instructions or products referred to in the content.

