Article

Probing Localised Corrosion Inhibition of AA2024-T3 by Integrating Electrode Array, SVET, SECM, and SEM-EDS Techniques

1
School of Engineering, Faculty of Science and Technology, Waurn Ponds Campus, Deakin University, Geelong, VIC 3216, Australia
2
Institute of Frontier Materials, Waurn Ponds Campus, Deakin University, Geelong, VIC 3216, Australia
3
Commonwealth Scientific and Industrial Research Organisation (CSIRO), Mineral Resources Flagship, Normanby Rd, Clayton, Melbourne, VIC 3169, Australia
*
Author to whom correspondence should be addressed.
Metals 2023, 13(10), 1703; https://doi.org/10.3390/met13101703
Submission received: 25 August 2023 / Revised: 27 September 2023 / Accepted: 30 September 2023 / Published: 6 October 2023

Abstract

:
This work demonstrates an approach towards the understanding of multi-scale and open-circuit localised electrochemical processes of AA2024-T3 in the presence and absence of an environmentally friendly rare-earth inhibitor; cerium diphenyl phosphate (Ce(dpp)3). At high temporal resolution, a wire bean electrode (WBE) made from 100 identical AA2024-T3 wires revealed sudden increases in galvanic anodic and cathodic activities immediately after dosing of 50 and 100 ppm of the inhibitor and an overall suppression of macro-scale activities by increasing the inhibitor concentration to 200 ppm, suggesting it as a fast-screening tool for inhibitors and measuring inhibition efficiency. At high spatial resolutions, scanning probe electrochemical techniques confirmed local activation of corroding microstructures on individual AA2024-T3 wires similarly by dosing the inhibitor up to 100 ppm. In agreement with WBE findings, the effective shutdown of both anodic and cathodic activities occurred after increasing the inhibitor concentration to 200 ppm confirming the optimal concentration of the Ce(dpp)3 and the mixed mode inhibition mechanism of this selected inhibitor on AA2024-T3.

1. Introduction

Localised corrosion of heterogeneous alloys is known to initiate from pre-existing multi-scale inhomogeneities such as intermetallic particles, inclusions, and secondary constituent phases present on alloy surfaces [1,2]. For instance, the high-strength AA2024-T3 contains complex microstructural features from nano to macro scales known to be prone to corrosion initiation followed by propagation, leading to weakening and deterioration of the alloy’s structural integrity [3]. It is also known that corrosion initiation and propagation are associated with dynamic changes in solution chemistry over anodic and cathodic zones located on different areas of the corroding alloy surface. In order to inhibit localised corrosion, corrosion inhibitors should have the capacity to interact over various lengths and time scales to match those time-dependent processes occurring on alloy surfaces. Environmentally friendly rare earth (RE) compounds have demonstrated complex multiscale interactions when inhibiting corrosion reactions on aluminium alloys, for instance, AA2024-T3 [4,5,6,7,8,9,10,11,12,13,14,15,16,17,18,19,20].
One generally accepted inhibition mechanism by RE-salts is the formation of RE oxides/hydroxides over cathodically active sites, such as intermetallic particles (IMPs), that leads to a decrease in the rate of oxygen reduction reaction generally represented as O2 + 2H2O +4e → 4OH [21], thereby providing cathodic inhibition [8,22]. Inhibition of anodic reactions such as trenching, intergranular corrosion (IGC), and pitting is also possible for some RE-chemicals during immersion of AA2024-T3 in chloride solution. For example, Garcia et al. [23] showed by comparing cerium chloride (CeCl3) with cerium dibutyl phosphate (Ce(dbp)3) that CeCl3 offers cathodic inhibition of Cu-rich areas independently of the Cu content and immersion time but Ce(dbp)3 provides a combined anodic and cathodic inhibition through cerium oxide/hydroxide formation on Cu-rich areas as well as dibutyl phosphate (dbp) coverage of the overall surface. They also pointed out that such bi-functional inhibition can limit the formation of characteristic corrosion signatures on AA2024-T3 such as plumes of corrosion products associated with S-phase de-alloying and corrosion rings, whereas this mechanism cannot potentially happen in the presence of CeCl3. Thus for RE-organic inhibitors, e.g., Ce(dbp)3, the organic anion suppresses anodic activity thus reducing the total and localised corrosion of AA2024-T3 via a mechanism where the phosphate-containing dbp reacts with Al-OH2+ and Al-OH2+ at the surface forming a film [23]. In addition to the above inhibitors, mischmetal mixtures of RE compounds have also revealed synergistic inhibition properties compared to some individual RE-organic compounds like cerium diphenyl phosphate (Ce(dpp)3) [24]. This is proposed to be due to different stability regions for different RE compounds. On the other hand, many of the RE complexes only show mixed inhibition after longer exposure times, which has been attributed to solubility and speciation effects. For instance, cerium nitrate (Ce(NO3)3) where the nitrate anion provides some anodic inhibition to aluminium alloys [25], shows mixed inhibition after 30 min exposure, indicating that both the Ce and the NO32− ions are operating as cathodic and anodic inhibitors after a period of exposure [26].
Extensive studies have been carried out over previous years on the corrosion inhibition of AA2024-T3 by RE inhibitors [8,9,10,11,12,13,14,15,16,17,18,19,20] using a range of electrochemical techniques including standard electrochemical techniques, volta potential methods (e.g., scanning Kelvin probe (SKP)), scanning vibrating electrode technique (SVET), scanning electrochemical microscopy (SECM) and electrochemically integrated multi-electrode arrays (also known as wire beam electrode (WBE)) under different environmental conditions. Many of the past studies have examined corrosion in the presence of the inhibitors under electrochemical polarisation conditions, not under open circuit potential (OCP) corrosion conditions. Consequently, knowledge gaps still exist on the dynamic and complex mechanisms of multiscale corrosion and inhibition mechanisms of Al alloys.
Probing multiscale localised corrosion and inhibition mechanisms and processes is a technological challenge because most of the available methods are applicable only to measure electrochemical corrosion processes over a limited time and length scales and have difficulties in providing an overall and complete view of the corrosion inhibition processes occurring over different length and time scales [27]. This paper reports an approach to address this issue by means of the combined use of the electrode array, electrochemical scanning probes and surface analytical techniques. A series of experiments have been carried out to demonstrate an approach to probing complex and multiscale localised corrosion inhibition processes and mechanisms. Electrochemical and characterisation techniques have been employed to investigate multiscale (tens of microns to millimeters) corrosion events with a specific focus on localised corrosion and inhibition processes such as macro/micro galvanic interactions (via WBE and SVET) or oxygen reduction reaction (via SECM) supported by ex-situ surface characterisation via using scanning electron microscope/energy-dispersive X-ray spectroscopy (SEM-EDS). Corrosion and the localised interaction of Ce(dpp)3 with heterogeneous microstructures of the actively corroding AA2024-T3 have been investigated by multiscale analysis of various electrochemical processes. An AA2024-T3 wire was selected due to its high-strength, complex microstructure and its importance in the aerospace industry. The inhibitor cerium diphenyl phosphate, Ce(dpp)3, is studied in this research as an example of an environmentally friendly inhibitor that is known to be an efficient corrosion inhibitor for Al alloys, especially Al-Cu-Mg alloys (e.g., AA2024-T3) [10,11,12,16,17,18,20,28].

2. Experimental

2.1. Materials

The material used for all experiments was a 1 mm diameter extruded wire of AA2024-T3 which was obtained from California Fine Wire (Grover Beach, CA, USA). The nominal chemical composition of the wire was carried out and provided by the manufacturer (using emission spectrometry) representing major constituent elements as (values in weight %): Cu (4.43), Mg (1.69), Mn (0.64), Fe (0.30), Si (0.11), Zn (0.13), Ti (0.03), Cr (0.02) and Al (balance). The complex microstructure of the wire typical of wrought AA2024-T3 alloys has been extensively studied by the authors in previously published works [3].

2.2. Solution and Sample Preparation Procedures

For corrosion studies, analytical grade sodium chloride (NaCl) was obtained from Merck (Macquarie Park, NSW, Australia) to prepare 0.05 M NaCl solution by dissolving the required amount of salt in distilled water. For inhibition studies, a laboratory-synthesised Ce(dpp)3.xH2O was used (for synthesis details see [24]). For WBE, SVET, and SECM experiments, a concentrated 400 ppm Ce(dpp)3 in 0.05 M NaCl solution was prepared as the base solution to use for inhibitor dilution purposes. Using the dilution equation, C1V1 = C2V2, test solutions were prepared at final concentrations of 50, 100, and 200 ppm of Ce(dpp)3.xH2O in 0.05 M NaCl aqueous solution. For SVET, SECM, and immersion experiments, short lengths of the wire material (∼15 mm) were cut and cold-mounted in a standard mixture of epoxy resin and hardener (in a 7:1 weight ratio) purchased from Struers. The electrical connection was achieved by gluing a 1.5 mm copper wire to the AA2024-T3 wire using a fast-curing adhesive silver purchased from Agar Scientific. For corrosion experiments, specimens were wet ground on SiC papers to 4000 grit size. Samples were then rinsed with ethanol and finally dried using compressed air before storing in a desiccator. Electrochemical experiments were performed in an open-to-air condition at ambient temperature.

2.3. WBE Experiments

In this study, WBE is used for rapid screening of the effectiveness of various inhibitor concentrations and the selection of the optimum concentration required for the suppression of anodic and cathodic reactions. The WBE sensor consists of a 10 × 10 array of identical AA2024-T3 wires closely packed together (Figure 1) which is connected to the multiplexer through data cables. This configuration can be considered as a model for a one-piece metal/coupon surface, or a group of stranded wires (for instance used in automobile industries). Multiplexer and pontentiostat (Gill AC by ACM Instruments, Aynsome Ln, Cartmel, UK) details and parameters setup are explained in the recent work by authors [27].

2.4. SVET Experiments

Herein, SVET was used to probe the micro-scale distribution of local anodes and cathodes. SVET ionic potential maps were acquired on transverse cross-sections of AA2024-T3 wires exposed to 0.05 M NaCl solution with and without inhibitor at different exposure times. Figure 2a shows the SVET experimental setup including a three-dimensional (3D) closed-loop Piezo positioner, electrometer head, the SVET platinum (Pt) probe, the stage, and the corrosion cell. The SECM probe fixture was mounted and levelled on the same electrometer head to avoid changing the electrometer for SECM measurements. A 5-axis goniometer was used as the stage to precisely level specimens at almost zero backlash during the SVET and SECM experiments. A transparent corrosion cell (with a cell volume of about 10 mL) was used to allow precise levelling and tip positioning. The scanning probe station, model M370 (manufactured by Uniscan Instruments Ltd., Buxton, UK), was used for SVET and SECM analysis. The SVET microprobe used in this work was a polymer-insulated Pt/Ir microelectrode provided by Bio-Logic Science Instruments. The probe was platinised, resulting in a 20 μm diameter platinum black sphere electrodeposited at the tip.
The SVET measurements were conducted with the probe vibrating at 80 Hz (adjusted reference phase of 335°) in a plane perpendicular to the sample with a 20 μm amplitude at a height of 70 μm (using a 100 µm metal gauge) and at a stepwise scan rate of 50 μm/s while the return velocity after each line scan was adjusted to a constant value of 300 μm/s for all experiments. For each data point along the scan line, the ionic potential value was averaged over 0.5 s before moving to the next point. A standard method [29] was used to convert the SVET ionic potential values into ionic current values by injecting various current values to a point-in-space (PIS) sample (a 200 μm diameter gold wire) and mapping the resultant potential responses using the same scanning parameters as discussed above. Figure 2b shows a graph of applied current values acquired for the PIS sample versus maximum absolute potential values measured with SVET which were used to calculate the ionic resistance (slope of the fitted line). As seen, data points in Figure 2b show a linear behaviour, therefore, the calculated ionic resistance can be reliably used for the potential conversion method. Insets show ionic potential maps from which maximum potential values were calculated for each polarisation current. The ionic resistance of the solution was calculated to be R = 1.3 ± 0.1 Ω using Ohm’s law where the y-intercept is very close to zero. This conversion method (at constant tip-to-surface distances) is reported to be effective for a fresh solution with a well-defined conductivity [30]. However, in the current research, it is assumed that the calculated ionic resistance of the solution is similar to the ionic resistance within a hydrous oxyhydroxide layer in the vicinity of active corroding sites.

2.5. SECM Experiments

Localised oxygen reduction reactions (ORR) at the metal/electrolyte interface were imaged using SECM by maintaining the ultra-microelectrode (UME) tip in close proximity to the corroding surface. Here, the redox competition mode using dissolved oxygen in the solution was used while the sample was kept at its free corrosion potential. The ORR was monitored by measuring the faradaic current at the UME with a bias around −0.6 V (vs. Ag/AgCl) where the charge transfer reaction is via a four-electron oxygen reduction reaction (Figure 3a). For a UME with an inherent RG value (the ratio of the insulating-shield thickness to the Pt electrode radius), measured current values at the UME will depend on the relative RG value. Therefore, prior to SECM scanning, the following standard procedures [31,32] were employed to characterise the given UME used in this work. These procedures involved two experimental steps: (i) A cyclic voltammogram was performed in the bulk of electrolyte solution using the UME tip as the working electrode (see Figure 3a); (ii) A UME approach curve towards the substrate surface (here the insulator) was measured (see Figure 3b).
In this work, SECM measurements were carried out using the scanning electrochemical workstation M370 in 0.05 M NaCl solutions with and without inhibitor. A Pt-disk UME of 10 μm diameter was used as the working electrode to which a biased potential was applied (see inset graphic Figure 3a). To complete the electrochemical cell, an Ag/AgCl (saturated KCl) electrode was used as the reference electrode, and a 10 × 20 mm thin Pt foil was used as the counter electrode. Figure 3a shows voltammograms acquired in 0.05 M NaCl solution, with potential swapped between 0.4 V (vs. Ag/AgCl) and −1.2 V (vs. Ag/AgCl) at a scan rate of 0.01 V/s. Prior to each scanning experiment the tip-to-sample distance was established by performing approach curves over the insulator sufficiently close to the wire/epoxy interface. Figure 3b shows an example of a typical approach curve (scan rate—10 μm/s) displaying negative-feedback behaviour. Calculation and presentation of a theoretical approach curve using normalised current and distance values were achieved by measuring the kinetics of oxygen diffusion at the UME tip. Generally, an approach curve will show a negative-feedback behaviour when the tip approaches a non-conductive substrate (i.e., epoxy) and the oxygen diffusion is blocked due to the proximity of the surface. Under a diffusion control process, the limiting current (iL) at the UME tip can be estimated using the following equation; Equation (1) [33]:
i L = 4 n F D O 2 C O 2 r
where n is the number of electrons transferred during the oxygen reduction reaction, F is the Faraday constant, DO2 is the diffusion coefficient of dissolved oxygen in water (2.01 × 10⁻⁹ m2/s [33]), CO2 is the dissolved oxygen concentration (~0.22 mM for a 0.05 M NaCl solution [33]), and r is the radius of the UME tip. For all SECM experiments, the mapping was performed at a tip-to-sample distance of 15 μm.
Similar to SVET experiments, a stepwise scan rate of 50 μm/s was used for probing while the return velocity after each line scan was adjusted to a constant value of 300 μm/s. The recorded current values were averaged for 0.5 s before moving to the next point at each point along the scan. It should be noted that at this scan rate, a full quantification of the surface activity may not be achieved as the scan rate may exceed the mass diffusion coefficient of redox species. However, since localised corrosion processes develop quickly on the heterogeneous surface of the AA2024-T3 wire, slow scan rates may mean that some fast-developing localised events may not be captured on time.
Figure 4a shows the normalised (blue curve plotted by using Equation (1)) and un-normalised (i.e., raw data shown as the inset curve) SECM approach curves towards the epoxy surface measured at the UME in 0.05 M NaCl solution at the scan rate of 10 μm/s. To achieve the most effective tip-surface distance, the experimental approach curves were normalised. Based on the results shown in Figure 4a, a tip-surface distance of 15 μm was chosen for scanning. Figure 4b shows the potentiostatic measurement of the UME current at −0.6 V (vs. Ag/AgCl) applied potential, in the absence and presence of 200 ppm Ce(dpp)3. The result shows that the UME current drops to about 0.15 nA after the addition of the inhibitor and remains nearly constant during 10 min of exposure which indicates no significant “poisoning effect” (i.e., fouling of the UME tip). This effect would be even smaller on a moving UME tip due to induced shear forces on the tip surface.

2.6. Optical Microscopy Investigations

Localised electrochemical processes over the WBE surface were monitored in-situ by video capturing using a stereomicroscope (Olympus, Notting Hill, Australia) to investigate the site-specific corrosion activities prior to and after inhibitor addition.

2.7. SEM-EDS Characterisations

An SEM, JSM-IT300, equipped with EDS (JEOL Ltd., Sydney, Australia) was utilised for surface characterisation of all post-corrosion WBE, SVET, and SECM test specimens. The SEM-EDS analysis was conducted using a beam accelerating voltage of 15 kV and a working distance of 12 mm desirable for secondary electron (SE), backscattered electron (BSE), and EDS. To understand the sub-surface attack morphology, several consecutive ultra-fine grinding stages were performed using 12,000 micro-mesh cushioned abrasive papers. After each grinding stage, the sample was rinsed with ethanol and dried.

3. Results and Discussion

3.1. WBE Investigations on the Millimetre Scale

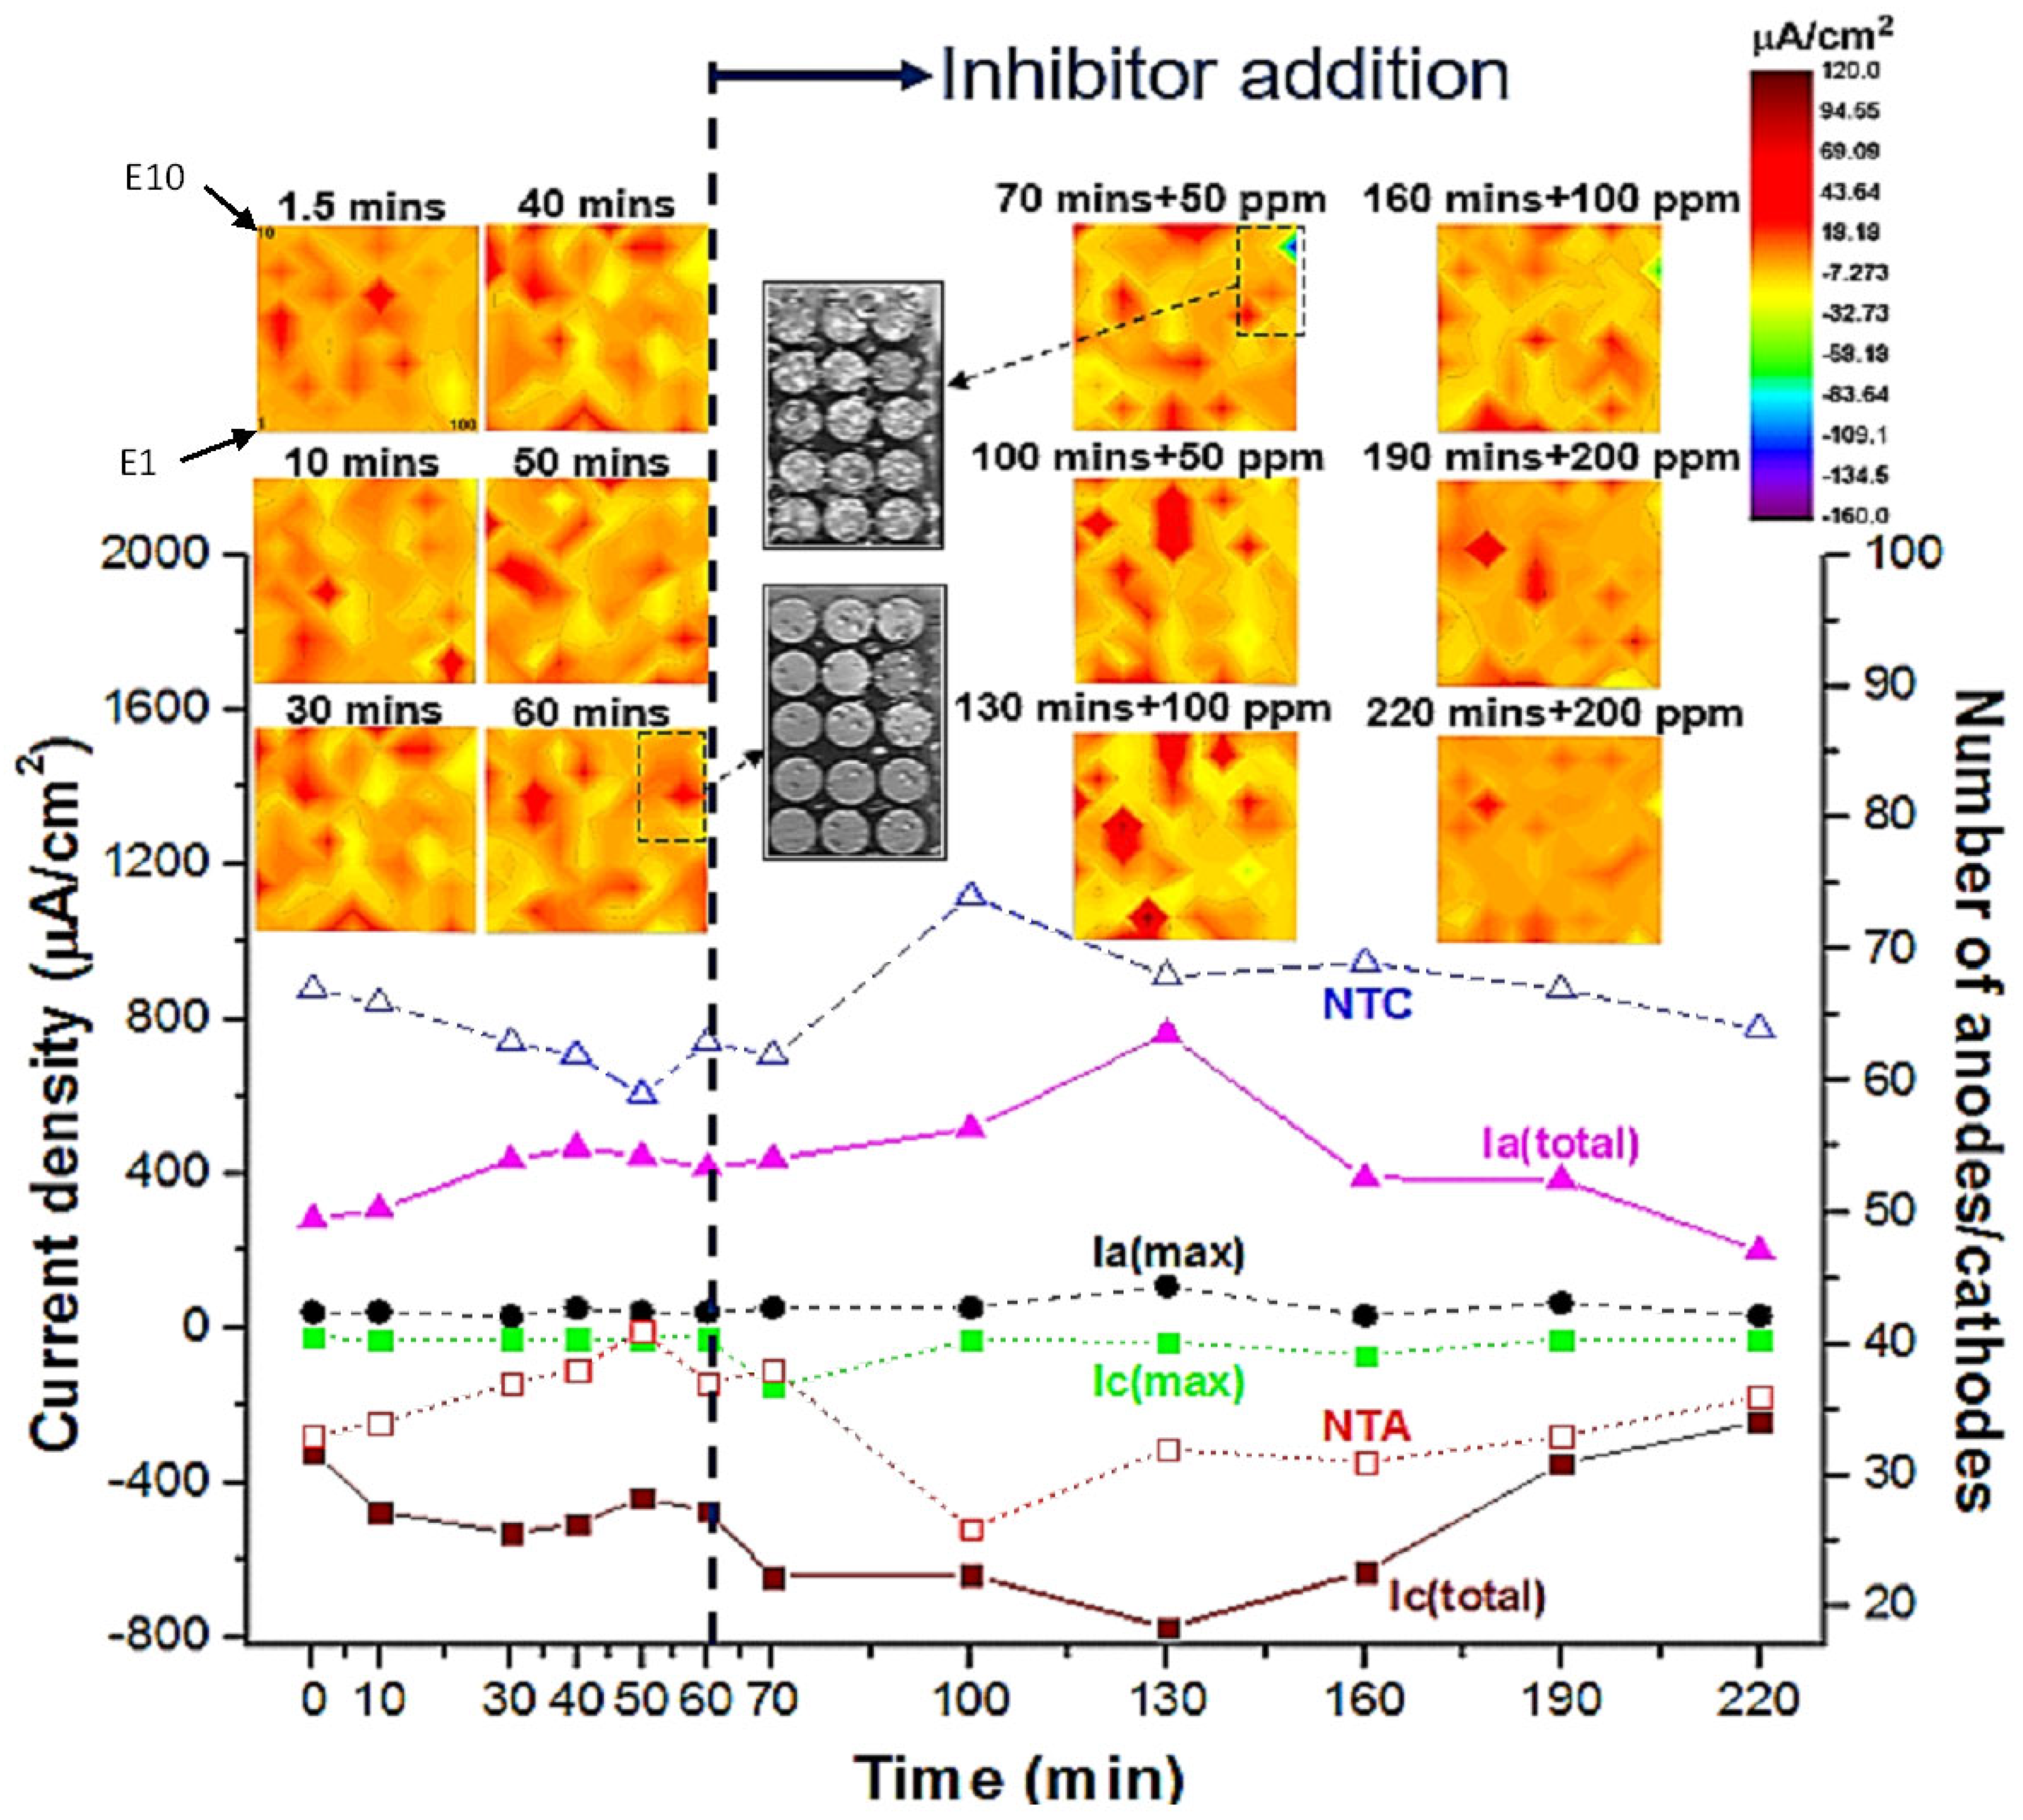
Figure 5 shows galvanic current density maps (net values) over the WBE surface that were recorded after 1.5, 10, 30, 40, 50, and 60 min exposure in 0.05 M NaCl solution without inhibitor and after 70, 100, 130, 160, 190 and 220 min with inhibitor addition. From these maps, it can be seen that anodic and cathodic areas initiated and terminated dynamically after inhibition addition at 70 min, suggesting localised corrosion inhibition took place over a range of time and length scales. As can be seen from the current density maps, prior to the addition of the inhibitor, the overall cathodic activity of the WBE is more widespread during the first 1.5 min than for longer exposure times with nearly 70% of the electrodes behaving as net cathodes. After 10 min of immersion, a random distribution of anodes and cathodes among wires becomes apparent. After 30 min of immersion, strong anodes are observed some of which become stable since they persist to 40, 50, and 60 min of immersion times. Some of these anodes comprise four or more electrodes and are surrounded by multiple wires acting as net cathodes. Such distribution of net anodes and cathodes is on a much larger scale (several mm) than the scale at which localised corrosion initiation occurs.
In order to quantify the time and spatial dependent variations in the degree of localisation of corrosion reactions, parameters including maximum anodic current (Ia(max)), maximum cathodic current (Ic(max)), total anodic current (Ia(total)), total cathodic current (Ic(total)), number of total anodes (NTA) and number of total cathodes (NTC) have been calculated from current density maps before and after the inhibitor addition and recorded as a function of time, based on a previously reported method [27]. During the OCP corrosion period (before inhibitor addition), as shown in Figure 5, the number of cathodes NTC decreases while the NTA increases revealing the de-activation of cathodic sites likely due to the deposition of a corrosion product layer which is thought to be mainly composed of mixed oxides and hydroxides (e.g., Al-O-H-Cl). Moreover, the overall anodic activity of the WBE surface (Ia(total)) increases while the total cathodic activity of the surface (Ic(total)) also increases by the same amount to balance electrode reactions between coupled wires. By 60 min immersion, the number ratio of cathodes to anode is around 1.5. Hydrogen bubbles (100–200 µm in diameter) were found to evolve over the corroding WBE surface following 60 min of immersion. The generation of hydrogen indicates that active anodes have been driven into the surface from the base of trenches, active pits, or IGC network where they spread laterally and in-depth and remerge elsewhere on the surface, as described in other works [1,34]. As a consequence of these processes, an acidic anolyte solution forms in sub-surface occluded areas, and therefore hydrogen reduction reaction takes place in sub-surface active cathodes such as Cu build-up on pit/IGC walls behind the active attack. These are in agreement with a more detailed analysis of multiscale galvanic interactions using various-sized WBEs reported in the authors’ recent work [27].
After 60 min initial OCP corrosion immersion, inhibitor Ce(dpp)3 was added to the base NaCl electrolyte to make up inhibitor concentrations of 50, 100, and 200 ppm. Inhibitor dosing was conducted at 65, 125, and 185 min with a 5-min delay in recordings from the addition of inhibitor to attain good electrolyte mixing and to achieve a degree of stabilisation in surface electrochemical reactions. WBE measurements in inhibited solutions were performed at 30 min intervals with the first data recorded after 70 min of immersion. By comparing the WBE current density distribution maps in Figure 5, localised electrode activities (both anodic and cathodic) increased after adding 50 and 100 ppm concentrations of the Ce(dpp)3, suggesting corrosion acceleration immediately upon the addition of the corrosion inhibitor. This is not unusual, similar corrosion acceleration behaviour has been observed previously in different metal systems with RE salts as inhibitors [35]. This has been explained as the initial high corrosion rates required for generating a protective/passive film for later anodic inhibition. Corrosion acceleration occurred over local areas, for example, wire 39 showed the highest Ia(max) value (about 109 μA/cm2) after the addition of the inhibitor (130 min + 100 ppm). At the same time, both Ia(total) and Ic(total) increased, indicating overall activation reactions of the surface also occurred due to the inhibitor addition. After 160 min immersion both anodic and cathodic activities decreased in 100 ppm inhibitor solution, but this concentration was not enough to suppress surface activities completely. By increasing the inhibitor concentration to 200 ppm, localised anodes and cathodes reduced significantly as can be observed by comparing NTA, NTC, Ia(total), and Ic(total) values in Figure 5. As a result, only a few low-current-generating anodes (Ia(max) of about 33 μA/cm2) remained active after 220 min of immersion. Moreover, most of the anodes were confined to individual wires whereas at earlier periods the anodes comprised two or more wires. Clearly, inhibitor addition at 200 ppm suppressed the large-scale interaction of anodes and cathodes, confining activity to individual electrodes. These observations suggest a multi-time and length scale nature of localised corrosion inhibition mechanism.
Based on total anodic and cathodic current densities (Ia(total) and Ic(total)) data in Figure 5, the time-dependent inhibitor efficiency, η (%), can be calculated by means of the following equation [8]:
η x ( % ) = I x t o t a l 60   m i n I x t o t a l i n h i b i t o r I x t o t a l 60   m i n × 100
where “x” represents anodic (“a”) and cathodic (“c”) states of current density values used in Equation (2). Note that negative inhibitor efficiency values are an indication of electrochemical activation in the presence of inhibitors.
Table 1 shows the time-dependent measurement of anodic and cathodic inhibition efficiencies for Ce(dpp)3 at 50, 100, and 200 ppm concentrations. The anodic activity increased to maximum ηa = −83.5% at 130 min in the presence of 100 ppm, showing an obvious anodic activation by the inhibitor. After another 30 min of immersion (160 min in total), anodic activities declined over the WBE surface, suggesting effective corrosion inhibition (i.e., improved inhibition efficiency). On the cathodic side, 100 ppm inhibitor addition increased the cathodic activity of WBE to ηc = −33.9% up to 160 min of immersion. Since this is not as high as the anodic activity it means the inhibitor interaction over the cathodic sites is lower than the anodic sites. The maximum activation of both anodic and cathodic reactions was detected after 130 min of immersion in the presence of 100 ppm Ce(dpp)3 while both reactions were considerably de-activated after 220 min in the presence of a 200 ppm inhibitor. Both the macro scale net anodic galvanic reactions and the short-ranged anodic-cathodic activities over the most anodically active wire with the greatest number of active sites (surrounded by corrosion rings) are considerably decreased after increasing the inhibitor concentration to 200 ppm.
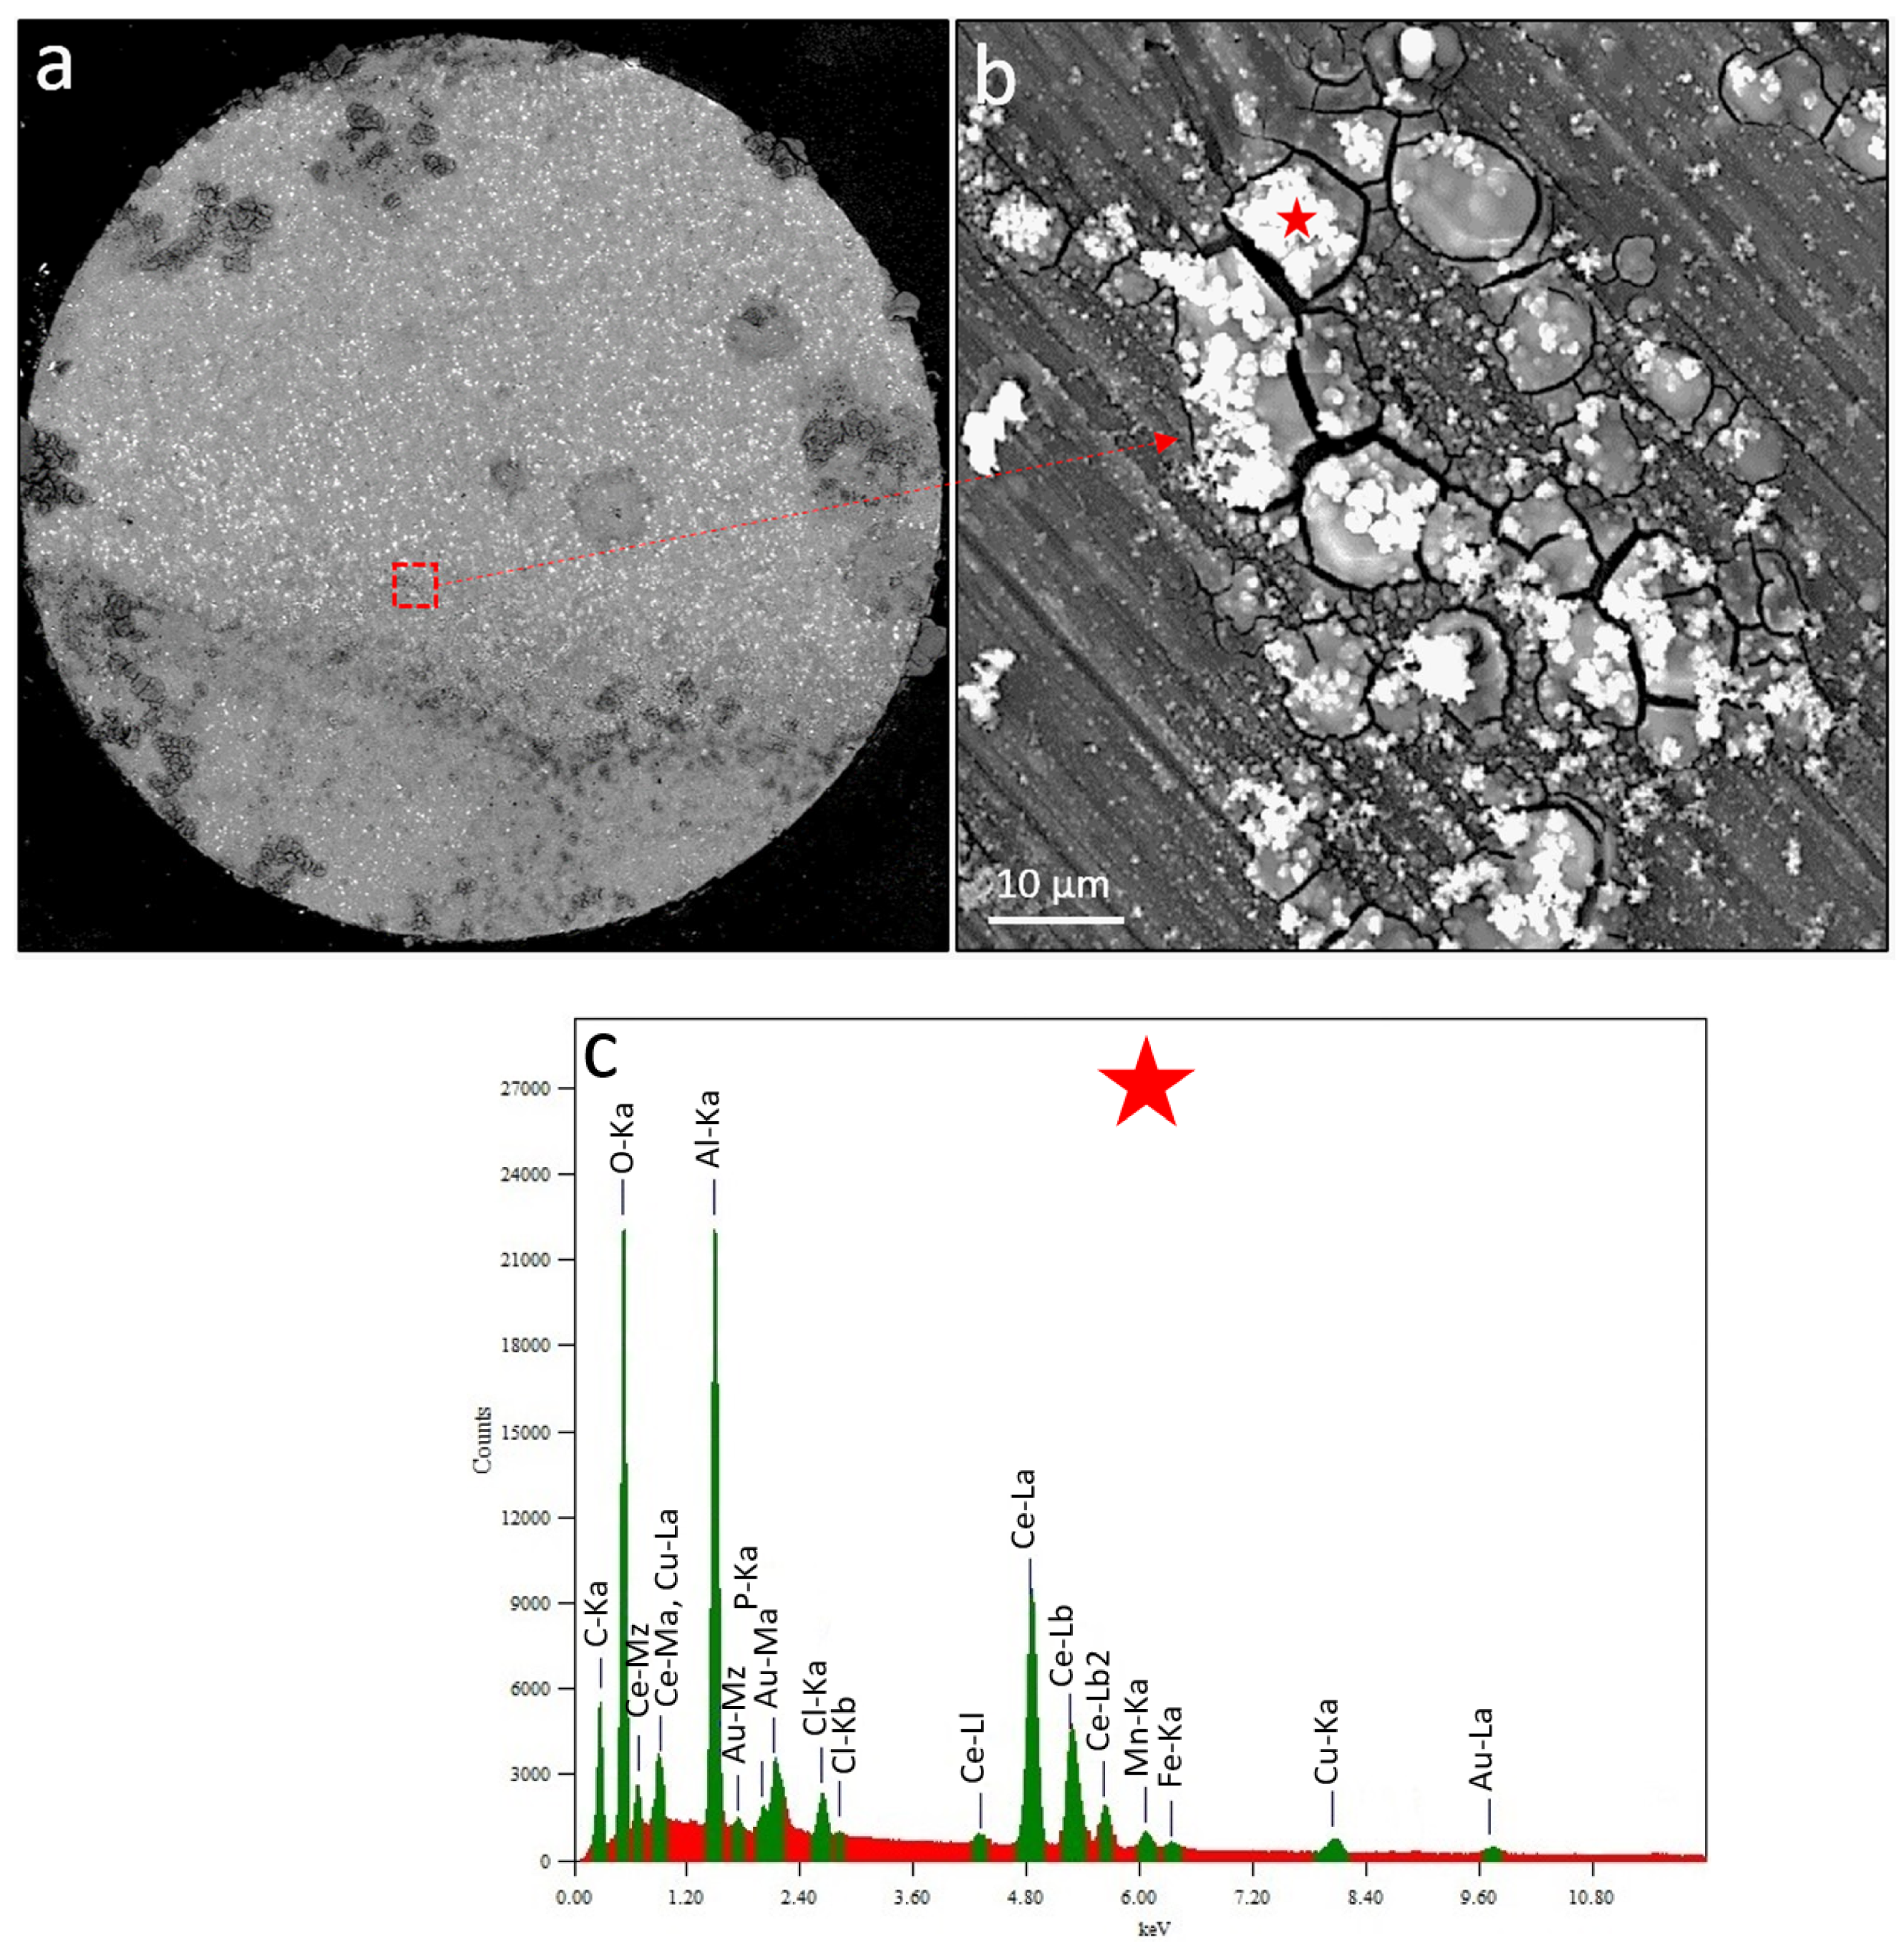
Figure 6a shows the BSE image of the corrosion morphology of the most anodic wire after test termination. Dark grey corrosion rings and bright precipitates are present on the electrode surface. Obviously, the anodic regions within large corrosion rings are less covered by inhibitor deposits as opposed to the surrounding microstructure maintaining the local cathodic currents on the wire surface. Figure 6b shows, at higher magnification, the morphology of the area which is highlighted by a red-dashed rectangle in Figure 6a. The region in Figure 6b contains a cracked cap of corrosion products (including surface oxides) partially covered by bright precipitates. EDS of the white precipitate (Figure 6c) highlighted by a red star in Figure 6b revealed Fe, Mn, Cu (probably from an underlying IMP), and O, P, Ce, and Cl-containing inhibitor precipitates formed during the inhibition process. Various researchers reported similar inhibition morphologies of corrosion products at cathodic IMPs while investigating RE mercaptoacetate [36] and diphenyl phosphate [24] inhibition on AA2024-T3. The precipitation is mainly known to be attributed to a rise in local pH causing the condensation of both aluminium and cerium products.
A combination of the WBE maps in Figure 5 and surface analytical images obviously is able to reveal many aspects of the localised corrosion mechanism. However, the mm-sized WBE method is able to probe electrochemical processes occurring only on each mm-sized wire surface, processes and mechanisms occurring over a sub-millimeter scale are not measurable. In order to investigate electrochemical processes occurring over individual wires, scanning probe techniques including SVET and SECM have been employed to probe the localised corrosion inhibition of AA2024-T3 in the presence and absence of Ce(dpp)3 inhibitor molecules.

3.2. SVET and SECM Investigations on the Micro-Meter Scale

Both SVET and SECM could provide data for exploring corrosion and inhibition reactions at selected local areas at minuscule scales on each individual wire, however, each will mechanistically reveal specific information from concurrent corrosion processes. 
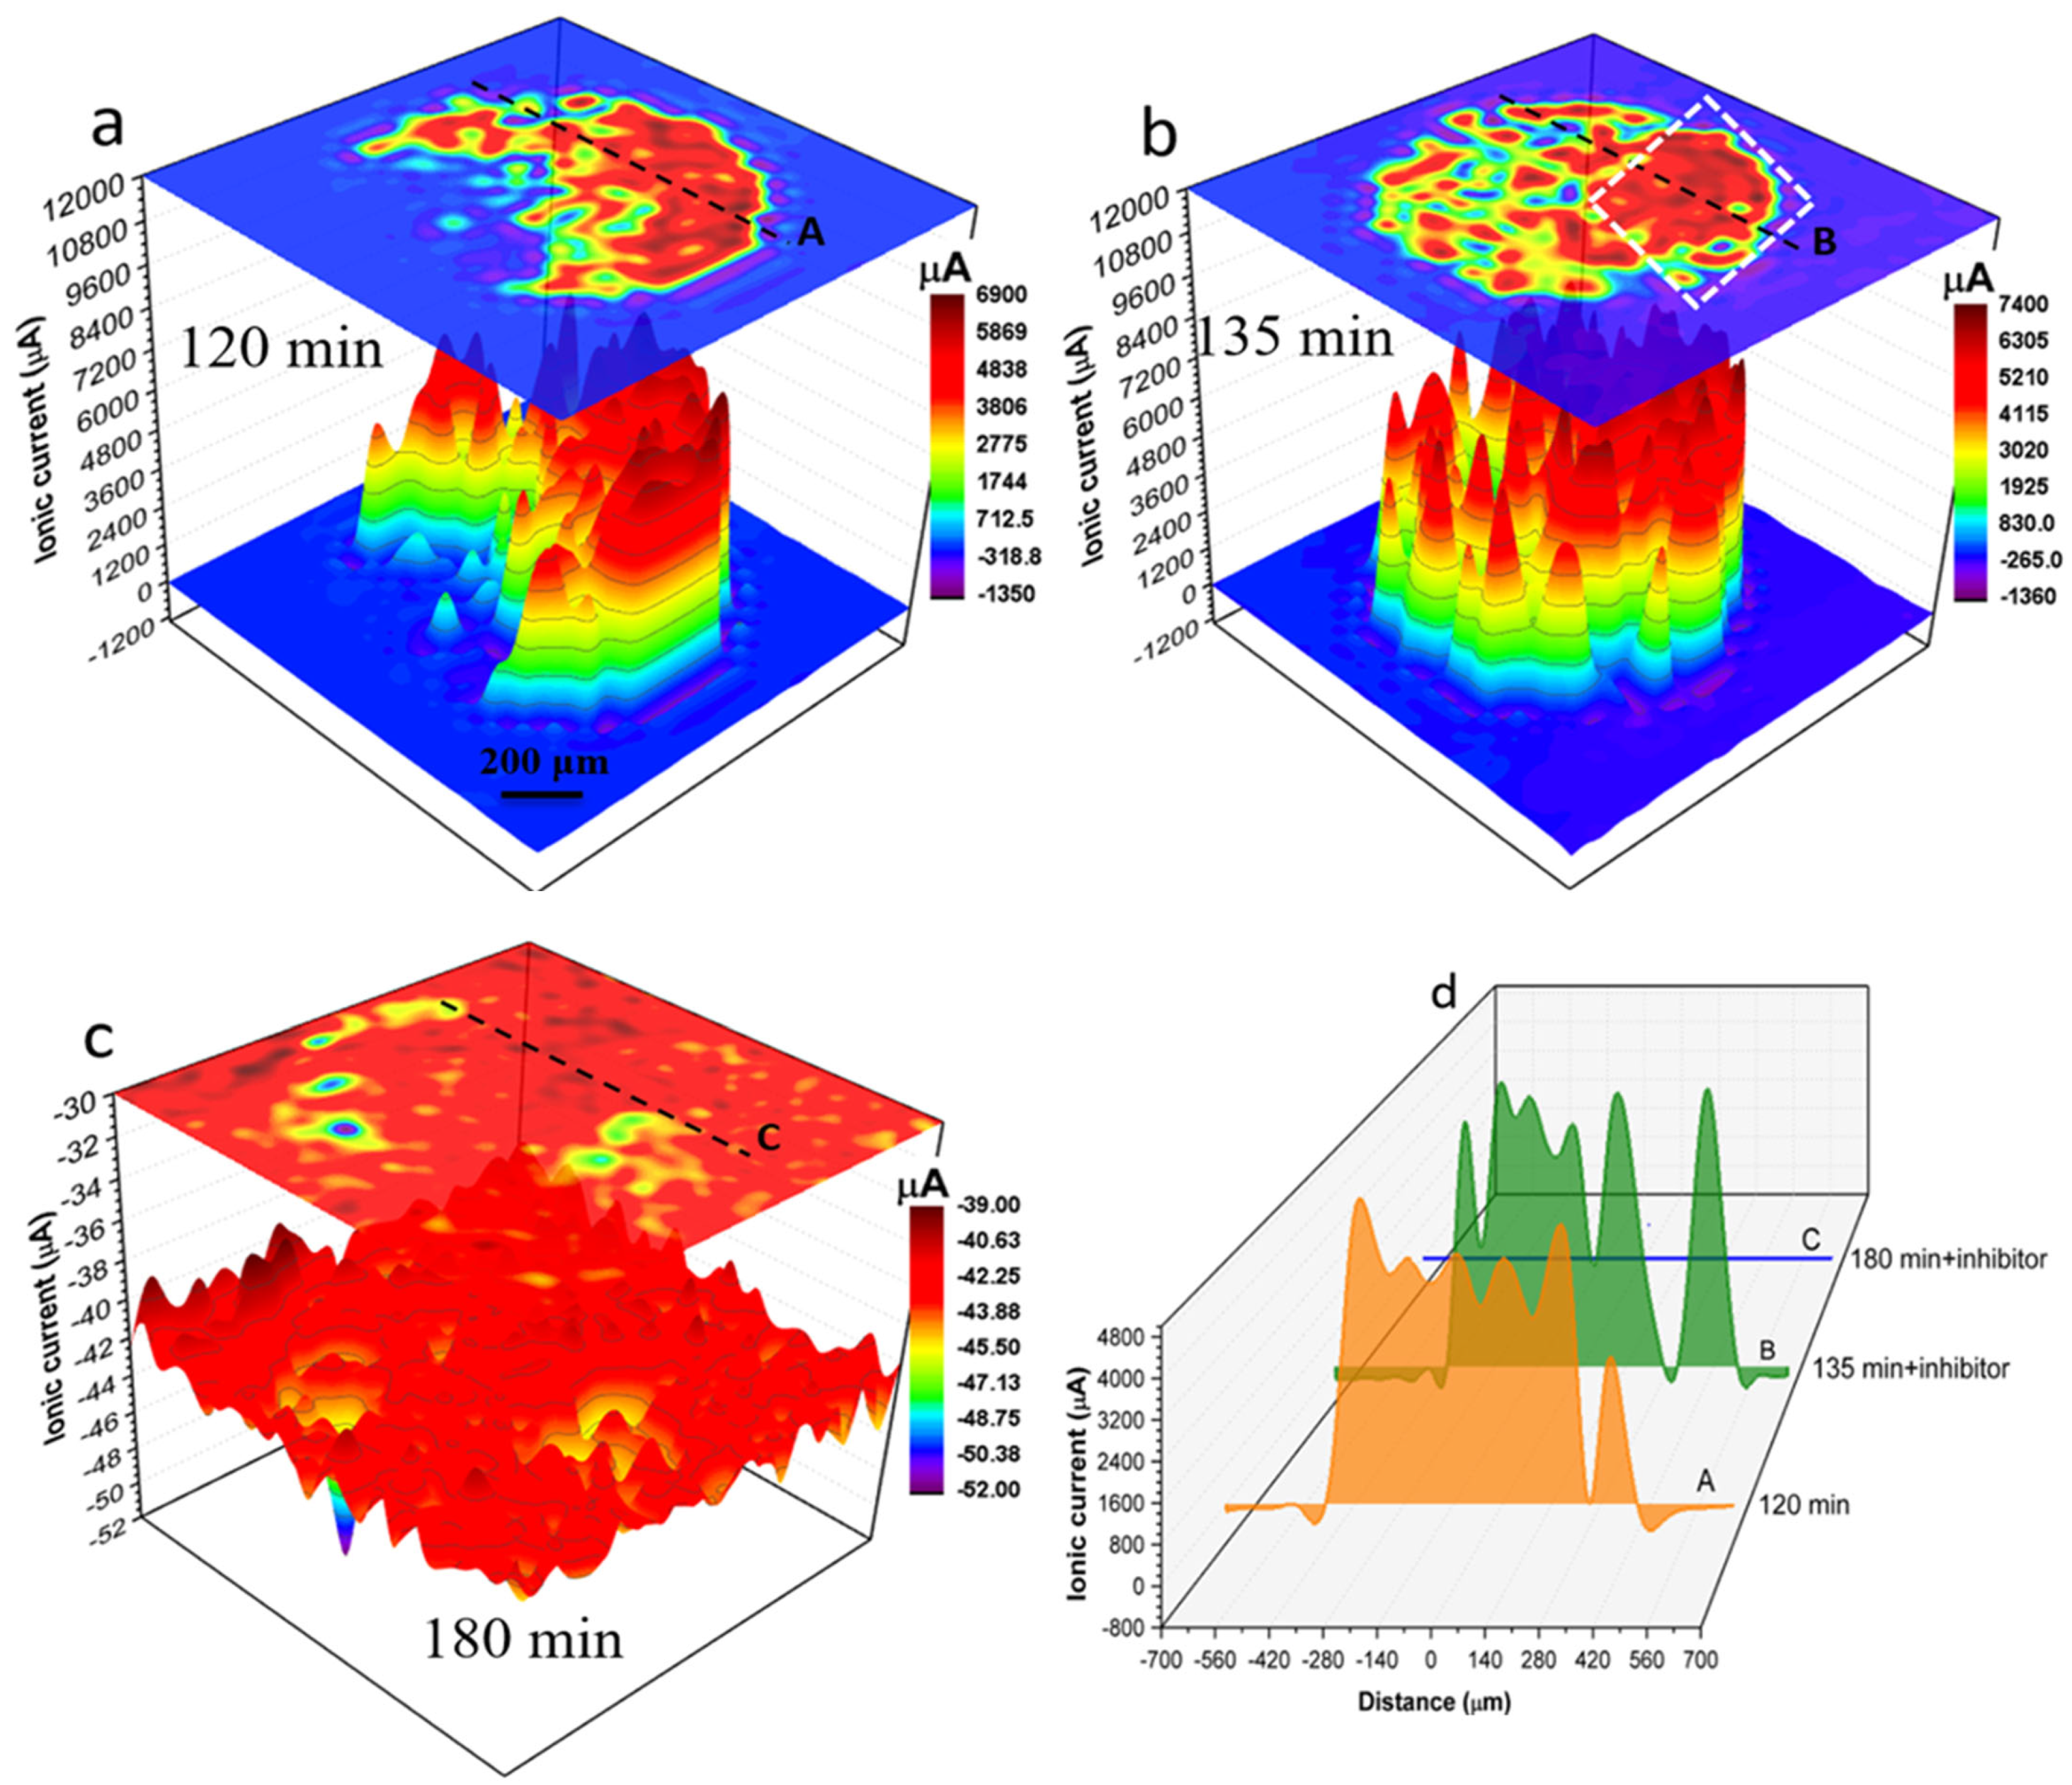
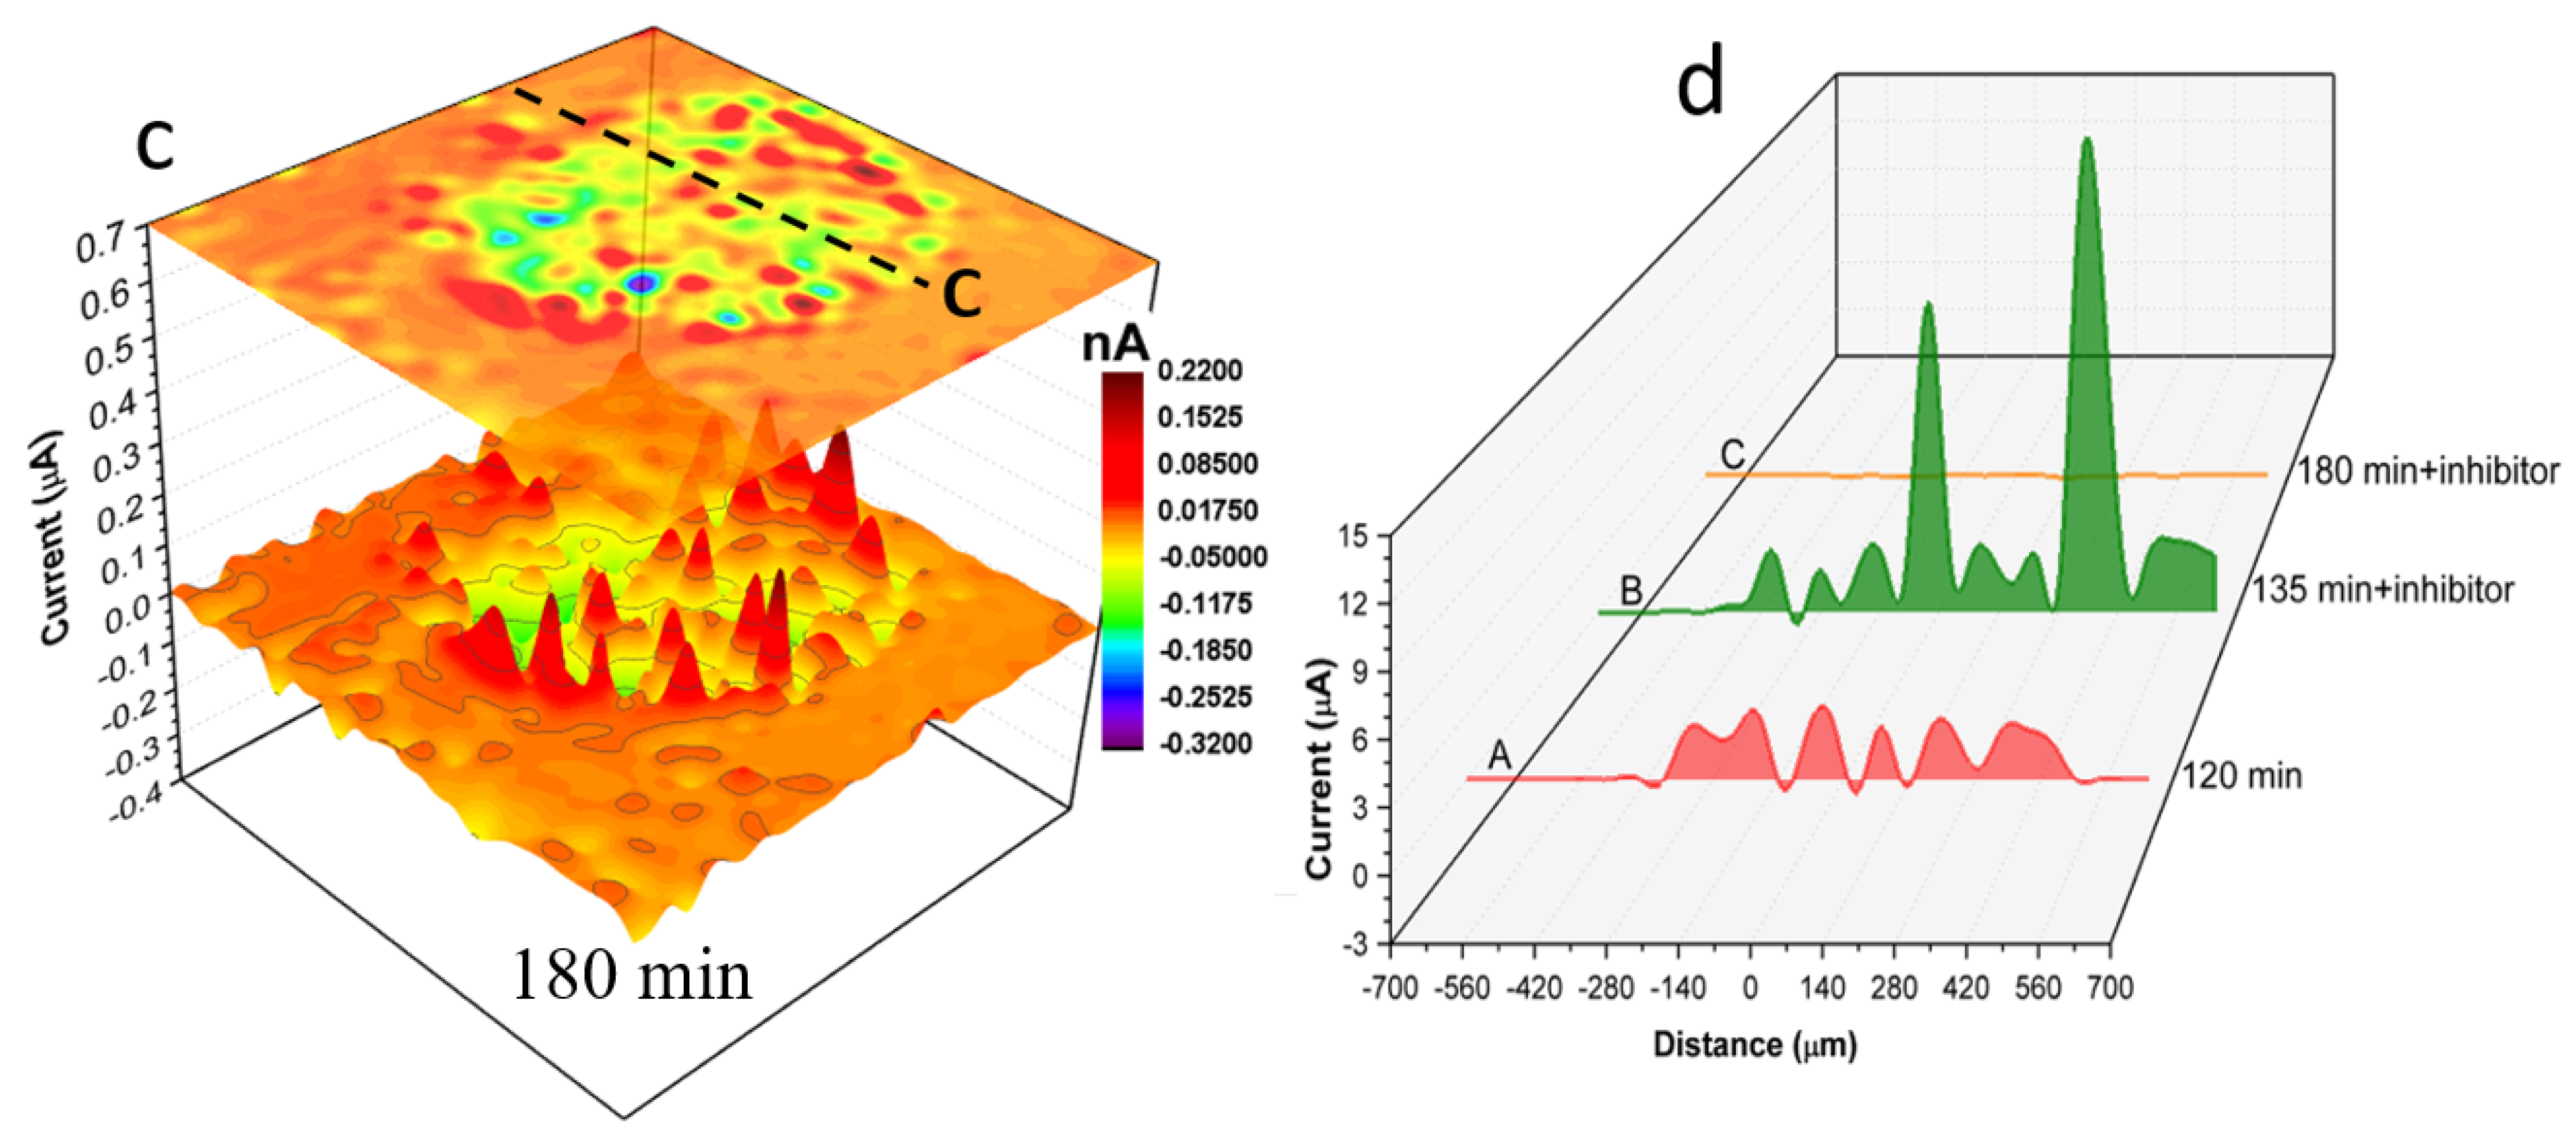
Figure 7 shows SVET ionic current distribution maps of local anodes and cathodes on the surface of the 1 mm AA2024 wire in the electrolyte without (Figure 7a) and with inhibitor (Figure 7b,c). Figure 7a shows the localised ionic current distribution map after 120 min of immersion in solution without inhibitor. Figure 7b,c show localised ionic current distribution maps at 135 min and 180 min of immersion respectively after the addition of 200 ppm Ce(dpp)3. Figure 7d shows time-dependent ionic current line profiles labelled “A” to “C” across black dashed lines shown in Figure 7a–c. After 120 min of immersion in a solution without inhibitor (Figure 7a) various active anodes and cathodes are distributed across the wire surface. The most active anodes (generating ionic currents up to 6900 μA) are located in a crescent on the right-hand side of the electrode. Moreover, a considerable localised cathodic activity (as high as −1350 μA) is detected in the vicinity of active anodes and at the wire/epoxy interface. The anodic ionic current increased to about 500 μA with the addition of the inhibitor to the electrolyte and the reaction appears localised on the right-hand side of Figure 7b. However, after an additional 45 min of exposure, the localised activity was mitigated significantly such that only a few insignificant local cathodes (with a maximum cathodic current of −39 μA) were detectable using SVET. Details of local changes in localised electrochemical activities in the presence and absence of inhibitor molecules can be seen by comparing line profiles shown in Figure 7d.
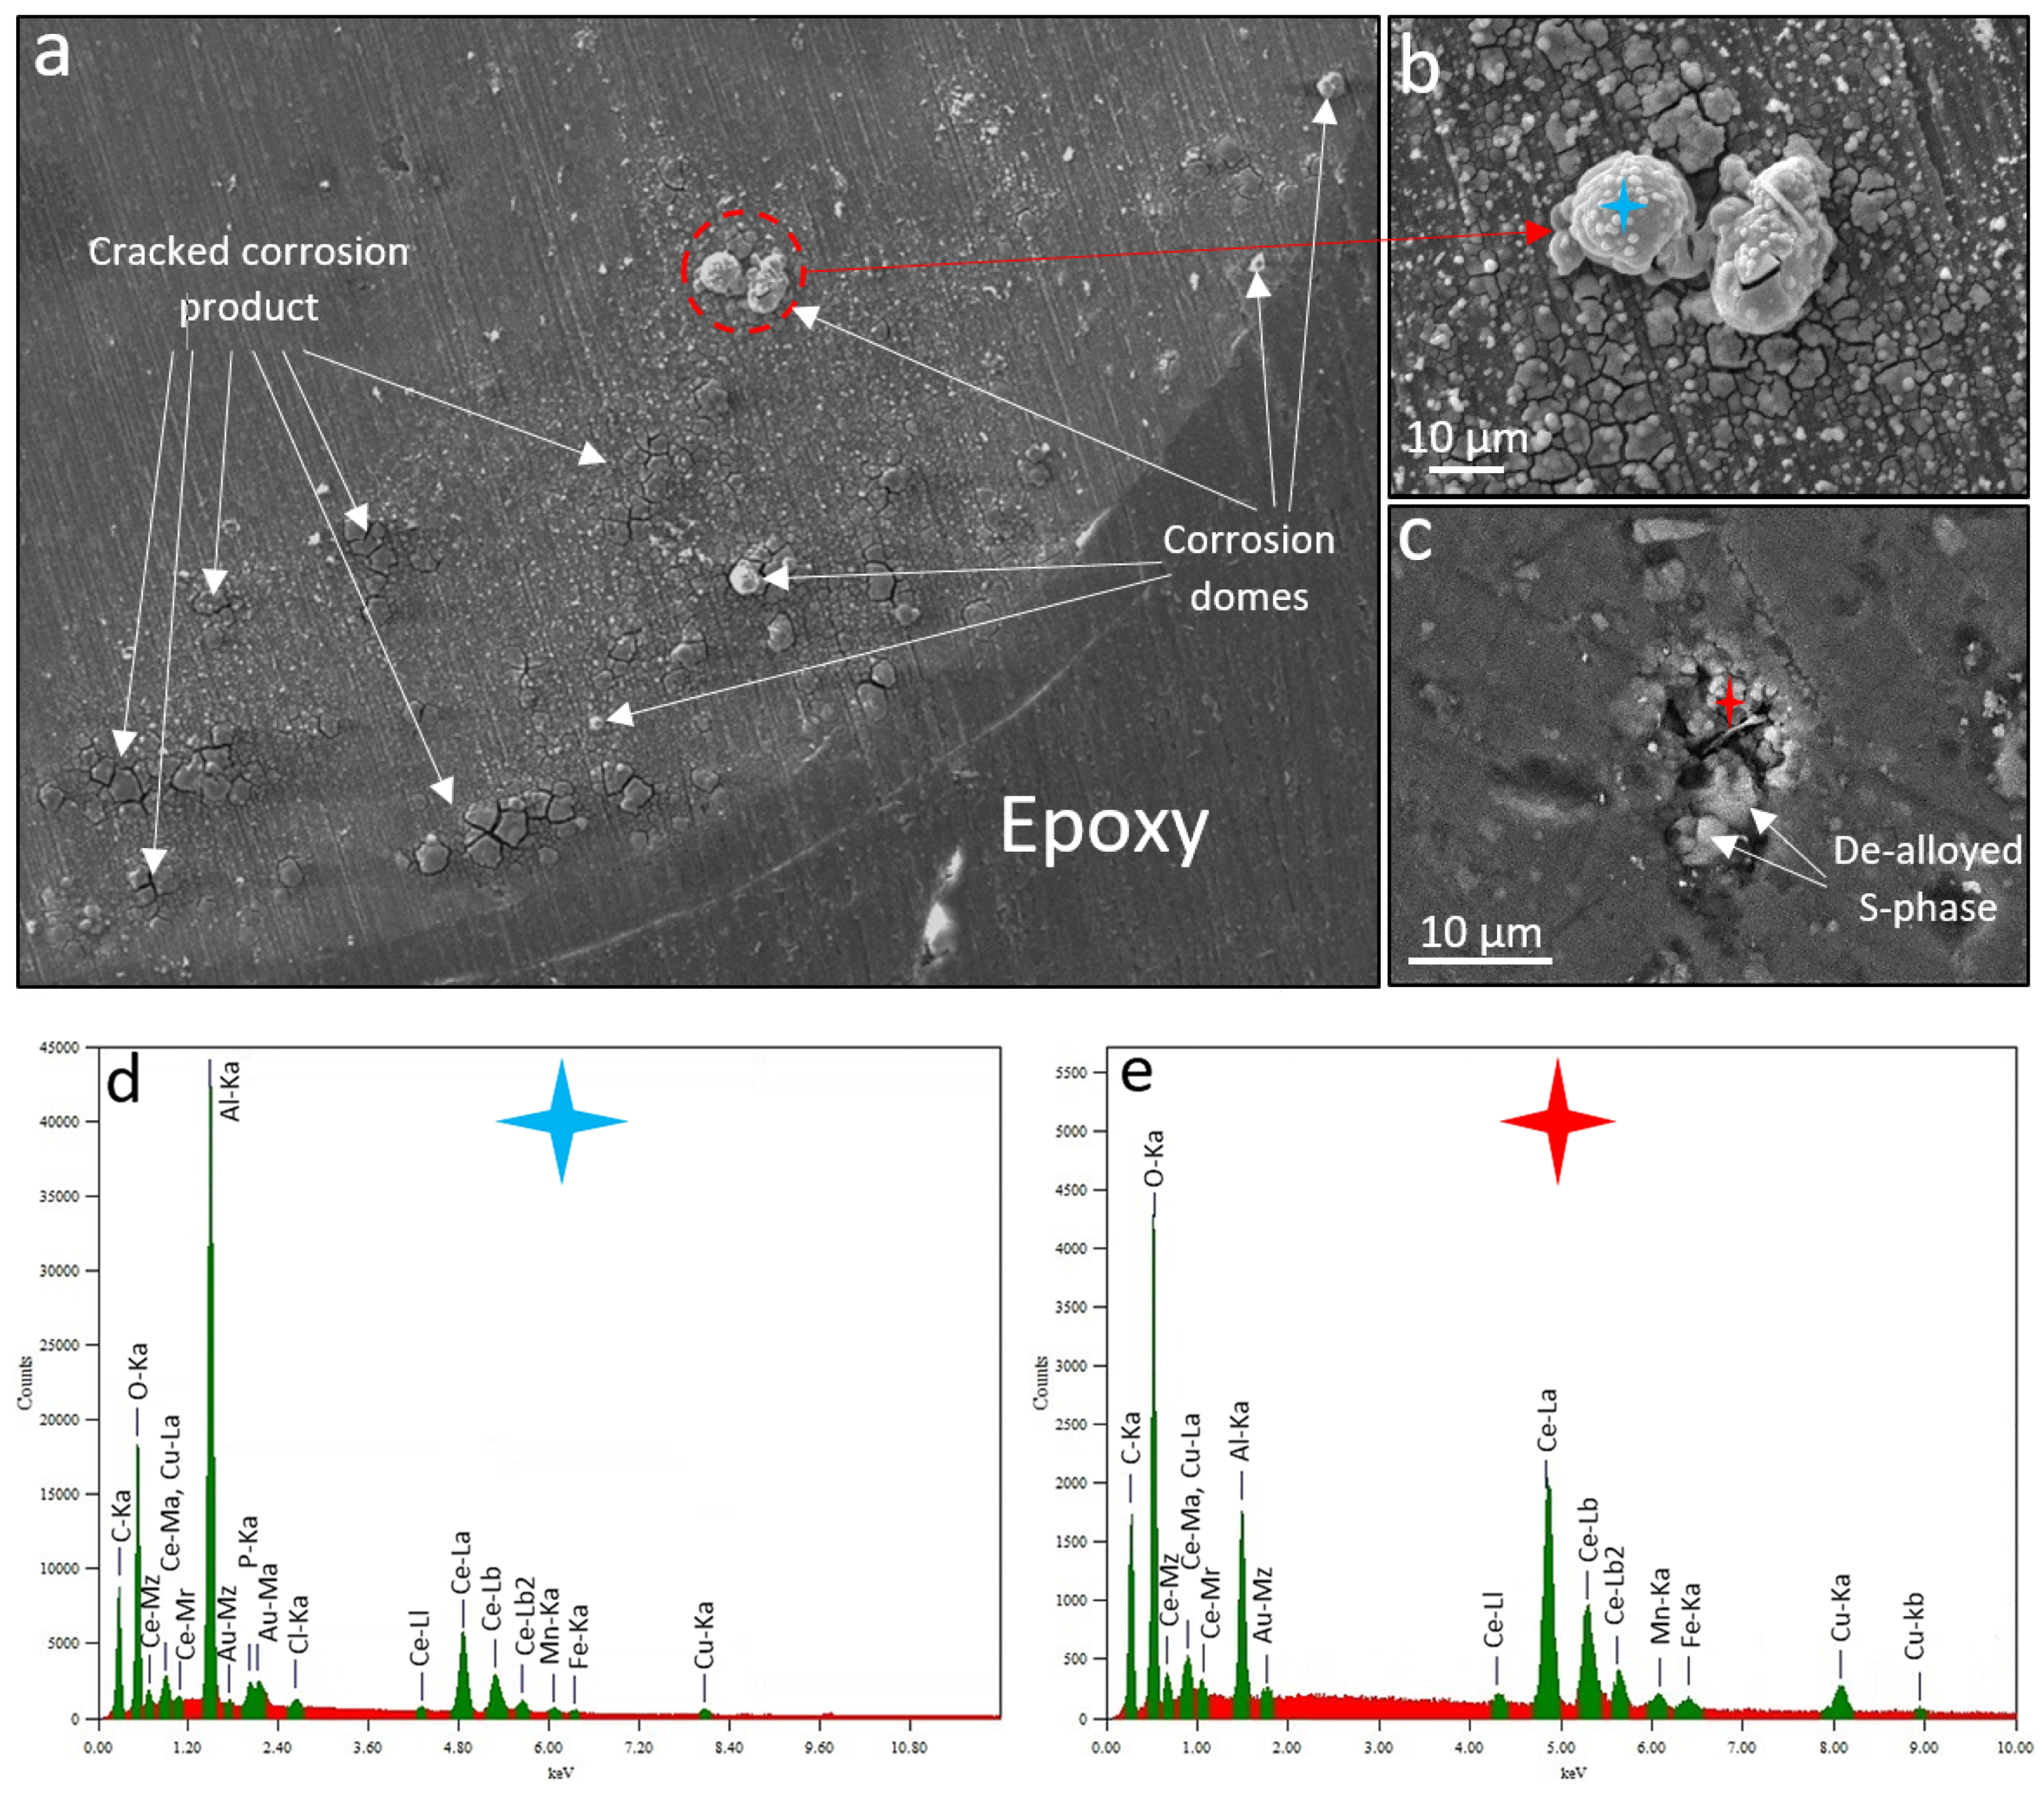
Figure 8a shows the corrosion morphology of the region that showed the highest anodic activity before and after the inhibitor addition; the area is highlighted by a white dashed rectangle in Figure 7b. As can be seen, the anodic area consists of regions with cracked layers of corrosion product mixed with inhibitor deposits, corrosion caps, and domes. Figure 8b shows the morphology of the corrosion dome and surrounding cracked surface film highlighted in Figure 8a. To investigate the morphology and composition of a few microns below the domes, layers were removed by a fine wet-grinding stage using a 4000 SiC paper (Figure 8c). EDS was performed on the corrosion dome (Figure 8d) and the sub-dome corroded/inhibited microstructure (Figure 8e). To diminish the possible chance of contamination of the subsurface corroded microstructure (e.g., pit mouth) by polishing debris, the surface was gently rinsed with ethanol during the grinding stage. EDS result (Figure 8d) shows that corrosion domes contain small levels of Mn, Cu, Cl, P, and Fe together with higher levels of Al, Ce, and O. The corroded microstructure beneath the domes (Figure 8c) mainly contained de-alloyed S-phase particles together with oxygen-rich Cu and Ce clusters with no evidence of P from dpp anions. The result here shows that considerable levels of Ce and O (from oxide/hydroxide compounds) can be found at the mouth of the pit/IGC network suggesting a pH above neutral at this particular site. Previous research indicated that Ce cations interact with areas of cathodic activity where higher concentrations of hydroxyl ions (higher pH values) are present to form Ce oxyhydroxides [37,38]. Generally, by comparing the corroded area (covered by a film of cracked corrosion products and domes) and the sub-film corroded microstructure, the following findings can be summarised:
(i) Swelling and cracking of corrosion/inhibitor products occurs mainly on top of active cathodes (e.g., de-alloyed S-phase remnants [36]) and/or anodes. These dehydrate and crack during drying of the wire surface after removal of the specimen from the inhibited solution.
(ii) Domes of corrosion/inhibition products that have formed over clusters of particles including de-alloyed S-phase and AlCuFeMn(Si) IM particles that are commonly known as the cause of stable pitting. If this site is a stable pit then it is possible that the dome of corrosion product forms over small H2 bubbles attached to the pit mouth leading to its shut-down of H2 gas evolution. Details of In-situ observation of domes and active/passive H2 emitting sites on various size AA2024-T3 wires were detected in a previous work [27].
Figure 8. Corrosion morphology of the wire after a total of 180 min of SVET immersion in both uninhibited (for 120 min) and inhibited (200 ppm Ce(dpp)3) 0.05 M NaCl open-to-air solution. (a) SE-SEM image of a fraction of the wire surface highlighted by a white dashed rectangle in 10b. (b) SE-SEM image of corrosion domes highlighted by a red dashed circle in (a). (c) SE-SEM image of sub-domes corroded/inhibited microstructure revealed after fine grinding of the surface shown in (b), (d) and (e) EDS spectra of spots highlighted by blue and red stars in (b) and (c), respectively. The scale bar length in (b) and (c) is 10 μm.
Metals 13 01703 g008
While SVET detects potential fields related to various micron scale electrochemical processes such as pitting, SECM, under oxygen reduction competition mode at OCP, can detect electrochemical reactions relating to the oxygen reduction on and surrounding actively corroding microstructure. In saying that, maximum competition (minimum sensed current by the UME) will occur when the UME tip sits above a highly cathodic S-phase remnant for instance. It is well-known that during the OCP corrosion of AA2024-T3 in near-neutral aqueous solutions, the predominant anodic reaction is aluminium dissolution while the cathodic process is the oxygen reduction reaction which preferentially takes place on cathodic IMPs (e.g., Al-Cu-Mn-Fe-Si type particles) and is strongest over fully de-alloyed S-phase particle remnants [1].
Figure 9 shows SECM current distribution maps revealing relative locations of localised positive and negative current excursions due to localised reduction of dissolved oxygen without (Figure 9a) and with inhibitor (Figure 9b,c) in 0.05 M NaCl solution. Positive current excursions represent higher than the background level of oxygen reduction. This is attributed to the convective flow of fresh solution into the region above anodes due to hydrogen evolution thus providing a greater oxygen supply than available by oxygen diffusion and supply from regions with higher concentration of unconsumed oxygen. No attempt is made here to cross-correlate the distribution of these peaks on a one-to-one basis to anodic sites on the surface, but their presence does reflect anodic activity in the vicinity of the electrode during scanning. This also indicates that Equation (1) is not valid at these sites since it is based only on the diffusion of oxygen into the sensing region under the electrode and not on the convective flow. With this perspective in mind, it can be seen in Figure 9a, that major anodic activity appears across the wire surface although more active anodes are mainly located at the peripheral region of the wire. Following 120 min of exposure to 0.05 M NaCl solution, the maximum anodic and cathodic currents were measured to be about 4 and −1 μA, respectively. Given the length of immersion time and since the observed IGC and H2 evolution were localised, the corrosion would be in the propagation stage thus growing and penetrating into susceptible microstructures both laterally and vertically.
Following inhibitor addition (after 135 min of immersion; Figure 9b), the maximum cathodic and so-called convection-related anodic currents were increased by about 4 and 6 times, respectively. Here, the SECM results again revealed the inhibitor activation (mostly through changes in localised cathodic activities) behaviour in support of WBE and SVET findings. The initial convection-related anodic activity decreased after inhibitor addition and was confined to the annular region of the wire consistent with this part of the microstructure being more prone to pitting initiation and propagation [27]. As exposure time increased to 180 min (Figure 9c), the overall electrochemical activity of the surface was reduced showing only a few slightly active regions and cathodes, mostly near the edge of the wire indicating considerably declined cathodic and hence anodic activities across wire microstructure. Figure 9d shows time-dependent current line profiles labelled “A” to “C” across the black dashed lines shown in Figure 9a–c.
Figure 10 shows the surface morphology of the AA2024 wire after completion of SECM measurements discussed in Figure 9. Most of the heavily attacked sites showing pitting and IGC and relatively large plumes of corrosion product in dark grey are situated in the annular region of the wire (Figure 10a). Compared to the corrosion morphology of the SVET specimen (Figure 7), most of the pit mouths were open and no pronounced corrosion rings were observed. This difference in corrosion morphologies is likely to be related to SECM and SVET probe-surface distances (100 µm in SVET as compared to 15 µm in SECM), and the introduction of a localised highly alkaline environment at the UME tip in the proximity of the surface. Compared to SVET, smaller tip-to-surface distances in SECM may lead to physical removal and displacement of corrosion and inhibition products during surface scans. Figure 10b,c show SE-/BSE-SEM images of the region highlighted with a white dashed rectangle in Figure 10a. This region was chosen as a typical example of a heavily corroded site in the annular region. Pits, corrosion plumes, and caps (e.g., highlighted by a red triangle) were all observed within the dashed rectangle. EDS was performed on some of these features (Figure 10d,e) to determine the extent of inhibitor interaction with corrosion sites. Plumes of corrosion products have been observed before [27] and attributed to subsurface S-phase dealloying. A plume surrounded by pits (Figure 10d) also on a corrosion cap (Figure 10e) very close to the heavily attacked area. The EDS analysis of the corrosion plume showed trace levels of Mg and Cu (likely from subsurface S-phase IMPs) and higher levels of Al, Cl, and O elements (Figure 10d) showing that inhibitor molecules have not suppressed the plume formation mechanism which is not clearly known. Whereas the EDS analysis of the corrosion cap (Figure 10e) reveals the presence of Al, Ce, P, Cl, O, Mg, and Cu elements. In this case, inhibitor deposits were found on top of the corrosion product cap covering trenched and de-alloyed S-phase particles [36] where there is greater cathodic activity due to the presence of Cu (irrespective of its formation source). This also indicates that S-phase remnants covered by gel products were still active after 120 min of corrosion and could still take part in cathodic reactions possibly at slower rates.

3.3. Discussion on Multiscale Inhibition by Integrating WBE, SVET and SECM Data

The overall qualitative behaviour of the individual electrodes measured using SVET and SECM are similar to that observed by the WBE. The addition of 200 ppm Ce(dbp)3 appears to suppress corrosion after about 60 to 70 min in both the SVET and WBE experiments, respectively. This indicates that the inhibition mechanism shows similar time dependence on a scale range going from perhaps 10 μm in the SVET to over 1 cm for the WBE experiment. This appears to be due to the contraction of large-scale anodes and cathodes observed using the WBE to a local scale of tens of microns. The reason for this is that when the inhibitor reacts and suppresses anodic and cathodic activity, the resultant current densities required by each are small which significantly reduces the physical scale from which anodes and cathodes balance. Clearly, this scale is much smaller than individual electrodes as seen in the SVET measurements, so inter-electrode activity ceases in the WBE.
The results presented here show that at 200 ppm concentration, Ce(dpp)3 does not fully shut down all localised activities on a corroding AA2024-T3 wire with fully developed pits and IGC sites. Table 2 gives a summary of the maximum ratio of anodic to cathodic current probed by WBE, SVET, and SECM after inhibitor addition (concentrations at which these events happened are also included) and their associated corrosion/inhibition morphologies. It should be noted that because of the convective nature of the SECM response over anodic regions, no figures for this technique are presented in Table 2.
Previous inhibitor studies show a common inhibition mechanism for Ce(dbp)3, Ce(dpp)3, and Pr(dpp)3 inhibitors. Markley and co-workers [24] have proposed that RE organophosphates only partially dissociate in solution and most likely exist as complexes or polynuclear species instead of discrete ionic species. They have suggested that the partial dissociation of the dpp ligand from Ce(dpp)3 (Ce(dpp)3 → Ce (dpp)(3−n)n+ + n(dpp) (n ≤ 3)) provides for a time-dependent and solution pH dependant response to surface conditions. On the other hand, Soestbergen et al. [39] reported that Ce(dbp)3 undergoes complete dissociation over a pH range of 1 to 9. In the case of the lower pH (1 to 2) the dbp anion undergoes protonation increasing the availability of free Ce3+ cations and at higher pH (>9) precipitation of Ce(OH)3 occurs. It is also conceivable that protonation of dbp anions may increase the presence of hydrogen ions (leading to an H+ gradient and transport to regions with higher dbp anion concentration) in the vicinity of anodic sites thus facilitating further dissolution thus acting as an activating agent. Over cathodic IMPs where alkaline pH values are sustained, a reaction of Ce ions with excess hydroxyl ions can occur which facilitates film formation in the alkaline environment above active cathodes. Diffusion of OH ions beyond the locality of the cathodes may result in Ce hydroxide formation more generally on the surface providing more widespread protection. This is the classic island growth model described by Arnott et al. [40]. As a consequence, precipitation of Ce oxide/hydroxide products happens once the solubility product is reached although mixed precipitates such as Ce(dpp)(3−n)(OH)n may also form. Depending on the initial surface condition, the film formation might not fully cover the whole surface and thus, non-covered sites may continue to take part in localised corrosion reactions.
A critical phenomenon observed in this work is corrosion activation in the presence of lower concentrations of the inhibitor (e.g., 50 and 100 ppm). This has also been reported for other inhibitors such as RE salts, CeCl3 (as AA2024 corrosion inhibitor) [22,35], and chromate (applied to Al alloys) [41]. In the case of oxidizing inhibitors such as chromate at very low concentrations, the activation is thought to be related to the Cr6+ to Cr3+ reduction reaction resulting in Al oxidation. As discussed above activation at low concentrations of inhibitor may occur through a range of possibilities:
  • Increase in hydrogen ion activity due to consumption of hydrogen ions in the protonation of dpp anion in the acidic anolyte solution.
  • The reaction of dpp with aluminium ions in the electrolyte at the anodes.
  • Reaction of Ce with hydroxyl ions in solution (i.e., generation of Ce(OH)n3−n) near cathodic sites thus increasing the activity for oxygen reduction over cathodes.
  • Formation of other cerium species such as peroxo complexes during oxygen reduction over cathodes. These may facilitate superoxide or peroxide generation and increase the rate of these first steps in the reduction of oxygen in a fashion similar to conversion coatings.
The other aspect of note with these results is that the incubation period observed with the RE-organo compounds is not evident here. Specifically, cathodic activity has often been observed some 60 min to 24 h after exposure of aluminium to an electrolyte containing RE-organo compounds whereas anodic activity is evident after a short time (usually 30 min). Results presented here show that inhibition of anodic and cathodic activity seems to occur in parallel. This conclusion suggests that the delay in the onset of cathodic activity is probably related to the time taken to develop the “right” conditions on the surface for inhibition. This further suggests that cathodic suppression is probably via a secondary reaction such as the oxygen reduction reaction and pH increase at cathodic sites which may take some time to establish high enough pH levels for the precipitation of cerium compounds. The onset of cathodic reactions may be further impeded by surface microstructural changes such as the de-alloying of S-phase particles and other Cu-enrichment processes over IMPs. Thus, the interval during which corrosion is happening before the addition of inhibitor or release of inhibitive components becomes a controlling factor. In the previous inhibitor studies, inhibitors were incorporated into the corrosive medium initially, but the current study confirms that the delay in cathodic inhibition is related to corrosion processes and not inhibitor activity.

4. Conclusions

A multiscale electrochemical and surface analytical approach has been designed and implemented to investigate wide-range corrosion and inhibition processes. Localised corrosion of AA2024-T3 alloy (in wire form) and its inhibition using Ce(dpp)3 concurring at different time and length scales have been investigated through the combined use of the WBE, SVET, and SECM electrochemical techniques supported by SEM-EDS surface analysis. Results obtained from these techniques have all shown that the inhibition of localised corrosion involved an initial electrochemical activation of both anodic and cathodic reactions at both millimeter and micrometer scales, immediately after the addition of the Ce(dpp)3 inhibitor to the test solution. Inhibitor-surface interactions increased the localised anodic and cathodic activities, leading to the formation of precipitates that eventually suppressed localised corrosion activities over the alloy surface. The latter has been verified by BSE-SEM and EDS elemental distribution data that show both Ce and dpp precipitates were found within active pits, suppressing localised corrosion.

Author Contributions

Conceptualization, R.P., A.E.H., M.F. and M.Y.T.; methodology, R.P.; software, R.P.; validation, R.P., M.Y.T. and A.E.H.; formal analysis, R.P.; investigation, R.P.; resources, M.Y.T., A.E.H. and M.F.; data curation, R.P.; writing—original draft preparation, R.P.; writing—review and editing, A.E.H., M.Y.T. and M.F.; visualization, R.P.; supervision, M.Y.T., A.E.H. and M.F.; project administration, R.P.; funding acquisition, M.Y.T. All authors have read and agreed to the published version of the manuscript.

Funding

This research received no external funding. R.P. acknowledges the financial support from Deakin University Postgraduate Research Scholarship (DUPRS).

Data Availability Statement

The raw/processed data required to reproduce these findings cannot be shared at this time as the data also forms part of an ongoing study.

Conflicts of Interest

The authors declare that there are no conflict of interest.

References

  1. Kosari, A.; Zandbergen, H.; Tichelaar, F.; Visser, P.; Taheri, P.; Terryn, H.; Mol, J.M.C. In-situ nanoscopic observations of dealloying-driven local corrosion from surface initiation to in-depth propagation. Corros. Sci. 2020, 177, 108912. [Google Scholar] [CrossRef]
  2. Kosari, A.; Tichelaar, F.; Visser, P.; Zandbergen, H.; Terryn, H.; Mol, J.M.C. Dealloying-driven local corrosion by intermetallic constituent particles and dispersoids in aerospace aluminium alloys. Corros. Sci. 2020, 177, 108947. [Google Scholar] [CrossRef]
  3. Parvizi, R.; Hughes, A.E.; Tan, M.Y.; Marceau, R.K.W.; Forsyth, M.; Cizek, P.; Glenn, A.M. Probing corrosion initiation at interfacial nanostructures of AA2024-T3. Corros. Sci. 2017, 116, 98–109. [Google Scholar] [CrossRef]
  4. De Nicolò, A.; Paussa, L.; Gobessi, A.; Lanzutti, A.; Cepek, C.; Andreatta, F.; Fedrizzi, L. Cerium conversion coating and sol-gel multilayer system for corrosion protection of AA6060. Surf. Coat. Technol. 2016, 287, 33–43. [Google Scholar] [CrossRef]
  5. Mohammadi, I.; Shahrabi, T.; Mahdavian, M.; Izadi, M. Cerium/diethyldithiocarbamate complex as a novel corrosion inhibitive pigment for AA2024-T3. Sci. Rep. 2020, 10, 5043. [Google Scholar] [CrossRef]
  6. Volarič, B.; Milošev, I. Rare earth chloride and nitrate salts as individual and mixed inhibitors for aluminium alloy 7075-T6 in chloride solution. Corros. Eng. Sci. Technol. 2017, 52, 201–211. [Google Scholar] [CrossRef]
  7. Zhu, C.; Yang, H.X.; Wang, Y.Z.; Zhang, D.Q.; Chen, Y.; Gao, L.X. Synergistic effect between glutamic acid and rare earth cerium (III) as corrosion inhibitors on AA5052 aluminum alloy in neutral chloride medium. Ionics 2019, 25, 1395–1406. [Google Scholar] [CrossRef]
  8. Deyab, M.A.; El-Rehim, S.S.A.; Hassan, H.H.; Shaltot, A.M. Impact of rare earth compounds on corrosion of aluminum alloy (AA6061) in the marine water environment. J. Alloys Compd. 2020, 820, 153428. [Google Scholar] [CrossRef]
  9. Cabello Mendez, J.A.; Arguelles Rojas, A.; Pérez Bueno, J.d.J.; Meas Vong, Y. Study of the anticorrosive behavior of samarium as a corrosion inhibitor in multilayer systems for aluminum alloy. Sci. Rep. 2023, 13, 3149. [Google Scholar] [CrossRef]
  10. Cabello Mendez, J.A.; Pérez Bueno, J.d.J.; Meas Vong, Y.; Portales Martínez, B. Cerium Compounds Coating as a Single Self-Healing Layer for Corrosion Inhibition on Aluminum 3003. Sustainability 2022, 14, 15056. [Google Scholar] [CrossRef]
  11. Chen, X.; Tang, J.; Wei, H.; Zhang, H.; Tang, Y.; Zhao, X.; Zuo, Y. Effect of Cerium Tartrate on the Corrosion Resistance of Epoxy Coating on Aluminum Alloy and Its Mechanism. Coatings 2022, 12, 785. [Google Scholar] [CrossRef]
  12. Gong, L.-h.; Liu, T.-n. Corrosion inhibition behavior of cerium salt sealing on the scratch of aluminum alloy anode oxide film in a simulated marine atmospheric environment. Surf. Topogr. Metrol. Prop. 2022, 10, 035020. [Google Scholar] [CrossRef]
  13. Hao, J.; Yan, L.; Dai, Y. Effect of rare earth Nd on the microstructural transformation and mechanical properties of 7xxx series aluminum alloys. Rev. Adv. Mater. Sci. 2023, 62, 20230345. [Google Scholar] [CrossRef]
  14. Khan, A.R.; Zhang, H.-J.; Jun, Z.; Eldin, S.M.; Alsaiari, N.S.; Katubi, K.M. Electrochemical corrosion resistance of aluminum alloy 6101 with cerium-based coatings in an alkaline environment. Front. Chem. 2022, 10, 1066958. [Google Scholar] [CrossRef] [PubMed]
  15. Lavanya, M.; Ghosal, J.; Rao, P. A comprehensive review of corrosion inhibition of aluminium alloys by green inhibitors. Can. Metall. Q. 2023, 10, 2190198. [Google Scholar] [CrossRef]
  16. Mendez, J.A.C.; Vong, Y.M.; Bueno, J.d.J.P. Cerium and Other Rare Earth Salts as Corrosion Inhibitors—A Review. Prot. Met. Phys. Chem. Surf. 2022, 58, 801–810. [Google Scholar] [CrossRef]
  17. Milošev, I.; Rodič, P. The Effect of Surface Pretreatment of Aluminum Alloy 7075-T6 on the Subsequent Inhibition by Cerium(III) Acetate in Chloride-Containing Solution. J. Electrochem. Soc. 2022, 169, 011504. [Google Scholar] [CrossRef]
  18. Radojković, B.; Marunkić, D.; Milošević, M.; Grubišić, S.; Pejić, J.; Jegdić, B.; Marinković, A. Analysis of the Ce(III) chloride, Ce(III) nitrate, and Ce(III) propionate as corrosion inhibitor of the aluminum alloys in NaCl solution. Mater. Corros. 2022, 73, 1604–1614. [Google Scholar] [CrossRef]
  19. Shi, B.; Zhang, Y.; Wang, R.; Wang, Y.; Li, C. Influence of Rare Earth Samarium/Ytterbium Salt on Electrochemical Corrosion Behavior of Aluminum-Based Anode for Batteries. Metals 2022, 12, 1280. [Google Scholar] [CrossRef]
  20. Xu, X.T.; Xu, H.W.; Wang, Y.; Zhang, X.Y.; Tan, X.J. Cerium chloride and L-arginine as effective hybrid corrosion inhibitor for 5052 aluminum alloy in 3.5% NaCl solution. Int. J. Electrochem. Sci. 2022, 17, 221226. [Google Scholar] [CrossRef]
  21. Hinton, B.R.W.; Arnott, D.R.; Ryan, N.E. The inhibition of aluminum-alloy corrosion by cerous cations. Met. Forum 1984, 7, 211–217. [Google Scholar]
  22. Gobara, M.; Baraka, A.; Akid, R.; Zorainy, M. Corrosion protection mechanism of Ce4+/organic inhibitor for AA2024 in 3.5% NaCl. RSC Adv. 2020, 10, 2227–2240. [Google Scholar] [CrossRef] [PubMed]
  23. Garcia, S.J.; Markley, T.A.; Mol, J.M.C.; Hughes, A.E. Unravelling the corrosion inhibition mechanisms of bi-functional inhibitors by EIS and SEM–EDS. Corros. Sci. 2013, 69, 346–358. [Google Scholar] [CrossRef]
  24. Markley, T.A.; Forsyth, M.; Hughes, A.E. Corrosion protection of AA2024-T3 using rare earth diphenyl phosphates. Electrochim. Acta 2007, 52, 4024–4031. [Google Scholar] [CrossRef]
  25. Blanc, C.; Gastaud, S.; Mankowski, G. Mechanistic Studies of the Corrosion of 2024 Aluminum Alloy in Nitrate Solutions. J. Electrochem. Soc. 2003, 150, B396–B404. [Google Scholar] [CrossRef]
  26. Liu, J.; Wang, D.; Gao, L.; Zhang, D. Synergism between cerium nitrate and sodium dodecylbenzenesulfonate on corrosion of AA5052 aluminium alloy in 3wt.% NaCl solution. Appl. Surf. Sci. 2016, 389, 369–377. [Google Scholar] [CrossRef]
  27. Parvizi, R.; Hughes, A.E.; Tan, M.Y.J. New approach to probing localised corrosion processes over wide length and time scales using integrated multi-scale electrode arrays. Corros. Sci. 2021, 181, 109238. [Google Scholar] [CrossRef]
  28. Paussa, L.; Andreatta, F.; De Felicis, D.; Bemporad, E.; Fedrizzi, L. Investigation of AA2024-T3 surfaces modified by cerium compounds: A localized approach. Corros. Sci. 2014, 78, 215–222. [Google Scholar] [CrossRef]
  29. Akid, R.; Garma, M. Scanning vibrating reference electrode technique: A calibration study to evaluate the optimum operating parameters for maximum signal detection of point source activity. Electrochim. Acta 2004, 49, 2871–2879. [Google Scholar] [CrossRef]
  30. Bastos, A.C.; Quevedo, M.C.; Ferreira, M.G.S. The influence of vibration and probe movement on SVET measurements. Corros. Sci. 2015, 92, 309–314. [Google Scholar] [CrossRef]
  31. Amemiya, S.; Bard, A.J.; Fan, F.-R.F.; Mirkin, M.V.; Unwin, P.R. Scanning Electrochemical Microscopy. Annu. Rev. Anal. Chem. 2008, 1, 95–131. [Google Scholar] [CrossRef] [PubMed]
  32. Sun, P.; Laforge, F.O.; Mirkin, M.V. Scanning electrochemical microscopy in the 21st century. Phys. Chem. Chem. Phys. 2007, 9, 802–823. [Google Scholar] [CrossRef] [PubMed]
  33. González-García, Y.; García, S.J.; Hughes, A.E.; Mol, J.M.C. A combined redox-competition and negative-feedback SECM study of self-healing anticorrosive coatings. Electrochem. Commun. 2011, 13, 1094–1097. [Google Scholar] [CrossRef]
  34. Luo, C.; Albu, S.P.; Zhou, X.; Sun, Z.; Zhang, X.; Tang, Z.; Thompson, G.E. Continuous and discontinuous localized corrosion of a 2xxx aluminium–copper–lithium alloy in sodium chloride solution. J. Alloys Compd. 2016, 658, 61–70. [Google Scholar] [CrossRef]
  35. Oliveira, M.; Bastos, A.C.; Kallip, S.; Hack, T.; Zheludkevich, M.L.; Ferreira, M.G.S. Corrosion Inhibition and Acceleration by Rare Earth Ions in Galvanic Couples. J. Electrochem. Soc. 2020, 166, C642–C648. [Google Scholar] [CrossRef]
  36. Catubig, R.; Hughes, A.E.; Cole, I.S.; Hinton, B.R.W.; Forsyth, M. The use of cerium and praseodymium mercaptoacetate as thiol-containing inhibitors for AA2024-T3. Corros. Sci. 2014, 81, 45–53. [Google Scholar] [CrossRef]
  37. Scholes, F.H.; Hughes, A.E.; Jamieson, D.; Inoue, K.; Furman, S.A.; Muster, T.H.; Hardin, S.G.; Lau, D.; Harvey, T.G.; Corrigan, P.; et al. Interaction of Ce(dbp)3 with surface of aluminium alloy 2024-T3 using macroscopic models of intermetallic phases. Corros. Eng. Sci. Technol. 2009, 44, 416–424. [Google Scholar] [CrossRef]
  38. Pejić, J.N.; Jegdić, B.V.; Radojković, B.M.; Marunkić, D.D.; Marinković, A.D.; Bajat, J.B. Cysteine and cerium as green corrosion inhibitors for AA7049: Mixture vs. complexation. Corros. Sci. 2022, 209, 110815. [Google Scholar] [CrossRef]
  39. Erich, S.J.F.; Huinink, H.P.; Adan, O.C.G. Dissolution properties of cerium dibutylphosphate corrosion inhibitors AU—Van Soestbergen, M. Corros. Eng. Sci. Technol. 2013, 48, 234–240. [Google Scholar] [CrossRef]
  40. Arnott, D.R.; Ryan, N.E.; Hinton, B.R.W.; Sexton, B.A.; Hughes, A.E. Auger and XPS studies of cerium corrosion inhibition on 7075 aluminum alloy. Appl. Surf. Sci. 1985, 22–23, 236–251. [Google Scholar] [CrossRef]
  41. Kendig, M.W.; Buchheit, R.G. Corrosion Inhibition of Aluminum and Aluminum Alloys by Soluble Chromates, Chromate Coatings, and Chromate-Free Coatings. Corrosion 2003, 59, 379–400. [Google Scholar] [CrossRef]
Figure 1. (a) Schematic illustration of the WBE technique experimental setup used to study localised corrosion/inhibition behaviours of the AA2024 alloy [27]. (a) A reprinted from the publication titled “New approach to probing localised corrosion processes over the wide length and time scales using integrated multi-scale electrode arrays”, Vol 181, R. Parvizi, A.E. Hughes, M. Y.J. Tan, Pages No. 18, Copyright (2023), with permission from Elsevier. (b) Depicts a 3D view of the WBE (bottom side of the WBE faces up), and (c) top view of the WBE made from 1 mm AA2024 wires. Note that each 1 mm pin shown in (b) will be connected to its defined socket of data cables (not shown in this image).
Metals 13 01703 g001
Figure 2. (a) SVET experimental set-up. Scanning probe station including a 3D closed-loop Piezo positioner, electrometer head, and the implemented SVET probe. (b) SVET potential to current conversion methodology. The unit for all potential values represented in inset graphics is μV.
Metals 13 01703 g002
Figure 3. (a) Cyclic voltammograms measured at the Pt-microelectrode in an open-to-air 0.05 M NaCl solution. The scan rate was fixed at 0.01 V/s. The inset shows an optical image of the UME. (b) Experimental SECM approach curve (blue curve) towards an insulating surface (epoxy) measured at the Pt-microelectrode in an open-to-air 0.05 M NaCl solution with the scan rate of 10 μm/s. “E” is the potential applied to the tip and “i” is the feedback current measured at the tip. The RG value of the UME used for the measurement of the approach curve was 8.13.
Metals 13 01703 g003
Figure 4. (a) Normalised (blue curve) and un-normalised (experimental data) SECM approach curves towards the insulator surface measured at the Pt-microelectrode in an open-to-air 0.05 M NaCl solution at the scan rate of 10 μm/s. The RG value of the UME was 10. RG is the ratio between the thickness of the insulating shield surrounding the electrode wire, the disc-electrode radius, the normalised distance is the ratio between tip-sample distance and electrode radius, and the normalised current is the ratio of the probe current and the limiting current (iL). (b) Potentiostatic measurement of the UME current at −0.6 V (vs. Ag/AgCl) applied potential, in the absence and presence of 200 ppm Ce(dpp)3.
Metals 13 01703 g004
Figure 5. 2D galvanic current density distribution maps of AA2024 WBE (made from 1 mm diameter wires) during 220 min of immersion in inhibited (by Ce(dpp)3) and un-inhibited 0.05 M NaCl solution (open-to-air condition). To help understand the configuration of electrodes in the WBE, three candidate electrodes (electrodes E1, E10, and E100) are numbered in the 1.5 min map. The indicated colour key applies to all current density maps. Video snapshots show a portion of the WBE surface during the immersion period just before and after the inhibitor addition. Trends of extracted parameters from current density maps, as a function of time (before and after inhibitor addition), including Ia(max), Ic(max), Ia(total), Ic(total), NTA, and NTC are also shown.
Metals 13 01703 g005
Figure 6. Corrosion morphology of the most anodic wire after 220 min of immersion in un-inhibited and inhibited 0.05 M NaCl solution (open-to-air). (a) BSE-SEM image of the wire surface and (b) BSE-SEM image of the area highlighted by a red-dashed rectangle in (a). (c) EDS spectra of the spot highlighted by the red star in (b).
Metals 13 01703 g006
Figure 7. SVET results were obtained from a 1 mm AA2024 wire sample, freely corroding in un-inhibited 0.05 M NaCl solution or inhibited by Ce(dpp)3 solutions (open-to-air). (ac) Time-dependent development of localised corrosion activities depicted by ionic current distribution maps. A 200 ppm Ce(dpp)3 concentration was achieved by adding calculated volume to the base solution from a concentrated inhibitor solution after 120 min of immersion. Data were obtained from stepwise scan speeds of 50 μm/s carried out at (a) 120 min, (b) 135 min, and (c) 180 min during immersion. (d) Ionic current line profiles labelled “A”–“C” over a fixed position (shown in (ac)) at the AA2024 wire surface at various immersion times.
Metals 13 01703 g007
Figure 9. SECM results were obtained from a 1 mm AA2024 wire sample, freely corroding in 0.05 M NaCl without inhibitor, (a), and with inhibitor, (b) at 135 min, and (c) at 180 min. (ac) Time-dependent development of localised corrosion activities depicted by current distribution maps probed by the UME tip under oxygen redox competition mode. The inhibitor (Ce(dpp)3) concentration was 200 ppm. This was achieved by adding calculated volume to the base solution from a concentrated inhibitor solution after 120 min of immersion. Data were obtained from stepwise scan speeds of 50 μm/s carried out at (a) 120 min, (b) 135 min, and (c) 180 min during immersion. (d) Current line profiles labelled “A”–“C” over a fixed position (shown in (ac)) at the AA2024 wire surface at various immersion times. Note that major anodes retained after inhibitor addition in (b,c) are mostly confined to the boundary region of the wire.
Metals 13 01703 g009aMetals 13 01703 g009b
Figure 10. Corrosion morphology of the wire after a total of 180 min of SECM immersion in both uninhibited (for 120 min) and inhibited (200 ppm Ce(dpp)3) 0.05 M NaCl open-to-air solution. (a) BSE-SEM image of the wire surface. (b) SE-SEM image of the corrosion morphology including pits, plumes, and corrosion caps highlighted by the white dashed rectangle in (a). (c) BSE-SEM image of the image shown in (b). (d,e) EDS spectra of spots highlighted by blue and red triangles in (b), respectively.
Metals 13 01703 g010
Table 1. Time-dependent measurement of anodic and cathodic inhibition efficiencies of Ce(dpp)3 at 50, 100, and 200 ppm concentrations using the WBE technique.
Time after Inhibitor Addition60 min70 min100 min130 min160 min190 min220 min
Efficiency (%) 0 ppm 50 ppm50 ppm100 ppm100 ppm200 ppm200 ppm
ηa0−5.5−24.5−83.56.57.451.8
ηc0−36.7−35.5−64.8−33.925.849.0
Table 2. Summary of anodic and cathodic activation events probed by WBE, SVET, and SECM and major associated corrosion morphologies.
Technique I a ( max ) _ with   inhibitor I a ( max ) _ without   inhibitor I c ( max ) _ with   inhibitor I c ( max ) _ without   inhibitor PitsRingsPlumesDomes
WBE2.56 (100 ppm)6.24 (50 ppm)YesYesYesYes
SVET1.10 (200 ppm)1.05 (200 ppm)YesYesNoYes
SECM YesNoYesNo
Disclaimer/Publisher’s Note: The statements, opinions and data contained in all publications are solely those of the individual author(s) and contributor(s) and not of MDPI and/or the editor(s). MDPI and/or the editor(s) disclaim responsibility for any injury to people or property resulting from any ideas, methods, instructions or products referred to in the content.

