Abstract
The non-metallic inclusions in steel mainly come from the deoxidization process of molten steel. Based on the different deoxidization processes of GCr15 bearing steel produced by a domestic steel plant, the single deoxidization curves of Al, Si, and Mn and the compound deoxidization curves of Al-Si and Si-Mn under pure molten iron and GCr15 bearing steel production conditions were calculated with the FactSage 8.1 thermodynamic software. The results show that the deoxidization curves under the two conditions are quite different. At the same time, the Al-Ti deoxidation equilibrium curve under the condition of GCr15 bearing steel was calculated. It was found that when [Ti] < 0.0015% in the steel, the equilibrium deoxidation product was Al2O3, and no titanium oxide was generated. Finally, a thermodynamic calculation and analysis of the effect of rare-earth Ce content on the modification of inclusions in GCr15 bearing steel were carried out. The results showed that when T = 1873 K, the rare-earth Ce treatment of aluminum deoxidized the GCr15 bearing steel; when [Al] = 0.015%, Al2O3 inclusions increased with the increase in [Ce] content, and the evolution path was Al11O18Ce→CeAlO3→Ce2O3. When [Si] = 0.28%, [O] > 50 ppm, and CeCrO3 and [O] 0.012% appeared. CeS inclusions appeared in the steel, and the final equilibrium product was CeS + Ce2O3. When [Ce] < 0.012%, CeS was not produced in the steel, and only Ce2O3 existed.
1. Introduction
Fatigue performance is one of the main metallurgical properties of bearing steel [1,2]. With the development of advanced industry, the requirements for bearing steel quality have sharply increased, and the design life and service time of bearing have greatly increased. In some fields, such as the high-speed railway, power generation, and aerospace industries, the demand for bearing fatigue life exceeds 109 [3,4,5]. Although many factors contribute to fatigue defects in bearings, nonmetallic inclusion is an important factor affecting the fatigue life of bearing steel. There are many sources of inclusions in steel, and the main sources are the products of alloy deoxidization, which seriously affect the cleanliness of steel products. As inclusions are distinctive from steel in terms of hardness, thermal expansion, deformability, and so on, they can easily cause stress concentrations and fatigue cracks in steel. Hence, scholars have carried out extensive research on reducing inclusions [6,7], inclusion modifications [8,9,10], inclusion formation thermodynamics [11,12,13], and clean deoxygenation technology [14,15].
However, there is a lack of systematic research on the deoxidation thermodynamics of alloys. In this paper, FactSage was used to study the deoxidation curves of different elements of GCr15 bearing steel according to the smelting process of GCr15 bearing steel produced by a steel plant, and the deoxidation curves of different elements of pure iron were compared. At the same time, a thermodynamic calculation and analysis of the modification of inclusions in GCr15 bearing steel by rare-earth Ce were carried out, and the reasons for the evolution of inclusions were analyzed from the perspective of thermodynamics so as to provide a theoretical thermodynamic reference for the industrial production practice of GCr15 bearing steel.
2. Research Method
The main components (in a tundish) of the GCr15 bearing steel produced in a steel plant are shown in Table 1. The production process was ‘BOF-LF-RH-CCM’. When the converter tapped, silicon manganese was added for pre-deoxidation, and then aluminum iron is added for the final deoxidation. The deoxidation thermodynamics of different deoxidants were analyzed with the FactSage 8.1 thermodynamic calculation software, and the stable inclusions generated in molten steel with different deoxidant contents were calculated.

Table 1.
Main components in the GCr15 bearing steel tundish (wt.%).
3. Deoxidation Equilibrium Calculation for a Single Element
3.1. Al-O Equilibrium of GCr15 Bearing Steel
Using FactSage8.1 and selecting the FactPS, FToxid, and Fsstel databases, the Al-O equilibrium curve of GCr15 bearing steel at 1873 K was calculated, as shown in Figure 1. It can be seen that the equilibrium curves generated by Al2O3 under conditions of pure iron and GCr15 bearing steel were in good agreement. It can be seen from Figure 1 that when the [Al] in the GCr15 bearing steel was less than 10 ppm and the [O] was close to 10,000 ppm, the Cr in molten steel was oxidized to Cr2O3. However, under the condition of the converter blowing process, the content of [O] in the steel was generally controlled below 1000 ppm, not up to 10,000 ppm, so there was basically no inclusion of Cr2O3 in the molten steel. During converter tapping, the content of [O] in the steel was in the range of 500–1000 ppm. It can be seen from the equilibrium phase diagram that solid SiO2 inclusions would be generated at this time. When the content of [O] was reduced to about 100 ppm in the refining stage, the solid SiO2 disappeared and formed liquid slag.
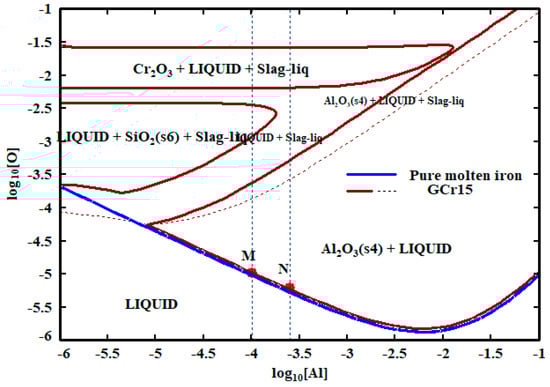
Figure 1.
Al-O equilibrium curve of GCr15 bearing steel.
When the content of [Al] in the GCr15 bearing steel was high, the deoxidation product in the end stage of the converter (the [O] content was 700 ppm) was a liquid composite oxide in the range of 0.010–0.025%. With continuous deoxidation, the [O] content gradually decreased in the refining stage, and the liquid composite oxide in the steel gradually transformed into solid Al2O3. When the Al-O reached equilibrium, the [O] content could reach 6–10 ppm, which seemed to be inconsistent with the production practice, where the T.O. of GCr15 bearing steel is controlled within 5 ppm. This is mainly because the Al-O equilibrium curve is not only related to the composition of molten steel, but also to the temperature of molten steel. The Al-O equilibrium curve in Figure 1 was calculated at 1873 K. The carbon content of the GCr15 bearing steel was high, the liquidus temperature was only 1728 K, and the pouring temperature was generally 1753 K. In the actual production process, T.O. analysis is generally carried out in the tundish or on a continuous casting billet, and the temperature is relatively low. The Al-O equilibrium curves calculated at different temperatures (1873 K, 1813 K, 1773 K, 1753 K) are shown in Figure 2, and they represent the production conditions during converter tapping, LF refinement, RH vacuum treatment, and tundish casting, respectively. It can be seen that the balance of the [O] content with the [Al] content in molten steel gradually decreased with the decrease in temperature. M1\M2\M3\M4 was the Al-O equilibrium point when the [Al] content was 0.010%, and the corresponding equilibrium for the [O] content was 10 ppm, 4.68 ppm, 2.88 ppm, or 2.14 ppm, respectively. N1\N2\N3\N4 was the Al-O equilibrium point when the [Al] content was 0.025%, and the corresponding equilibrium for the [O] content was 6 ppm, 2.75 ppm, 1.5 ppm, or 1.23 ppm. Therefore, when the Al content in the GCr15 bearing steel was controlled within the range of 0.01–0.025%, the T.[O] content in the steel could be controlled within 5 ppm, which is consistent with the actual test results in production.
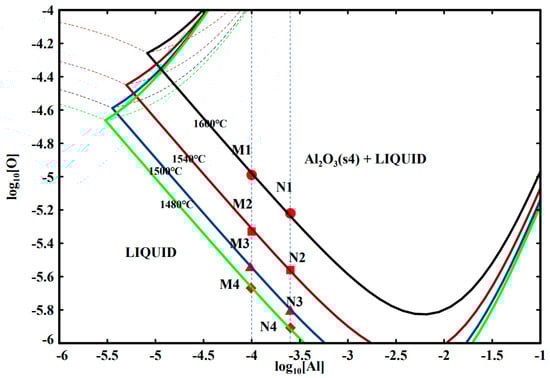
Figure 2.
Al-O equilibrium curves of GCr15 bearing steel at different temperatures.
3.2. Si-O Equilibrium of GCr15 Bearing Steel
Figure 3a shows the Si-O equilibrium curve of GCr15 bearing steel under the condition of a weak Si deoxidization process. It can be seen that the equilibrium curve was obviously different from that of pure iron. When the content of [O] in the steel was above 600 ppm, Cr2O3 deoxidation products appeared in the steel, but with a decrease in [O] content, the Cr2O3 gradually disappeared. On the other hand, when [Si] < 0.15%, the deoxidation products in the steel were mainly liquid inclusions, and the [O] content in the steel remained basically unchanged, without a deoxidation effect. Only when the [Si] content was greater than 0.15% did the [O] content in the steel gradually decrease, and when it was greater than 0.35%, solid SiO2 gradually appeared in the steel. Therefore, it is reasonable for a steel plant to design the composition of [Si] at 0.15–0.35% and set a target of 0.28%. It can be seen from Figure 3a that when the [Si] content of GCr15 bearing steel was controlled in the range of 0.15–0.35% without Al deoxidation, the equilibrium [O] content in the steel was lowest at about 100 ppm.
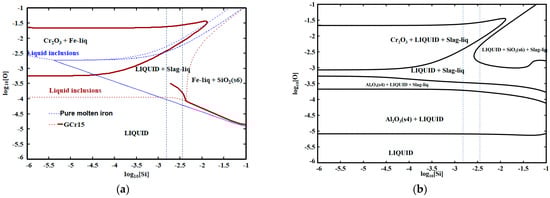
Figure 3.
Si-O equilibrium curve of GCr15 bearing steel. (a) [Al] = 0%; (b) [Al] = 0.015%.
Figure 3b shows the Si-O equilibrium curve of GCr15 bearing steel when [Al] = 0.015%. It can be seen that there is a great difference from Figure 3a without Al. Because aluminum is a stronger deoxidation element than silicon, when aluminum was added to the steel, the following chemical reaction occurred: Al + SiO2 = Al2O3 + Si. The deoxidation product was mainly Al2O3, and the equilibrium [O] content in molten steel could reach below 10 ppm. When the content of [Si] was controlled in the range of 0.15–0.35%, as the content of [O] gradually decreased, the deoxidation products gradually transformed from liquid composite products into Al2O3.
3.3. Mn-O Equilibrium of GCr15 Bearing Steel
Mn is a weaker deoxidizer than silicon. Figure 4a shows the Mn-O equilibrium curve of GCr15 bearing steel (Al = 0%,Si = 0.28%). From Figure 4a, it can be seen that with the increase in [Mn] content, the content of [O] in the steel had almost no change and was maintained at the level of 100 ppm; only when [Mn] > 0.25% did [O] slightly decrease. The calculation results are consistent with those in Figure 3.

Figure 4.
Mn-O equilibrium curve of GCr15 bearing steel. (a) [Al] = 0%; (b) [Al] = 0.015%).
It can also be seen from Figure 4b that when [Mn] was in the range of 0.25–0.45%, there were almost no single solid SiO2 and MnO particles in the steel, and the deoxidation product was a liquid composite inclusion. When [Al] = 0.015%, the deoxidation products in the GCr15 bearing steel were mainly liquid composite inclusions and solid Al2O3 inclusions, and the final [O] equilibrium was about 7 ppm.
4. Thermodynamic Analysis of the Deoxidation of Different Binary Combinations
4.1. Al-Si Deoxidation Equilibrium
Si-Mn alloy was added to the molten steel for deoxidation in a certain steel plant during converter tapping, and then aluminum particles were added to the refining process for strong deoxidation. The Al-Si deoxidation equilibrium curves with different oxygen contents under these process conditions are shown in Figure 5. It can be seen that only when the [O] content was high and the [Al] content was low were solid SiO2 inclusions formed. As the [Al] content increased, the following reactions occurred: SiO2 + [Al] = Al2O3 + [Si]. SiO2 gradually transformed into Al2O3.
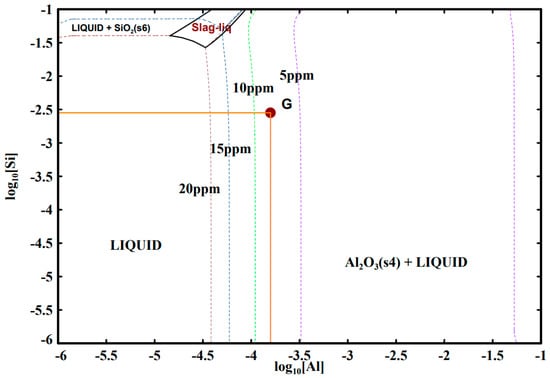
Figure 5.
Si-Al-O equilibrium curve of GCr15 bearing steel.
The composition of GCr15 bearing steel in a steel plant is indicated by G in Figure 5, where it is assumed that the [O] corresponding to the G point is the critical [O]. From Figure 5, it can be seen that the critical [O] was closely related to the [Al], and it had no relationship with the [Si]. When the [Al] decreased, the critical [O] increased, so when the actual [O] in the steel was lower than the critical [O], there were no Al2O3 solid inclusions in the steel, which is one of the reasons for why the [Al] in steel needs to be strictly controlled in the actual production process.
4.2. Si-Mn Deoxidation Equilibrium
Because the Al2O3 inclusions produced by Al deoxidization cause great harm to the mechanical properties of bearing steel, especially its fatigue properties [16,17], some scholars have studied bearing steel with weak Si-Mn deoxidization [18,19]. Figure 6 shows the Si-Mn-O equilibrium curve of GCr15 bearing steel. It can be seen that when the content of [O] in steel decreased to less than 20 ppm, only when the content of [Si] in steel reached 3.2% would the deoxidation equilibrium product appear in the form of solid SiO2. When the composition of a steel plant is controlled in H, there will not be solid inclusions in the steel, and the corresponding [O] in the steel will be much greater than 20 ppm but can reach about 100 ppm (Figure 3a and Figure 4a), which is quite different from the T.O. content reported in the literature. This is mainly due to the deoxidization of bearing steel in the literature [16], in addition to Si-Mn deoxidization, as well as the use of vacuum carbon deoxidization. Under vacuum conditions, carbon’s deoxidization ability is stronger than that of Al, so the [O] in the steel can be reduced to less than 10 ppm or even lower.
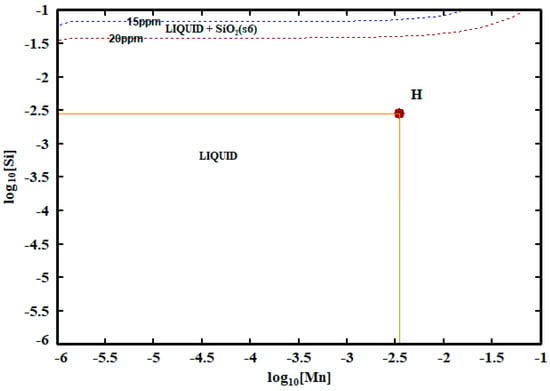
Figure 6.
Si-Mn-O equilibrium curve of GCr15 bearing steel.
4.3. Al-Ti Deoxidation Equilibrium
The phase diagram of the Al-Ti-O system of GCr15 bearing steel at 1873 K was calculated with FactSage8.1, as shown in Figure 7. There were four oxide regions, namely, Al2O3, Ti2O3, Ti3O5, and liquid oxides (Al2O3-TiOx). The content ranges of Al and Ti were 0.0001–1%. The boundary line of each solid phase was calculated with the [O] content as a parameter. The Ti content was 0.58–1%, forming a Ti2O3 phase. When the Ti content was less than 0.58%, the Ti3O5 phase was stable. Therefore, the phase boundary between the Ti3O5 phase and Ti2O3 phase was 0.58%. In addition, when the composition of molten steel with high aluminum content was located in the Al2O3 phase, the number of Al2O3 inclusions increased. Similarly, when the [Al] content was low, titanium was oxidized to form excessive titanium oxide inclusions. Wan-Yi Kim [20] and Fabienne [21] also obtained the same research conclusion. Wan-Yi Kim [20] studied the thermodynamic relationship between aluminum and titanium in molten iron by using the metal–nitride–gas equilibrium method. Using the measured thermodynamic data, the stability diagrams of the Al2O3, Ti2O3, and Ti3O5 phases were constructed. The results show that under equilibrium conditions, at 1873 K, the aluminum-killed steel with a soluble aluminum content of 0.02–0.05 mass% would not form titanium oxide with the addition of titanium. Fabienne [21] analyzed the precipitation of non-metallic inclusions in Ti-killed steel using the multi-phase equilibrium program CEQCSI based on the IRSID slag model, and they concluded that (a) the nature of reoxidation inclusions formed in Al-killed steels stabilized with Ti depending on the local Al content; alumina inclusions were formed with high Al content, whereas inclusions containing both Ti oxides and Al2O3 were formed in low Al steels. (b) In the case of steels for plates in which the precipitation of Al2O3-TiO2 inclusions is desired, the optimal steel composition is Ti in the range of 100–200 ppm and Al in the range of 20–30 ppm.
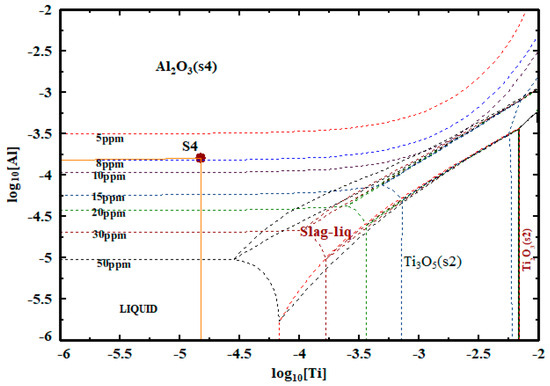
Figure 7.
Al-Ti-O equilibrium curve of GCr15 bearing steel.
When GCr15 bearing steel is produced in a steel plant, the content of [Ti] is controlled at 0.0015% (F), and the content is low. Therefore, the content of [O] in the steel is reduced to less than 50 ppm, and no titanium oxide is generated, as mainly Al2O3 is present. This is the conclusion obtained for the thermodynamic equilibrium state, but it is not necessarily possible to reach the thermodynamic equilibrium state in an actual production process, or there may be a locally unbalanced state, so there will be titanium oxide inclusions in the Al-Ti composite deoxidation process. H. Matsuura [22] found that the equilibrium time for Al was faster than that for Ti. When Al and Ti were added at the same time, Al2O3 was formed first. Due to local Al depletion and Ti supersaturation, the addition of Ti led to the formation of oxide inclusions with Ti content up to 20 mol%. With the increase in Ti content, the proportion of Ti-containing inclusions increased. Finally, in all samples, the thermodynamically stable Al2O3 inclusion dominated within 5 min, but the morphology of these final inclusions was polygonal, unlike the spherical inclusions formed immediately after Al deoxidation. Whether Ti-containing oxides are produced in steel is also related to the oxygen content in steel. Marie-Aline [23] found that only Al2O3 inclusions were observed when strong Al deoxidation was performed prior to Ti alloying. On the other hand, with partially deoxidized steel, Ti deoxidation took place prior to Ti addition (a[O]:140–280 ppm). In that case, large Al2O3 clusters and small Ti–Al oxide particles randomly distributed in the steel were found. After the second addition of Al, only Al2O3 clusters and a few small Ti–Al–O inclusions remained due to the reduction of Ti oxides by [Al].
5. Thermodynamic Analysis of Inclusion Modifications in GCr15 Bearing Steel by Rare-Earth Ce
In order to carry out modification treatments of inclusions in steel, many researchers have used rare-earth elements with the expectation of obtaining dispersed and fine inclusions so as to reduce the influence of non-uniform large-particle inclusions on the properties of the steel [24,25,26,27,28]. For example, the authors of [8] studied the influence of Ce on the degeneration of inclusions, the formation of carbides, and the solidification structure of H13 steel. It was found that the solidification structure was refined, and a large number of small Ce2O2S inclusions promoted the nucleation of the solidification process. At the same time, the evolution path of inclusions after adding Ce was studied: Al11O18Ce→CeAlO3→Ce2O3→Ce2O2S. Y. Jiang [29] prepared ultra-high-strength structural steel with a Ce content of 0, 0.0367, 0.0559, and 0.0792 wt.% and studied the effects of Ce addition on inclusions and the toughness of ultra-high-strength steel. The results showed that 0.0367wt.% Ce can refine the size of oxides or sulfides to about 1 μm, improve the morphology of inclusions to create a spherical shape, and, thus, improve the toughness of L-Ce steel.
The phase diagram of the Al-Ce-O system for GCr15 bearing steel at 1873 K and [O] = 10 ppm was calculated with FactSage 8.1, as shown in Figure 8a. Seven oxide regions were generated, namely, Al2O3, Al11O18Ce, Al11O18Ce + Al2O3, CeAlO3 +Al11O18Ce, CeAlO3, CeAlO3+ Ce2O3, and Ce2O3. The content of Al was 0.001–1%, and the content of Ce was 0.0001–0.1%. The boundary line of each solid phase was calculated with the [O] content as a parameter. It can be seen that when [Al] = 0.015%, [O] = 10 ppm; with the increase in [Ce] content, the evolution path of Al2O3 inclusions was Al11O18Ce→CeAlO3→Ce2O3, which was slightly different from the evolution path of inclusions in H13 steel studied in the literature, and there was no Ce2O2S. The next step was verified with industrial tests.
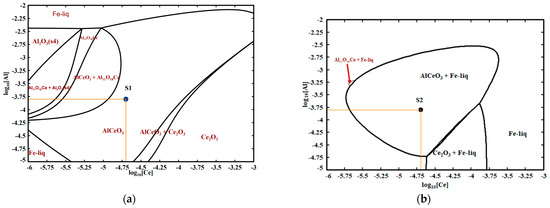
Figure 8.
Ce-Al-O equilibrium curve of GCr15 bearing steel. (a) [O] = 10 ppm; (b) [O] = 5 ppm.
At the present composition control point S1, [Ce] = 0.0019%. At this time, the equilibrium deoxidation product in the steel is CeAlO3, which is not completely converted into Ce2O3. Only when [Ce] > 0.018% will the final product generate Ce2O3. However, the inclusion of rare-earth inclusions causes the clogging of the continuous casting nozzle, so the ratio of Ce to Al should be reasonably controlled to avoid the formation of Ce2O3 in production practice [30].
Figure 8b shows the phase diagram of the Al-Ce-O system of GCr15 bearing steel at 1873 K and [O] = 5 ppm, which is different from Figure 8a. There were three oxide regions, Al11O18Ce, CeAlO3, and Ce2O3. Due to the decrease in [O] content, the Al2O3 phase completely disappeared.
At the present composition control point S2, [Ce] = 0.0019%; the equilibrium deoxidation product in the steel is CeAlO3, and it is not completely transformed into Ce2O3. In order to realize the complete denaturation of inclusions into Ce2O3, it is necessary to improve the process according to the direction of the arrow in the diagram: increasing [Ce] > 0.006% and reducing [Al] = 0.01%.
The phase diagram of the Si-Ce-O system of GCr15 bearing steel at 1873 K and [O] = 5 ppm was also calculated with FactSage8.1 (Figure 9), and this corresponds to the weak Si-Mn deoxidization process. It can be seen from Figure 9 that Ce2O3 and CeS were produced in the molten steel when [Ce] was 0.001–0.1%, [Si] was 0–1%, and [O] was less than 50 ppm, while CeCrO3 inclusions appeared in the molten steel when [O] reached 50 ppm. The final [O] content of GCr15 bearing steel will be controlled below 10 ppm, or even below 5 ppm, so CeCrO3 only exists in a certain stage of the deoxidization process and will not remain in the final steel.
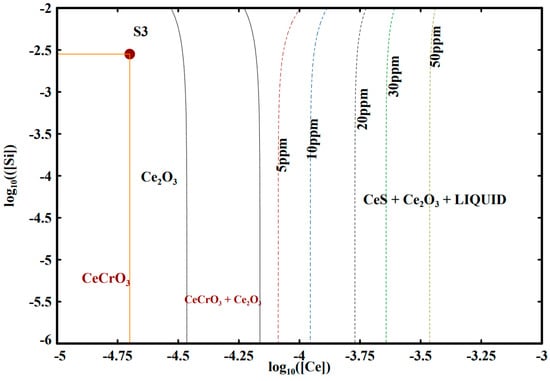
Figure 9.
Equilibrium curve of Ce-Si-O for GCr15 bearing steel.
When [O] = 10 ppm, [Ce] = 0.012% was the critical control point. When [Ce] > 0.012%, CeS inclusions appeared in the steel, and the final equilibrium product was CeS + Ce2O3. When [Ce] < 0.012%, CeS was not produced in the steel, and only Ce2O3 existed. In addition, it can be seen that there was no stable phase of SiO2 or MnO in the phase diagram when the Si-Mn weak deoxidation process was adopted and the rare-earth Ce was used for modification.
6. Conclusions
- (1)
- Based on thermodynamic calculations with FactSage8.1, the single deoxidization curves of Al, Si, and Mn and the binary compound deoxidization curves of Al-Si and Si-Mn in pure iron conditions and GCr15 bearing steel production conditions were quite different. When using the FactSage 8.1 thermodynamic software, database selection is very important. Different databases may lead to different calculation results. The calculation results of the FactSage thermodynamic software can be used as a reference, and the test results need to be corrected and verified.
- (2)
- Temperature has a great influence on the Al-O equilibrium curve of GCr15 bearing steel. With the decrease in temperature, the Al-O equilibrium curve moves downward. With the same Al content, the equilibrium oxygen content decreases. When T = 1873 K, the [Al] in GCr15 bearing steel is in the range of 0.010–0.025% and the [O] content can reach 6–10 ppm; when the temperature is reduced to 1753 K, the [O] content can reach 1.23–2.14 ppm.
- (3)
- The Al-Ti equilibrium curve of GCr15 bearing steel shows that when the [Ti] content of GCr15 bearing steel is controlled at 0.0015% and the [O] content in the molten steel is reduced to less than 50 ppm, there is no titanium oxide in the molten steel, and the deoxidation product is mainly Al2O3.
- (4)
- When Ce was added to Al deoxidized bearing steel at T = 1873 K, the evolution path of Al2O3 was Al11O18Ce→CeAlO3→Ce2O3. When Ce was used to modify the inclusions in Si-Mn deoxidized bearing steel at T = 1873 K, the stable oxide type in the molten steel was closely related to the [O] content in the molten steel. CeCrO3 appeared when [O] > 50 ppm and disappeared when [O] < 50 ppm. When [O] = 10 ppm, [Ce] = 0.012% was the critical control point. When [Ce] > 0.012%, CeS inclusions appeared in the steel, and the final equilibrium product was CeS + Ce2O3. When [Ce] < 0.012%, CeS was not produced in the steel, and only Ce2O3 existed.
Author Contributions
Writing—original draft: L.C.; Final approval of the version to be published: L.Z.; data collection, data analysis: Z.G.; literature search, figures, study design: R.Z. and G.Q. All authors have read and agreed to the published version of the manuscript.
Funding
This paper was financially supported by Hebei Natural Science Foundation (E2021417001), Science and Technology Project of Hebei Education Department (QN2022090), and the Key R & D projects in Hebei Province of China (21311002D).
Data Availability Statement
Data are contained within the article.
Conflicts of Interest
The authors declare no conflict of interest.
References
- Gu, C.; Bao, Y.-P.; Gan, P.; Wang, M.; He, J.-S. Effect of main inclusions on crack initiation in bearing steel in the very high cycle fatigue regime. Int. J. Miner. Met. Mater. 2018, 25, 623–629. [Google Scholar] [CrossRef]
- Arakere, N.K. Gigacycle rolling contact fatigue of bearing steels: A review. Int. J. Fatigue 2016, 93, 238–249. [Google Scholar] [CrossRef]
- Shiozawa, K.; Lu, L. Very high-cycle fatigue behavior of shot-peened high-carbon–chromium bearing steel. Fatigue Fract. Eng. Mater. Struct. 2010, 25, 813–822. [Google Scholar] [CrossRef]
- Krupp, U.; Koschella, K.; Gierltler, A. The significance of grain size, segregations and inclusions for the very high cycle fatigue (VHCF) behavior of tempered martensitic steels. Procedia Struct. Integr. 2019, 23, 517–522. [Google Scholar] [CrossRef]
- Zheng, H.-Y.; Guo, S.-Q.; Qiao, M.-R.; Qin, L.-B.; Zou, X.-J.; Ren, Z.-M. Study on the modification of inclusions by Ca treatment in GCr18Mo bearing steel. Adv. Manuf. 2019, 7, 438–447. [Google Scholar] [CrossRef]
- Ma, W.J.; Bao, Y.P.; Wang, M.; Zhao, D.W. Influence of slag composition on bearing steel cleanness. Ironmak. Steelmak. 2014, 41, 26–30. [Google Scholar] [CrossRef]
- Xiao, W.; Wang, M.; Bao, Y. The Research of Low-Oxygen Control and Oxygen Behavior during RH Process in Sili-con-Deoxidization Bearing Steel. Metals 2019, 9, 812. [Google Scholar] [CrossRef]
- Wang, X.; Li, G.; Liu, Y.; Wang, F.; Wang, Q. Cerium Addition Effect on Modification of Inclusions, Primary Carbides and Microstructure Refinement of H13 Die Steel. ISIJ Int. 2021, 61, 1850–1859. [Google Scholar] [CrossRef]
- Dong, Z.; Qian, D.; Yin, F.; Wang, F. Enhanced Impact Toughness of Previously Cold Rolled High-Carbon Chromium Bearing Steel with Rare Earth Addition. J. Mater. Eng. Perform. 2021, 30, 8178–8187. [Google Scholar] [CrossRef]
- Ma, C.; Lv, M.; Gao, X.; Wang, H.; Wei, H.; Gao, S. High-throughput search for RE (La, Ce and Y) contained stoichiometric compound in steels. Mater. Res. Express 2021, 8, 046514. [Google Scholar] [CrossRef]
- Yang, W.; Zhang, L.; Wang, X.; Ren, Y.; Liu, X.; Shan, Q. Characteristics of Inclusions in Low Carbon Al-Killed Steel during Ladle Furnace Refining and Calcium Treatment. ISIJ Int. 2013, 53, 1401–1410. [Google Scholar] [CrossRef]
- Zhang, L.; Ren, Y.; Duan, H.; Yang, W.; Sun, L. Stability Diagram of Mg-Al-O System Inclusions in Molten Steel. Met. Mater. Trans. B 2015, 46, 1809–1825. [Google Scholar] [CrossRef]
- Ren, Y.; Zhang, L.; Yang, W.; Duan, H. Formation and Thermodynamics of Mg-Al-Ti-O Complex Inclusions in Mg-Al-Ti-Deoxidized Steel. Met. Mater. Trans. B 2014, 45, 2057–2071. [Google Scholar] [CrossRef]
- Cao, L.; Zhu, L.; Guo, Z.; Qiu, G. Thermodynamics and Nucleation Kinetics Model of Nonalloyed Carbon Deoxidation of Bearing Steel. Steel Res. Int. 2023, 94, 2200269. [Google Scholar] [CrossRef]
- Cao, L.; Zhu, L.; Guo, Z.; Qiu, G. Thermodynamic model and mechanism of non-alloyed hydrogen deoxidation of GCr15 bear-ing steel. Ironmak. Steelmak. 2023, 50, 360–369. [Google Scholar] [CrossRef]
- Hashimoto, K.; Fujimatsu, T.; Tsunekage, N.; Hiraoka, K.; Kida, K.; Santos, E.C. Effect of inclusion/matrix interface cavities on internal-fracture-type rolling contact fatigue life. Mater. Des. 2011, 32, 4980–4985. [Google Scholar] [CrossRef]
- Neishi, Y.; Makino, T.; Matsui, N.; Matsumoto, H.; Higashida, M.; Ambai, H. Influence of the Inclusion Shape on the Rolling Contact Fatigue Life of Carburized Steels. Met. Mater. Trans. A 2013, 44, 2131–2140. [Google Scholar] [CrossRef]
- Xiao, W.; Bao, Y.-P.; Gu, C.; Wang, M.; Liu, Y.; Huang, Y.-S.; Sun, G.-T. Ultrahigh cycle fatigue fracture mechanism of high-quality bearing steel obtained through different deoxidation methods. Int. J. Miner. Met. Mater. 2021, 28, 804–815. [Google Scholar] [CrossRef]
- Guo, X.; Tan, M.; Li, T.; Ju, L.; Dang, J.; Guo, H. Formation Mechanisms and Three-dimensional Characterization of Composite Inclusions in Low Aluminum Steel Deoxidized by Silicon. ISIJ Int. 2023, 63, 338–345. [Google Scholar] [CrossRef]
- Kim, W.-Y.; Jo, J.-O.; Lee, C.-O.; Kim, D.-S.; Pak, J.-J. Thermodynamic Relation between Aluminum and Titanium in Liquid Iron. ISIJ Int. 2008, 48, 17–22. [Google Scholar] [CrossRef][Green Version]
- Ruby-Meyer, F.; Lehmann, J.; Gaye, H. Thermodynamic analysis of inclusions in Ti-deoxidised steels. Scand. J. Metall. 2000, 29, 206–212. [Google Scholar] [CrossRef]
- Matsuura, H.; Wang, C.; Wen, G.H.; Sridhar, S. The Transient Stages of Inclusion Evolution during Al and/or Ti Additions to Molten Iron. ISIJ Int. 2007, 47, 1265–1274. [Google Scholar] [CrossRef]
- Van Ende, M.-A.; Guo, M.; Dekkers, R.; Burty, M.; Van Dyck, J.; Jones, P.T.; Blanpain, B.; Wollants, P. Formation and Evolution of Al–Ti Oxide Inclusions during Secondary Steel Refining. ISIJ Int. 2009, 49, 1133–1140. [Google Scholar] [CrossRef]
- Chen, R.; Wang, Z.; Zhu, F.; Zhao, H.; Qin, J.; Zhong, L. Effects of rare-earth micro-alloying on microstructures, carbides, and internal friction of 51CrV4 steels. J. Alloys Compd. 2020, 824, 153849. [Google Scholar] [CrossRef]
- Liu, X.; Yang, J.; Zhang, F.; Fu, X.; Li, H.; Yang, C. Experimental and DFT study on cerium inclusions in clean steels. J. Rare Earths 2021, 39, 477–486. [Google Scholar] [CrossRef]
- Li, H.; Yu, Y.-C.; Ren, X.; Zhang, S.-H.; Wang, S.-B. Evolution of Al2O3 inclusions by cerium treatment in low carbon high manganese steel. J. Iron Steel Res. Int. 2017, 24, 925–934. [Google Scholar] [CrossRef]
- Yang, C.; Luan, Y.; Li, D.; Li, Y. Effects of rare earth elements on inclusions and impact toughness of high-carbon chromium bearing steel. J. Mater. Sci. Technol. 2019, 35, 1298–1308. [Google Scholar] [CrossRef]
- Wang, Y.; Liu, C. Effect of Cerium and Magnesium Addition on Evolution and Particle Size of Inclusions in Al-killed Molten Steel. ISIJ Int. 2022, 62, 1852–1861. [Google Scholar] [CrossRef]
- Jiang, Y.; Li, Y.; Dai, Q.; Chai, S.; Li, K. Evolution of inclusions with cerium addition and effects of C-containing rare earth inclusions on the toughness of ultra-high-strength structural steel. Ironmak. Steelmak. 2023, 50, 184–1996. [Google Scholar] [CrossRef]
- Katsumata, A.; Todoroki, H. Effect of Rare Earth Metal on Inclusion Composition in Molten Stainless Steel. ISS Trans. Iron Steelmak. 2002, 29, 51–57. [Google Scholar]


Disclaimer/Publisher’s Note: The statements, opinions and data contained in all publications are solely those of the individual author(s) and contributor(s) and not of MDPI and/or the editor(s). MDPI and/or the editor(s) disclaim responsibility for any injury to people or property resulting from any ideas, methods, instructions or products referred to in the content. |
© 2023 by the authors. Licensee MDPI, Basel, Switzerland. This article is an open access article distributed under the terms and conditions of the Creative Commons Attribution (CC BY) license (https://creativecommons.org/licenses/by/4.0/).