Article

Influence of R-Ratio on Fatigue of Aluminum Bonding Wires

by
Cassandra Moers
* and
Christian Dresbach
*
Institute of Technology, Resource and Energy-Efficient Engineering, University of Applied Sciences Bonn-Rhein-Sieg, von-Liebig-Str. 20, 53359 Rheinbach, Germany
*
Authors to whom correspondence should be addressed.
Metals 2023, 13(1), 9; https://doi.org/10.3390/met13010009
Submission received: 25 November 2022 / Revised: 16 December 2022 / Accepted: 17 December 2022 / Published: 20 December 2022
(This article belongs to the Section Metal Failure Analysis)

Abstract

:
Bonding wires made of aluminum are the most used materials for the transmission of electrical signals in power electronic devices. During operation, different cyclic mechanical and thermal stresses can lead to fatigue loads and a failure of the bonding wires. A prediction or prevention of the wire failure is not yet possible by design for all cases. The following work presents meaningful fatigue tests in small wire dimensions and investigates the influence of the R-ratio on the lifetime of two different aluminum wires with a diameter of 300 µm each. The experiments show very reproducible fatigue results with ductile failure behavior. The endurable stress amplitude decreases linearly with an increasing stress ratio, which can be displayed by a Smith diagram, even though the applied maximum stresses exceed the initial yield stresses determined by tensile tests. A scaling of the fatigue results by the tensile strength indicates that the fatigue level is significantly influenced by the strength of the material. Due to the very consistent findings, the development of a generalized fatigue model for predicting the lifetime of bonding wires with an arbitrary loading situation seems to be possible and will be further investigated.

Graphical Abstract

1. Introduction

Heavy bonding wires made of high-purity aluminum with diameters between 125 µm and 500 µm are the most used materials for the transmission of electrical signals and for the electrical connection in power electronic devices. More than 90% of the bonding wires are processed into bridges by wedge-wedge wire bonding [1].
In this process, the bonding wire is held by a wedge bond tool and is welded by ultrasonic power on a substrate material. The geometry of a wire bridge is created by the movement of the bond tool [2,3]. The wire bridge usually connects substrate materials with different thermal expansion coefficients. During operation, the bonding wires are exposed to electric current, corrosive media as well as cyclic mechanical and thermal stresses in a temperature range of −20 °C to +125 °C [2]. The combination of differences in thermal expansion of the substrates and the cyclic stresses can lead to fatigue loads and thus to an early failure of the bonding wires, which is related to low cycle fatigue or high cycle fatigue, depending on the application. The fatigue loading can result in cracks in the heel area or the loop top of the bonding wires or a lift-off from the substrates which can lead to a failure of the complete electronic component or device [2,4,5]. The prediction or the prevention of wire failure in highly stressed components is not yet possible by design for all cases. However, from preceding investigations, it is already known that the geometry of the wire bridge, e.g., its height or length, has an influence on its lifetime [4,6].
There are multiple publications which focus on the reliability or lifetime of aluminum bonding wires with different methods and approaches, e.g., (a) axial and transversal micro-compression tests on small wire cylinders to characterize the anisotropic hardening behavior [2,5], (b) uniaxial low cycle fatigue tests on Al, Cu and Al/Cu bonding wires with diameters of 300 µm and a testing length of 1 mm [7], (c) very high cycle strain fatigue tests on Al bonding wires with an ultrasonic resonance system [8], (d) fatigue tests of wire bridges caused by a relative movement of the bond bases realized by a piezo actuated test bench [4,9] or a resonance testing system [10], (e) accelerated mechanical fatigue interconnect tests on wire bridges investigated by a modified semi-automated bond wire fatigue tester [11,12] or (f) electrical power cycling tests of wire bridges to investigated the microstructural changes in the interface [13].
The presented publications show that most of the reliability and lifetime predictions deal with the investigation of the wire bridges and that there are currently few publications on fatigue tests of the wire material itself. Therefore, the aim is to be able to predict the fatigue mechanism and lifetime behavior of the wires which is not tied to the wire bridge geometry. Herein, we take on a special challenge to carry out meaningful and robust lifetime tests in small wire dimensions with acceptable test frequencies in order to characterize the fatigue behavior for different loading situations.
The following work presents the results of fatigue tests with different R-ratios in a range between 0.1 and 0.7 of two different high-purity aluminum bonding wires with a diameter of 300 µm. The results are presented and discussed in terms of Wöhler and Smith diagrams and correlated to tensile test results. In addition, the failure behavior is analyzed by investigating their fracture surfaces by a scanning electron microscope.

2. Materials and Methods

In the following section the investigated bonding wire materials and experimental methods are presented.

2.1. Aluminum Bonding Wires

Two high-purity aluminum bonding wires with different amounts of doping elements and a diameter of 300 µm each are investigated. The first one is Alubond Pure and the second one is Alubond Prime from Heraeus Electronics/Heraeus Deutschland GmbH Co. KG (Hanau, Germany). In the following, the wires are called Al-Pure and Al-Prime, respectively. The wires are wound on coils and must be carefully unwound piecewise and cut into length of approximately 40 mm for the mechanical investigations. The wires must be gently handled at the cut ends in order to avoid damage of the wires in the tested volume. Due to their high purity, the wires are very soft, so care had to be taken during handling not to deform them.

2.2. Tensile Testing

For tensile testing, a 40 mm long wire sample was directly fixed by the clamping jaws of the electrodynamic testing machine LTM 1 HR from Zwick Roell (Ulm, Germany). The measurements were carried out with a 100 N load cell and a test length of 20 mm. The wires are tested with a speed of 5 mm/min. The tensile tests were performed as a tenfold determination for both wire types. Only wires that failed within the 20 mm clamping length are considered in the following evaluation. The nominal stress-strain curves were calculated from the determined force-displacement curves. Possible influences of the slightly bended samples were automatically corrected and the mean curves were calculated by a PythonTM (Python Software Foundation, Beaverton, OR, USA, Version 3.9) script. The yield strength σy0.2 and tensile strength σTS for both types of aluminum wires are determined from the individual measurements.

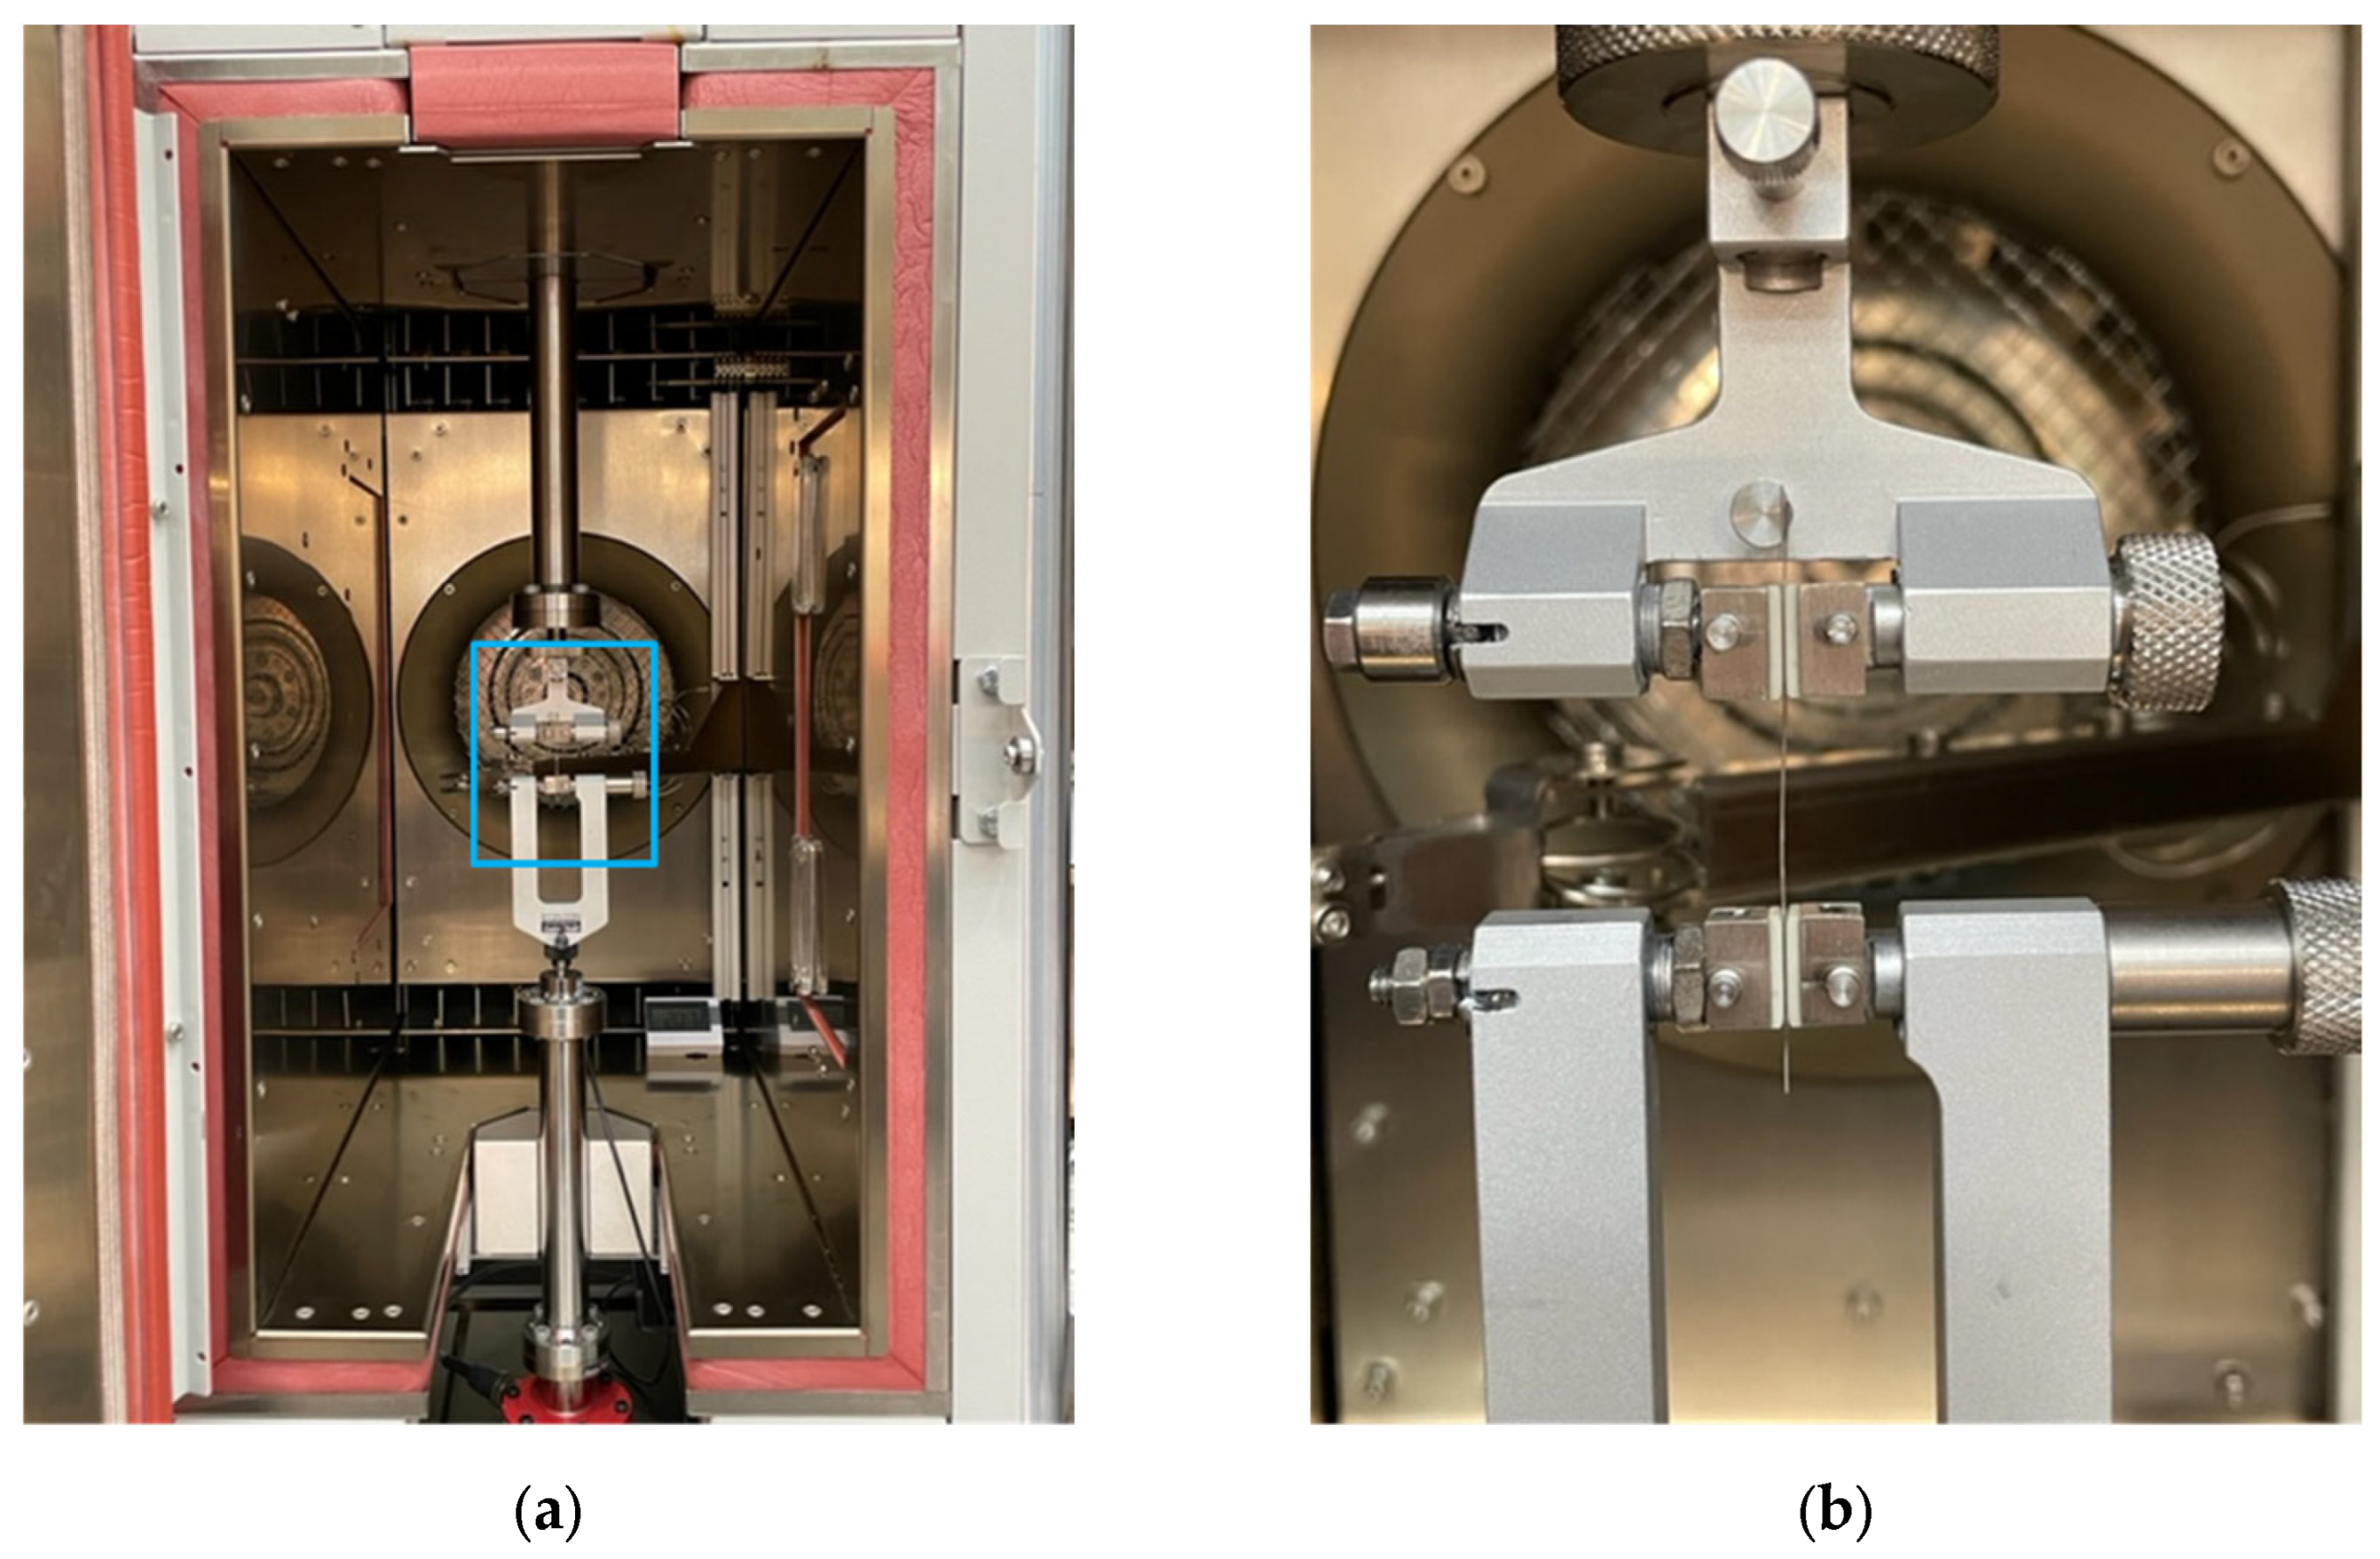
2.3. Fatigue Testing

For the fatigue testing, a 40 mm long wire sample was directly fixed by the clamping jaws of the electrodynamic testing machine LTM 1 HR from Zwick Roell (Ulm, Germany). To protect the wires from air draft or significant temperature fluctuations, the measuring setup is operated in the switched-off furnace of the LTM 1 HR. Figure 1 shows the measurement setup in the furnace (Figure 1a) including a detailed picture of a fixed wire in the clamping jaws of the machine (Figure 1b). When fixing the wire sample in the clamping jaws, care must be taken to ensure that the wires were as straight as possible without deforming and straightening the wire and that they were correctly fixed in the clamping jaws without being able to slip.
The fatigue tests were carried out with a 100 N load cell and a clamping length of 20 mm at a frequency of 40 Hz with sinusoidal load. The applied stress amplitudes σa were varied in 0.5 MPa steps for the individual R-ratios. The R-ratio was varied in the range between 0.1 and 0.7 with steps of 0.1 for Al-Pure. Al-Prime is tested with R-ratios of 0.1, 0.4 and 0.7. The R-ratio is defined by the quotient of minimum stress σmin and maximum stress σmax, see Equation (1):
R = σ min σ max
The wires were tested up to a maximum number of cycles between 1,000,000 and 10,000,000 cycles. Each fatigue experiment was evaluated by a PythonTM routine according to DIN 50100:2016-12 [14]. In the script, it is checked that there is no overshoot of the load and that the maximum and minimum stresses of each cycle are within a ±3% range of the load amplitude. Cycles, where the maximum load is below the 3% limit, are not counted for the number of cycles to failure. The measurements were carried out for each R-ratio and each stress amplitude σa at least as a double determination. Only wires which failed within the 20 mm clamping length are considered in the evaluation.
Figure 2a exemplarily shows a representative maximum stress history of a conducted fatigue experiment. Here, the maximum stress values σmax of each cycle from a fatigue experiment of an Al-Pure sample tested with a R-ratio of 0.3 and a stress amplitude σa of 13.5 MPa are shown. From this figure it can be seen, that all maximum stress values of the nearly 500,000 cycles are within the range of ±3% σa which is illustrated by the red lines. In an analogous way, the minimum stress σmin history is also checked; see Figure 2b.

2.4. SEM Analysis

In order to investigate the failure behavior, facture surfaces of selected wires from both wire types were examined after the fatigue tests by the scanning electron microscope JSM-6510 (Jeol, Tokyo, Japan). The images were generated with a secondary electron detector by a voltage of 10 kV and a working distance between 10 mm and 12 mm.

3. Results

The following section presents the results of the experimental investigation of the tensile tests, the fatigue tests and fracture surface analyses.

3.1. Tensile Testing

The nominal stress-strain curves of Al-Pure (blue) and Al-Prime (red) determined by tensile tests are shown in Figure 3. It can be observed that the results of all ten individual measurements (grey) for both wire types have a very low scatter and therefore a very good reproducibility.
The tensile tests show that Al-Prime has an initial yield stress of σy0.2 = 30.8 ± 0.7 MPa and a tensile strength of σTS = 49.2 ± 0.5 MPa. These values are higher compared to the values determined for Al-Pure, which has an initial yield stress of σy0.2 = 23.9 ± 0.7 MPa and a tensile strength of σTS = 45.8 ± 0.2 MPa. However, the results also show that for Al-Pure the tensile strength occurs at a strain of about 29%, whereas for Al-Prime it already occurs at 23%. Thus, it can be concluded that the investigated Al-Pure wire can withstand lower stresses but higher strains than the investigated Al-Prime wire.

3.2. Fatigue Testing

In the following section, the fatigue results of Al-Pure at R-ratios of 0.1, 0.2, 0.3, 0.4, 0.5, 0.6 and 0.7 will be shown in Wöhler and Smith diagrams. Then, a comparison of the fatigue results of Al-Pure and Al-Prime for R-ratios of 0.1, 0.4 and 0.7 is made and the fatigue results are correlated to the tensile behavior by scaling Wöhler and Smith diagrams to the initial yield stress σy0.2 and the tensile strength σTS, respectively.

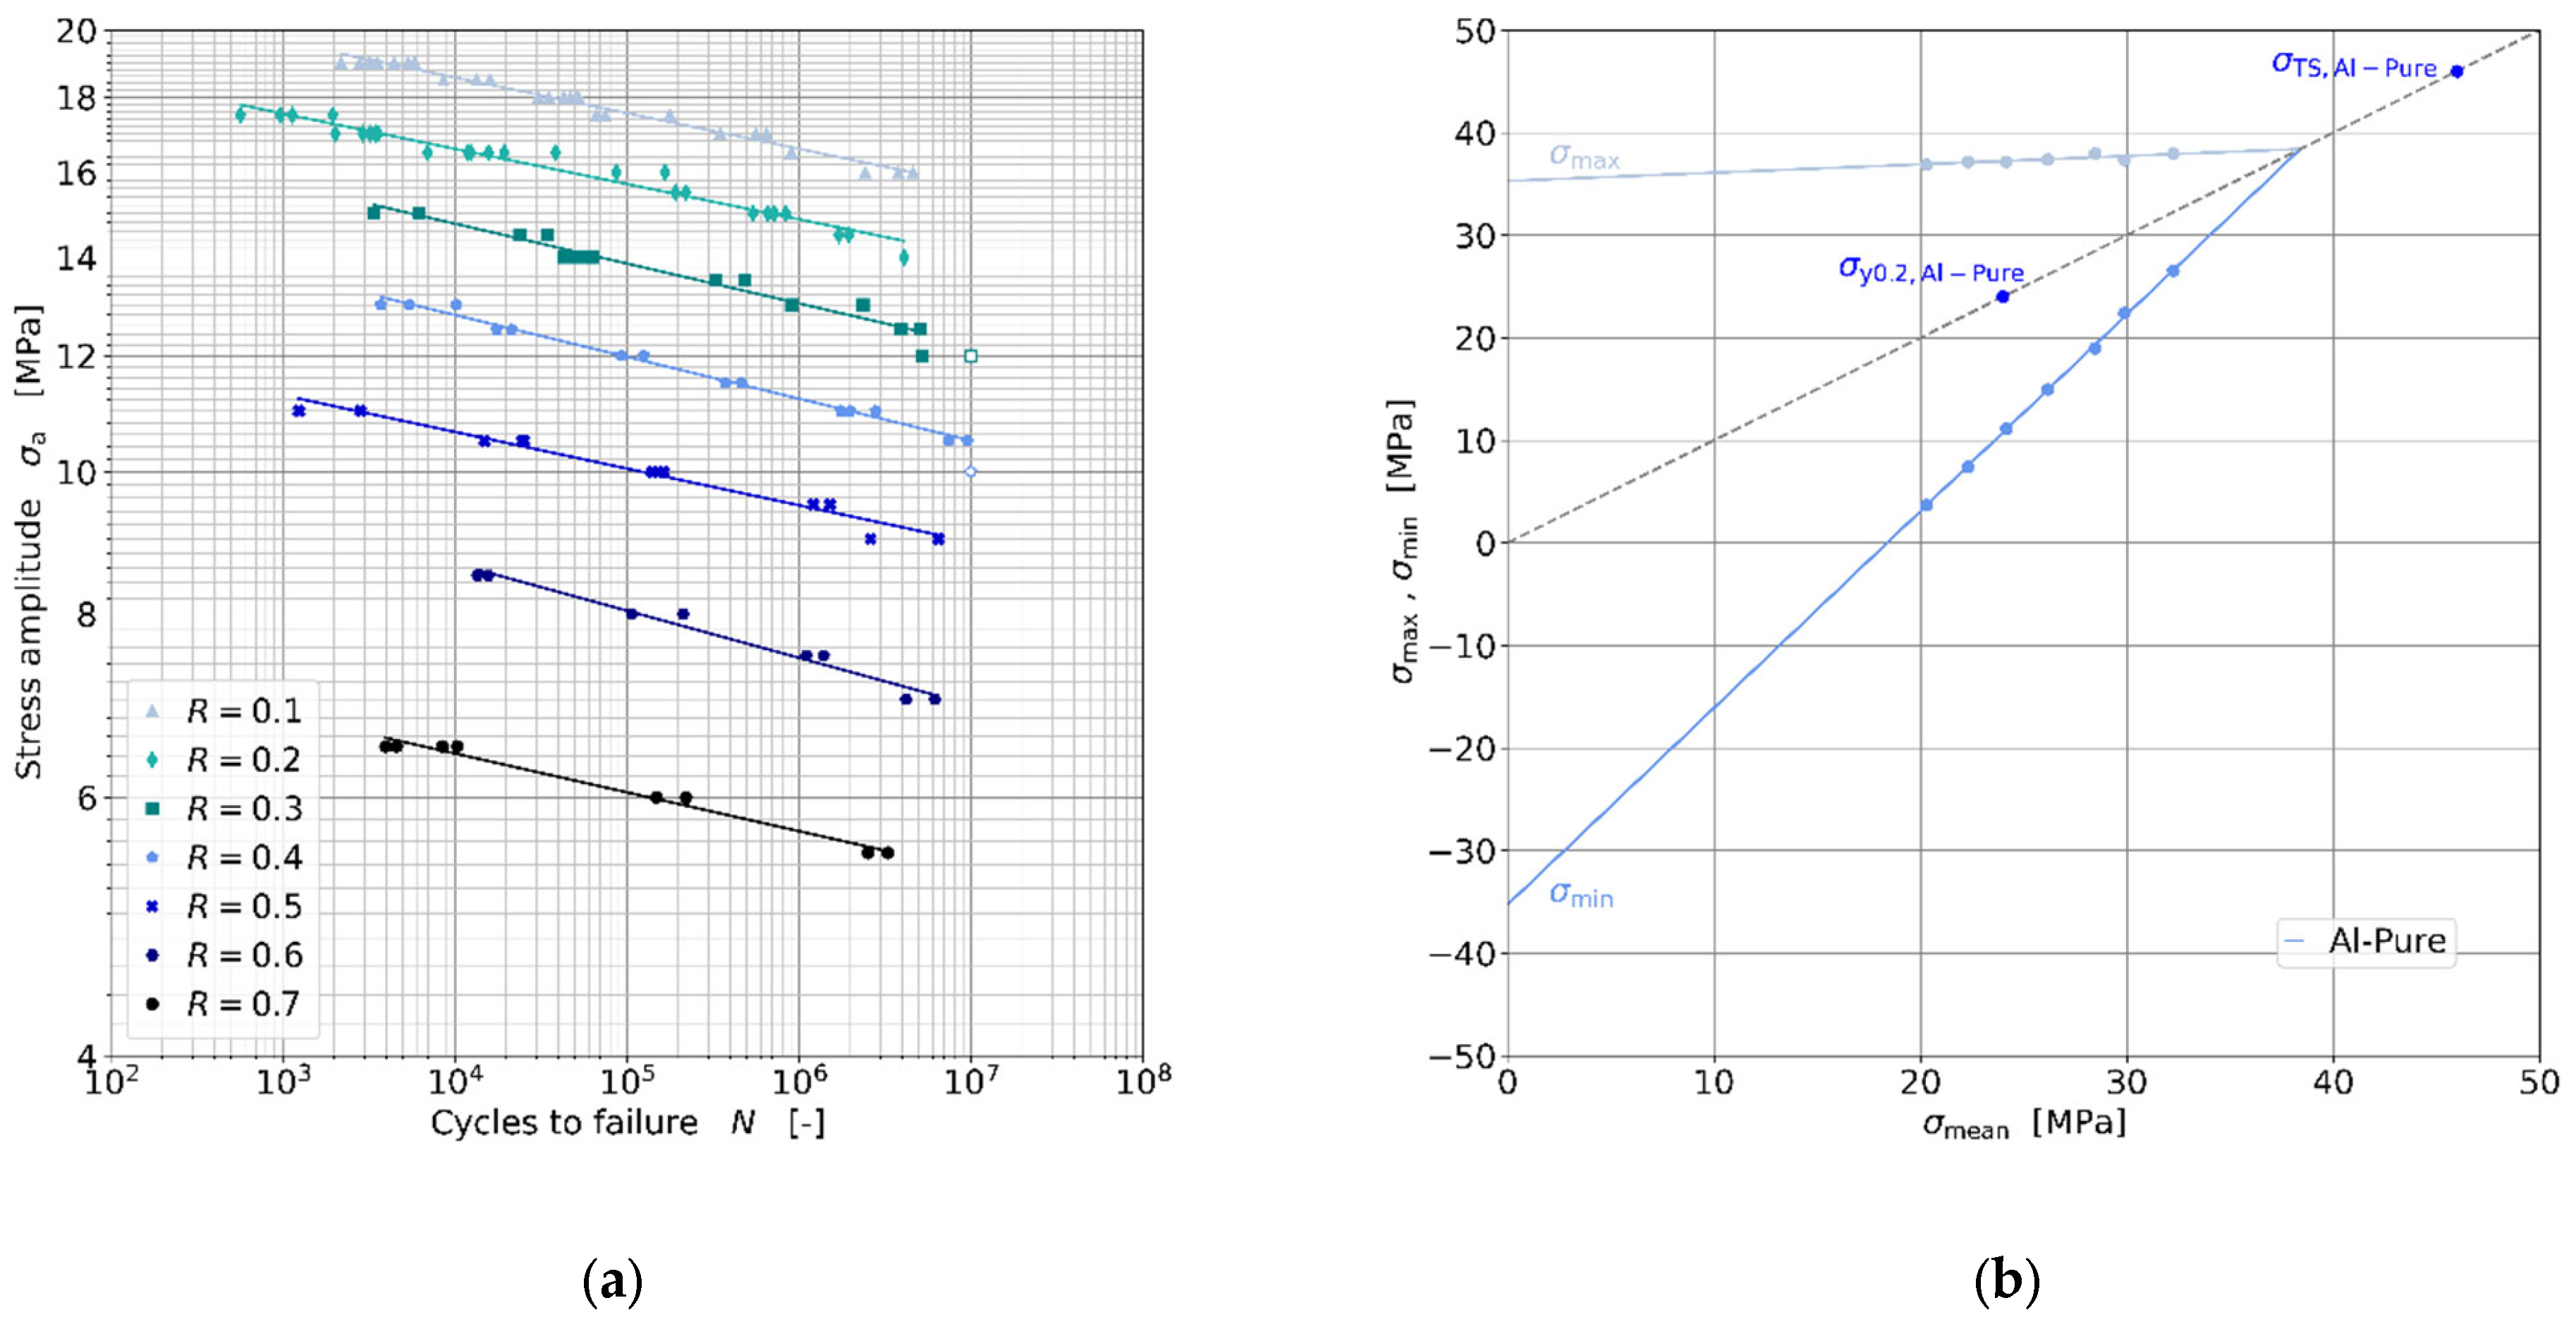
3.2.1. Influence of R-Ratio on the Fatigue of Al-Pure

Figure 4a shows the Wöhler diagram of Al-Pure with R-ratios between 0.1 and 0.7 with steps of 0.1 and maximum cycles to failure in a range of 1,000,000 and 10,000,000. Two wires have exceeded the maximum number of cycles N of 10,000,000 for the R-ratios of 0.3 and 0.4 without failing. These are presented as unfilled markers in the Wöhler curves. The fatigue results show a linear relationship in the double logarithmic plot in which the number of cycles N increases significantly with decreasing stress amplitude σa. Depending on the R-ratio, the stress amplitude decreases with increasing R-ratio. With a R-ratio of 0.1 the stress amplitudes are between 19 MPa and 16 MPa in the range of 1,000 to 1,000,000 cycles. In comparison the stress amplitudes for a R-ratio of 0.7 are between 6.5 MPa and 5.5 MPa. Furthermore, it can be observed that the slopes in the Wöhler curves slightly increase with the increasing R-ratio. In addition, fewer stress amplitudes can be approached and thus fewer measured values can be collected for a fixed stress increment of dσ = 0.5 MPa.
The fatigue results could also be represented by a Wöhler diagram showing the maximum stress against the cycles to failure. Here, the order of the fatigue curves would be reversed compared to the Wöhler diagram of the stress amplitude, meaning the maximum stress increases with increasing stress ratio. For R = 0.1 a maximum stress range of 35.6 MPa to 42.2 MPa is investigated, whereas for R = 0.7 a range of 36.7 MPa to 43.3 MPa is investigated. Since the effect of the R-ratio on the maximum stress is rather small, it is more useful to illustrate this effect in terms of a Smith diagram. For this purpose, the maximum stresses σmax and minimum stresses σmin for 1,000,000 cycles are calculated from the linear regression equations of the Wöhler curves and plotted against the mean stress σmean to construct the Smith diagram, shown in Figure 4b. For each R-ratio, there is a pair of values of maximum and minimum stresses which describe a linear increasing trend, whereby the minimum stress has a significantly greater slope than the maximum stress. It can be observed that the difference between the maximum and minimum stress becomes smaller with the increasing R-ratio. When the lines of maximum and minimum stress are linearly extended, they meet between the yield stress σy0.2 and the tensile strength σTS on a 45-degree line. All maximum stress values significantly exceed the initial yield stress value, so that massive plastic deformation is to be expected, even for loading situations where failure occurs above 1,000,000 cycles.
The regime between the maximum and minimum stress indicates the usable range in which the stress amplitudes σa for each R-ratio can be varied. It can be determined that the usable stress amplitude range decreases with increasing R-ratio. This also shows why in the Wöhler diagram in Figure 4a fewer stress levels could be investigated with the increasing R-ratio.

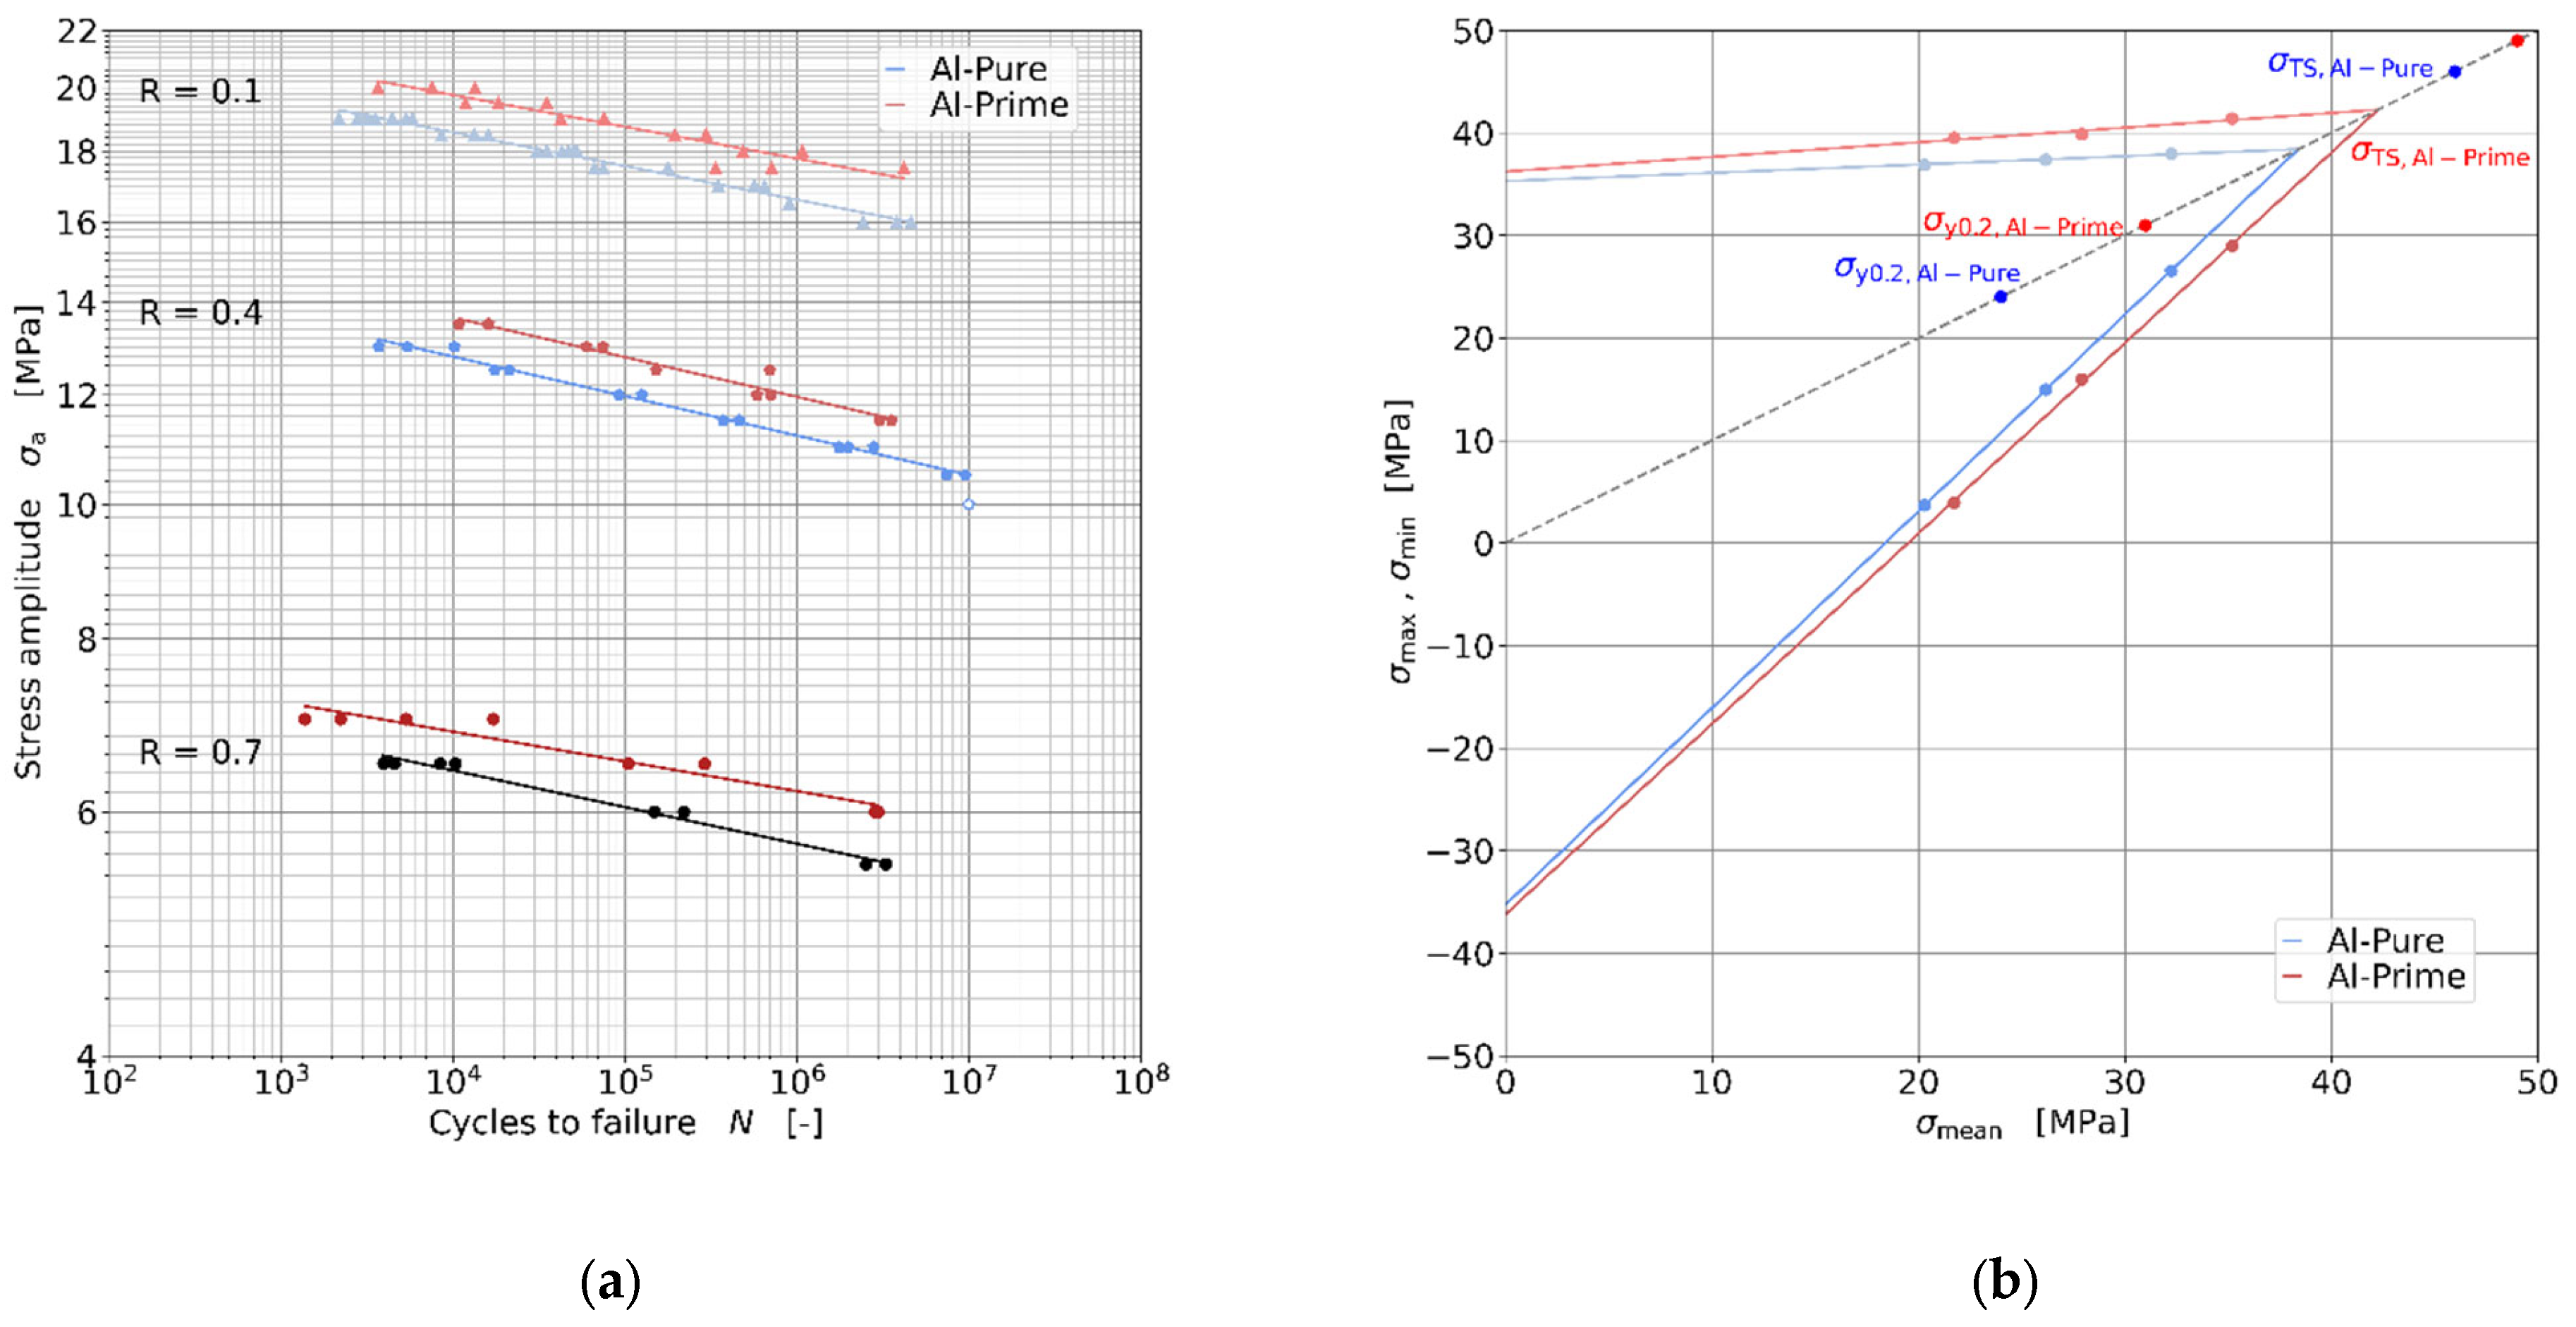
3.2.2. Comparison of Fatigue Results of Al-Pure and Al-Prime

Figure 5a compares the Wöhler diagram of Al-Pure (blue) and Al-Prime (red) for R-ratios of 0.1, 0.4 and 0.7. The Wöhler curves of both wire types show a linear correlation in the double logarithmic plot with a low scatter. The number of cycles to failure N increase with decreasing stress amplitudes σa for both wire types. The Wöhler curves of Al-Prime run almost parallel just above the curves of Al-Pure with a difference of approx. 1 MPa, whereby the curve of Al-Prime with a R-ratio of 0.7 flattens slightly stronger than the corresponding curve of Al-Pure.
If the Smith diagrams are calculated at 1,000,000 cycles for Al-Pure and Al-Prime for the three R-ratios 0.1, 0.4 and 0.7 and plotted together, the following diagram results in Figure 5b. A direct comparison of the maximum and minimum stresses shows that these are slightly higher in Al-Prime than in Al-Pure. It is also noticeable that the mean stresses σmean of Al-Prime are slightly shifted to the right and that this shift increases with increasing R-ratio. This means that the range in which the maximum and minimum stresses of Al-Prime can be varied is slightly larger than in Al-Pure. Due to the different slopes of the maximum and minimum stress lines of both wire types, they meet at different mean stresses σmean. For Al-Prime, the point intersection of the stress lines is about 42 MPa, which is slightly higher than that of Al-Pure with 38 MPa. The intersection points for Al-Pure and Al-Prime are both significantly above the initial yield stress σy0.2; they are located approximately 60% between initial yield stress σy0.2 and tensile strength σTS for Al-Prime and 64% for Al-Pure, respectively. Since all maximum stress values σmax are also significantly above the initial yield stress σy0.2, a massive plastic deformation can be expected for both wire types with slightly more plastic deformation for Al-Pure.

3.2.3. Influence of Yield Stress and Strength on the Fatigue Behavior

For estimating the influence of the initial yield stress σy0.2 and the tensile strength σTS on the fatigue behavior the Wöhler and Smith diagrams of both wire types are scaled to the values of the initial yield stress σy0.2 and the tensile strength σTS, respectively. The resulting diagrams are shown in Figure 6a,b and Figure 7a,b. A scaling to the initial yield stress σy0.2 switches the order of the results, meaning that after scaling the values of Al-Pure are above these of Al-Prime. In addition, the curves are further apart than in the unscaled plots in Figure 5a,b.
Instead, by a scaling to the tensile strength σTS the Wöhler and Smith diagrams coincide. This indicates that the fatigue limit is significantly influenced by the strength of the material and that batch-to-batch scatter of the strength, which is usually significantly larger than the scatter of the strength of material taken from one specific wire spool, should be considered for lifetime predictions.

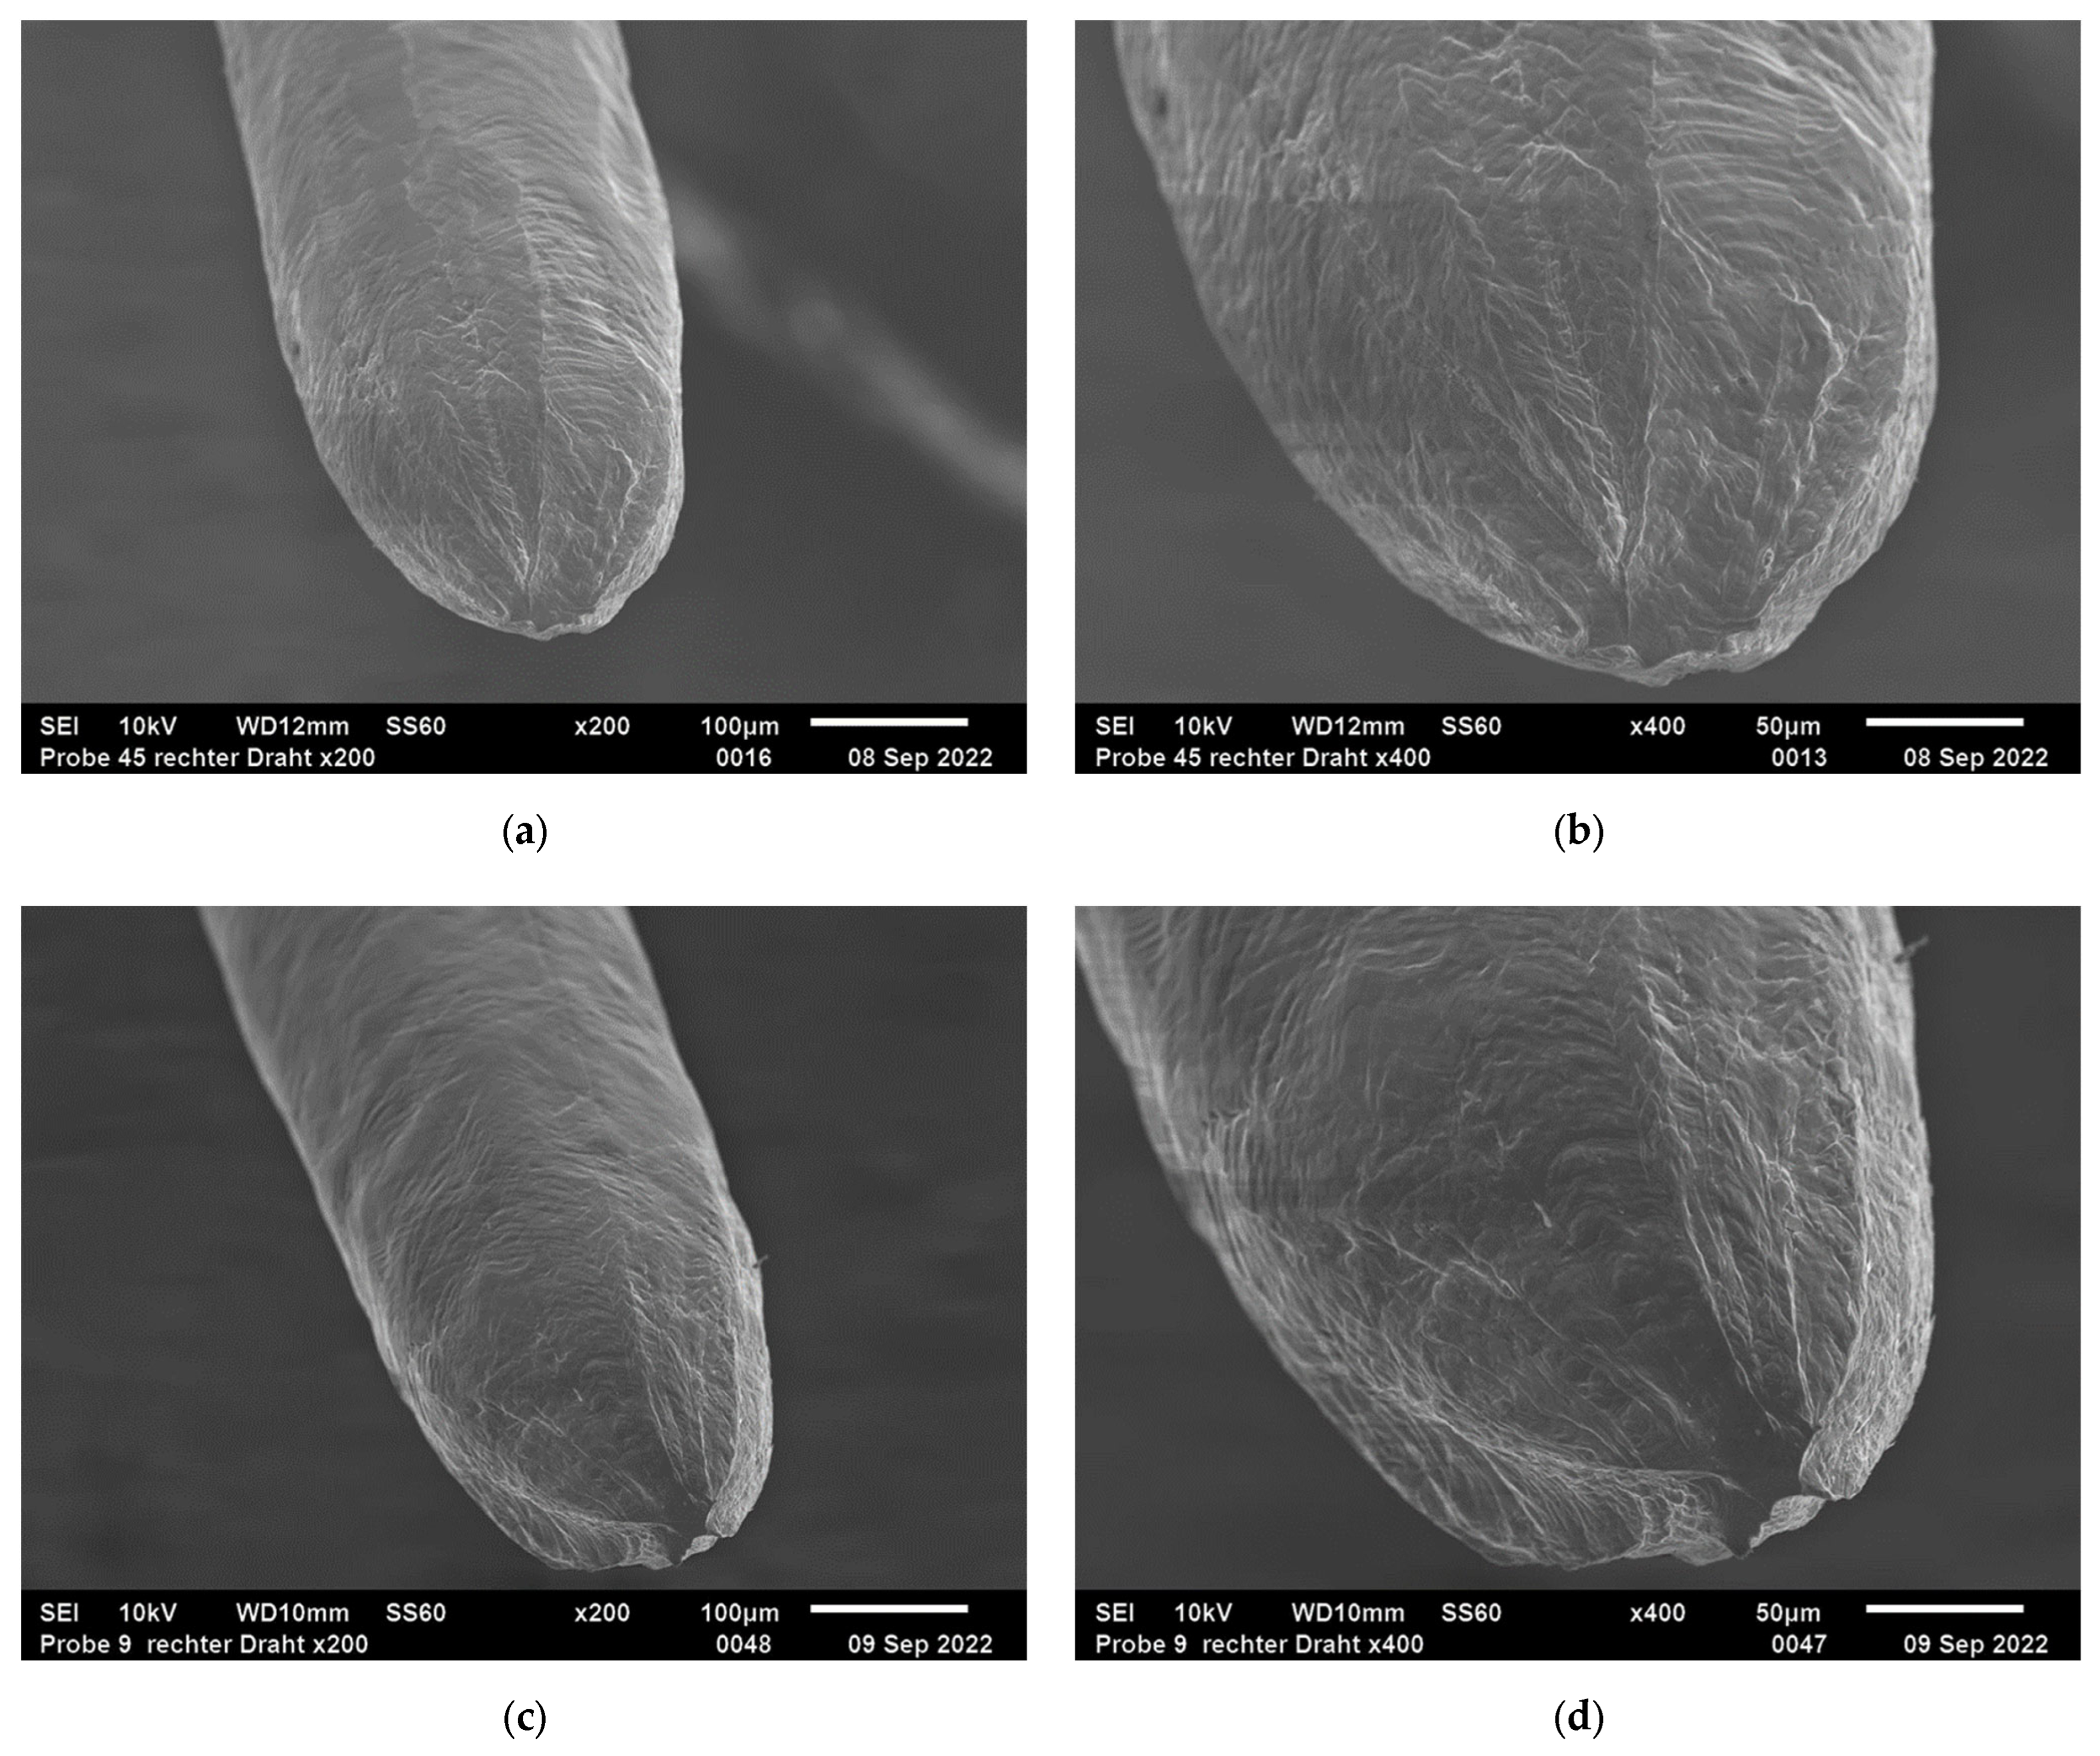
3.3. Analysis of Fracture Surfaces

Selected samples of both wire types are investigated by the scanning electron microscope (SEM) after fatigue testing regarding their fracture behavior. Figure 8 compares exemplary the images of an Al-Pure wire loaded with a stress amplitude σa of 16 MPa (Figure 8a,b) and an Al-Prime wire loaded with a stress amplitude σa of 17.5 MPa (Figure 8c,d) at magnifications of 200 and 400. Both wires were tested with a R-ratio of 0.1 and each of the wires lasted more than 1,000,000 cycles.
Both wires have a similar fracture behavior, but with little differences. In general, the wires show a conical shape with a significant necking and a residual fracture face in the middle of the wire. The wires exhibit a slightly wavy surface structure over their longitudinal surface, which stands out more strongly towards their fracture surface. This kind of fracture topology is similar to fracture topologies found after tensile loading.
It can be seen from the SEM images that Al-Pure has a slightly longer necking, see Figure 8a, and a smaller residual fracture surface, see Figure 8b, compared to Al-Prime, see Figure 8c,d, which indicates a slightly higher ductility of the Al-Pure wire. From the fractographic analyses, no classical crack initiation can be found due to the unusually high amount of plastic deformation. For comparison, the applied maximum stress in the fatigue test corresponds to a plastic strain in a tensile test of approximately 4.8% for Al-Pure and 3.3% for Al-Prime, respectively; see Figure 3. Consequently, the plastic deformation results in a pronounced necking, which dominates the fracture behavior of aluminum bonding wires.
Further fractography analyses were performed on wires loaded with a stress ratio of R = 0.7 and on wires loaded with higher stress amplitudes. Here, the investigated fracture surfaces indicated no significant influence of the R-ratio and the number of cycles to failure on the fracture type.

4. Discussion

In the presented work, a reliable methodology for an efficient characterization of the fatigue behavior of aluminum bonding wires with a diameter of 300 µm was developed. The experiments show that it is possible to perform fatigue experiments with high accuracy, meaning stable maximum and minimum stress levels within the whole experiment, with a frequency high enough for characterizing the fatigue behavior up to 10,000,000 cycles in an acceptable amount of time.
The fatigue experiments of the two wire types are very reproducible and consistent for different stress ratios, which is demonstrated by the analysis of the fatigue behavior for 1,000,000 cycles in terms of Smith diagrams. Here, a linear correlation of the maximum stress σmax, minimum stress σmin and consequently the stress amplitude σa is found. From this it is concluded that it should be possible to develop an efficient lifetime model based on Wöhler or Smith diagrams even though the loading is significantly above the initial yield stress σy0.2 of the material and wire failure goes along with large plastic deformation.
Furthermore, it is shown that the fatigue results for both wire materials coincide when a scaling to the tensile strength σTS is applied. This can be a hint that it should also be possible to develop a more generalized fatigue model for different wire materials or at least a fatigue model considering batch-to-batch scatter for one wire material type. Further investigations for developing such a generalized lifetime model and meaningful validation experiments are planned.

Author Contributions

Conceptualization, C.M. and C.D.; methodology, C.M. and C.D.; software, C.M. and C.D.; validation, C.M. and C.D.; formal analysis, C.M.; investigation, C.M.; resources, C.M. and C.D.; data curation, C.M. and C.D.; writing—original draft preparation, C.M.; writing—review and editing, C.M. and C.D.; visualization, C.M. and C.D.; supervision, C.D.; project administration, C.D.; funding acquisition, C.D. All authors have read and agreed to the published version of the manuscript.

Funding

This research was partially funded by the German Federal Ministry of Education and Research in the project WireLife in the program FH-Kooperativ under the funding code 13FH544KX0 and by the Graduate Institute of the University of Applied Science Bonn-Rhein-Sieg and the Institute of Technology, Resource and Energy-efficient Engineering.

Institutional Review Board Statement

Not applicable.

Informed Consent Statement

Not applicable.

Data Availability Statement

The data presented in this study are available on request from the corresponding authors.

Acknowledgments

We would like to thank Heraeus Deutschland GmbH Co. KG for providing the wire materials. We also thank Tatjana Radowitz for the help and support in conducting the SEM analyses.

Conflicts of Interest

The authors declare no conflict of interest. The funders had no role in the design of the study; in the collection, analyses, or interpretation of data; in the writing of the manuscript, or in the decision to publish the results.

References

  1. Levine, L. Wire Bonding. EDFAAO 2016, 18, 22–28. [Google Scholar] [CrossRef]
  2. Altenbach, H.; Dresbach, C.; Petzold, M. Characterizing the Anisotropic Hardening Behavior of Aluminum Bonding Wires. In Materials with Complex Behaviour II.; Öchsner, A., Da Silva, L.F.M., Altenbach, H., Eds.; Springer: Berlin/Heidelberg, Germany, 2012; pp. 583–598. [Google Scholar]
  3. Klengel, R.; Naumann, F.; Tismer, S.; Klengel, S. Investigation of Material Dynamic Processes During Shear Test of Aluminum Heavy Wire Bond Contacts. In Proceedings of the 2018 IEEE 68th Electronic Components and Technology Conference (ECTC), San Diego, CA, USA, 29 May–1 June 2018; pp. 2019–2025. [Google Scholar]
  4. Merkle, L.; Kaden, T.; Sonner, M.; Gademann, A.; Turki, J.; Dresbach, C.; Petzold, M. Mechanical fatigue properties of heavy aluminium wire bonds for power applications. In Proceedings of the 2nd Electronics Systemintegration Technology Conference (ESTC), Greenwich, Great Britain, 1–4 September 2008; pp. 1363–1368. [Google Scholar]
  5. Dresbach, C. Ermittlung lokaler mechanischer Kennwerte mikroelektronischer Drahtkontaktierungen. Ph.D. Thesis, Martin-Luther-Universität Halle-Wittenberg, Halle (Saale), Germany, 2010. [Google Scholar]
  6. Van der Wel, P.J.; Otte, R.; Roberts, H.; de Bruijn, F.; van Zuijlen, A.; Merkus, B. Electromigration behavior in aluminum wires for power base-station applications. In Proceedings of the 2017 IEEE International Reliability Physics Symposium (IRPS), Monterey, CA, USA, 2–6 April 2017. [Google Scholar]
  7. Naumann, F.; Schischka, J.; Koetter, S.; Milke, E.; Petzold, M. Reliability characterization of heavy wire bonding materials. In Proceedings of the 2012 4th Electronic System-Integration Technology Conference (ESTC), Amsterdam, The Netherlands, 17–20 September 2012; pp. 1–5. [Google Scholar]
  8. Lefranc, G.; Weiss, B.; Klos, C.; Dick, J.; Khatibi, G.; Berg, H. Aluminum bond-wire properties after 1 billion mechanical cycles. Microelectron. Reliab. 2003, 43, 1833–1838. [Google Scholar] [CrossRef]
  9. Merkle, L.; Sonner, M.; Petzold, M. Lifetime prediction of thick aluminium wire bonds for mechanical cyclic loads. Microelectron. Reliab. 2014, 54, 417–424. [Google Scholar] [CrossRef]
  10. Khatibi, G.; Lederer, M.; Czerny, B.; Kotas, A.B.; Weiss, B. A New Approach for Evaluation of Fatigue Life of Al Wire Bonds in Power Electronics. In Light Metals 2014; Grandfield, J., Ed.; John Wiley & Sons, Inc.: Hoboken, NJ, USA, 2014; pp. 271–277. [Google Scholar]
  11. Czerny, B.; Khatibi, G. Accelerated mechanical fatigue interconnect testing method for electrical wire bonds. tm-Tech. Mess. 2018, 85, 213–220. [Google Scholar] [CrossRef]
  12. Czerny, B.; Khatibi, G. Cyclic robustness of heavy wire bonds: Al, AlMg, Cu and CucorAl. Microelectron. Reliab. 2018, 88–90, 745–751. [Google Scholar] [CrossRef]
  13. Broll, M.S.; Geissler, U.; Höfer, J.; Schmitz, S.; Wittler, O.; Lang, K.D. Microstructural evolution of ultrasonic-bonded aluminum wires. Microelectron. Reliab. 2015, 55, 961–968. [Google Scholar] [CrossRef]
  14. DIN 50100:2016-12; Schwingfestigkeitsversuch—Durchführung und Auswertung von zyklischen Versuchen mit konstanter Lastamplitude für metallische Werkstoffproben und Bauteile. Beuth Verlag: Berlin, Germany, 2016.
Figure 1. Measurement setup with a fixed wire in the clamping jaws in the furnace of the LTM 1 HR from Zwick Roell (a); detailed picture of a fixed wire in the clamping jaws (b).
Metals 13 00009 g001
Figure 2. History of maximum stress values (a) and minimum stress values (b) up to fracture in the ±3% range (red lines) for Al-Pure Sample 71, R = 0.3, σa = 13.5 MPa, σmax = 38.57 MPa, σmin = 11.6 MPa, N = 485,139.
Metals 13 00009 g002
Figure 3. Comparison of the average nominal stress-strain curves of Al-Pure (blue) and Al-Prime (red).
Metals 13 00009 g003
Figure 4. Wöhler diagram of Al-Pure at 40 Hz with R-ratios between 0.1 and 0.7 (a), Smith diagram of Al-Pure at 1,000,000 cycles with R-ratios between 0.1 and 0.7 (b).
Metals 13 00009 g004
Figure 5. Wöhler diagram of Al-Pure and Al-Prime at R-ratios of 0.1, 0.4 and 0.7 (a), Smith diagram of Al-Pure and Al-Prime at 1,000,000 cycles with R-ratios of 0.1, 0.4 and 0.7 (b).
Metals 13 00009 g005
Figure 6. Wöhler diagram scaled to the initial yield stress σy0.2 of each wire material (a), Smith diagram scaled to initial yield stress σy0.2 of each wire material (b).
Metals 13 00009 g006
Figure 7. Wöhler diagram scaled to the tensile strength σTS of each wire material (a), Smith diagram scaled to tensile strength σTS of each wire material (b).
Metals 13 00009 g007
Figure 8. SEM images of Al-Pure at R = 0.1, σa = 16 MPa, σmax = 35.6 MPa, N = 2,438,255 at magnifications of 200 (a) and 400 (b) and Al-Prime at R = 0.1, σa = 17.5 MPa, σmax = 38.9 MPa, N = 4,201,059 at magnifications of 200 (c) and 400 (d) after fatigue testing.
Metals 13 00009 g008
Disclaimer/Publisher’s Note: The statements, opinions and data contained in all publications are solely those of the individual author(s) and contributor(s) and not of MDPI and/or the editor(s). MDPI and/or the editor(s) disclaim responsibility for any injury to people or property resulting from any ideas, methods, instructions or products referred to in the content.

