Article

Shearographic Detection of Internal Defects in Austenitic Stainless Steels

Department for Cutting and Joining Manufacturing Processes, University of Kassel, 34125 Kassel, Germany
*
Author to whom correspondence should be addressed.
Metals 2023, 13(1), 74; https://doi.org/10.3390/met13010074
Submission received: 19 November 2022 / Revised: 21 December 2022 / Accepted: 21 December 2022 / Published: 28 December 2022

Abstract

:
Despite the formation of a passive layer, corrosion also occurs in austenitic stainless steels. One of the most common and most dangerous types is pitting corrosion, in which the material beneath the surface is completely dissolved. Since this type of corrosion only produces small holes on the surface, it is difficult to detect without nondestructive testing. This paper presents induction-excited shearography as an optical, nondestructive testing method for quick inspection of inner defects and corrosion. The investigations were carried out on test specimens with blind holes made of austenitic stainless steel 1.4301 (AISI 304). The detection limits of different defect sizes were determined objectively based on the signal-to-noise ratio (SNR). The results show that inner defects with a size of Ø 2 mm can be detected via SNR in a depth of up to 1.5 mm. Larger defects can be detected in greater depth. The data obtained were validated on real test specimens. The measurement of a more realistic defect geometry showed higher SNR values compared to the idealized test specimens. From the measured SNR values of realistic defect geometry, it can be concluded that real irregularities have higher SNR values than defects with flat bottoms. The results show that induction-excited shearography is suitable for the nondestructive testing of austenitic stainless steels.

1. Introduction

Stainless steels can be negatively affected by corrosion, but also by defects and irregularities associated with the manufacturing or joining process. These irregularities reduce the corrosion resistance, and the maximum bearable load must be detected as early as possible in order to initiate suitable countermeasures. Depending on the consequences of a material failure, nondestructive testing (NDT) is used before, during and after the manufacturing processes and over the entire life cycle of the material, including recycling or disposal, for this purpose [1].
Austenitic stainless steels are the most commonly used subclass of stainless steels. They are nonmagnetic, easy to process, very suitable for welding and have a high deformation capacity. They can be used in a wide temperature range from low temperatures up to temperatures of 650 °C (with the necessary creep resistance). Due to their good specified low-temperature properties, austenitic stainless steels are used especially at low temperatures down to −200 °C and lower [2,3].
In addition to the generally known limitations of the individual NDT processes (e.g., duration of measurement, accessibility), further challenges arise for the testing of this material class. Since austenitic steels are paramagnetic, and magnetic particle testing can only be used for ferromagnetic materials, this testing method is not feasible [1]. Eddy current testing is suitable for this class of materials, but the test only detects superficial or near-surface defects [4]. Due to the coarse, anisotropic grains of the heterogeneous austenitic structure, ultrasound propagation in the material is orientation-dependent, so an ultrasound examination can only be carried out for larger material thicknesses under special conditions for the detection of irregularities [5,6,7]. Thus, only radiographic testing, also taking into account safety precautions, remains as a classical NDT method for this material class to detect internal defects [8].
Shearography is another optical and noncontact process for NDT. It has been used successfully for years to test composite materials [9,10,11]. Due to the short measuring time, lower system costs and high system flexibility, shearography is suitable for testing metallic materials [12]. The state of the art already shows that shearography can in principle be used for the testing of metallic materials. However, these publications only show individual application examples without detailed investigations of the defect detection that can be achieved [13,14]. Detached systematic studies on the nondestructive testing of metals using shearography were carried out for aluminum, either with optical [15,16], dynamic [16,17] or mechanical excitation [16]. For the large material class of steels, particularly stainless steels, there is only one detailed study by Pickering et al. using dynamic excitation, which requires knowledge of the defect-specific excitation frequency. The specifically high thermal expansion of stainless steels is not taken into account with this type of excitation [18].
A large number of studies demonstrate the high potential of shearography. At the same time, however, the classically used types of excitation (optical, dynamic or mechanical excitation) that can be used are identified as a limiting factor. Further development is expected here, especially for thick samples made of high-strength steel (e.g., [19,20]). Due to the comparatively high thermal expansion of stainless steels in contrast to other types of steel, rapid thermal excitation is an advantage for this class of material. Here, the induction excitation already known from thermography can be used. Single studies already show the usability of induction excitation for shearography testing (e.g., testing of composite and CFRP [21], adhesive bonds [22] or epoxy coatings [23]) on samples with blind holes with flat bottoms. However, the proof of the detectability of industrially relevant defect sizes (approx. 1 to 2 mm) is still pending. A systematic study of the detection limits of induction-excited shearography for testing stainless steels is not yet available. In the following article, the noncontact, high-performance inductive excitation is presented for shearographic testing of stainless steels. Detailed detection limits based on the signal-to-noise ratio (SNR) are presented depending on defect size, depth and geometry. The measurement data obtained are validated and evaluated using real test specimens. It is shown that induction-excited shearography is able to detect internal defects of relevant defect sizes (approx. 1 to 2 mm) and can therefore be a potent nondestructive testing technique for stainless steels.

2. Materials and Methods

2.1. Shearography as a Nondestructive Testing Method

Shearography is an optical measuring method that can not only be used for NDT but also for strain measurement and vibration analysis. The noncontact measuring principle with very short measuring times is suitable for automated testing. Due to the characteristic structure of a shearography system, the gradient of the deformation of the object surface can be measured and deviations can be visualized [12,19].
A shearography system consists of a coherent light source, e.g., laser diodes, and a shearography sensor with detector, imaging system and shear element. Coherent light is reflected diffusely at the surface of the object to be inspected. The surface must be optically rough. The reflection of the light waves is split by a shear element and directed onto the detector by the imaging system. In each detector element, the reflected waves interfere. A unique speckle pattern of light and dark points appears on the detector. The speckle pattern is characteristic for the surface of the test object and depends on the position of the object in relation to the shearography sensor. By evaluating several speckle images of the test object in two states (e.g., initial state and deformed state), local changes in the deformation gradient are recorded. Defects and inhomogeneities in the test object lead to a local surface deformation in comparison to defect-free areas, and can thus be detected [12,24].
For shearographic testing, the test object must be slightly deformed. A superficially detectable deformation of less than one millimeter, which is barely perceptible to the human eye and does not permanently impair the test object, is sufficient for most applications. One way of forcing deformations is to exploit thermal expansions caused by thermal excitation of the test object. Optical heat sources such as flash, halogen or infrared lamps are usually used for this purpose. Alternatively, local or global pressure loadings (in the form of vacuum or overpressure) as a type of excitation can be used to force local deformation changes. The third type of excitation is dynamic excitation, which causes component vibration due to structure-borne sound (e.g., from piezo actuators) or airborne sound (e.g., from loudspeakers) [12,19,24].

2.2. Idealized Test Specimens

Pitting corrosion is one of the most critical types of corrosion in stainless steels, and with a proportion of 30%, also the most common type. Pitting corrosion dissolves material from the inside. As this corrosion phenomenon only produces small holes on the surface, it often remains undetected for a long time [2,3]. To simulate internal irregularities in the material with a morphology similar to pitting corrosion, test specimens with blind holes were used.
The test specimens used were all made from a 3 mm thick sheet of austenitic stainless steel X5CrNi18-10 (1.4301/AISI 304). The dimensions of the individual test specimens were 400 mm × 240 mm. In three specimens, blind holes with flat bottoms (HFB) with 2 different diameters (Ø 32 mm and Ø 1 mm; Ø 16 mm and Ø 2 mm; Ø 8 mm and Ø 4 mm) were drilled at depths between 0.25 mm and 2.75 mm in 0.25 mm increments (see Figure 1).
As ASTM G46 describes, most pitting corrosion tends to have an uneven formation [4]. For this reason, a further test piece with blind holes with conical bottoms (HCB) in diameters of 8 mm, 4 mm, 2 mm and 1 mm was produced using drills with a 140° point angle. A comparison of the bore geometries of HFB and HCB is shown in Figure 2. Based on the drill geometries, drilling depths of between 0.5 mm and 2.75 mm were obtained, depending on the drill diameter. Based on this test piece, an attempt should be made to simulate more real corrosion phenomena than through blind holes with flat bottoms.

2.3. Real Test Specimens

Suitable test specimens with natural, corrosion-induced irregularities are required to transfer the data from the idealized tested specimens with blind holes to real applications. For this purpose, new test specimens are made from the same sheet of steel as the idealized test specimens, which are described in Section 2.2. The size of the blanks of the real test specimens is 100 mm × 130 mm. In these blanks, pitting corrosion is generated as a real, critical and difficult-to-detect internal defect.
The targeted generation of pitting corrosion was carried out by modifying the method A described in ASTM G48 (see [25]). First, the surface in the center of the blank was removed in a targeted manner using a surface cleaning laser (focal diameter = 100 µm). Immediately afterwards, an iron chloride solution (6% FeCl3) was applied to the surface. A temporary plastic barrier ensured a sufficient amount of solution and prevented it from flowing out. The blanks with ferric chloride solution were then placed in a preheated oven and aged at 50 °C for 4 weeks. The iron chloride solution was exchanged for a fresh solution each week during this period.
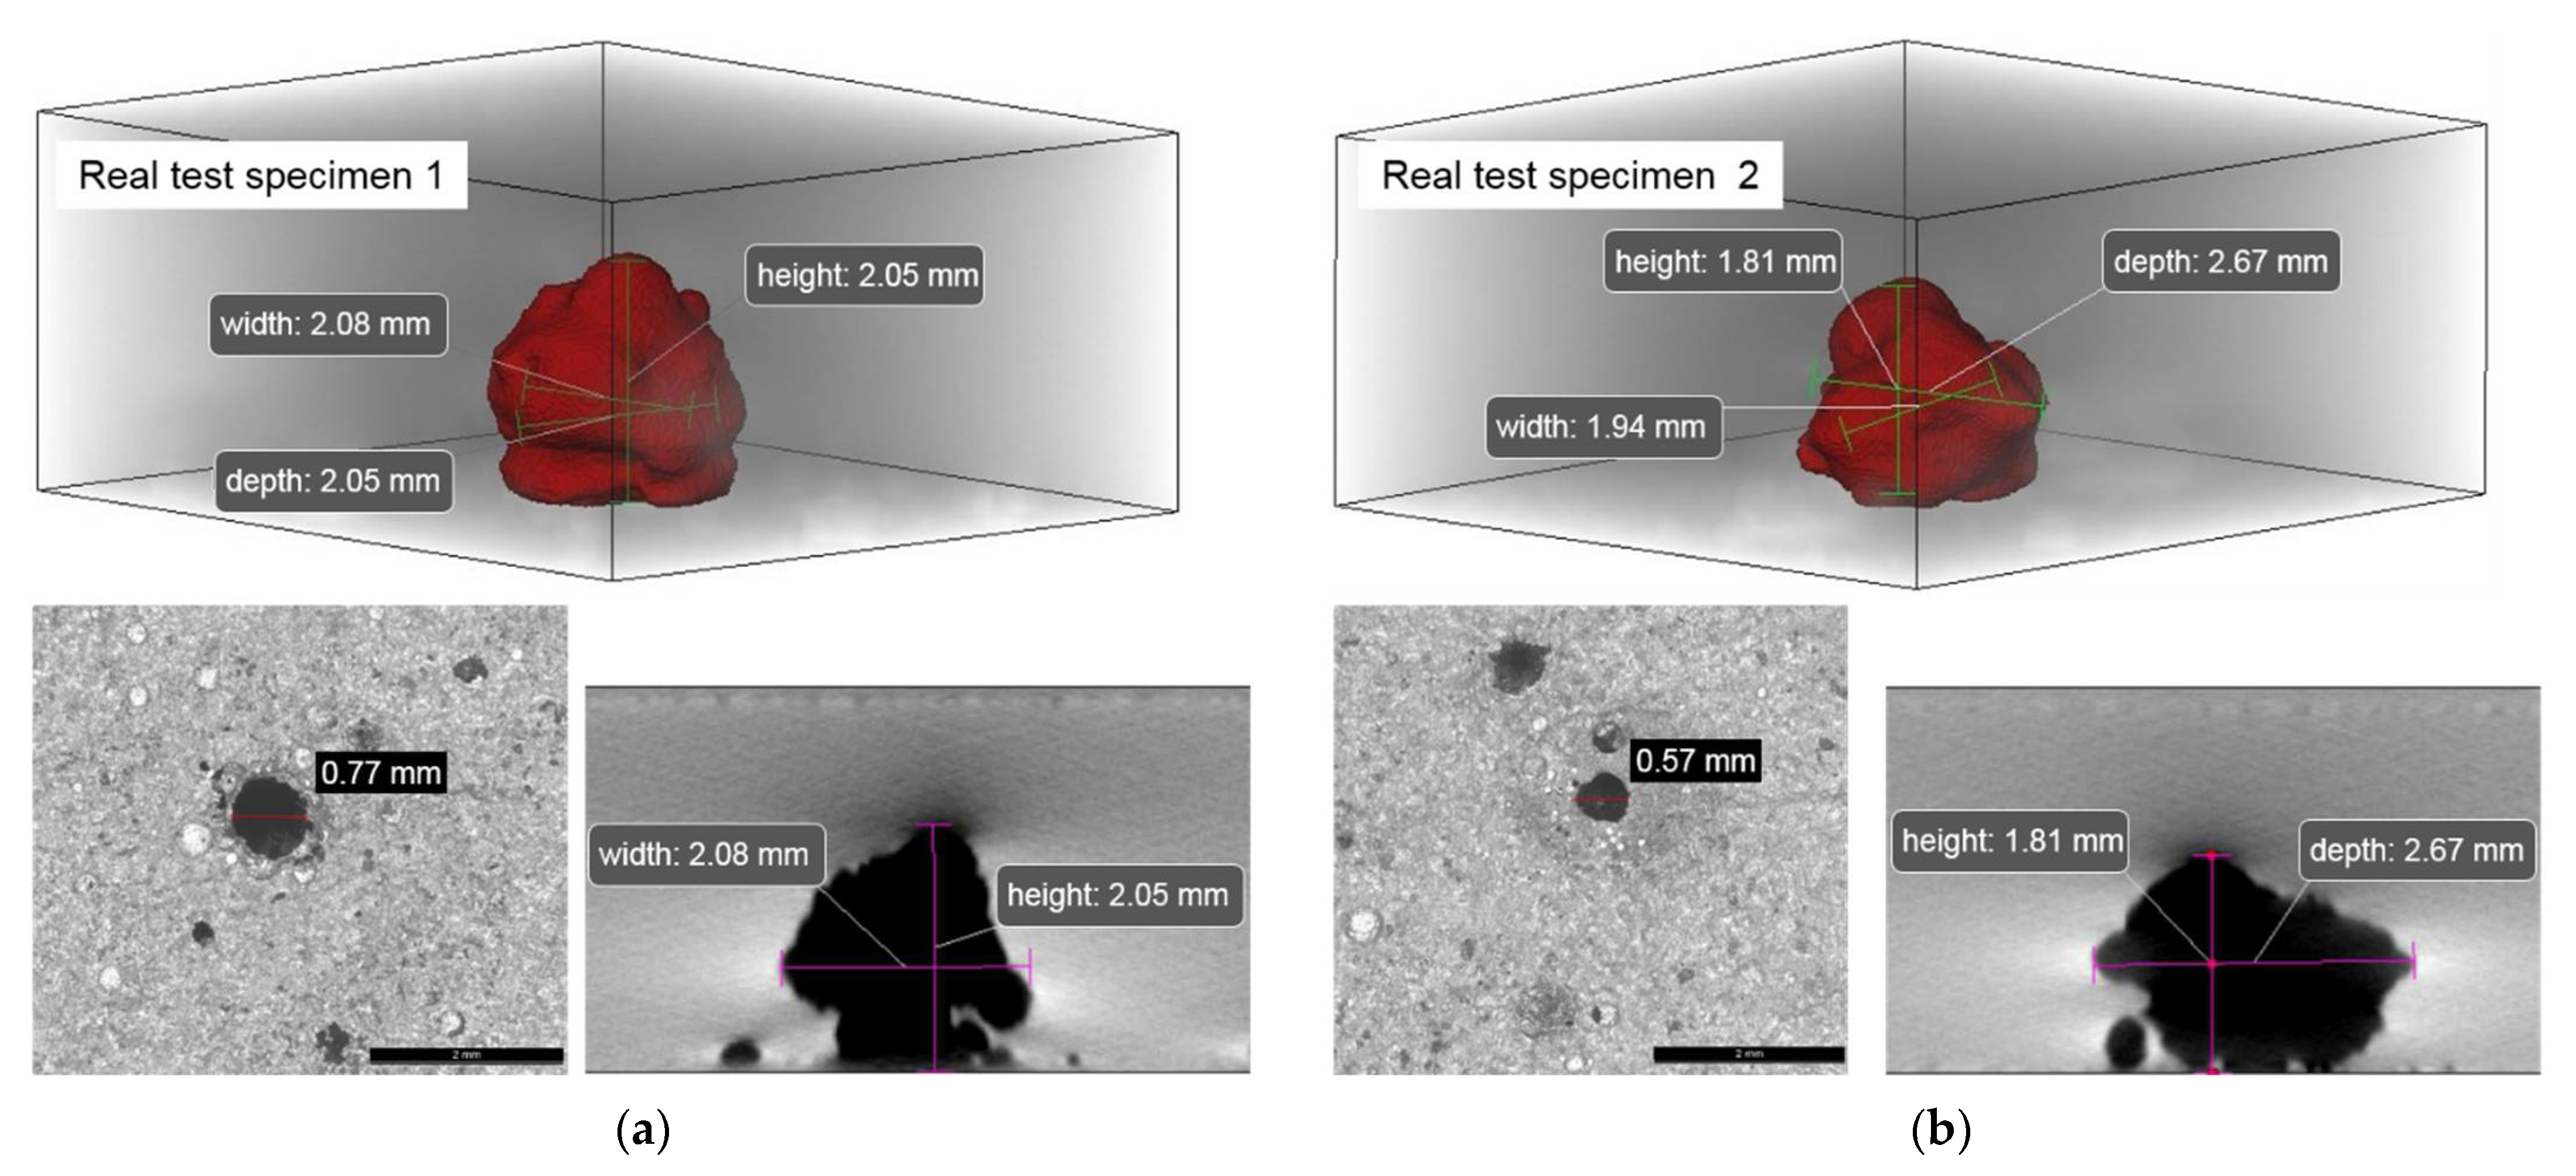
Both test specimens, hereinafter referred to as real test specimens 1 and 2, were then examined. The size of the surface opening was measured using a microscope, and the volume of pitting corrosion was measured using computed tomography (CT, pixel size is approx. 25 µm with a captured image section of 6.8 mm × 6.8 mm). The results are shown in Figure 3.
The results of real test specimen 1 (see Figure 3a) show an almost rotationally symmetrical pitting corrosion. Its greatest extent can be measured at a depth of approx. 0.8 mm. The corrosion here is about 2.05 mm wide and 2.08 mm deep. From this widest point, the corrosion narrows in an approximately conical manner. The height of the corrosion up to the point is approx. 2.05 mm; the resulting remaining wall thickness (RWT, corresponds to the wall thickness above the defect) is 0.95 mm. An opening with a diameter ≈ 0.8 mm can be measured on the corroded surface.
The surface of real test specimen 2 is shown in Figure 3b on the bottom left. The opening of the corrosion is approx. 0.57 mm. The CT data (see Figure 3b, bottom right) show that several small attack points on the surface grow together in depth to form this pitting corrosion around the set attack point. Figure 3b above shows the CT reconstruction of the volume of the corrosion with the maximum dimensions. As can be seen, this pitting corrosion is not symmetrical. The maximum measured width is approx. 1.93 mm; the greatest measured depth is about 2.68 mm. The height of corrosion is 1.81 mm, so the RWT at this point is 1.19 mm. The corrosion first becomes broader as the distance to the surface increases. At a depth of approx. 1.2 mm, the pitting corrosion reaches the maximum dimensions described and then tapers off. The maximum height of corrosion is not centered above the point of attack, but is offset by approx. 0.4 mm in the direction of the greatest extent.
Minor pitting corrosion on the surface of both test specimens was also measured using CT. These have a diameter of less than 0.5 mm and are approx. 0.2 mm to 0.4 mm deep, and therefore do not affect the measurements.

2.4. Test Setup and Measurement Parameters

A SE2 shearography sensor from isi-sys GmbH was used for the investigations. The detector has a 5-megapixel CCD chip. The coherent illumination was generated by 10 laser diodes (100 mW each) with a wavelength of 658 nm.
Induction excitation was chosen to deform the test specimen. With this excitation, the test objects could be heated from the inside in less than one second, which forced thermal deformation. For this reason, inductive heating is included in thermal excitation.
A flat induction coil with an effective area of approx. 150 mm × 150 mm was selected as the inductor. This coil is particularly characterized by its large effective area and the uniform heating. The used medium frequency induction generator has a maximum output of 10 kW.
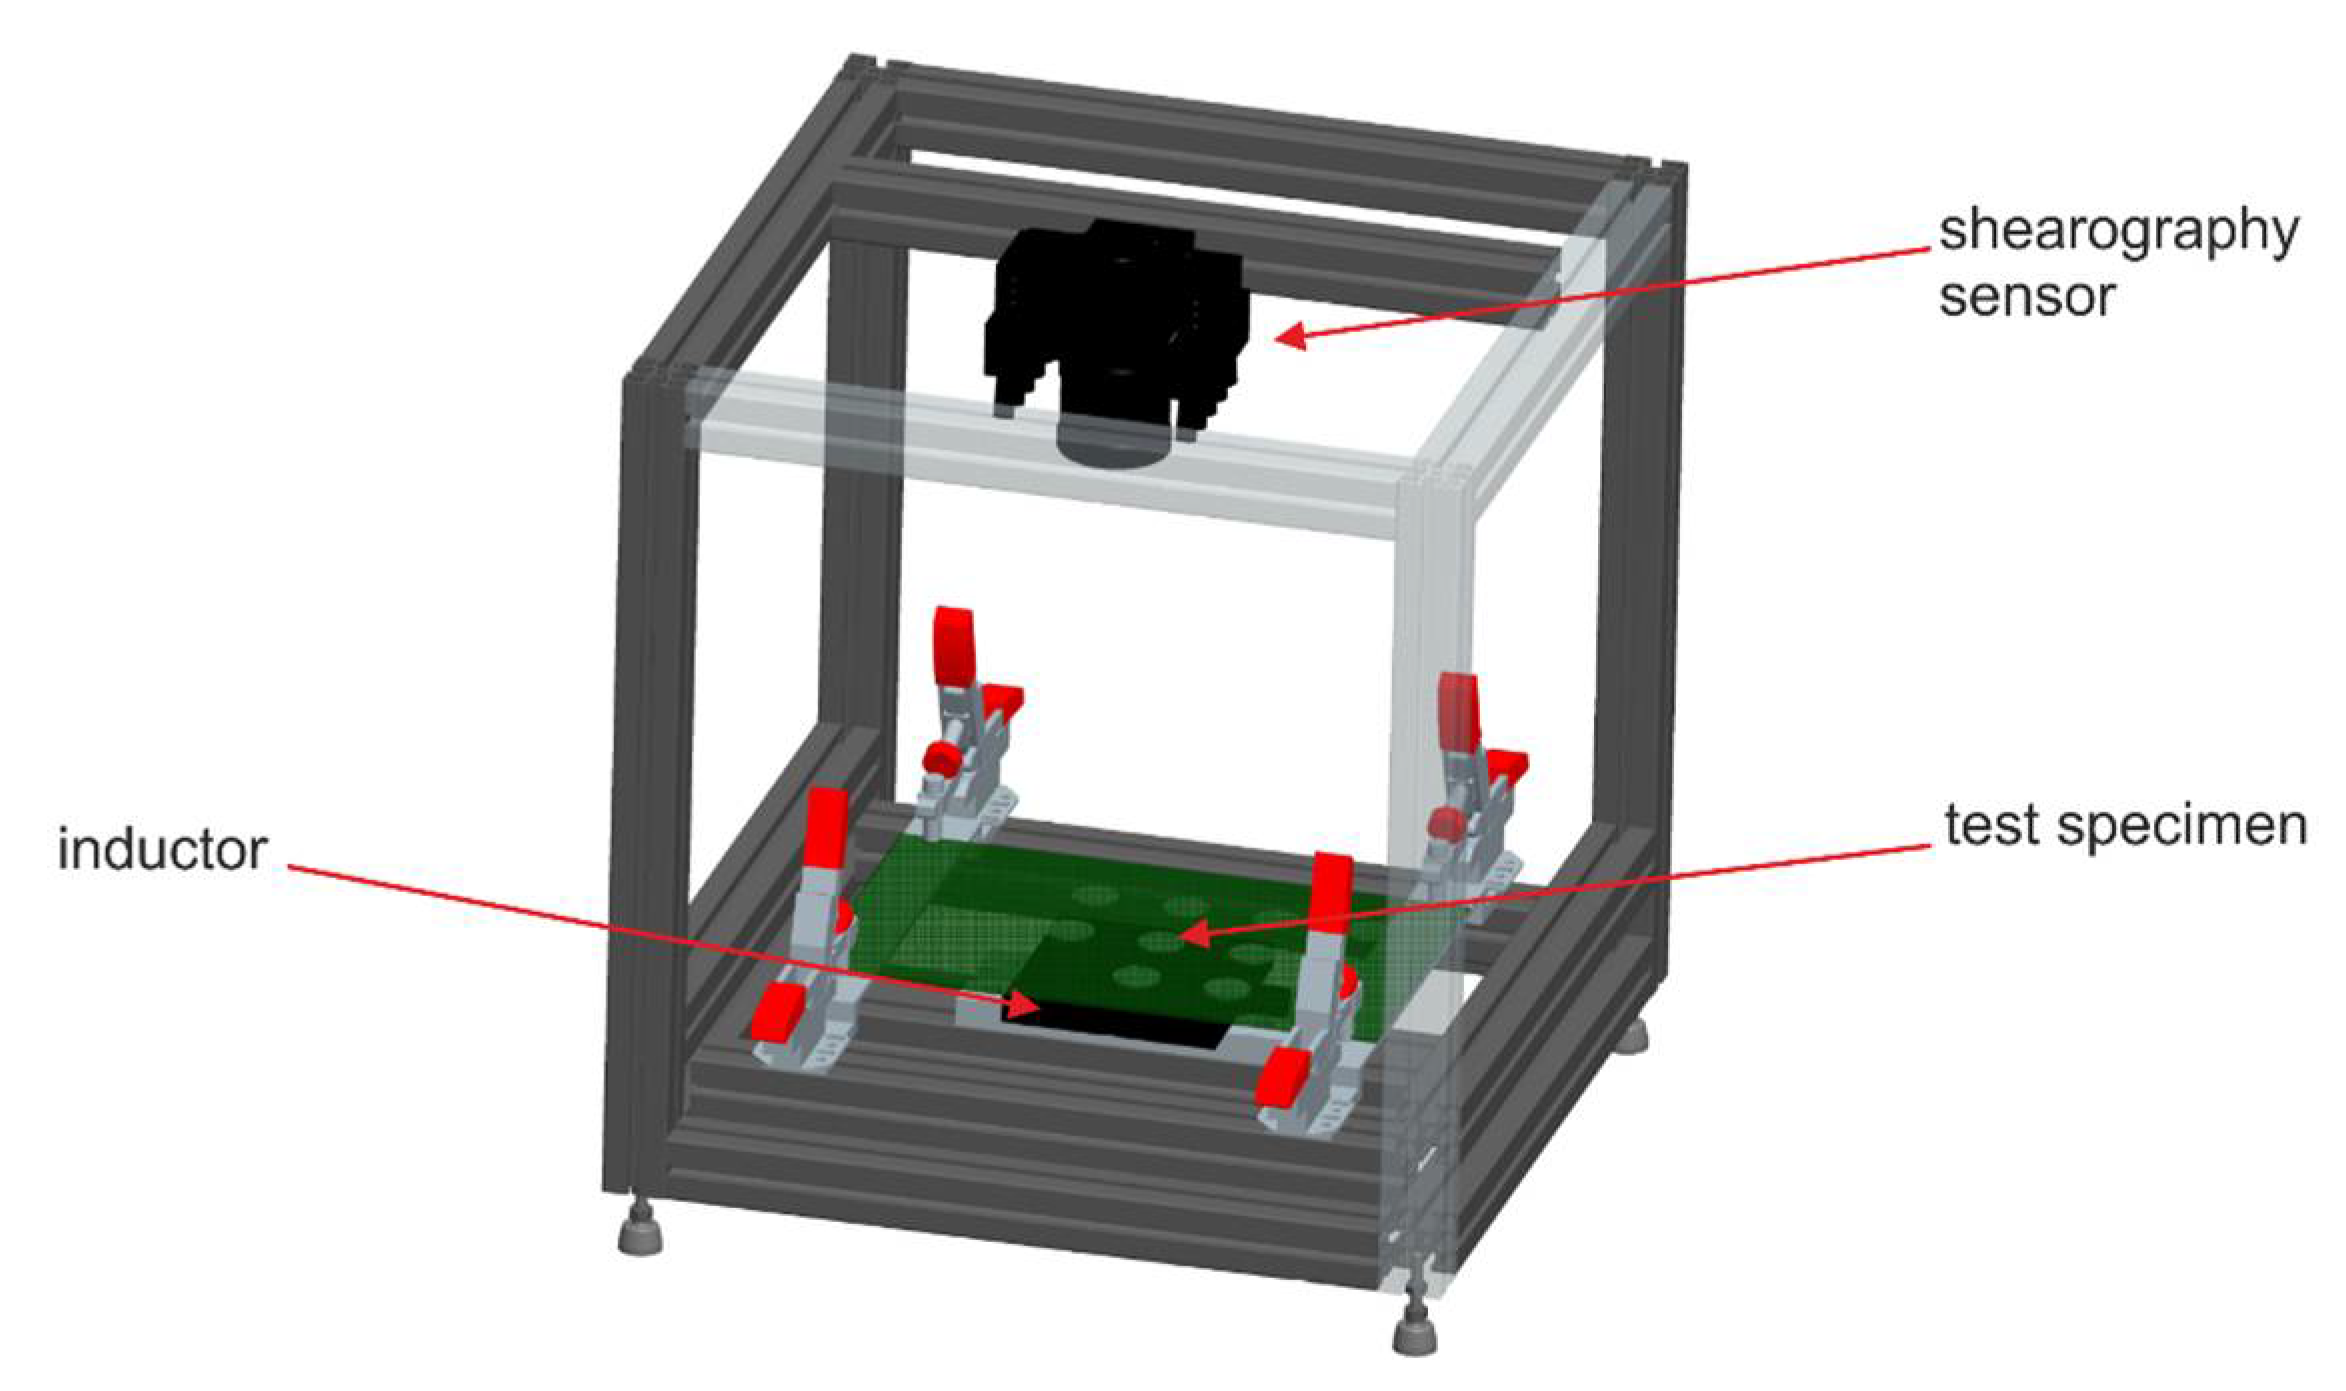
The resulting test setup is shown in Figure 4. The shearography sensor is fixed orthogonal to the test object. The test specimen is positioned in a way that the holes are on the side facing away from the sensor. The induction coil was placed in a transmission arrangement, very closely below the specimen. To prevent the specimens from moving during the measurements, they were held with four clamps.
One suitable set of measuring parameters was determined for the different defect sizes. Due to the higher penetration depth, the smallest usable frequency of 12.5 kHz was used as the induction frequency in this system configuration [26]. The induction time was 1 s; the pulse width modulation (PWM; proportion of the pulse duration in relation to the set period duration) was 300‰. Due to the round defect geometry, the shear angle had no influence on the measurements and was set to pure shear in x-direction (horizontal orientation from the camera perspective). Based on previous measurement results, the shear amount for the measurements was set to 2 mm.
In order to increase the diffuse reflection on the surfaces of the stainless steel, all test specimens were coated with white paint prior to measurement.

2.5. Objective Evaluation of the Measurement Data

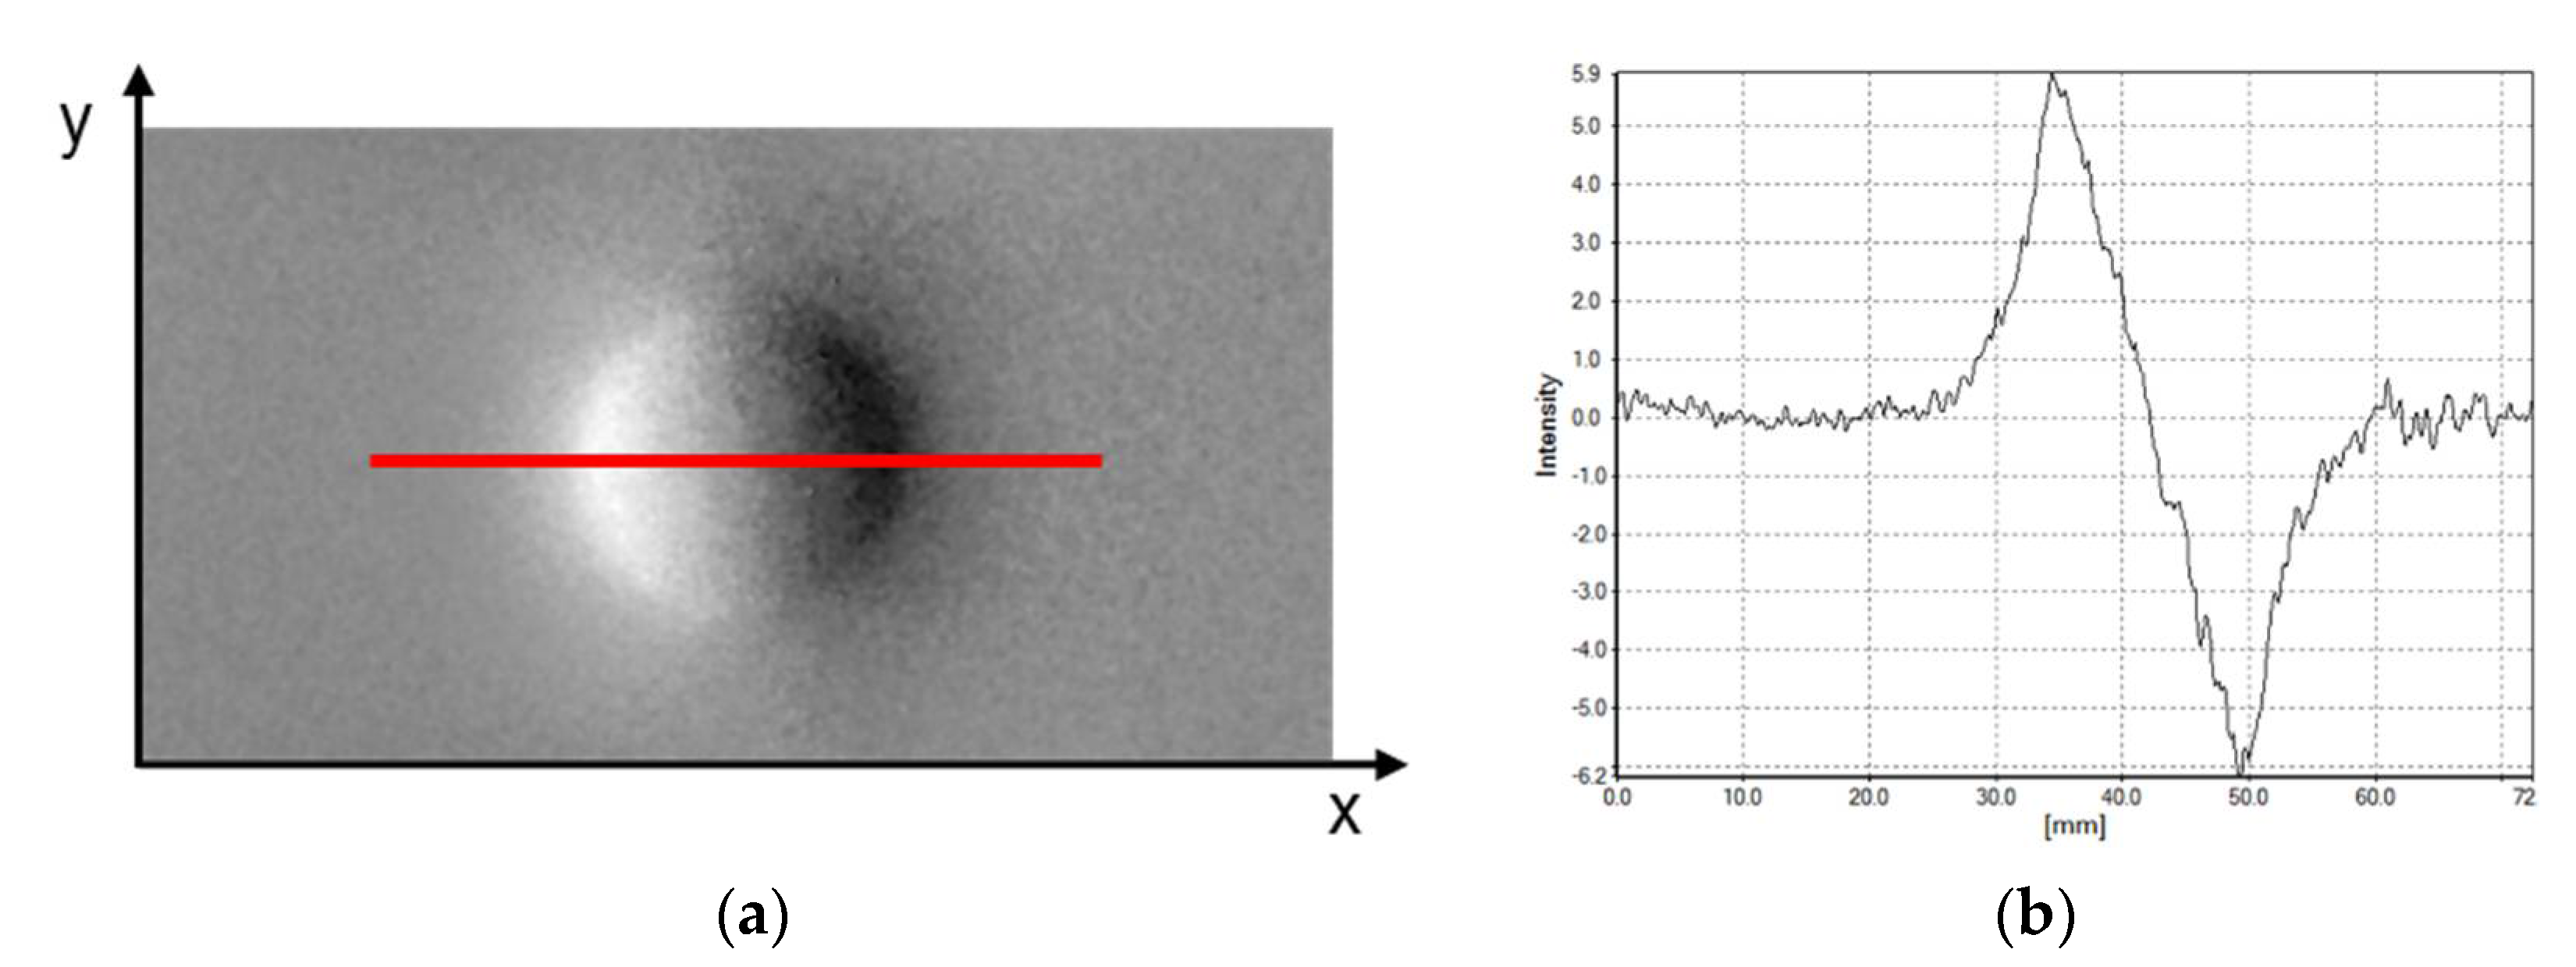
All test specimens were measured with the specified parameters. Low-pass filters and demodulation were used for evaluation [12]. An exemplary shearogram of a defect with a diameter of 16 mm and a RWT of 0.75 mm (HFB test specimen) is shown in Figure 5a. The course of the intensity values of the shearogram through the defect center along the red line is shown in Figure 5b.
In order to enable an objective assessment of the measurement data, the snr (SNR) was introduced and determined for each investigated defect. This is defined by the ratio of the signal amplitude A to the standard deviation σ of the noise in the same shearogram, given by
SNR = A σ .
According to Menner [27], the signal amplitude A for shearography (due to the sinusoidal signal shape, see Figure 5b) is defined as half the difference between the maximum intensity value Imax and the minimum intensity value Imin:
A = I max I min 2 .
The standard deviations σ were each determined from the same measurements as the signal amplitude, but at defect-free areas of the specimen. According to the state of the art in metrology, a signal amplitude that is four times larger than the noise (signal-to-noise ratio ≥ 4) is considered for the present investigation as reliable detection of the defect using the SNR value (such as [28]). For example, the signal-to-noise ratio of the defect Ø 16 mm, RWT 0.75 mm of the HFB test specimen (see Figure 5) results in an SNR value of 33.4, and is therefore clearly detectable according to the selected objective criteria. Investigations into the reproducibility of the SNR value determination resulted in a relatively high reproducibility. The average deviation of the SNR value is pprox. 3.1% for larger defects. For smaller defects (Ø 2 and 4 mm), the deviation was around 4.9%.

3. Results

3.1. Defect Detection for Idealized Test Specimens

Figure 6 shows the determined SNR values of the shearography measurements for blind holes with flat bottoms (HFB). Within a defect diameter, the SNR value decreases almost linearly as the RWT increases. Holes with a diameter ≥8 mm and a depth of up to 2.75 mm can be detected across all measurements. Through a linear extrapolation of their SNR value curves, it can be assumed that irregularities with these sizes lying deeper in the material can also be detected. Introduced irregularities with a diameter of 4 mm can be detected up to a remaining wall thickness of 1.75 mm. Defects with a size of Ø 2 mm can be reliably detected via the SNR value (SNR ≥ 4) until a RWT of 1.5 mm. Defects with a diameter of 1 mm cannot be detected with the selected measurement parameters.
Within the same defect depth, a larger defect diameter leads to a higher SNR value. From the large changes in the SNR values between the smaller hole diameters at same RWT, it can be deduced that a change in diameter of smaller flaws has a greater influence on the SNR values compared to larger flaws (with the same RWT).
In a further series of tests, the test specimens containing blind holes with conical bottoms (HCB) were examined. The resulting SNR values and the comparison of these defects with the blind holes with flat bottoms (HFB) are shown in Figure 7.
The almost-linear decrease in the SNR values with increasing remaining wall thickness could also be observed with the HCBs. However, HCB defects with the same RWT and size showed a higher signal-to-noise-ratio value than HFB defects. The difference in the SNR values is particularly clear for the small defect sizes (Ø 2 mm and Ø 4 mm), where the conical flaws are easier to detect. For these two defect sizes, deeper-lying defects can be detected (detection limits: RWT 1.75 mm for Ø 2 mm; RWT 2 mm for Ø 4 mm) compared to HFB. Defects with a diameter of 1 mm could also not be detected with the HCB defect type.
The slightly different shearograms of both defect types for 8 mm diameter and 0.75 mm RWT (compare round marks in Figure 7) are shown in Figure 8. The geometry-related change in the defect indication in the shearogram can be seen, with HFB showing a convex geometry and HCB showing a circular section. At the same time, the figure shows less noise in the HCB defect geometry. This reduced noise is the main contributor to the higher SNR values of this type of defect.

3.2. Defect Detection for Real Test Specimens

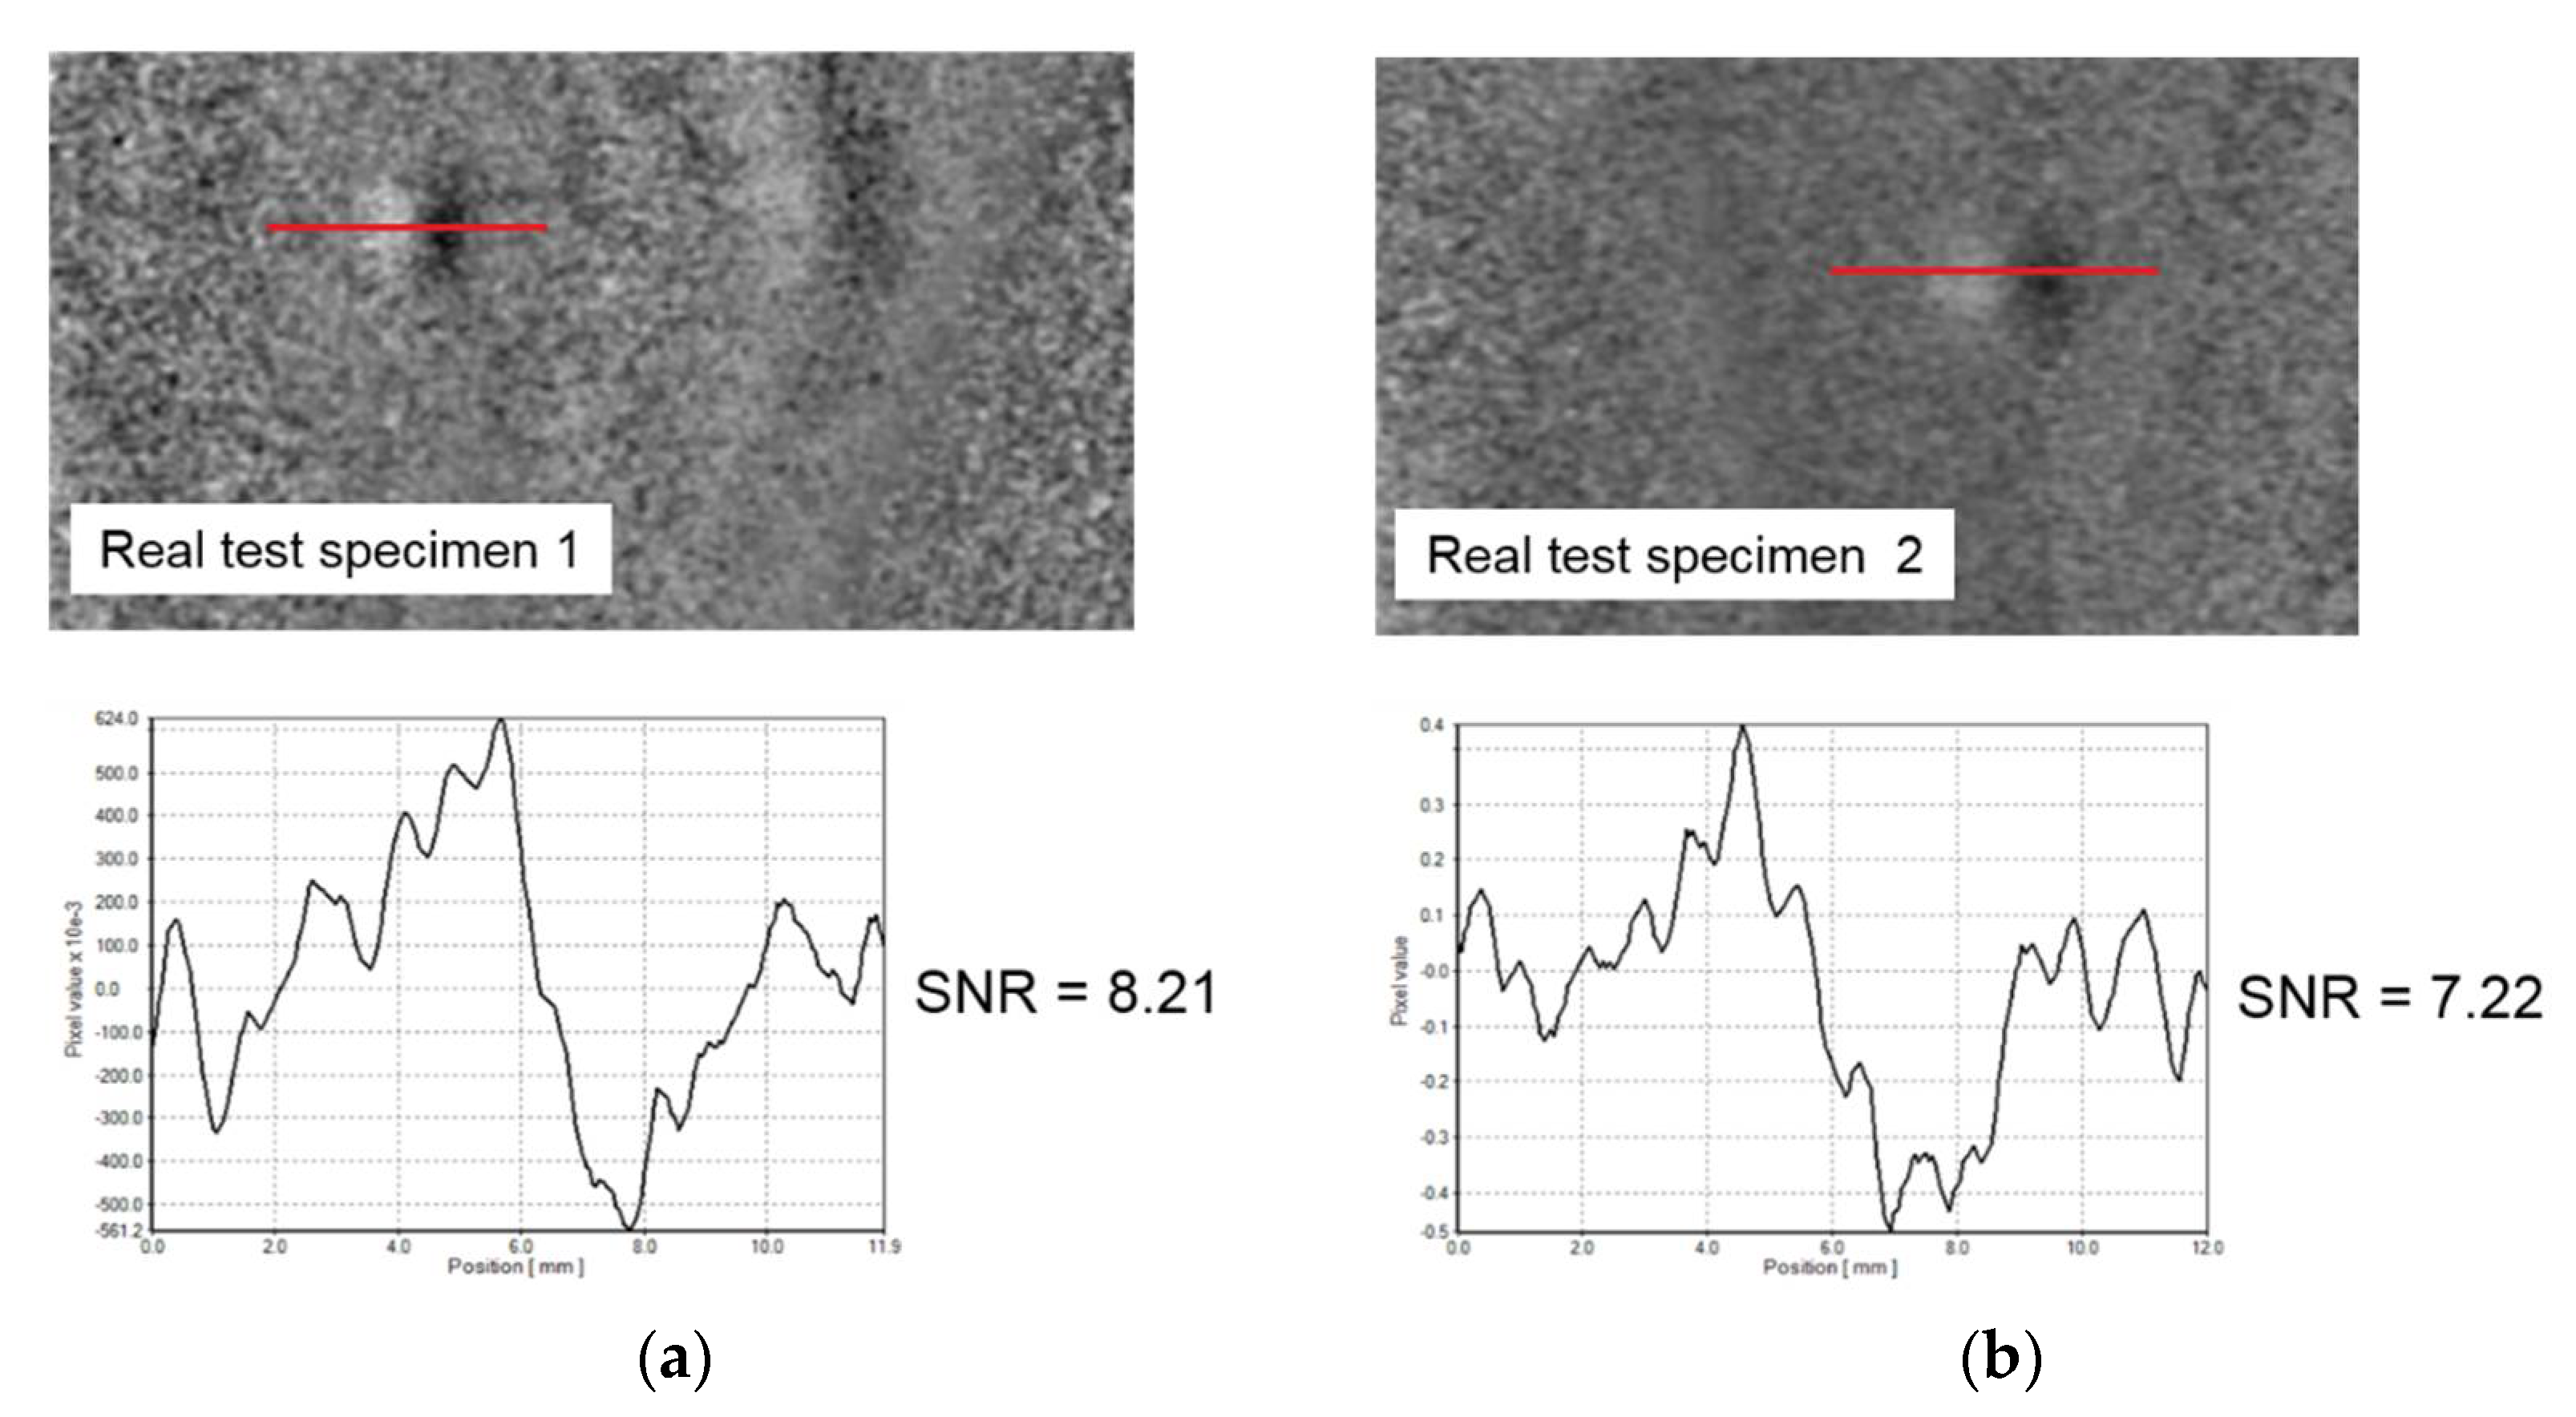
The measurements of the real test specimen were carried out on the same test setup with the same excitation and measurement parameters. Thus, the results of the real test specimens can be compared with the previous series of measurements. Figure 9 shows the shearograms, as well as the course of the intensity values along the red line and the calculated SNR values for both examined real test specimens.
The shearogram of the real test specimen 1 (see Figure 9a) allows the pitting corrosion to be identified despite the high level of noise. Within the course of the intensity values, a signal feature typical of irregularities can be recognized (compare Figure 5). The SNR value for this defect was calculated using the method presented beforehand and is 8.21. The pitting corrosion can thus be clearly detected according to this objective criterion.
The shearogram and the course of the intensity values of real test specimen 2 are shown in Figure 9b. The area with the grown pitting corrosion is clearly recognizable in the shearogram, even with higher noise. The defect-related deformation change can be clearly seen from the course of the intensity values. According to this, the SNR value of the defect is 7.22, so a clear defect detection according to the SNR ≥ 4 condition is given.
The signal-to-noise ratios determined for the real test specimen are also shown in Figure 7 (see black measuring points). The SNR values of both real test specimens are larger than the HFB defects of comparable size. The SNR values for the corresponding defect size Ø 2 mm with RWT of 1.0 mm is only 3.39 (below the detection limit); with RWT of 1.25 mm it is 5.69. In comparison, the signal-to-noise ratio for real test specimen 1 (SNR = 8.21, reliable detection) is 140% higher, and for real test specimen 2 (SNR = 7.22) it is still 26% higher than the value of the comparable HFB defect. The percentage deviation of the SNR values between the HCB defect with RWT of 1.0 mm (SNR value = 8.42) and the real test specimen 1 is approx. 2.5%. The difference between the HCB defect with RWT of 1.25 mm (SNR value = 8.03) and the real test specimen 2 is approx. 11.1%.

4. Discussion

Since real defects with a wide range of geometries and sizes for a specific material are rare, they often have to be simulated for scientific investigations. Based on the present results, a question arises. Which reproducible defect geometry is suitable for simulating internal defects such as pitting corrosion for shearographic testing?
The comparison of the geometry of real pitting corrosion (see Figure 3) with the simulated geometries (see Figure 2) offers a first approach. Due to the nonuniform growth of the corrosion, a defect geometry running parallel to the surface with 90-degree angles at the corrosion’s edge is not to be expected. Rather, the remaining wall thickness resulting from the height of corrosion only applies to single areas. Most areas have a significantly greater distance to the surface; the width changes constantly with increasing distance. Due to the changing remaining wall thickness, the induced eddy currents do not run parallel. Correspondingly, local changes occur during heating, especially at the point with the lowest RWT. A comparison of the real geometry with those of the developed defect type blind holes with conical bottoms (HCB) seems more obvious here.
A comparison of the shearograms of the real test specimen with the shearograms of the HFB and HCB defect types is also meaningful. The comparison with the defect indications of the shearograms in Figure 8 and Figure 9 makes it clear that the corrosion-related change of deformation of both real test specimens corresponds more closely to the HCB defect type.
Finally, the determined SNR values also show that the simulation of pitting corrosion by HCB (deviation approx. 10%) leads to clearly comparable measurement data. However, the deviation from comparable HFB is more than 25%.
With these results, a further simulation of internal defects such as pitting corrosion for shearography testing is recommended with the HCB defect type presented.

5. Conclusions

This paper examines the potential shearography for nondestructive testing of austenitic stainless steels. With its intrinsic material properties, such as coarse, anisotropic grains of the heterogeneous austenitic structure and comparatively low heat conduction, and at the same time, higher thermal expansion, this class of materials is difficult to test nondestructively. Induction excitation is used for this material class to introduce the necessary deformation required for shearographic testing. Due to the fast and noncontact heat generation in the material, the test specimens can be reproducibly heated within one second with the help of induction excitation and then tested. With these properties, induction can be used as the high-performance type of excitation sought for the shearographic testing of metals. An induction-excited shearography system is cheaper by a factor of 10 than a CT system. The test duration is in the range of seconds compared to the CT test durations in the range of many minutes or even hours.
Special test specimens with idealized and real internal defects were developed and used for the investigations. The test parameters used with an excitation time of 1 s as well as an objective evaluation of the defect detection based on the SNR value were presented. The presented detection limits are based on defect detection with an SNR value of 4 or higher. Based on the results shown, the reader can also derive the detection limits for other individual SNR limits.
The presented results show that induction-excited shearography is suitable for nondestructive testing of austenitic stainless steels. With the idealized defects (blind holes with flat bottoms, HFB), all defects with a defect size of Ø 2 mm can be detected in a depth of 1.5 mm and with a defect size of Ø 4 mm up to 1.75 mm. Starting with a defect size of Ø 8 mm, all defects could be detected in the maximum investigation defect depth of 2.75 mm. The measurement of the more realistic defects (blind holes with conical bottoms, HCB) showed a significant increase in the measured SNR values with the same defect size and depth. This means that smaller real defects can be detected at greater depths, as the measurement data also show. As the RWT increased, the SNR value decreased almost linearly for all defect geometries.
Using the real test specimens, it was finally possible to show that the detection limits derived from simulated defect sizes can be transferred to real defects and applications. Both real defects with a size of approx. 2 mm in diameter and a minimal RWT of approx. 1 mm could be reliably detected in the shearogram and via the SNR value. From this, it can be assumed that real irregularities in practice show comparable SNR values as the presented HCB defect types.
In the study presented, defects with a size of 1 mm could not be detected. This raises the question of under which changed test conditions may irregularities with a diameter of 1 mm and smaller be detected. Further studies will consequently need to address the influence of smaller amounts of shear and higher frame rates of the shearography detector on the SNR value. Furthermore, a detailed consideration of the change in deformation forced by induction excitation should be carried out, taking into account the material properties and geometries.

Author Contributions

Conceptualization, methodology: I.K.; investigation: I.K. and E.P.; writing and editing of draft manuscript: I.K.; review of manuscript: E.P. and N.S.; supervision and review of manuscript: N.S. and S.B. All authors have read and agreed to the published version of the manuscript.

Funding

This research received no external funding.

Data Availability Statement

Not applicable.

Conflicts of Interest

The authors declare no conflict of interest.

References

  1. Mix, P.E. Introduction to Nondestructive Testing. A Training Guide, 2nd ed.; John Wiley & Sons, Inc.: Hoboken, NJ, USA, 2005. [Google Scholar]
  2. Bargel, H.-J.; Schulze, G. Werkstoffkunde, 8., überarbeitete Auflage; Springer: Berlin, Heidelberg, Germany, 2004. [Google Scholar]
  3. Schuster, J.; von Eisen-, S.; Nickelwerkstoffen, S. Leitfaden für die schweißmetallurgische Praxis, 2., überarbeitete und erweiterte Auflage; DVS Media: Düsseldorf, Germany, 2009. [Google Scholar]
  4. ASTM International. ASTM G46—94; Standard Guide for Examination and Evaluation of Pitting Corrosion (Reapproved 2018). ASTM: West Conshohocken, PA, USA, 2018. [Google Scholar]
  5. Jüngert, A.; Dugan, S.; Homann, T.; Mitzscherling, S.; Prager, J.; Pudovikov, S.; Schwender, T. Advanced ultrasonic techniques for nondestructive testing of austenitic and dissimilar welds in nuclear facilities. AIP Conf. Proc. 2018, 1949, 110002. [Google Scholar] [CrossRef]
  6. Leger, A.; Deschamps, M. Ultrasonic Wave Propagation in Non Homogeneous Media; Springer: Berlin/Heidelberg, Germany, 2009. [Google Scholar]
  7. Wang, Q.; Gong, S.-F.; Yuan, P.; Xiao, K. Performance evaluation of austenitic stainless steel weld defect detection in ultrasonic phased array based on DORT. In Proceedings of the 2016 IEEE Far East NDT New Technology & Application Forum (FENDT), Nanchang, China, 22–24 June 2016; pp. 209–213. [Google Scholar] [CrossRef]
  8. Khan, M.A.; Sultan, Q.; Tariq, F. Effect of pitting corrosion on similar and dissimilar alloy welded joints. J. Braz. Soc. Mech. Sci. 2017, 39, 4037–4044. [Google Scholar] [CrossRef]
  9. Steinchen, W.; Yang, L.X.; Kupfer, G.; Mäckel, P. Non-destructive testing of aerospace composite materials using digital shearography. Proc. Inst. Mech. Eng. Part G J. Aerosp. Eng. 1998, 212, 21–30. [Google Scholar] [CrossRef]
  10. Hung, Y.Y. Applications of digital shearography for testing of composite structures. Compos. Part B Eng. 1999, 30, 765–773. [Google Scholar] [CrossRef]
  11. Gryzagoridis, J.; Findeis, D. Benchmarking shearographic NDT for composites. Insight-Non-Destr. Test. Cond. Monit. 2008, 50, 249–252. [Google Scholar] [CrossRef] [Green Version]
  12. Steinchen, W.; Yang, L.X. Digital shearography. In Theory and Application of Digital Speckle Pattern Shearing Interferometry; SPIE Optical Engineering Press: Bellingham, DC, USA, 2003. [Google Scholar]
  13. Ettemeyer, A. Laser shearography for inspection of pipelines. Nucl. Eng. Des. 1996, 160, 237–240. [Google Scholar] [CrossRef]
  14. Kim, K.-S.; Kang, K.-S.; Kang, Y.-J.; Cheong, S.-K. Analysis of an internal crack of pressure pipeline using ESPI and shearography. Opt. Laser Technol. 2003, 35, 639–643. [Google Scholar] [CrossRef]
  15. Liu, Z.; Gao, J.; Xie, H.; Wallace, P. NDT capability of digital shearography for different materials. Opt. Lasers Eng. 2011, 49, 1462–1469. [Google Scholar] [CrossRef]
  16. Buerakov, W. Interferometrische Bauteilprüfung, Schadenserkennung und Ermittlung der modalen Parameter mittels dynamischer Belastung. Ph.D. Thesis, Saarland University, Saarbrücken, Germany, 28 July 2017. [Google Scholar]
  17. De Angelis, G.; Meo, M.; Almond, D.P.; Pickering, S.G.; Angioni, S.L. A new technique to detect defect size and depth in composite structures using digital shearography and unconstrained optimization. Ndt E Int. 2012, 45, 91–96. [Google Scholar] [CrossRef]
  18. Pickering, S.G.; Almond, D.P. Comparison of the defect detection capabilities of flash thermography and vibration excitation shearography. Insight-Non-Destr. Test. Cond. Monit. 2010, 52, 78–81. [Google Scholar] [CrossRef] [Green Version]
  19. Hung, Y.Y.; Chen, Y.S.; Ng, S.P.; Liu, L.; Huang, Y.H.; Luk, B.L.; Ip, R.W.L.; Wu, C.M.L.; Chung, P.S. Review and comparison of shearography and active thermography for nondestructive evaluation. Mater. Sci. Eng. R Rep. 2009, 64, 73–112. [Google Scholar] [CrossRef] [Green Version]
  20. Yang, L.; Samala, P.R.; Liu, S.; Long, K.W.; Lee, Y.L. Measurement of nugget size of spot weld by digital shearography. In Optical Diagnostics; SPIE: Bellingham, DC, USA, 2005; Volume 5880, pp. 50–57. [Google Scholar] [CrossRef]
  21. Menner, P.; Schmitz, P.; Gerhard, H.; Busse, G. Lockin-Speckle-Interferometry with Modulated Optical and Inductive Excitation. In Proceedings of the 10th European Conference on Non-Destructive Testing, Moscow, Russia, 7–11 June 2010. [Google Scholar]
  22. Kryukov, I.; Böhm, S. Prospects and limitations of eddy current shearography for non-destructive testing of adhesively bonded structural joints. J. Adhes. 2018, 16, 1–13. [Google Scholar] [CrossRef]
  23. Habib, K. Thermally induced deformations measured by shearography. Opt. Laser Technol. 2005, 37, 509–512. [Google Scholar] [CrossRef]
  24. Hung, Y.Y.; Ho, H.P. Shearography: An optical measurement technique and applications. Mater. Sci. Eng. R Rep. 2005, 49, 61–87. [Google Scholar] [CrossRef]
  25. G48—11; ASTM International. Standard Test Methods for Pitting and Crevice Corrosion Resistance of Stainless Steels and Related Alloys by Use of Ferric Chloride Solution (Reapproved 2015). ASTM: West Conshohocken, PA, USA, 2015.
  26. Rudnev, V.; Loveless, D.; Cook, R.L. Handbook of Induction Heating, 2nd ed.; CRC Press: Boca Raton, FL, USA, 2017. [Google Scholar]
  27. Menner, P. Zerstörungsfreie Prüfung von modernen Werkstoffen mit dynamischen Shearografie-Verfahren. Ph.D. Thesis, University of Stuttgart, Stuttgart, Germany, 27 March 2013. [Google Scholar]
  28. Oswald-Tranta, B.; Tuschl, C. Lock-in inductive thermography for surface crack detection in non-magnetic metals. In Proceedings of the 14th Quantitative InfraRed Thermography Conference, Berlin, Germany, 25–29 June 2018. [Google Scholar]
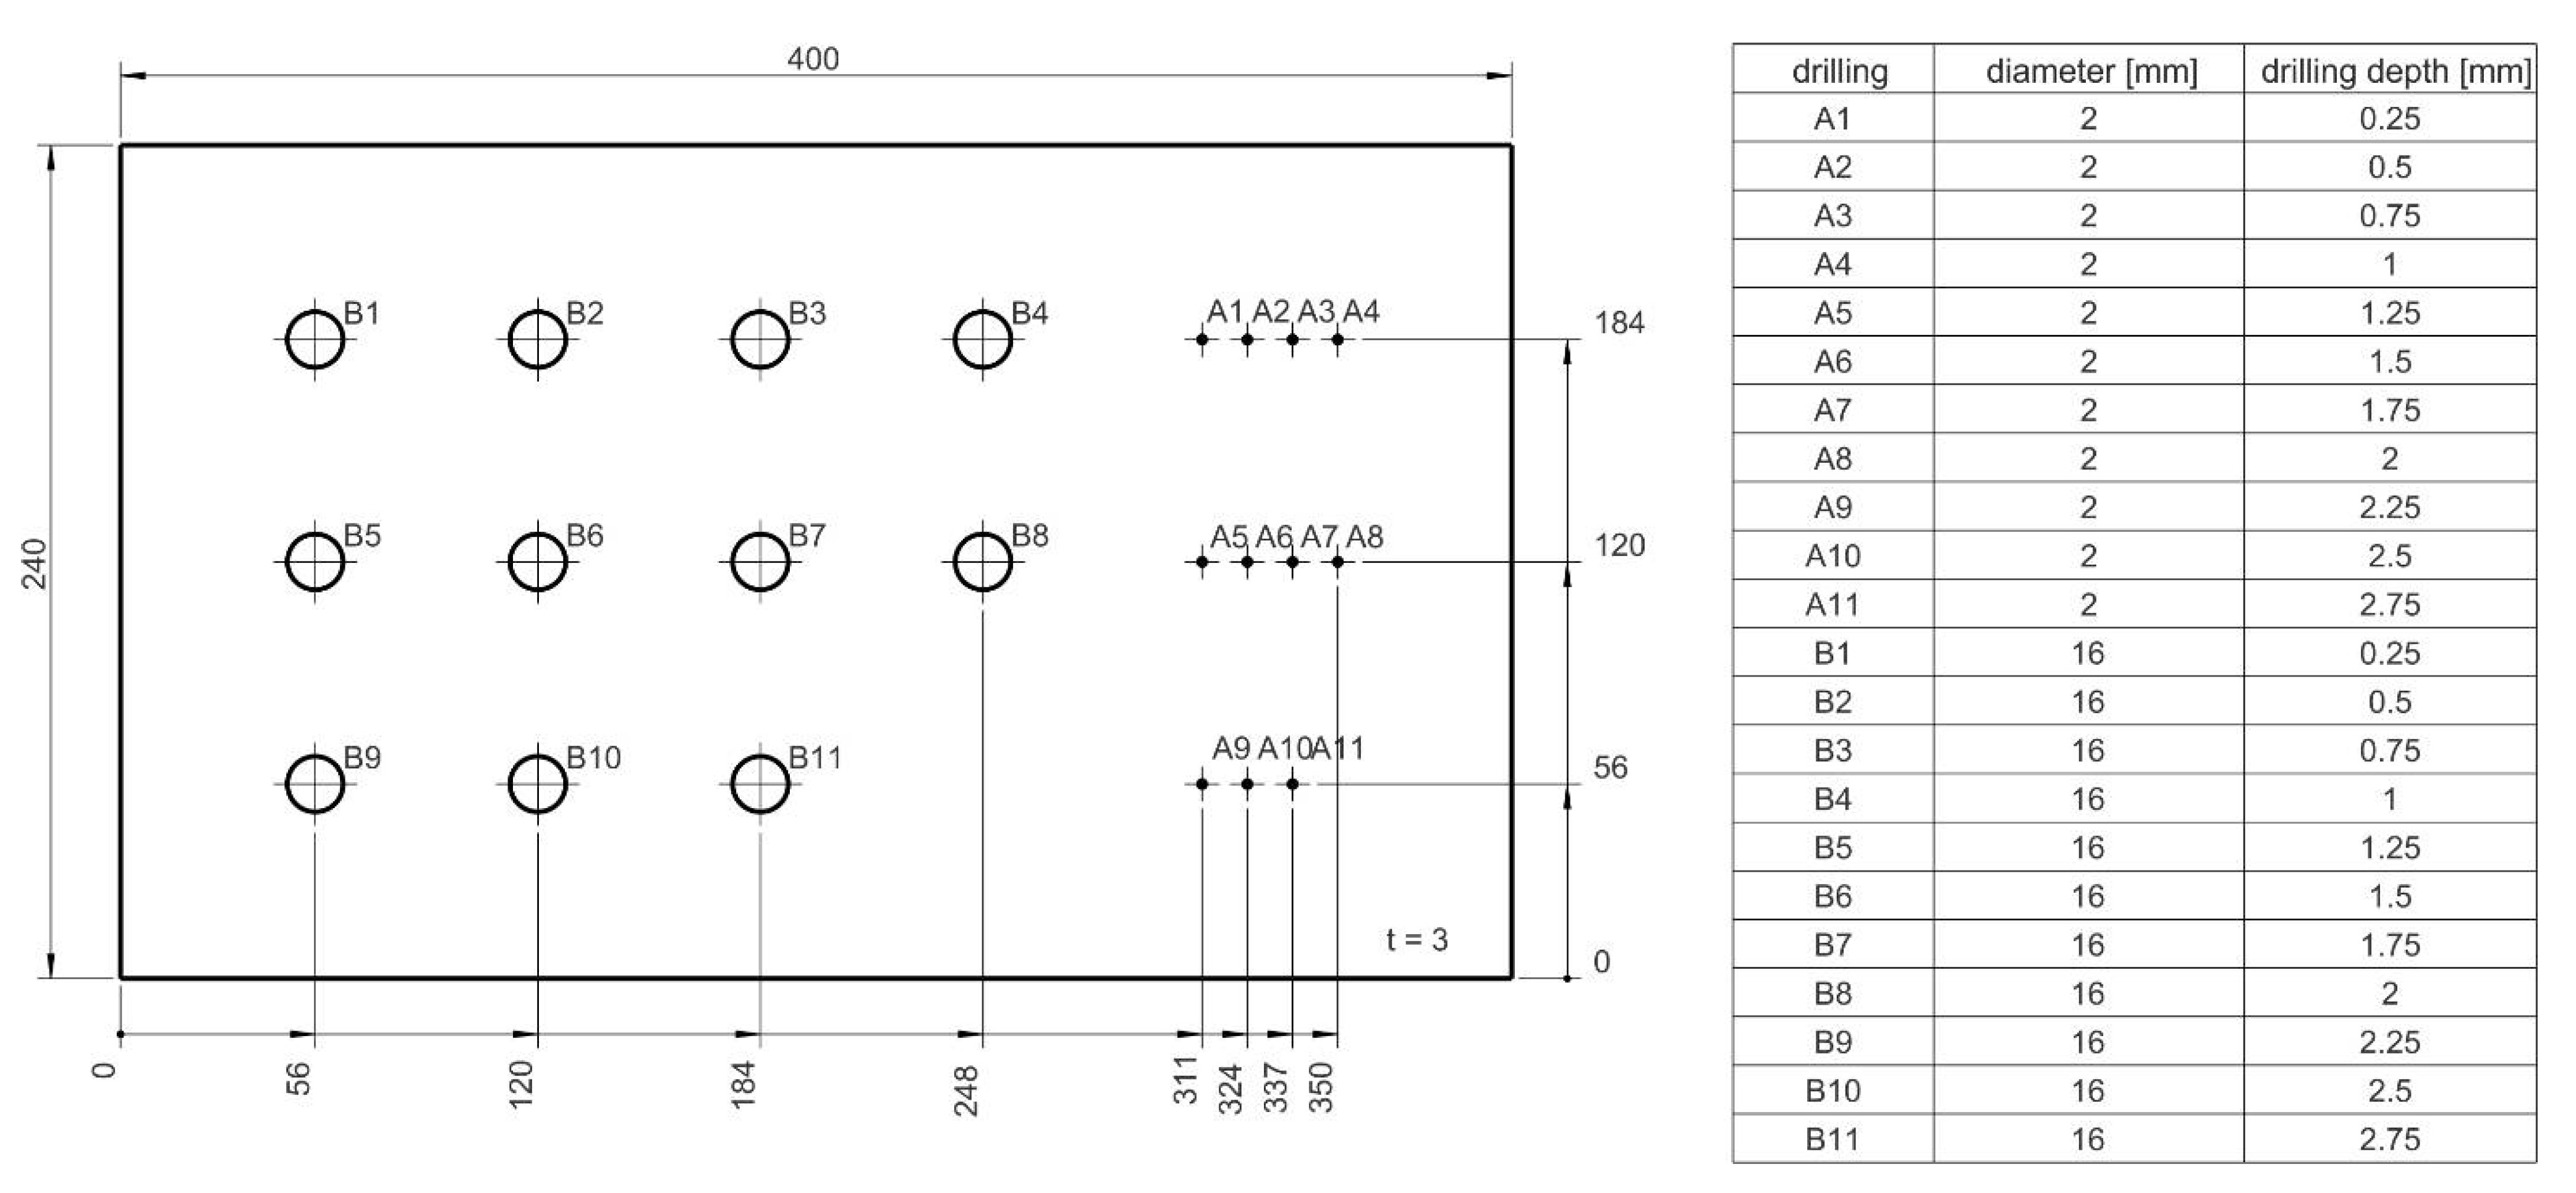
Figure 1. Geometry of HFB test specimens with drilled holes of diameter Ø 16 mm and Ø 2 mm.
Metals 13 00074 g001
Figure 2. Schematic illustration of a blind hole with a flat bottom (HFB, left) and a blind hole with conical bottom (HCB, right); both Ø 4 mm, 2.5 mm drilling depth.
Metals 13 00074 g002
Figure 3. Real test specimen 1 (a) and 2 (b): volume reconstruction of pitting corrosion after computed tomography (CT) scan (top), specimen surface with size of pit opening (bottom left) and cross-section through greatest height of corrosion in CT measurement data (bottom right).
Metals 13 00074 g003
Figure 4. Test setup with shearography sensor, test specimen and inductor.
Metals 13 00074 g004
Figure 5. (a) Shearogram of the defect Ø 16 mm (HFB), RWT 0.75 mm, SNR ≈ 33; (b) course of the intensity values for the same defect along the red line.
Metals 13 00074 g005
Figure 6. Determined SNR values of blind holes with flat bottoms of different diameters for different remaining wall thicknesses.
Metals 13 00074 g006
Figure 7. Comparison of the determined SNR values of blind holes with flat bottoms (HFB) and blind holes with conical bottoms (HCB) of diameter 8 mm, 4 mm, 2 mm and 1 mm, as well as the real test specimen.
Metals 13 00074 g007
Figure 8. Comparison of the shearograms of blind holes with conical bottoms (HCB, (left)) and blind holes with flat bottoms (HFB, (right)) of diameter 8 mm and RWT 0.75 mm (see Figure 7).
Metals 13 00074 g008
Figure 9. Shearogram, course of the intensity values along the red line and determined SNR value of (a) real test specimen 1, SNR ≈ 8.2; (b) real test specimen 2, SNR ≈ 7.2.
Metals 13 00074 g009
Disclaimer/Publisher’s Note: The statements, opinions and data contained in all publications are solely those of the individual author(s) and contributor(s) and not of MDPI and/or the editor(s). MDPI and/or the editor(s) disclaim responsibility for any injury to people or property resulting from any ideas, methods, instructions or products referred to in the content.