Abstract
Identification and characterization play an essential role in the study of non-metallic inclusions (NMIs) in monitoring the steel casting process and product quality. This study uses Raman spectroscopy, a versatile, relatively fast, and non-destructive technique for characterizing oxide and sulfide-based inclusion phases in steel samples. The relative Raman peak intensities and positions were used to qualitatively estimate the inclusion phases of Al2O3, CA, C12A7, C3A, MgO·Al2O3, and CaS. For a quantitative estimation, FESEM-EDS (field emission scanning electron microscope with energy dispersive X-ray spectroscopy) was used to evaluate the inclusion phases in the samples. This study demonstrates that Raman spectroscopy can be used to rapidly estimate the content of Al2O3, magnesium aluminate spinel (MgO·Al2O3), and the calcium aluminate phases of CA, C3A, and C12A7 in steel samples to complement established characterization techniques for NMIs analysis such as FESEM-EDS.
1. Introduction
Non-metallic inclusions (NMIs) could be considered essential for assessing steel’s cleanliness, affecting both the process control during steelmaking and the mechanical properties [1,2]. Therefore, various studies [3,4,5] concerning the formation, modification, and impact of non-metallic inclusions have been conducted to further enhance the process control during steelmaking and for the assessment of steel cleanliness. The conventional deoxidation process is carried out by introducing aluminum into the molten steel. This is usually followed by a calcium treatment, mainly used to transform detrimental solid aluminum oxide (Al2O3) inclusions into low-melting calcium aluminate phases such as mayenite, 12CaO∙7Al2O3 (C12A7), and tricalcium aluminate, 3CaO∙Al2O3 (C3A) [6,7,8]. However, features such as the effectiveness of the deoxidation [9], the type of refractory materials used [10,11], and the content of elements such as sulfur (S) and magnesium (Mg) in the melt could contribute to the formation of potentially detrimental inclusions [12]. These could include solid calcium aluminate, alumina, solid calcium sulfide (CaS), and magnesium aluminate spinel (MgO.Al2O3) and can result in processing challenges such as clogging of the submerged entry nozzle (SEN) [1,13].
Various analytical characterization techniques [3,4,14] have contributed to understanding the formation, identification, and classification of non-metallic inclusions. Zhang et al. [14] have outlined various analytical techniques for inclusion studies. Despite the utilization of these conventional analytical techniques outlined by Zhang et al. [14], the potential challenge limiting their use includes time-consuming sample preparation or analyses, and some methods are destructive. On the other hand, the advantages of Raman spectroscopy include a shorter time for sample preparation, measurement, and analysis of the results. Furthermore, Raman spectroscopy has been proven to be a potential technique for both the qualitative and quantitative characterization of Raman active materials, including different calcium aluminates, magnesium aluminate spinel, and CaS phases.
The present authors previously conducted studies [15,16,17] demonstrating the use of Raman spectroscopy to characterize synthetic inclusions phases such as calcium-aluminate (such as CA, C12A7, and C3A), CaS, and MgO·Al2O3 in the binary or multi-component system; however, previous studies on the application of Raman spectroscopy for oxide inclusions in steel samples by Li and Hihara [18] mainly focused on calcium aluminate inclusion phases such as CA2 and CA in steel samples. Despite previous studies’ [15,16,17] ability to identify relatively complex multiphase inclusion systems consisting of phases such as calcium aluminates (such as CA, C12A7, and C3A), CaS, and MgO·Al2O3 spinel using Raman spectroscopy, these works were limited to the use of only prepared synthetic samples. To enhance the utilization of Raman spectroscopy for assessing steel’s cleanliness through non-metallic inclusion characterization, it is essential to conduct a further study using actual steel samples, such as laboratory or industrial steel samples. Consequently, in this work, we supplemented these results by using actual steel samples since the steel matrix is Raman inactive. Also, this work compared Raman spectral analysis for relatively complex multiphase non-metallic inclusion and FESEM-EDS (field emission scanning electron microscope with energy dispersive X-ray spectroscopy) results from the steel samples measured.
This study examines the applicability of Raman spectroscopy to the identification of multiphase inclusions consisting of calcium aluminates, CaS, Al2O3, MgO, and MgO·Al2O3 spinel in low-carbon aluminum-killed steel samples. Additionally, the use of Raman spectroscopy as a complementary technique to FESEM-EDS is explored to provide a relatively fast assessment of the phase composition in the steel sample.
2. Materials and Methods
Three industrial steel samples of low-carbon Al-killed steels were investigated for non-metallic inclusions with Raman spectroscopy and scanning electron microscopy. The samples were obtained from the melt during the steelmaking processes. The target composition for the steels studied was <0.15 wt% C, and 0.37 wt% Si. Sample #1 and Sample #3 contained 1.0 wt% Al and 2.0 wt% Mn, Sample #2 contained 1.0 wt% Al and 1.7 wt% Mn.
The TimeGated® Raman spectrometer (TG532 M1) obtained from Timegate instruments limited, Oulu, Finland, was used for this study, with detailed spectroscopic features already presented in previous works [15,16]. The Raman spectroscopy measurements were carried out within a Raman shift region between 100 and 1000 cm−1, with a resolution of 10 cm−1 laser power (545 nm) and under ambient conditions. Two experimental situations were carried out for spectra acquisition during the Raman measurement. First, the sample holder for Raman spectroscopy was equipped with a rotating stage, in which an average Raman spectrum at the different sites of each sample was measured. Second, different spot measurements (with a spot size of 1 mm) of the samples were acquired, with at least three replicates collected (spectra) on various spots for each sample.
The spectra acquisition duration was between 5 and 10 min, with five spectra replicates collected for each measurement. The pre-processing software (from the Timegate instrument) was used for the initial Raman spectra data treatment such as basic background subtraction. A statistical software program (Origin 2022b SR1) by OriginLab Corporation (distributor; DoubleClick AB, Gullbergsvassgatan 8, 411 04 Göteborg, Sweden) was then used for subsequent Raman spectra pre-processing and peak fitting. A Gaussian peak shape was used for the Raman peak fitting because it is generally shown for Raman spectral data.
The NMI contents were analyzed with a Zeiss Ultra Plus FESEM-EDS on the polished cross-sections of steel samples. The composition of particles larger than 1 µm in an equivalent circle diameter was analyzed with the Inca Feature. The scanned section in each sample covered an area of 48 mm2.
Particles containing less than 25 wt.% of Al, Ca, Mg, and S in total were discarded from the dataset. For each remaining NMI, the fractions of Al2O3, CaO, MgO, and CaS components were calculated from the EDS analyses. The NMIs were classified as oxides (Al2O3 + CaO + MgO > 10 wt.%, CaS < 10 wt.%), oxides with CaS (Al2O3 + CaO + MgO > 10 wt.%, CaS > 10 wt.%), and CaS (Al2O3 + CaO + MgO < 10 wt.%, CaS > 10 wt.%).
3. Results
3.1. Inclusion Phase Identification Based on Raman Spectra Analysis
Table 1 presents the main reference Raman peaks associated with each phase relevant to this study. Figure 1 shows the reference Raman spectra for synthetic inclusion phases of CA, C3A, C12A7, CaS, and MgO·Al2O3, previously studied by the authors. Table 1 and Figure 1 are therefore used as references to identify the phases in the samples measured for this study for both Raman measurements, using spot and rotating sample holders. In addition, details concerning the bonding structure for the Raman band (peak) characteristic and identification of each phase’s component are presented in a previous work [17].

Table 1.
Raman peak positions were used to identify the inclusion phases in samples measured with Raman spectroscopy in this study (where s denotes strong, m is medium, and w is weak).
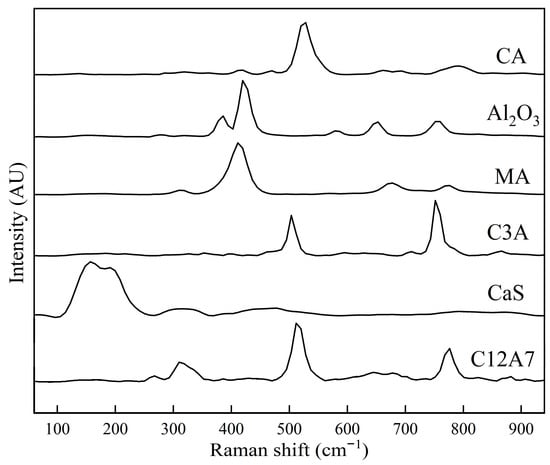
Figure 1.
The Raman spectra for CA, Al2O3, MgO·Al2O3, C3A, CaS, and C12A7 obtained from synthetic phases prepared in previous studies [15,16,17,18,19,20,21].
3.2. Qualitative Identification of Inclusion Phases based on Raman Spectra
Figure 2, Figure 3 and Figure 4 show Raman spectra obtained from the measurement conducted in two measuring situations, first using a rotating sample holder stage and different spot measurements. Previous studies [15,16,17] using synthetic phases demonstrated that variation in the phase fraction in samples measured with Raman spectroscopy had a corresponding effect on the relative intensity of the peak’s characteristic of a specified phase that constituted the sample. Consequently, from the Raman spectra obtained, the peak’s positions and intensity could be used to qualitatively predict the inclusion phases in the sample. To further explore the applicability of Raman spectroscopy for NMI characterization, spot measurements were conducted at different points on the samples. The spectra obtained from the three sets of samples with the measurement conducted at various sites demonstrate a relative variation in peak intensity associated with specific inclusion phases acquired from other locations within the sample. In addition, the prominent peak positions from the Raman spectra presented in the illustrative figures below correspond relatively well with the reference Raman peak positions reported in Table 1 for each specific inclusion phase.
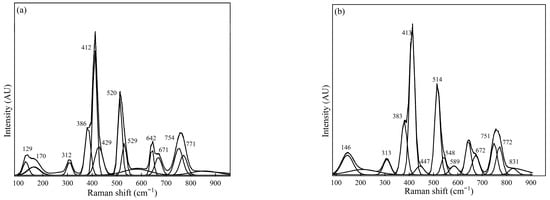
Figure 2.
Raman spectra for Sample #1 were measured using (a) spot measurements and (b) sample rotation (using the rotating stage).
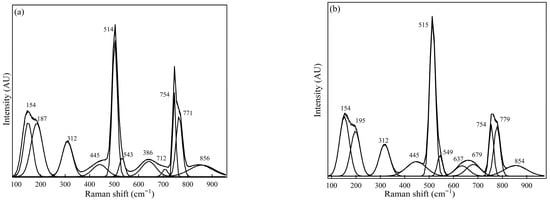
Figure 3.
This Raman spectra for Sample #2 were measured using (a) spot measurements and (b) sample rotation (using the rotating stage).
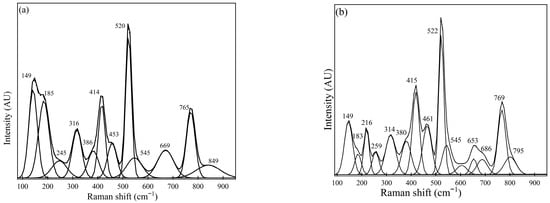
Figure 4.
Raman spectra for Sample #3 were measured using (a) spot measurements and (b) sample rotation (using the rotating stage).
3.3. Raman Spectra from the Samples
Figure 2 shows Raman spectra for Sample #1 spot measurements and sample rotation (using the rotating stage) during measurements. The spectra obtained from the sample illustrated in Figure 2 show the intense peaks located at 412 cm−1, 520 cm−1, and 760 cm−1; and 148, 382 cm−1, 661 cm−1, and 545 cm−1 can be regarded as the medium peaks. A similar trend was observed for the spectra obtained for measurements conducted using a rotating sample holder to indicate the presence of NMI phases such as CaS, calcium aluminates, and MgO·Al2O3, based on the most intense and medium peaks identified.
Figure 3 illustrates the Raman spectrum for Sample #2 obtained from the measurements. The Raman spectral presented in Figure 3a (spot measurements) shows the dominant peaks at 154 cm−1, 514 cm−1, 754 cm−1, and 771 cm−1, with medium peaks at 195 cm−1, 312 cm−1, and 543 cm−1. Figure 3b illustrates measurements conducted using a rotating sample holder, with peaks locating at 156 cm−1, 195 cm−1, 515 cm−1, 754 cm−1, and 779 cm−1 as the most relative intense peaks positions, and with 312 cm−1, 549 cm−1, and 679 cm−1 observed as medium peaks. Consequently, using Raman spectra demonstrates the potential to qualitatively identify the NMI phases in the sample using the Raman peak position attributable to a specific phase.
Similarly, Figure 4 shows Raman spectra obtained from Sample #3, illustrating the presence of calcium aluminates, MgO·Al2O3, and CaS. In Figure 4a, Raman peaks at 149 cm−1, 316 cm−1, 520 cm−1, and 771 cm−1 could be observed as dominant peaks. Furthermore, 386 cm−1, 545 cm−1, and 669 cm−1 are considered medium peaks. A similar trend was observed for the spectra obtained from measurements conducted using a rotating sample holder to estimate the presence of inclusions such as CaS, calcium aluminate-based phases, and MgO·Al2O3, based on the peaks identified.
3.4. Non-Metallic Inclusion Characterization with FESEM-EDS
Ternary diagrams in the Al2O3-CaO-MgO system were constructed, and the composition of each oxide-containing NMI is plotted in the diagrams presented in Figure 5. Secondary electron images of typical NMIs in the samples are presented in Figure 6, and corresponding EDS analyses in Table 2. It is observed that Sample #1 contains mostly MgO-rich NMIs (Figure 6a). Some oxide inclusions are located between Al2O3 and MgO·Al2O3, and a single calcium aluminate-rich inclusion is found near the C12A7-CA line. Oxides with CaS are a minority; however, in Sample #2, the majority of inclusions are oxides with CaS, as observed in Figure 5b. The oxide compositions are scattered but centered between calcium aluminates C3A and CA. Sample #3 shows a distinct line between calcium aluminates (C12A7, CA) and spinel (MgO·Al2O3). In this case, oxides with CaS are a minority. Typical calcium aluminate and calcium aluminate–CaS inclusions are presented in Figure 6b,c.
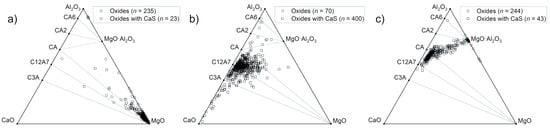
Figure 5.
Oxide compositions of NMIs observed in (a) Sample #1, (b) Sample #2, and (c) Sample #3.
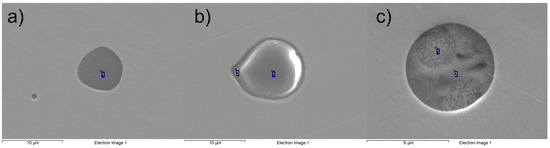
Figure 6.
Secondary electron images of (a) MgO, (b) calcium aluminate, (c) calcium aluminate–CaS-type NMIs.
Table 2.
EDS analyses (in wt%) for the NMIs presented in Figure 6.
To estimate the NMI phase fractions in the samples, the observed area of each NMI was allocated to CaS and the phases occurring in the Al2O3-CaO-MgO system according to their calculated fractions. For the oxides, it was assumed that the composition location in the Al2O3-CaO-MgO system determined the three oxide phases present in an NMI. The resulting estimate of NMI phase fractions in the samples is presented in Figure 7. The bar graph underlines the observations of the ternary diagrams: Sample #1 contains plenty of MgO with minor calcium aluminates, Al2O3, MgO·Al2O3, and CaS content. In Sample #2, most of the observed NMI area are CaS and the calcium aluminates C12A7 and CA. Finally, in Sample #3, the major phases observed are MgO·Al2O3, and calcium aluminates CA and C12A7.
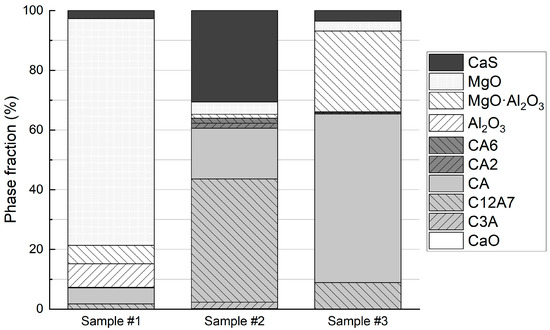
Figure 7.
NMI phase fractions in the steel samples.
4. Discussion
Identification of Inclusion Phases Using Peak Position and Relative Intensity
Figure 2, Figure 3 and Figure 4 have demonstrated the prospect of using Raman spectra to qualitatively identify the inclusion phases present in the steel samples based on the Raman peak positions associated with a specific phase. The identifiable Raman peak positions from the study suggest the presence of calcium aluminates (such as CA, C12A7, or C3A), MgO·Al2O3, and CaS NMI phases with varying content.
For example, the Raman measurement conducted for Sample #1 shows peaks at approximately 412–415 cm−1 for MgO·Al2O3, 520 cm−1, 548 cm−1 associated with CA, and 383 cm−1 for Al2O3 could be reported as relatively intense peaks and considered the most prominent NMI phases found in Sample #1. These observations were observed for Sample #1, measured in both different spots and when rotating the sample during measurement conditions. Additionally, the appearance of a medium peak around 313 cm−1 is attributable to the C12A7 phase, and 754 cm−1 is associated with the C3A inclusion phases in Sample #1. The FESEM-EDS analysis for Sample #1 verified the presence of oxide phases such as Al2O3 CA, MgO·Al2O3, and MgO. The phases estimated qualitatively for Sample #1 generally, therefore, correspond to those reported in the SEM-EDS analysis (Figure 5 and Figure 6). It is noteworthy that the Raman spectra obtained from Sample #1, the MgO could not be clearly predicted compared with FESEM-EDS analysis, showing relatively dominant MgO; however, the Raman spectra in Figure 2b had a relatively medium/weak peak around 447 cm−1, attributed to MgO [23].
Sample #2, based on the Raman spectra obtained from the measurements, shows the dominant inclusion phases to be C12A7 (at peak positions 312, 514–516 cm−1, and 771 cm−1), C3A attributable to its most intense peak at 754 cm−1. Other candidate inclusions phases for Sample #2 may be CaS (for a peak at 155–160 cm−1) and CA (at a shoulder peak at 549 cm−1). The average Raman spectra obtained in the two measurement conditions were generally similar. A comparison between the phases qualitatively estimated from the Raman spectroscopy measurements and FESEM-EDS for Sample #2 therefore typically shows the presence of aluminate-based calcium (C12A7, C3A, and CA) and CaS.
Similarly, the most abundant phase in Sample #3 based on spectra observation also demonstrates the presence of oxide phases, mainly MgO·Al2O3 (414 cm−1, 669 cm−1), CA (520 cm−1, 545 cm−1), and C12A7 (316 cm−1, 771 cm−1). Additionally, less dominant phases include CaS (at 149 cm−1) and Al2O3 (386 cm−1). Further detailed studies using FESEM-EDS also estimated the inclusion phases of calcium aluminates (such as CA, C12A7, or C3A) and MgO·Al2O3. A slight variation between these two techniques for Sample #3 was the observation of CaS and Al2O3 phases with relatively weaker peaks that were not present in the FESEM-EDS results. However, the most prominent inclusion phases identified from the Raman spectra analysis correspond very well with the FESEM-EDS results.
Qualitative estimation of inclusion phases in steel samples based on the assignments of peak phases corresponds very well with previous work [15,16,17] conducted on synthetic sample phases. Therefore, Raman spectroscopy has the potential to provide a qualitative estimation of inclusion phases, which could further be examined using more quantitative techniques such as FESEM-EDS.
The current study demonstrates the applicability of Raman spectroscopy to identify CaS and various oxide phases presented as non-metallic inclusions in the steel. However, it is essential to mention some potential effects associated with the slight instrumental variation—for example, the frequency of scattered radiation and incident laser power that could affect the intensity of the Raman peaks (band). Another challenge with using Raman spectroscopy could be the potential fluorescence effect on the spectrum obtained from the measurements. However, the instrument used for this study is time-gated Raman spectroscopy (TimeGated®), which may be effective in fluorescence effect suppression on the obtained Raman spectra compared to conventional Raman spectroscopy [24]. Raman spectroscopy is generally regarded as a surface characterization technique. Although considered surface characterization, it offers an opportunity to estimate the phases in a sample based on the distinct peak positions. Other techniques such as FESEM-EDS may require further analysis to quantify the phase composition of a sample.
This study shows the future application of Raman spectroscopy to the identification of inclusion types of Al2O3, CaS, and calcium aluminates such as CA, C12A7, and C3A in steel samples. Given that inclusions in the steel matrix could potentially be heterogenous or a mixture of phases, this study indicates satisfactory results that estimate the phases’ presence in the samples using Raman spectral data.
Consequently, combining previous studies concerning synthetic [15,16,17] and actual [18] inclusions presents a broader scope for using Raman spectroscopy to characterize inclusions, as the steel matrix is Raman-inactive. Furthermore, the present study shows that relatively rapid Raman measurements can be used to complement established NMI characterization methods such as FESEM-EDS analyses. Raman spectroscopy has been shown as a potential technique for both the qualitative and quantitative analysis of Raman active materials [25,26]. It is therefore noteworthy that future studies use Raman spectroscopy for a multiphase inclusion in steel analysis consisting of phases such as calcium aluminates CaS and MgO·Al2O3 spinel.
5. Conclusions
In this study, Raman spectroscopy, combined with field emission scanning electron microscope with energy dispersive X-ray spectroscopy demonstrates its suitability for qualitative and quantitative analysis to estimate the inclusion phases in three sets of steel samples. The main findings obtained from this work are summarized as follows:
- The relative intensities and Raman peak positions were used to qualitatively estimate the sample phases of Al2O3, CA, C12A7, C3A, MgO·Al2O3, and CaS in the steel samples using Raman peaks at:
- ○
- 383 cm−1 for Al2O3, 149 cm−1 for CaS, and 412–415 and 669 cm−1 for MgO·Al2O3.
- ○
- For calcium aluminates; at 520 and 548 cm−1 for CA; 754 cm−1 for C3A; and 312, 514–516, and 771 cm−1 for C12A7.
- The inclusion phases identified based on the Raman spectra obtained from the sample generally correspond with those evaluated using FESEM-EDS analyses.
- This demonstrates the prospect of using Raman spectroscopy for quickly characterizing qualitatively oxides such as calcium aluminates, magnesium aluminate, spinel (MgO·Al2O3), and calcium sulfide-based inclusions in steel samples, followed by using FESEM-EDS for detailed studies.
Author Contributions
Conceptualization, F.G., T.A., and Q.S.; methodology, F.G. and T.A.; formal analysis, F.G. and T.A.; writing—original draft preparation, F.G. and T.A.; writing—review and editing, F.G., T.A., Q.S., and T.F.; supervision, T.F. All authors have read and agreed to the published version of the manuscript.
Funding
This research received no external funding.
Institutional Review Board Statement
Not applicable.
Informed Consent Statement
Not applicable.
Data Availability Statement
Not applicable.
Acknowledgments
Corresponding author (F.G.) wish to acknowledge the personal research grant support received from the Technology Industries of Finland Centennial Foundation under Steel and Metal Producers’ Fund, Finland (Application number 2155) under the project topic; The application of Raman spectroscopy for the study of non-metallic inclusions found in steel matrix and in situ high-temperature slag analysis as an important criterion for assessing steel cleanliness.
Conflicts of Interest
The authors declare no conflict of interest.
References
- Tervo, H.; Kaijalainen, A.; Pikkarainen, T.; Mehtonen, S.; Porter, D. Effect of impurity level and inclusions on the ductility and toughness of an ultra-high-strength steel. Mater. Sci. Eng. 2017, 697, 184–193. [Google Scholar] [CrossRef]
- Zhang, L.; Thomas, B.G. State of the art in the control of inclusions during steel ingot casting. Metall. Mater. Trans. B 2006, 37, 733–761. [Google Scholar] [CrossRef]
- Gollapalli, V.; Rao, M.B.V.; Karamched, P.S.; Borra, C.R.; Roy, G.G.; Srirangam, P. Modification of oxide inclusions in calcium treated Al-Killed high sulphur steels. Ironmak. Steelmak. 2018, 46, 663. [Google Scholar] [CrossRef]
- Zhao, D.; Li, H.; Bao, C.; Yang, J. Inclusion evolution during modification of alumina inclusions by calcium in liquid steel and deformation during hot rolling process. ISIJ Int. 2015, 55, 2115–2124. [Google Scholar] [CrossRef]
- Yang, G.; Wang, X. Inclusion evolution after calcium addition in low carbon al-killed steel with ultra low sulfur content. ISIJ Int. 2015, 55, 126–133. [Google Scholar] [CrossRef]
- Chen, G.-J.; He, S.-P.; Guo, Y.-T.; Shen, B.-Y.; Zhao, S.; Wang, Q. Optimization of Calcium addition to high-strength low-alloy steel. J. Iron Steel Res. Int. 2015, 22, 590. [Google Scholar] [CrossRef]
- Lis, T. Modification of oxygen and sulphur inclusions in steel by calcium treatment. Metalugija 2009, 48, 95. [Google Scholar]
- Pires, J.C.S.; Garcia, A. Modification of oxide inclusions present in aluminium-killed low carbon steel by addition of calcium. Rem. Rev. Esc. Minas 2004, 57, 183–189. [Google Scholar] [CrossRef]
- Holappa, L.; Hämäläinen, M.; Liukkonen, M.; Lind, M. Thermodynamic examination of inclusion modification and precipitation from calcium treatment to solidified steel. Ironmak. Steelmak. 2002, 30, 111. [Google Scholar] [CrossRef]
- Deng, Z.; Zhu, M.; Sichen, D. Effect of refractory on nonmetallic inclusions in Al-killed steel metall. Mater. Trans. B 2016, 47, 3158. [Google Scholar] [CrossRef]
- Poirier, J. A review: Influence of refractories on steel quality. Metall. Res. Technol. 2015, 112, 410. [Google Scholar] [CrossRef]
- Tehovnik, F.; Burja, J.; Arh, B.; Knap, M. Submerged entry nozzle clogging during continuous casting of Al-killed steel. Metalurgija 2015, 54, 371. [Google Scholar]
- Xu, Z.Y.; Liu, J.H.; He, Z.J.; Pang, Q.H. Study on clogging mechanism of submerged entry nozzle of steel 38CrMoAl. Metalurgija 2018, 57, 79–82. [Google Scholar]
- Zhang, L.; Thomas, B.G. State of the art in evaluation and control of steel cleanliness. ISIJ Int. 2003, 43, 271–291. [Google Scholar] [CrossRef]
- Gyakwaa, F.; Aula, M.; Alatarvas, T.; Vuolio, T.; Shu, Q.; Huttula, M.; Fabritius, T. Application of Raman spectroscopy for characterising synthetic non-metallic inclusions consisting of calcium sulphide and oxides. Appl. Sci. 2020, 10, 2113. [Google Scholar] [CrossRef]
- Gyakwaa, F.; Aula, M.; Alatarvas, T.; Vuolio, T.; Shu, Q.; Huttula, M.; Fabritius, T. Characterisation of binary phase mixtures of magnesium-aluminate spinel and calcium-aluminates using time-gated Raman spectroscopy. ISIJ Int. 2020, 60, 988–997. [Google Scholar] [CrossRef]
- Gyakwaa, F.; Aula, M.; Alatarvas, T.; Vuolio, T.; Shu, Q.; Huttula, M.; Fabritius, T. Characterisation of multiphase mixtures of calcium-aluminates and magnesium-aluminate spinel using time-gated Raman spectroscopy. Steel Res. Int. 2020, 91, 2000084. [Google Scholar] [CrossRef]
- Li, S.; Hihara, L.H. Identification of inclusions in carbon steels using micro-Raman spectroscopy. J. Raman Spectrosc. 2017, 48, 137–142. [Google Scholar] [CrossRef]
- Neuville, D.R.; Henderson, G.S.; Cormier, L.; Massiot, D. The structure of crystals, glasses, and melts along the CaO-Al2O3 join: Results from Raman, Al L- and K-edge X-ray absorption, and 27Al NMR spectroscopy. Am. Mineral. 2010, 95, 1580–1589. [Google Scholar] [CrossRef]
- Misra, A.; Bist, H.D.; Navati, M.S.; Thareja, R.K.; Narayan, J. Thin film of aluminum oxide through pulsed laser deposition: A Micro-Raman study. Mater. Sci. Eng. 2001, 79, 49–54. [Google Scholar] [CrossRef]
- Avril, C.; Malavergne, V.; Caracas, R.; Zanda, B.; Reynard, B.; Charon, E.; Bobocioiu, E.; Brunet, F.; Borensztajn, S.; Pont, S.; et al. Raman spectroscopic properties and Raman identification of CaS–MgS–MnS–FeS–Cr2FeS4 sulfides in meteorites and reduced sulfur-rich systems. Meteor. Planet. Sci. 2013, 48, 1415–1426. [Google Scholar] [CrossRef]
- Dash, S.; Sahoo, R.K.; Das, A.; Bajpai, S.; Debasish, D.; Singh, S.K. Synthesis of MgAl2O4 spinel by thermal plasma and its synergetic structural study. J. Alloys Compd. 2017, 726, 1186–1194. [Google Scholar] [CrossRef]
- Ishikawa, K.; Fujima, N.; Komura, H. First order Raman scattering in MgO microcrystals. Am. Inst. Phys. 1985, 57, 973. [Google Scholar] [CrossRef]
- Lipiäinen, T.; Pessi, J.; Movahedi, P.; Koivistoinen, J.; Kurki, L.; Tenhunen, M.; Yliruusi, J.; Juppo, A.M.; Heikkonen, J.; Pahikkala, T.; et al. Time-gated Raman spectroscopy for quantitative determination of solid-state forms of fluorescent pharmaceuticals. Anal. Chem. 2018, 90, 4832–4839. [Google Scholar] [CrossRef] [PubMed]
- Dandeu, A.; Humbert, B.; Carteret, C.; Muhr, H.; Plasari, E.; Bossoutrot, J.-M. Raman spectroscopy—A powerful tool for the quantitative determination of the composition of polymorph mixtures: Application to CaCO3 polymorph mixtures. Chem. Eng. Technol. 2006, 29, 2. [Google Scholar] [CrossRef]
- Muñoz Tabares, J.A.; Anglada, M.J. Quantitative analysis of monoclinic phase in 3Y-TZP by Raman spectroscopy. J. Am. Ceram. Soc. 2010, 93, 1790. [Google Scholar] [CrossRef]


Disclaimer/Publisher’s Note: The statements, opinions and data contained in all publications are solely those of the individual author(s) and contributor(s) and not of MDPI and/or the editor(s). MDPI and/or the editor(s) disclaim responsibility for any injury to people or property resulting from any ideas, methods, instructions or products referred to in the content. |
© 2022 by the authors. Licensee MDPI, Basel, Switzerland. This article is an open access article distributed under the terms and conditions of the Creative Commons Attribution (CC BY) license (https://creativecommons.org/licenses/by/4.0/).