Article

Quantified Approach for Evaluation of Geometry Visibility of Optical-Based Process Monitoring System for Laser Powder Bed Fusion

1
Chair for Digital Additive Production, RWTH Aachen University, Campus-Boulevard 73, 52074 Aachen, Germany
2
Foundry Institute, RWTH Aachen University, Intzestraße 5, 52072 Aachen, Germany
*
Author to whom correspondence should be addressed.
Metals 2023, 13(1), 13; https://doi.org/10.3390/met13010013
Submission received: 2 November 2022 / Revised: 14 December 2022 / Accepted: 15 December 2022 / Published: 21 December 2022

Abstract

:
The long-term sustainability of the Additive Manufacturing (AM) industry not only depends on the ability to produce parts with reproducible quality and properties to a large extent but also on the standardization of the production processes. In that regard, online process monitoring and detection of defective parts during production become inevitable. Optical-based process monitoring techniques are popular; however, most work has been mainly focused on capturing images of print abnormalities without taking other influencing factors, such as camera and part position, chamber illumination, and print geometry on the resolution of the captured images, into account. In this work, we present a scenario to evaluate and quantify the performance of an optical-based monitoring system in a Laser Powder Bed Fusion (LPBF) machine using the F1 score, considering factors such as scan vector orientation, part geometry (size) and position in a built chamber with a fixed camera position. The quantified results confirm that the F1 score can be used as a reliable means of evaluating the performance of optical-based monitoring systems in the LPBF process for the purposes of standardization. The biggest line width of the test artifact (1000 µm) had the highest F1 score range of 0.714–0.876 compared to the smallest (200 µm) with a 0.158–0.649 F1 score.

1. Introduction

The advent of Additive Manufacturing (AM) such as Laser Powder Bed Fusion (LPBF), Electron Beam Melting (EBM), and Directed Energy Deposition (DED) in recent years has undoubtedly enhanced industrial capabilities, such as the ability to build near-net shaped parts with design intricacies [1]. For complex geometries, LPBF technology is widely used in the industrial area, for example, automotive and aerospace. By using this, both material and energy resources could be saved by AM technology through shortened production processes, with the consequential benefits of carbon emissions reduction.
Despite these benefits, the LPBF process, for example, is still fraught with some challenges: lack of standards, reproducibility of process and properties of built parts [2]. For the qualification of AM parts for important industrial applications, e.g., medical, aerospace and defense, it is indispensable to develop standardized qualification tests for quality assessment. Being able to detect and eliminate defects during the print process will lead to better reproducibility of the process and, consequently, improve part properties. Therefore, in situ process sensing and monitoring is beneficial for tracing defect sources. However, an understanding of the sensoric and monitoring data is essential for a reliable evaluation.
Currently, various in situ sensing techniques such as acoustic [3,4], optical [5,6,7,8], tomographic [9,10,11], and thermal techniques [12] have been developed for LPBF systems, some of which have already been applied commercially. Among these techniques, in situ optical monitoring, which captures images in the visible spectrum before and after laser exposure of a layer, remains highly attractive, particularly for its intuitive performance by straightforward detection and ease of incorporation into commercial systems [9,10].
With real-time monitoring and inspection along the production chain, defective parts can be detected, or an entire production batch can be terminated at an earlier stage in the case of observed operational abnormalities, to save resources and boost sustainability. Craeghs et al. [7] monitored the powder bed using optical imaging and highlighted the potential danger of a damaged recoater causing defects. Yadroitsev et al. [8] utilized an on-line charge-coupled device (CCD) camera to estimate the melt pool dimensions. These applications focused mostly on qualitative analysis using images from optical systems, which, for example, have no common quantification method for image analysis. Furthermore, for the purpose of quality assurance, algorithm-based methods were applied to the monitoring images under unoptimized conditions [13] for example geometry extraction [14] and quality prediction [15].
Many factors can influence the output quality of monitoring systems, such as optical powder bed cameras, including illumination, and the accuracy of the chosen algorithm for feature extraction. As shown in Table 1, the authors of [16] utilized a consumer-grade 36.3 megapixel DSLR camera mounted inside the EOS M280 build chamber to obtain images with 7360 × 4912 pixels. The multiple flash modules were built up and distributed in four different positions. The captured pictures showed that the different contrast of pictures under different lighting options was different. The unevenness of the same pictures according to the different positions of the platform was ignored. The authors of [17] introduced a machine from the Edison Welding Institute. Pictures with 4096 × 2160 pixels were captured by an 8.8-megapixel USB Digital Camera, which was mounted directly at the top of the build platform. A microscope ring LED was installed at the right side of the top of the build. They did not perform any further analysis of influence from the illumination and different position of the platform. The algorithms based on thresholding techniques from Sauvola were selected for image segmentation. [14] equipped an embedded powder camera on an EOS M290 machine with 1280 × 1024 pixels. A low-angle side illumination source was used. Images were pre-processed after being captured to enhance the results in the segmentation steps. After that, they used active contours for segmentation by using nominal geometry as the starting boundary. Only deviations between the nominal shape and natural geometry were considered. The research was only focused on a restricted area of the platform without considering the influence of illumination. Research related to equipment optimization of monitoring systems and algorithm improvement in this area is not limited to those mentioned above. A large amount of data have been generated from different studies, but so far there is no standard to evaluate the quality of the different monitoring systems with different settings.
In this study, we present a quantification method for optical monitoring system performance using a self-designed test specimen. The size, location on the building platform of the specimen and scan vector orientations of the laser path are considered in the presented method. According to the research of the authors, this is the first study where the homogeneity of the monitoring image of the optical system is considered and quantified. The experiment was designed and applied to an EOS M290 LPBF machine with an integrated camera (see Section 2.1) using Sandvik 17-4ph powder under the standard laser configuration, which can be extended to other machines, materials, and laser configurations. The visibility of the printed parts is computed by comparing the extracted contour of the monitoring image and sliced design geometry using the F1 score (see Section 2.3). The results show the quantified difference of distinguishability, which can be used for evaluating different optical monitoring systems and provide further guidance for optical system optimization.

2. Materials and Methods

In this section, the optical-based monitoring system setup with calibration is introduced at first, while details of designed test specimen and job orientation are described in the next step. The contour extraction and evaluation method are discussed at the end of the section.

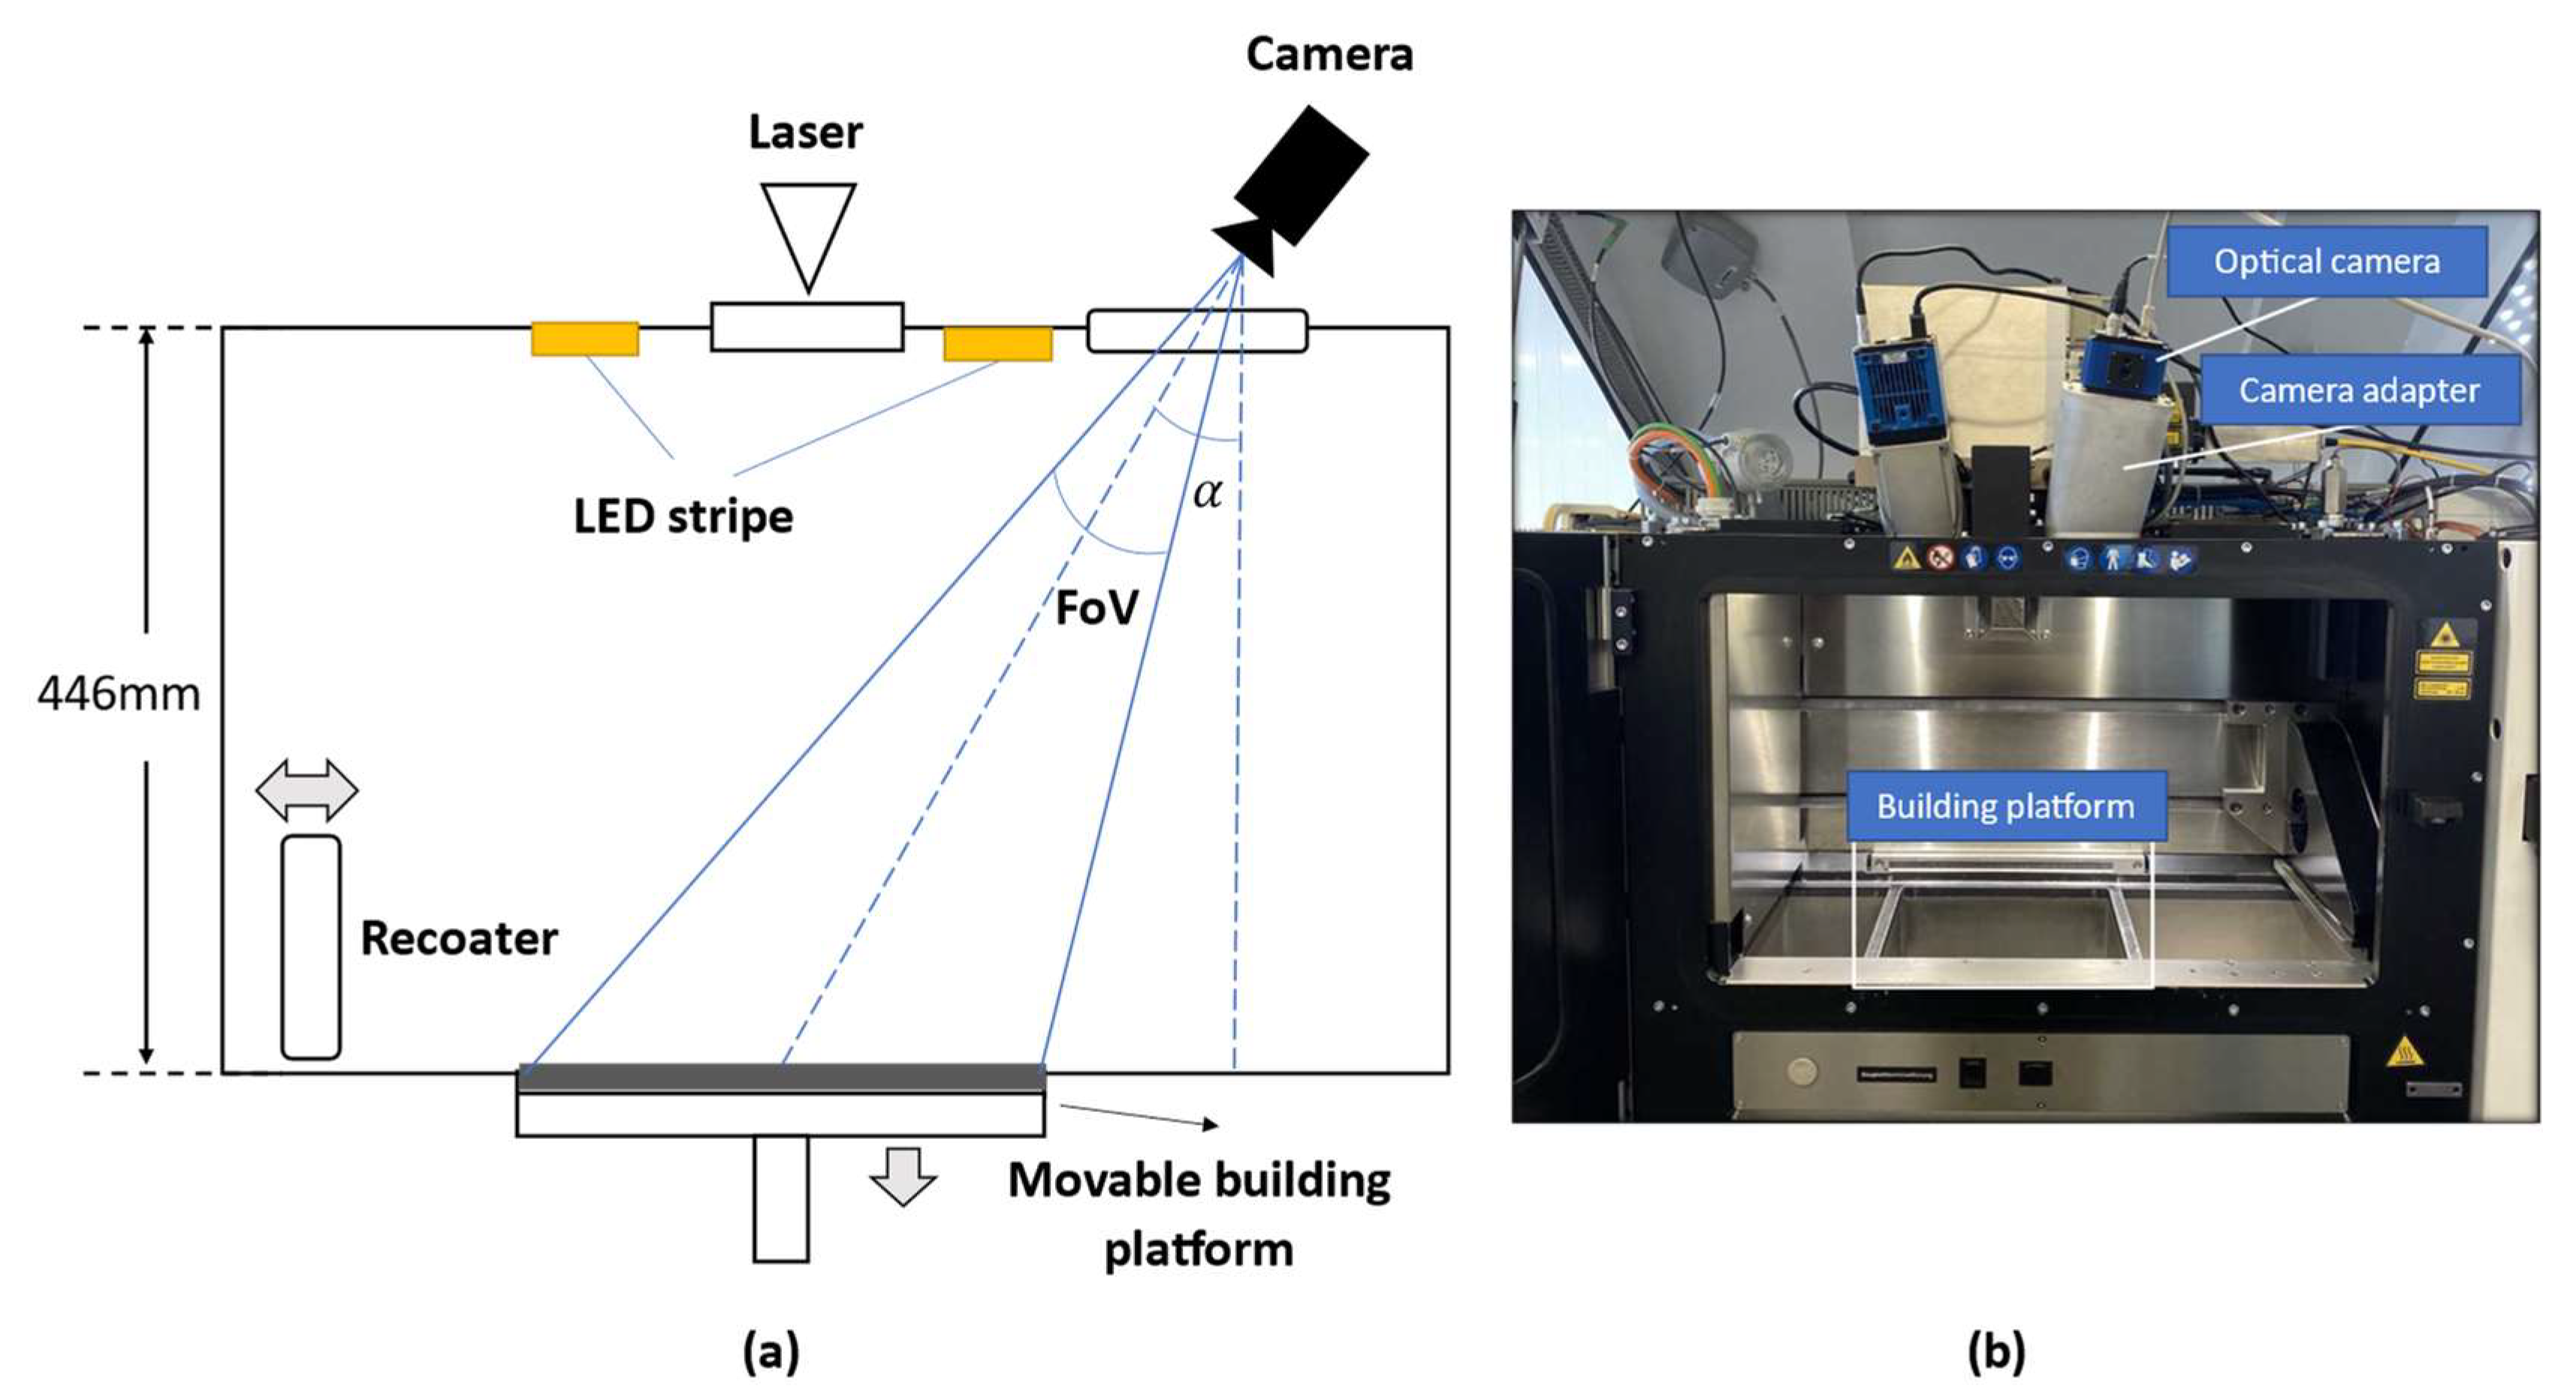
2.1. Optical Camera System Setup

The studies were conducted using the EOS M 290 laser powder bed fusion system (EOS GmbH, Krailling, Germany). The imaging system is composed of a monochrome 29-megapixel CCD and a lens (Nikon AF-S DX NIKKOR 18–55 mm F3.5–5.6 G VR 52 mm). The properties of the camera are shown in Table 2.
The camera is equipped with a zoom lens and integrated on the top of the LPBF machine, where there is a circular observation window sealed by laser protective glass (in Figure 1). Since the laser module is in the center of the process chamber, camera is placed towards the center of building platform with an angle of α = 19°. The camera with the zoom lens is supported by a metal support that is fixed by screws on the top of the machine. The focal length of the zoom lens used in the experiments is 45 mm, through which the field of view (FoV) with 400 mm × 270 mm can cover the whole building platform. As a baseline, the monitoring images are captured by the original illumination system of EOS M290 with two LED stripes on the top. For every layer, a single powder bed image is captured after laser exposure.

2.2. Calibration

There are different influencing factors in the setup that decrease the quality of the captured images, such as sensor noise or distortion due to the mounting angle of the camera. However, since they are systematic and known, they can be removed or reduced by calibration. Therefore, after obtaining images from the camera, the raw data were calibrated by dark frame subtraction, flat-field correction, and perspective correction. For dark frame correction, 50 dark frame images were captured at 1500 ms exposure time and their median was calculated to remove static sensor noise by subtracting the resulting dark frame from all following images. To correct uneven illumination of the build plate, dust on the sensor, lens vignetting and other constant and unwanted image attenuation, a flat field correction by [18] was performed on all images. Since the camera is not able to be placed directly towards the building platform, to compensate for the perspective distortion present in the images perspective correction [19] was performed. The calibrated images had the resolution of 4180 × 4180 pixels for covering 250 mm × 250 mm building platform, where the spatial resolution was calculated as:
250 mm 4180   pixel = 0.0598   mm / pixel .

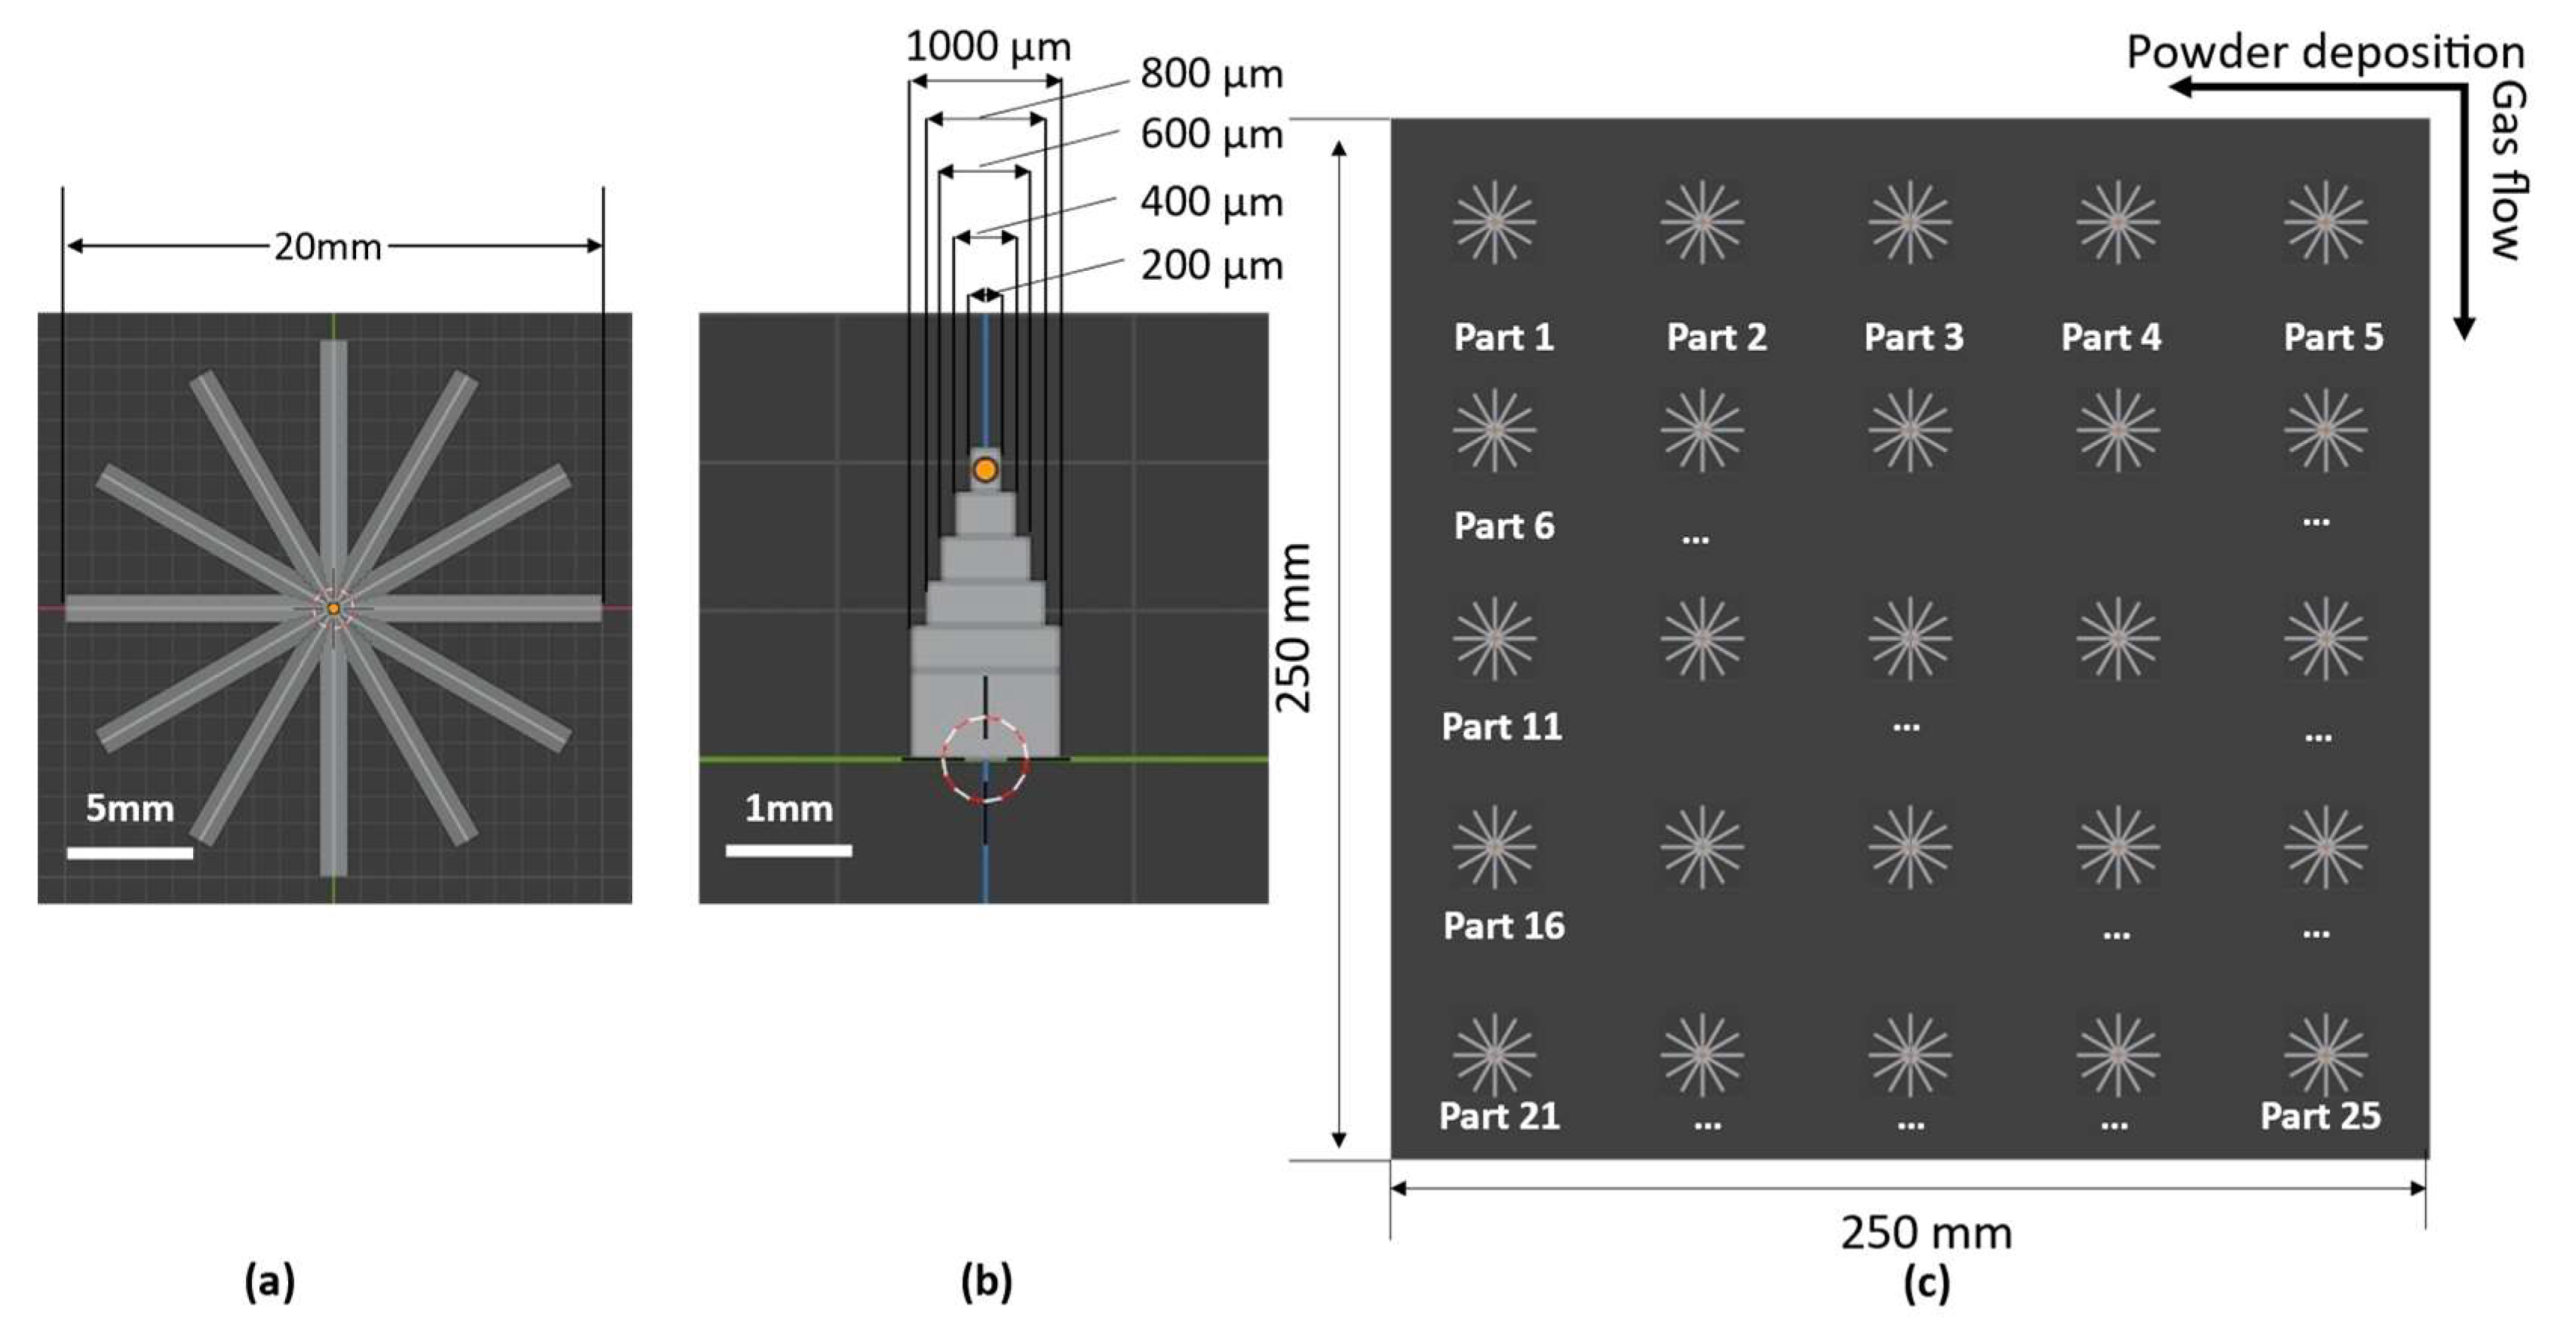
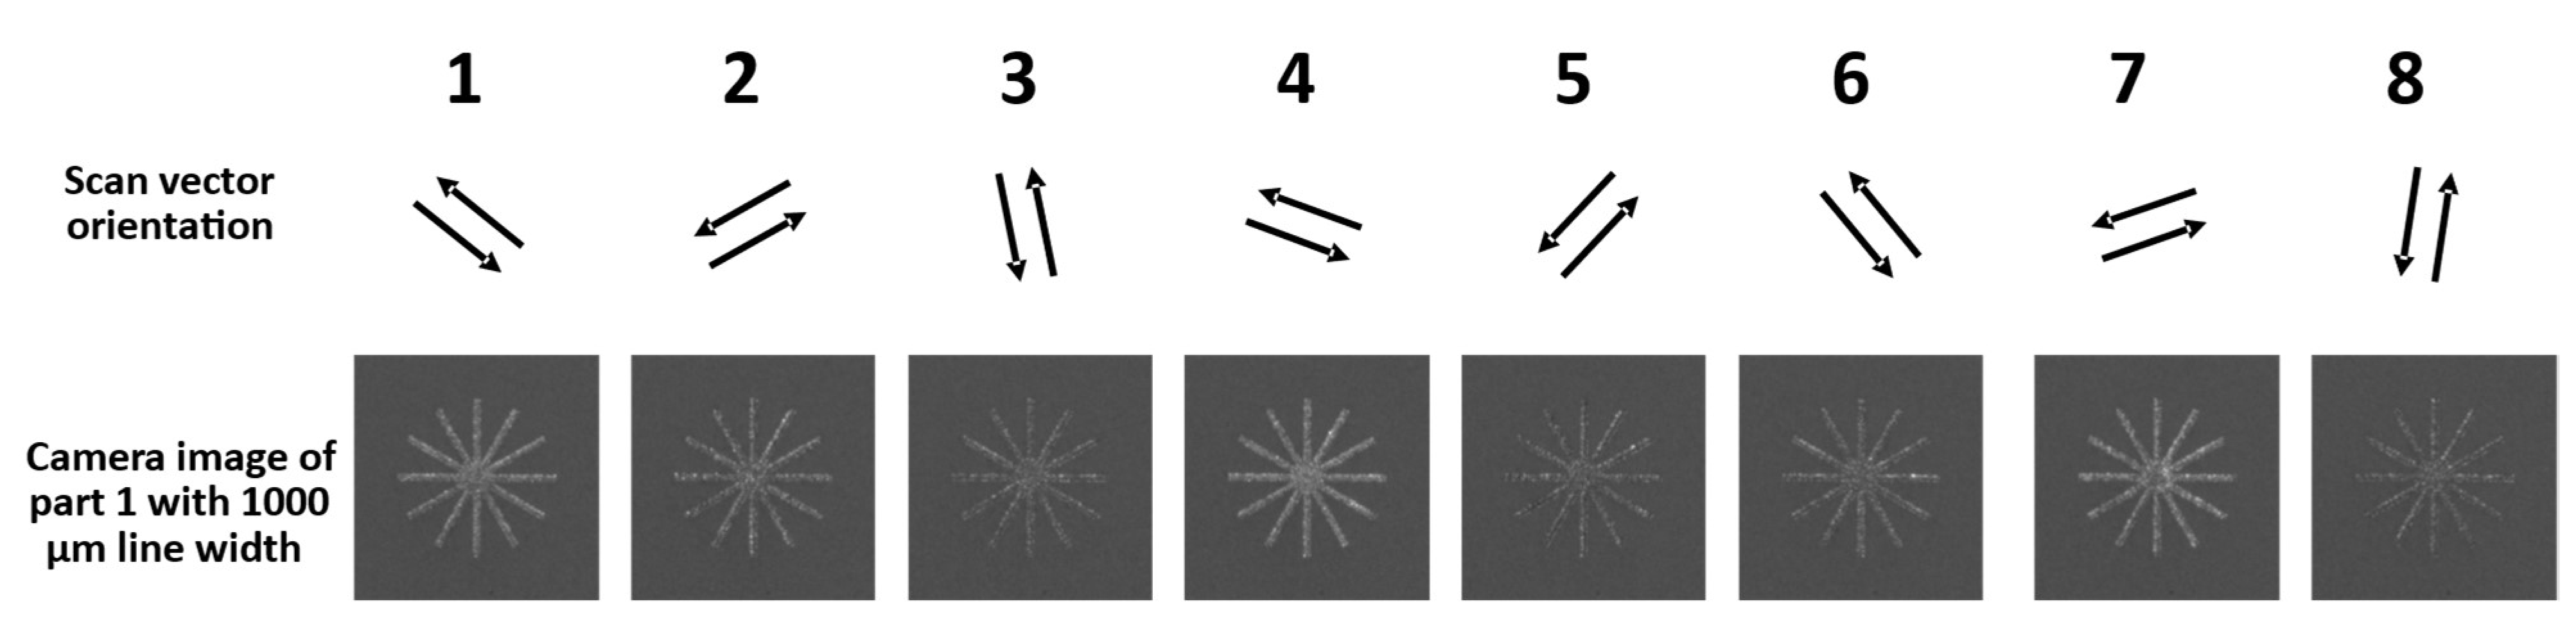
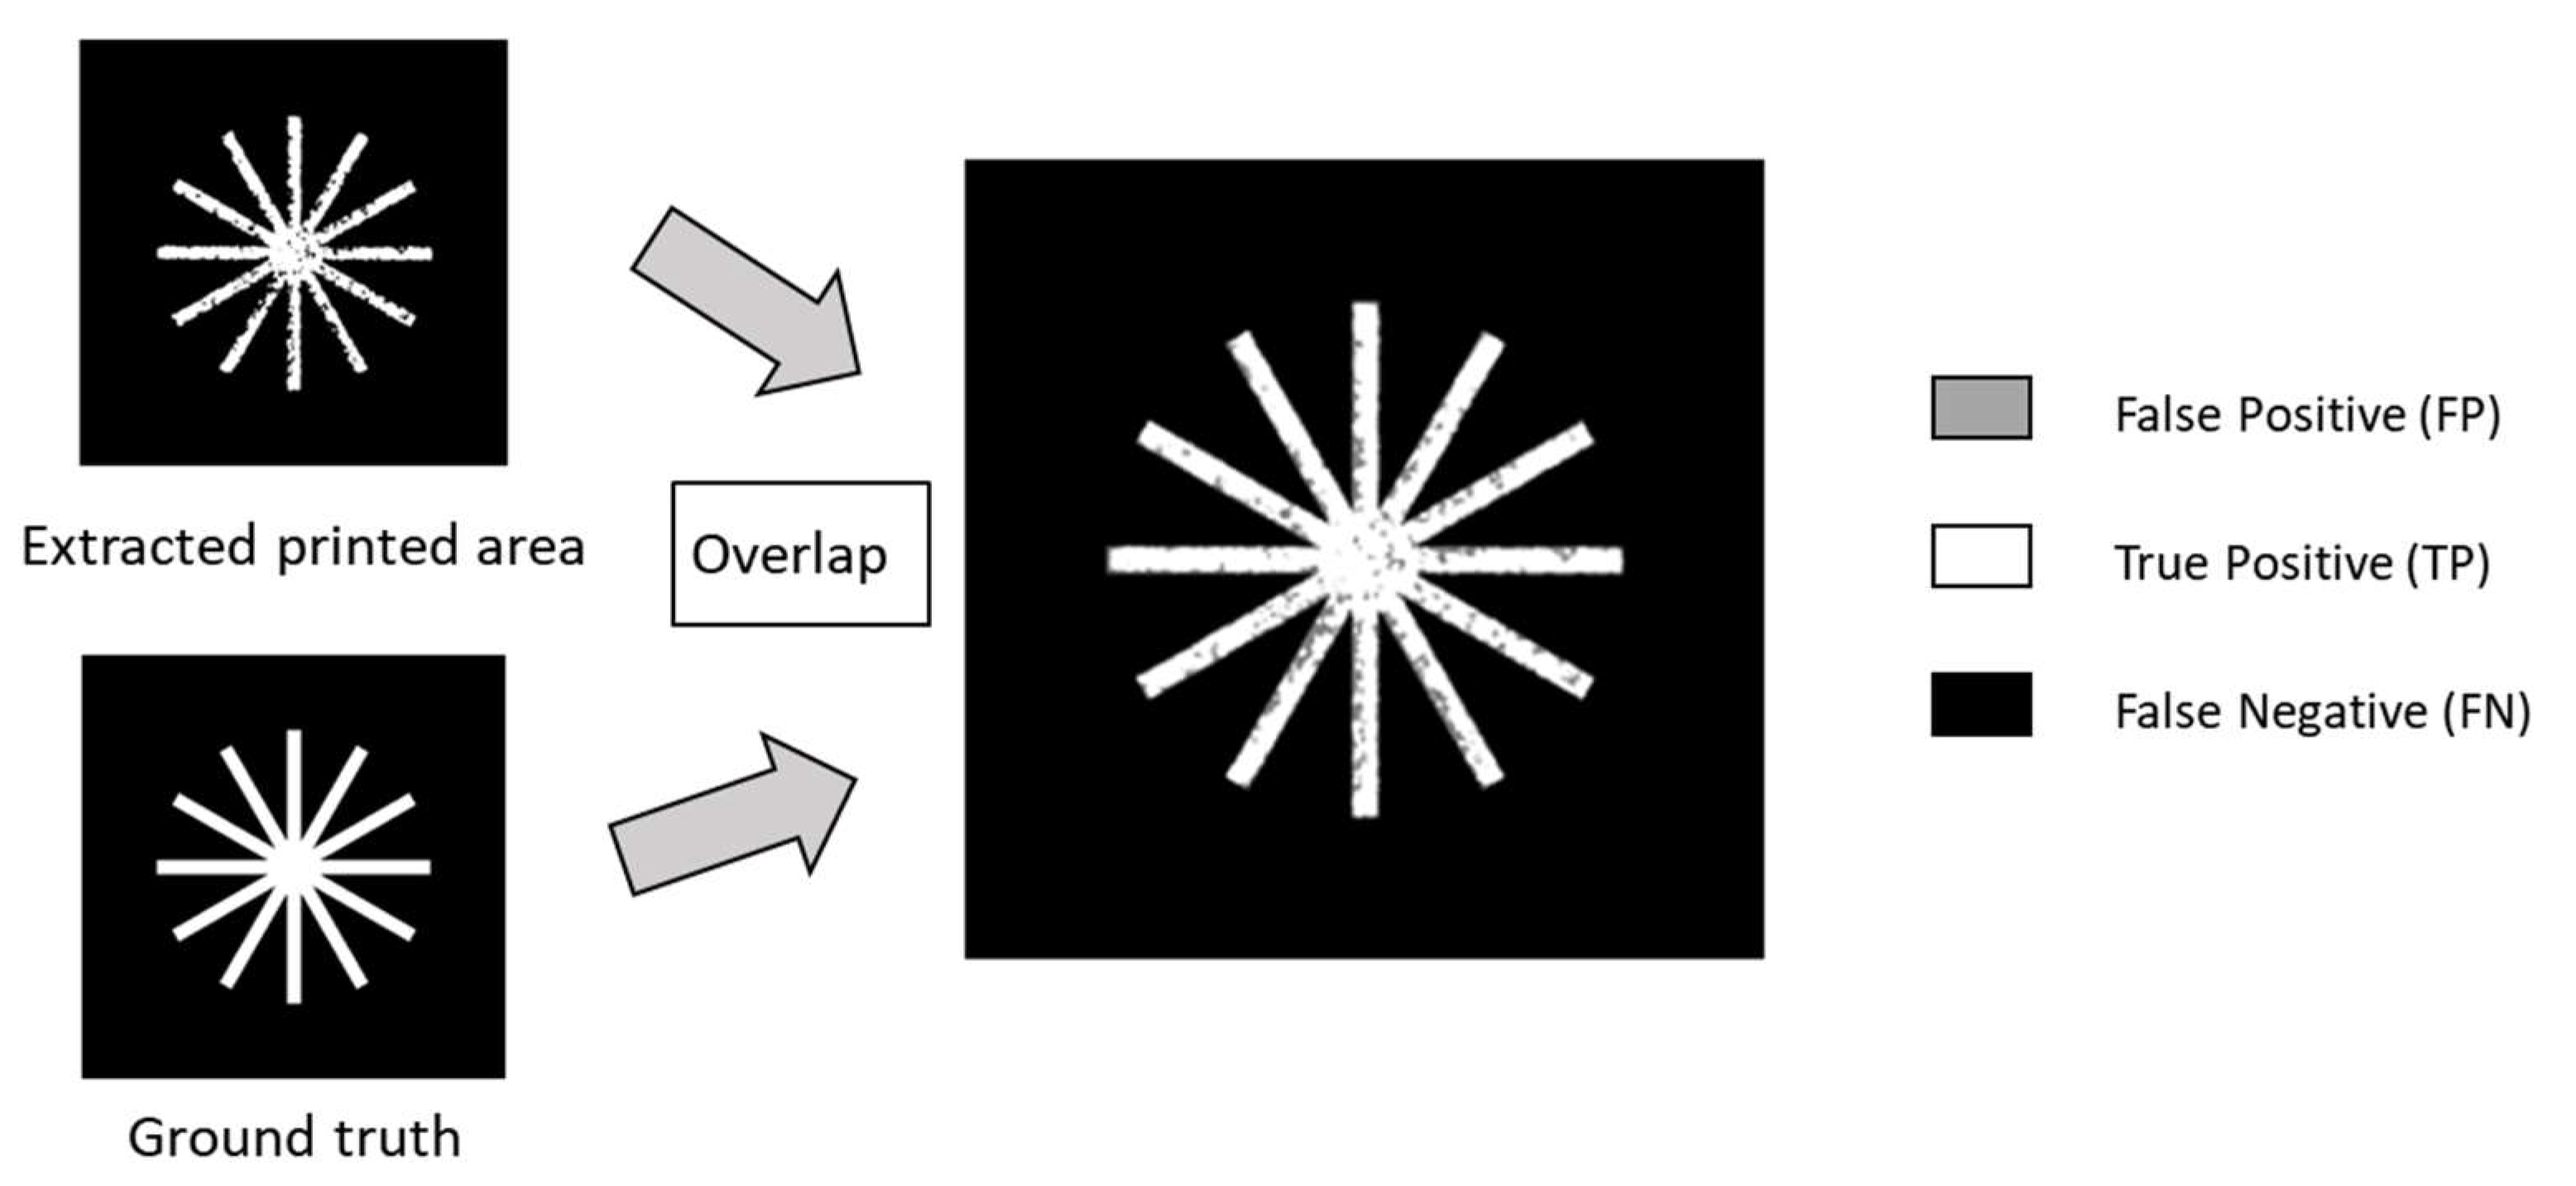
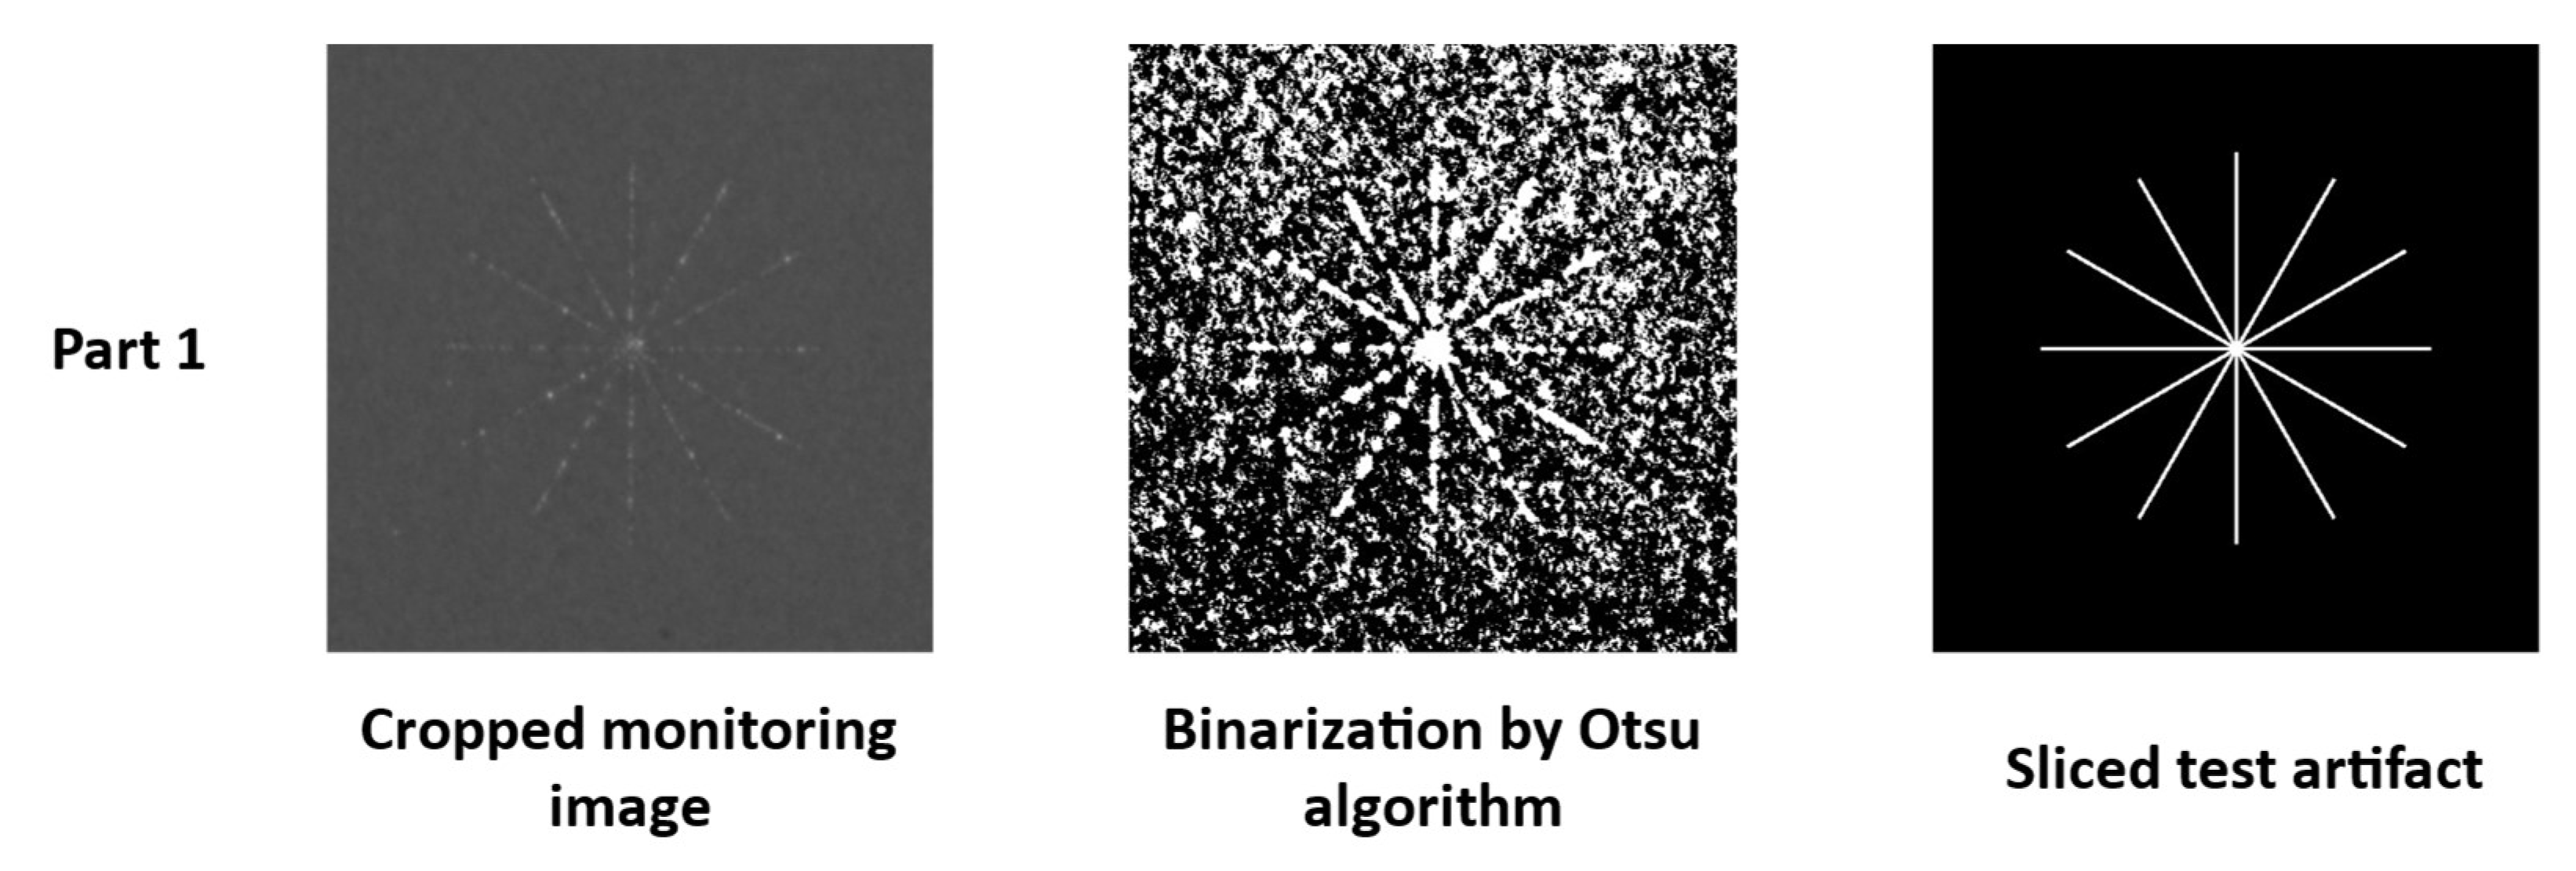
2.3. Experimental Design and Evaluation Method

Since the goal of designed geometry for the experiment is to evaluate process monitoring images, the manufacturing process should be stable and under the capability of LPBF machine. Thus, a rectangular shape with varied line width is selected. Furthermore, considering the complex inner illumination conditions, monitoring images with different orientations of the parts should be evaluated. The information on orientation should be contained in the test geometry. In this regard, a star-shaped test geometry was designed as shown in Figure 2a,b. To cover the whole building platform, 25 parts were distributed evenly on the 250 × 250 mm2 area (in Figure 2c). For each branch, line widths were divided into 5 sizes of 200 µm, 400 µm, 600 µm, 800 µm, and 1000 µm, respectively, with a height of 3 mm, where a 200 µm line width can be stably printed according to the instruction of LPBF machine.
The parts were manufactured using Sandvik 17-4ph powder with particle size range 1–20 µm. The laser parameters used are shown in Table 3, below. The laser configuration was selected from previous experiments and optimized for the used material. According to data preparation, 8 scan vector orientations were applied during the print job with 67.5-degree intervals. The camera images of part 1 (in Figure 3) show different scan vectors can influence the performance of monitoring results with higher or lower gray value on the printed area.
Captured monitoring images were cropped partwise according to the center position of parts to evaluate the location dependency. Every cropped part had a resolution of 512 × 512 pixels, which includes the laser-exposed part in the center and powder bed surroundings (in Figure 4).
The captured images consist of gray-level pixels from which the part geometry needs to be extracted. This extraction is a segmentation task that classifies a pixel either as part or powder bed. In image processing, this task is referred to as binarization and creates a bi-level document separating the image into two classes [20]. In this paper, the printed geometry of each layer was extracted by Otsu binarization algorithm [21], which is an unsupervised method for automatic global threshold selection to maximize the separability of the resultant classes in gray value according to the histogram of images. After the calculation of the threshold, the image is binarized accordingly, and printed geometry is set to 1 (white) and powder bed to 0 (black).
The cropped images were binarized accordingly and compared to reference geometry (in Figure 4), which was sliced by Trimesh library [22]. The performance of geometry extraction was evaluated by F1 measurement using:
F 1 = 2 × precision × recall precision + recall
precision = TP TP + FP
recall = TP TP + FN
where TP refers to true positive to represent the correct extraction of printed part geometry, FP is false positive to represent incorrect extraction of printed part geometry and FN is false negative to represent incorrect extraction of powder bed. The F1 score is calculated pixel-wise (shown in Figure 5).

3. Results and Discussions

The averaged F1 score for each part of the 10-layer images with different line widths is shown in Figure 6. The results show that the parts with higher line width can be extracted from the powder bed with a higher F1 score while the locations of the printed part can influence their F1 scores. The parts on the very left column, namely parts 1, 6, 11, 16, and 21, have lower F1 scores than the parts on the right in identical rows (in Table 4). The parts near the right bottom corner have higher F1 scores than the rest. Since the position of the camera was fixed, the parts near the focus point have higher F1 scores. This means these parts are easier to distinguish from the powder.
Furthermore, for the parts with 200 µm line width in the left top corner, binarization can fail due to the low contrast between the exposed part and powder, which leads to a low F1 score. The failed binarization is shown in Figure 7. Considering the position of the part, failure occurred on the left upper parts, namely parts 1, 2, 3, and 6.
Considering the varied scan vector orientations, F1 scores of geometry extraction can be influenced due to the complex illumination conditions. The average F1 score of parts with different scan vector orientations is shown in Figure 8a. The results show that the scan vector orientation can influence the geometry extraction. In some conditions, the exposed area can be darker (Figure 8b, scan vector orientation 4 and 6), which reduces the contrast between the printed parts and powder, which consequently makes the geometry extraction harder.
The optical-based powder bed camera system has been used for some time in the additive manufacturing industry. Most of the applications talked about qualitative analysis of acquired monitoring data. Regarding quantitative analysis, factors, which can influence the process monitoring results, need to be considered as well. Our results confirmed that the optical-based monitoring data are influenced not only by the size of the designed part, but also by the location and laser scanning strategy. The complex illumination conditions inside the process chamber, the position of the part and camera, as well as the scan vector orientation can influence the quantum signal captured by the optical camera. According to the experimental results, under the current configuration, the parts on the right sides performed with higher F1 scores. Thus, under this machine and monitoring configuration, the parts, which are of high monitoring priority, can be placed in the right corner during the job preparation. Conversely, illumination conditions inside the process chamber can be optimized based on a new setup which will require optimized illumination conditions in the top left corner. For example, for the current evaluation result, the maximum F1 score difference is 0.7794 (bottom right) − 0.5717 (upper left) = 0.2077. To increase the homogeneity of the optical monitoring system, an additional light source can be added at the left side of the build chamber to create light reflection from the part, which can emphasize the contrast between the exposed area and powder.
Compared to the existing studies, most of the test geometries and their quantification approaches in the research are designed to evaluate the performance of AM machines. Using some critical geometries, such as thin walls and overhang angle, the boundary conditions of capability of the machines can be derived. However, these geometries are not transferable for the goal of evaluation of process monitoring, as the process can be unstable.

4. Conclusions

In this study, a designed test specimen is introduced to evaluate the performance of an optical-based monitoring system. According to the experimental results, the visibility of the printed part via the monitoring system can be influenced by the part size, location on the building platform, and laser scanning strategy. By using the Otsu binarization method, visibility can be plausibly quantified using the F1 score. Using these quantified values, the method can be used as a reference value for optical monitoring systems using other hardware on different machines to quantify the performance of optical monitoring systems. Under different demands of use in the case of monitoring systems, the proper systems can be selected for the goals, for example, high geometry extraction or high homogeneity of monitoring images. From the authors’ perspective, it is the first time that an evaluation method focuses on the process monitoring setup.
Furthermore, the proposed method considered only geometry extraction between the exposed areas and powder bed. Since surface morphology on the exposed areas can contain information about the process quality as well, this information is ignored under this method. In the future, an improved quantification method should be developed to involve the surface morphology in the monitoring images.

Author Contributions

Conceptualization, S.Z. and F.A.-K.; Data curation, S.Z. and H.W.; Formal analysis, F.A.-K., H.W. and M.K.; Funding acquisition, J.H.S. and A.B.-P.; Investigation, H.W.; Methodology, S.Z., F.A.-K. and H.W.; Project administration, M.K., I.R., J.H.S. and A.B.-P.; Resources, J.H.S. and A.B.-P.; Software, S.Z. and H.W.; Supervision, I.R.; Validation, S.Z., M.K. and I.R.; Visualization, H.W.; Writing—original draft, S.Z. and F.A.-K.; Writing—review & editing, M.K., I.R., J.H.S. and A.B.-P. All authors have read and agreed to the published version of the manuscript.

Funding

Funded by the Deutsche Forschungsgemeinschaft (DFG, German Research Foundation) under Germany’s Excellence Strategy—EXC-2023 Internet of Production—390621612.

Institutional Review Board Statement

Not applicable.

Informed Consent Statement

Not applicable.

Data Availability Statement

The data presented in this study are available on request from the corresponding author. The raw/processed data needed to reproduce these findings cannot be shared publicly at this time, as they are also part of ongoing study.

Conflicts of Interest

The authors declare no conflict of interest.

References

  1. Raffeis, I.; Adjei-Kyeremeh, F.; Vroomen, U.; Suwanpinij, P.; Ewald, S.; Bührig-Polazcek, A. Investigation of the Lithium-Containing Aluminum Copper Alloy (AA2099) for the Laser Powder Bed Fusion Process [L-PBF]: Effects of Process Parameters on Cracks, Porosity, and Microhardness. JOM 2019, 71, 1543–1553. [Google Scholar] [CrossRef]
  2. Charalampous, P.; Kostavelis, I.; Tzovaras, D. Non-destructive quality control methods in additive manufacturing: A survey. Rapid Prototyp. J. 2020, 26, 777–790. [Google Scholar] [CrossRef]
  3. Smith, R.J.; Hirsch, M.; Patel, R.; Li, W.; Clare, A.T.; Sharples, S.D. Spatially resolved acoustic spectroscopy for selective laser melting. J. Mater. Process. Technol. 2016, 236, 93–102. [Google Scholar] [CrossRef]
  4. Shevchik, S.A.; Kenel, C.; Leinenbach, C.; Wasmer, K. Acoustic emission for in situ quality monitoring in additive manufacturing using spectral convolutional neural networks. Addit. Manuf. 2018, 21, 598–604. [Google Scholar] [CrossRef]
  5. Colosimo, B.M.; Garghetti, F.; Pagani, L.; Grasso, M. A novel method for in-process inspection of lattice structures via in-situ layerwise imaging. Manuf. Lett. 2022, 32, 67–72. [Google Scholar] [CrossRef]
  6. Fischer, F.G.; Birk, N.; Rooney, L.; Jauer, L.; Schleifenbaum, J.H. Optical process monitoring in Laser Powder Bed Fusion using a recoater-based line camera. Addit. Manuf. 2021, 47, 102218. [Google Scholar] [CrossRef]
  7. Craeghs, T.; Clijsters, S.; Yasa, E.; Kruth, J.-P. Online Quality Control of Selective Laser Melting; University of Texas at Austin: Austin, TX, USA, 2011. [Google Scholar] [CrossRef]
  8. Yadroitsev, I.; Krakhmalev, P.; Yadroitsava, I. Selective laser melting of Ti6Al4V alloy for biomedical applications: Temperature monitoring and microstructural evolution. J. Alloy. Compd. 2014, 583, 404–409. [Google Scholar] [CrossRef]
  9. Zenzinger, G.; Bamberg, J.; Ladewig, A.; Hess, T.; Henkel, B.; Satzger, W. Process Monitoring of additive Manufacturing by Using Optical Tomography; AIP Publishing LLC: Melville, NY, USA, 2015; pp. 164–170. [Google Scholar] [CrossRef] [Green Version]
  10. Du Plessis, A.; Yadroitsev, I.; Yadroitsava, I.; Le Roux, S.G. X-Ray Microcomputed Tomography in Additive Manufacturing: A Review of the Current Technology and Applications. 3D Print. Addit. Manuf. 2018, 5, 227–247. [Google Scholar] [CrossRef]
  11. Du Plessis, A.; Yadroitsava, I.; Yadroitsev, I. Effects of defects on mechanical properties in metal additive manufacturing: A review focusing on X-ray tomography insights. Mater. Des. 2020, 187, 108385. [Google Scholar] [CrossRef]
  12. Smurov, I.; Doubenskaia, M. Temperature Monitoring by Optical Methods in Laser Processing. In Laser-Assisted Fabrication of Materials; Majumdar, J.D., Manna, I., Eds.; Springer Series in Materials Science; Springer: Berlin/Heidelberg, Germany, 2013; pp. 375–422. [Google Scholar] [CrossRef]
  13. Grasso, M.; Remani, A.; Dickins, A.; Colosimo, B.M.; Leach, R.K. In-situ measurement and monitoring methods for metal powder bed fusion: An updated review. Meas. Sci. Technol. 2021, 32, 112001. [Google Scholar] [CrossRef]
  14. Pagani, L.; Grasso, M.; Scott, P.J.; Colosimo, B.M. Automated layerwise detection of geometrical distortions in laser powder bed fusion. Addit. Manuf. 2020, 36, 101435. [Google Scholar] [CrossRef]
  15. Wang, P.; Yang, Y.; Moghaddam, N.S. Process modeling in laser powder bed fusion towards defect detection and quality control via machine learning: The state-of-the-art and research challenges. J. Manuf. Process. 2022, 73, 961–984. [Google Scholar] [CrossRef]
  16. Foster, B.K.; Reutzel, E.W.; Nassar, A.R.; Hall, B.T.; Brown, S.W.; Dickman, C.J. Optical, Layerwise Monitoring of Powder Bed Fusion; University of Texas at Austin: Austin, TX, USA, 2015. [Google Scholar]
  17. Aminzadeh, M.; Kurfess, T.R. Online quality inspection using Bayesian classification in powder-bed additive manufacturing from high-resolution visual camera images. J. Intell. Manuf. 2019, 30, 2505–2523. [Google Scholar] [CrossRef]
  18. Seibert, J.A.; Boone, J.M.; Lindfors, K.K. Flat-field correction technique for digital detectors. In Medical Imaging 1998: Physics of Medical Imaging; Dobbins, J.T., III, Boone, J.M., Eds.; SPIE: Bellingham, WA, USA, 1998; p. 348. [Google Scholar] [CrossRef]
  19. Jagannathan, L.; Jawahar, C.V. Perspective correction methods for camera based document analysis. In Proc. First Int. Workshop on Camera-based Document Analysis and Recognition; International Institute of Information Technology: Hyderabad, India, 2005. [Google Scholar]
  20. Jyotsna; Chauhan, S.; Sharma, E.; Doegar, A. Binarization techniques for degraded document images—A review. In Proceedings of the 2016 5th International Conference on Reliability, Infocom Technologies and Optimization (Trends and Future Directions) (ICRITO), Noida, India, 7–9 September 2016. [Google Scholar] [CrossRef]
  21. Otsu, N. A Threshold Selection Method from Gray-Level Histograms. IEEE Trans. Syst. Man, Cybern. 1979, 9, 62–66. [Google Scholar] [CrossRef]
  22. Dawson-Haggerty, M. Trimesh [Computer software], 2019. Available online: https://trimsh.org/ (accessed on 10 October 2022).
Figure 1. (a) Illustration of in situ monitoring system integration; (b) Experiment setup.
Metals 13 00013 g001
Figure 2. Test geometry in (a) top view, (b) front view, and (c) orientation on the building platform.
Metals 13 00013 g002
Figure 3. Different scan vector orientations and corresponding optical camera images.
Metals 13 00013 g003
Figure 4. Cropped monitoring images with different line widths.
Metals 13 00013 g004
Figure 5. Calculation scenario of F1 measurement.
Metals 13 00013 g005
Figure 6. Average F1 score of different parts and line widths.
Metals 13 00013 g006
Figure 7. Binarization failure of part 1 with 200 µm line width.
Metals 13 00013 g007
Figure 8. (a) F1 score with different scan vector orientations; (b) Monitoring images of part 2 with different scan vector orientations and their binarization.
Metals 13 00013 g008
Table 1. Research setups using optical powder bed cameras.
ResearchLPBF SystemResolution of CameraIllumination SetupApproach
[16]EOS M2807360 × 4912 pixelsMultiple flash modulesN/A
[17]Machine of Edison Welding Institute4096 × 2160 pixelsMicroscope ring LEDSauvola thresholding
[14]EOS M2901280 × 1024 pixelsLow-angle side illumination sourceActive contour segmentation
Table 2. Hardware properties of monitoring system.
ItemValue
Type of sensorMonochrome Charge-coupled Device (CCD)
Sensor size36 mm × 24 mm
Pixel size5.5 µm × 5.5 µm
Bit depth8 bits
Resolution6576 × 4384 (29 Megapixels)
Exposure time1.5 s
Table 3. Laser parameter for experiment.
Laser Beam Diameter ds [µm]Scan Velocity vs [mm/s]Layer Height Ds [µm]Laser Power PL [W]Hatching Distance ∆ys [µm]Volume Energy Ev [J/mm3]
75800301208062.5
Table 4. Average F1 score of different parts (in Figure 3) with all line widths.
F1 ScoreColumn 1Column 2Column 3Column 4Column 5
Row 10.57170.59380.70340.71730.6943
Row 20.60160.71220.74710.77030.7466
Row 30.64530.71780.76450.74810.7528
Row 40.67570.71810.73930.76240.7715
Row 50.67090.72560.75730.76500.7794
Disclaimer/Publisher’s Note: The statements, opinions and data contained in all publications are solely those of the individual author(s) and contributor(s) and not of MDPI and/or the editor(s). MDPI and/or the editor(s) disclaim responsibility for any injury to people or property resulting from any ideas, methods, instructions or products referred to in the content.

