Article

Evaluation of Flux Basicity Concept Geared toward Estimation for Oxygen Content in Submerged Arc Welded Metal

1
School of Mechanical and Electrical Engineering, Suqian University, Suqian 223800, China
2
School of Metallurgy, Northeastern University, Shenyang 110819, China
*
Author to whom correspondence should be addressed.
Metals 2022, 12(9), 1530; https://doi.org/10.3390/met12091530
Submission received: 12 August 2022 / Revised: 8 September 2022 / Accepted: 13 September 2022 / Published: 16 September 2022
(This article belongs to the Section Welding and Joining)

Abstract

:
The present study has been undertaken to evaluate the basicity concept of oxygen content estimation subject to submerged arc welded metal. The investigated fluxes cover a wide range of basicity indices from 0.31 to 19.00 at full coverage with acidic, neutral, and basic fluxes. The oxygen content of the submerged arc welded metal (flux oxygen potential) is predicted by employing traditional flux basicity index models and the CALPHAD technique (gas–slag–metal equilibrium model). It is revealed that the gas–slag–metal equilibrium model in this study is capable of remedying the shortcomings of the basicity index models with respect to predicting the oxygen potentials of the fluxes with CaF2, CaO, SiO2, MnO, and FeO as major components. This study may provide a vital way to address technical difficulties in flux design. Based on the measured and thermodynamic data, thermodynamic parameters pertinent to flux oxygen potential have been systematically assessed.

1. Introduction

Submerged arc welding (SAW), during which the arc plasma and weld pool are shielded beneath the flux granular and molten slag, is one of the most widely applied welding techniques [1]. Flux serves essential functions in the SAW process, including atmospheric protection, arc stabilization, fine-tuning weld metal (WM) composition, etc. [2]. Due to chemical reactions between arc plasma, flux(slag), and weld pool, the flux essentially affects the composition of the submerged arc welded metal [3,4,5].
O is the most essential element dictating WM mechanical properties [6,7]. Excessive oxygen levels may incur unexpected issues, such as enhanced porosity, reduced toughness, and depreciated hardenability, whereas WM with oxygen levels that are too low shows poor impact toughness, since there are insufficient inclusions to promote the formation of acicular ferrite [8,9]. Additionally, the oxygen content in the WM essentially controls the transfer behaviors of alloying elements, which dictates the mechanical properties of the weldment [6,7]. Therefore, the content of the oxygen content in SAW is of great importance to ensure the quality of the overall submerged arc welded metal.
In the presence of the plasma during the SAW process, oxides in flux tend to decompose, release O2, and improve the oxygen level in the weld pool [10,11]. It is well known that welding flux is the primary source of oxygen transfer to the WM [7,12]. In welding metallurgy, the concept of flux oxygen potential has been employed to describe the driving force for oxygen transfer from the flux (slag) to the WM [3,13,14,15].
Due to the incomplete understanding of flux thermodynamic properties, the prediction of oxygen levels in submerged arc welded metal relied on empirical ideas drawn from steelmaking [2,16]. Tuliani et al. [17] have proposed a basicity index (BI), namely Tuliani BI, as is demonstrated in Equation (1) (wt pct), to identify flux oxygen potential.
B I = CaO + CaF 2 + MgO + Na 2 O + K 2 O + 0.5 × ( MnO + FeO ) SiO 2 + 1 / 2 ( Al 2 O 3 + Cr 2 O 3 + TiO 2 + ZrO 2 )
The oxygen-free compound contained in flux is CaF2. The basic oxides include CaO, CaF2, MgO, Na2O, K2O, MnO, and FeO, and the acid oxides include SiO2, Al2O3, Cr2O3, TiO2, and ZrO2.
Eagar [6], on the other hand, assumed that CaF2 only acts as a dilutant rather than an active species, and declared that CaF2 should be removed from Equation (1). Then, the Eagar BI is proposed as Equation (2) [6]. Based on the value BI, fluxes can be classified into three categories: acidic (BI < 1.0), neutral (1 ≤ BI < 1.2), and basic (BI ≥ 1.2) [13].
B I = CaO + MgO + Na 2 O + K 2 O + 0.5 × ( MnO + FeO ) SiO 2 + 1 / 2 ( Al 2 O 3 + Cr 2 O 3 + TiO 2 + ZrO 2 )
Tuliania et al. [17] and Eagar [6] have regressed the tendencies of the WM oxygen level (oxygen content in the submerged arc welded metal) as a function of flux BI, as shown in Figure 1, from which the WM oxygen could be predicted. Generally, the predicted oxygen content decreases with increasing BI and then reaches a constant.
However, Palm et al. [18] pointed out that there is no fundamental basis for the correlation between BI and flux oxygen potential. For example:
  • Some basic oxides, such as FeO and MnO, possess high oxygen potentials, whereas CaO does not, indicating that BI may identify flux oxygen potential inaccurately.
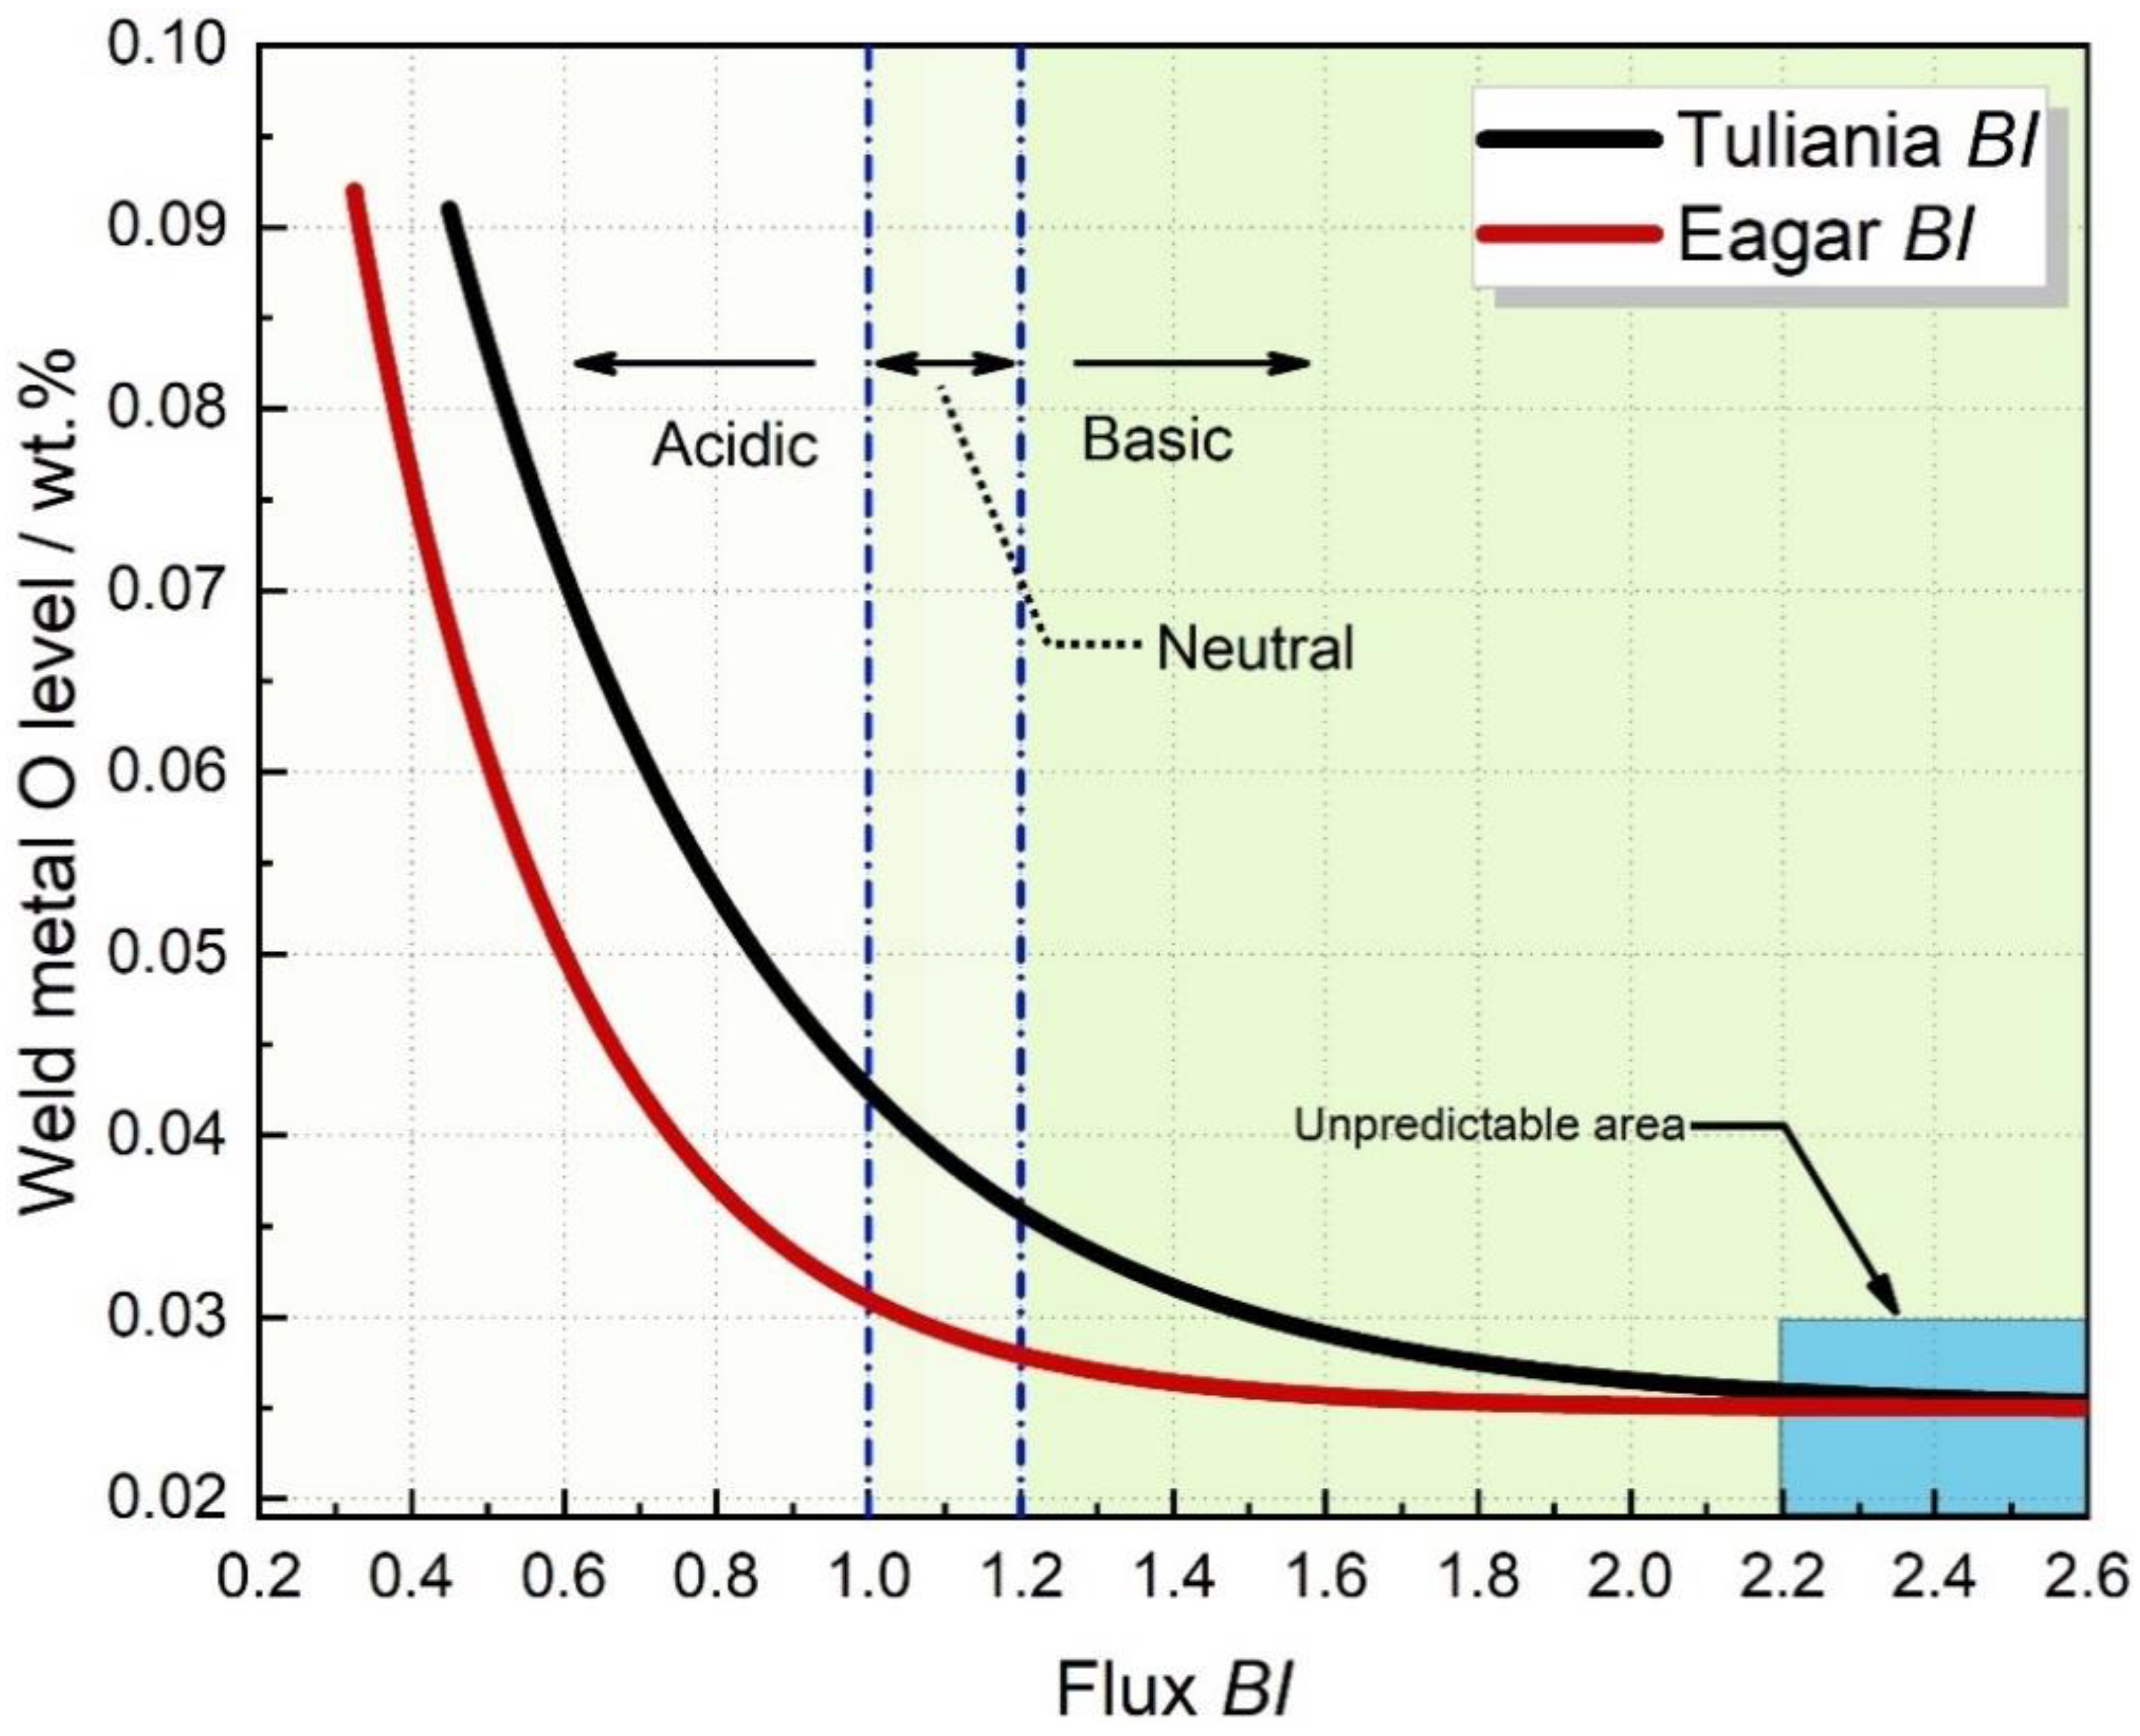
  • When BI is higher than 2.2, the predicted oxygen content will hold constant. In other words, the BI models would be invalid in differentiating flux oxygen potential when BI is higher than 2.5 (see the blue shaded area in Figure 1).
  • It is still questionable whether CaF2 should be incorporated into the BI formula.
Tremendous efforts have been exercised to investigate the parameter governing the flux oxygen potential. For instance, Lau et al. [7,12] evaluated the source of oxygen when CaO-Al2O3-based fluxes were applied; they postulated that the level of pO2 (partial pressure of O2 in the arc plasma) deriving from oxide decomposition controlled the level of flux oxygen potential. Indacochea et al. [19] performed SAW by using FeO-MnO-SiO2 fluxes and analyzed the chemical reactions. They assumed that the level of flux oxygen potential is a function of the equilibrium FeO activity at the slag–metal interface.
It is noted that there are several issues complicating the investigation of flux O potential, subject to SAW [5,20,21].
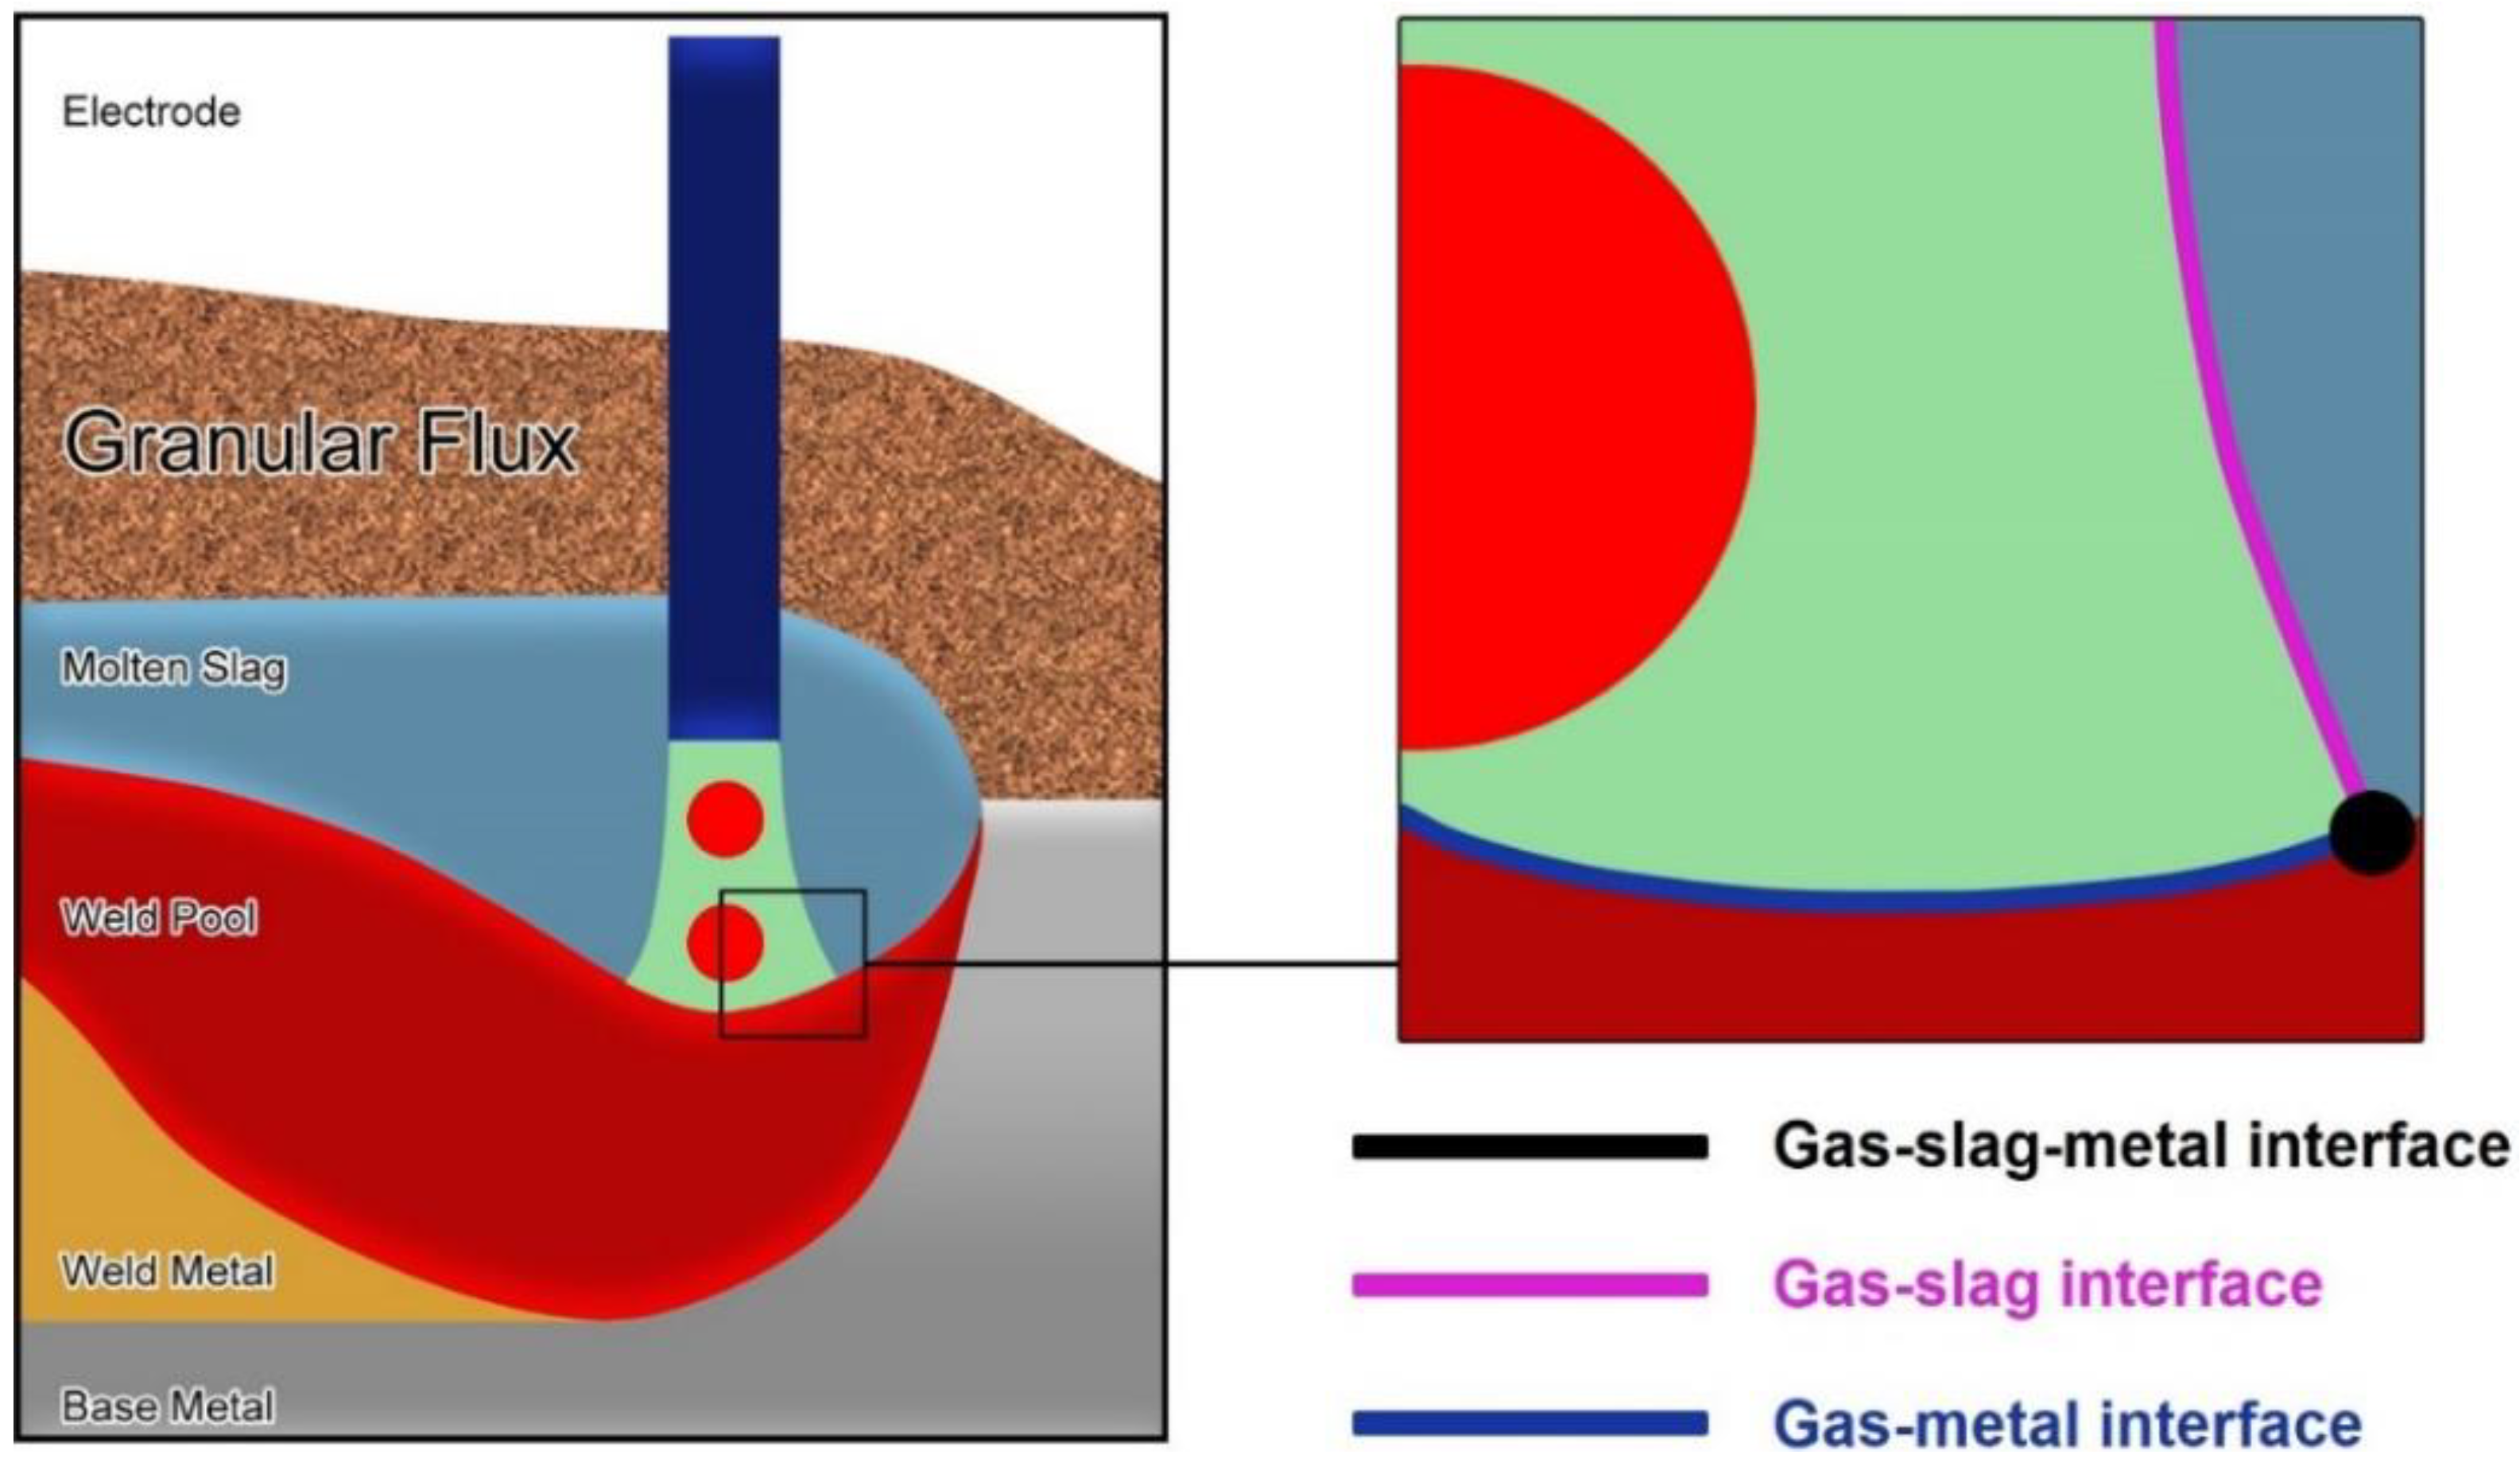
  • Since the arc plasma, molten slag, and weld pool are shielded under the flux granular, it is impossible to capture the gases in the arc plasma or to sample the molten slag for analytical purposes.
  • The temperature of chemical reactions in SAW is as high as 2000 °C, at which the thermodynamic data remain scarce.
Hopefully, a number of thermodynamic databases for gases, oxides, and alloy systems have been developed via the CALPHAD technique in recent decades [22,23,24,25,26]. Although the temperature of SAW is much higher than the traditional metallurgy process, the thermodynamic databases could be extended to higher temperatures by using the applicable thermodynamic models, such as the cell model, the modified regular solution model, etc. [23]
It is widely accepted that equilibrium is not attained due to the high temperature and large density gradients in the SAW process [2,19,27]. Despite this, we could assume that the state of thermodynamic equilibrium is attained locally, on the basis that the high temperatures and high surface-to-volume ratio counteract the short time available for reactions to be completed. As such, one may place constraints on the chemical reactions and element transfer behaviors between different phases [19,27,28,29].
Recently, Sengupta et al. [1] have summarized the physical phenomena in SAW. Then, based on the work of Sengupta et al. [1], Zhang et al. [9] concluded the existing state of the plasma(gas)–slag–gas interface (see Figure 2), and performed the gas–slag–metal equilibrium calculation to analyze the formations of the gases [3].
The objective of the present study has been to evaluate the concept of flux basicity geared toward flux oxygen potential estimation. Typical fluxes of five systems are poised to be employed within this framework, including FeO-SiO2-MnO, CaO-SiO2-MnO, CaF2-SiO2-MnO, CaF2-SiO2, and CaF2-MnO fluxes. This covers a wide range of flux BIs from 0.31 to 19.00, including acidic, neutral, and basic fluxes. Then, the gas–slag–metal equilibrium model is proposed, the capabilities of models to predict flux oxygen potential are systemically assessed, and the factor governing the prediction accuracy for flux oxygen potential is evaluated. Additionally, thermodynamic parameters pertinent to flux oxygen potential are systematically assessed. This study is concerned essentially with CaF2, CaO, SiO2, MnO, and FeO, since they are the most common components for flux design.

2. Materials and Methods

Table 1 summarizes the fluxes to be discussed in this work. The processes of flux preparations, welding experiments, and compositional analysis processes are given in the literature in the ‘Data source’ column of Table 1.
The LECO analyzer was used to determine the contents of oxygen. The WM oxygen content is precited from BI (see Table 1) by using curves in Figure 1.
The Equilib module of FactSage (version 7.3, CRCT, Montreal, Canada and GTT, Aachen, Germany) was employed to establish the gas–slag–metal equilibrium model, as follows [3,4,5,21,30]:
  • FToxid, Fstel, and FactPS databases were selected. Solution phases of ASlag-liq all oxides, S (FToxid-SLAGA), and LIQUID (FStel-Liqu) were selected to model the molten slag and steel phases.
  • The equilibrium temperature in SAW of 2000 °C was set.
  • Nominal compositions, which refer to the contents considering only the dilution effects of the BM and electrode, were used as the input metal chemistries. Nominal compositions are referenced from the data source given in Table 1.
Table 1. Summary of flux formulas in this study.
FluxCaF2CaOSiO2MnOFeOTuliani BIEagar BIFlux Developers and
Data Source
F-1-100400600.750.75FeO-SiO2-MnO
Indacochea et al. [31]
F-1-2004010500.750.75
F-1-3004020400.750.75
F-1-4004030300.750.75
F-1-5004040200.750.75
F-1-6004050100.750.75
F-2-1035402500.9380.938CaO-SiO2-MnO
Burck et al. [32]
F-2-2030403001.1251.125
F-2-3025403501.0631.063
F-2-4010405000.8750.875
F-2-505405500.8130.813
F-3-1350402501.1880.313CaF2-SiO2-MnO
Burck et al. [32]
F-3-2300403001.1250.375
F-3-3250403501.0630.438
F-3-4150404500.9380.563
F-3-5100405000.8750.625
F-3-650405500.8130.688
F-4-195050019.0-CaF2-SiO2
Dallam et al. [33]
F-4-290010009.0-
F-4-380020004.0-
F-4-470030002.3-
F-5-1950050--CaF2-MnO
Chai et al. [10]
F-5-28500150--
F-5-37800220--
F-5-47000300--

3. Results and Discussion

3.1. Acidic Flux with Low BI (BI = 0.75)

FeO-SiO2-MnO fluxes are typical manganese-silicate fluxes with low BIs. It is well known that the O potential of FeO is higher than that of MnO [10]. However, such a difference cannot be identified by the BI models.
According to Equations (1) and (2), varying the relative amounts of MnO and FeO will not change the BI, nor will it change the predicted oxygen level. For instance, when the SiO2 content is held constant at 40 wt pct, both Tuliani and Eagar BIs are at 0.75 (see Table 1).
The measured oxygen content and predicted value from BI models are shown in Figure 3. It is seen that, with a higher addition level of FeO (MnO is substituted by FeO), the oxygen content in the WM increases from 930 to 1410 ppm. The oxygen content predicted from the Tuliani BI model holds constant at 560 ppm, while that predicted from the Eagar BI model holds constant at 400 ppm. Both Tuliani and Eagar BI models fail to differentiate the oxygen potential of FeO and MnO.
The oxygen content predicted from the gas–slag–metal equilibrium model is plotted in Figure 4. It is seen that the gas–slag–metal equilibrium model can correctly predict the increasing trend of oxygen content with FeO level. The inner chart of Figure 4 plotted the predicted equilibrium pO2 as a function of FeO level in flux, from which increasing equilibrium pO2 with FeO content is observed. Such information is in agreement with the assumption proposed by Lau et al. [7]. Therefore, the prediction accuracy has been improved via the application of the gas–slag–metal equilibrium model, since the impact of O2 on the flux oxygen potential is considered.

3.2. Flux with Moderate BI (0.3 < BI < 1.2)

CaO-SiO2-MnO and CaF2-SiO2-MnO fluxes were developed from FeO-SiO2-MnO fluxes. For these fluxes, FeO is substituted by the components with lower oxygen potential (CaO or CaF2). The selected CaO-SiO2-MnO and CaF2-SiO2-MnO fluxes cover acidic, neutral, and basic fluxes with BIs spanning from 0.3 to 1.2.
As for CaO-SiO2-MnO fluxes, the O content predicted using Tuliani and Eagar BI models is illustrated in Figure 5. It is widely accepted that the O potential of MnO is higher than that of CaO [10,34]. Therefore, with a higher level of MnO addition into flux (CaO is substituted by MnO), the measured O content improves from 610 to 950 ppm. Such a changing trend is predictable from both Tuliani and Eagar BI models, since the gain coefficient of CaO for BI is higher than that of MnO, as shown by Equations (1) and (2).
The content oxygen of the WM processed by CaF2-SiO2-MnO flux is plotted in Figure 6. Since CaF2 is a component with no oxygen element, the substitution of CaF2 with MnO would inevitably improve the flux oxygen potential. However, the reduction effect of CaF2 on flux oxygen potential is not considered in the Eagar BI model; therefore, the Eagar BI decreases from 0.69 to 0.31 when MnO content increases from 25 to 55 wt pct, and lower precited oxygen content from the Eagar BI model is anticipated. As shown in Figure 6, the changing trend in WM oxygen content with an MnO addition level is predictable using the Tuliani BI model, but it is incorrectly estimated by the Eagar BI model.
Another technical challenge is to differentiate the flux oxygen potential when CaF2 is replaced by CaO, since CaO tends to change the activity of other oxides and complicates the chemical reaction subject to the SAW system [33]. To address such technical difficulties, one may apply the gas–slag–metal equilibrium model by assuming the state of thermodynamic equilibrium is attained locally. The predicted oxygen content is plotted in Figure 7b. It is seen from Figure 7 that, for flux of the same MnO level, the substitution of CaF2 by CaO initiates the improvement in flux oxygen potential (see the black and green shaded area in Figure 7a). Such improvements in flux oxygen potential can be predicted using the gas–slag–metal equilibrium model, as shown in Figure 7b. The inner chart indicates that the substitution of CaF2 by CaO improves the level of equilibrium pO2, which, in turn, promotes the flux oxygen potential level.

3.3. Flux with High BI (BI > 2.3)

As mentioned previously, the BI models fail to differentiate the oxygen potential of fluxes when BI is higher than 2.2, since the predicted oxygen content would hold constant if BI is higher than 2.5, as shown in Figure 1.
As for CaF2-SiO2 fluxes, the Eagar BI holds constant at zero, since CaF2 is excluded from the Eagar BI model, making the WM oxygen content unpredictable. The blue dots in Figure 8 show the predicted WM oxygen content from the Tuliani BI model. It is seen that the oxygen content predicted from the Tuliani BI model holds constant at 250 ppm. When the gas–slag–metal equilibrium model is applied, the increasingly changing trend of oxygen content with SiO2 addition level is correctly predicted, as shown by the red triangles and black dots in Figure 8. The inner graph in Figure 8 illustrates that equilibrium pO2 increases from 8.26 to 17.9 × 10⁻¹⁰ atm.
CaF2-MnO fluxes are special basic ones, since only basic oxides are incorporated, making both Tuliani and Eager BIs unpredictable, although MnO is the component possessing very high oxygen potential [10,34]. Nonetheless, the role of MnO in oxygen potential control can be reflected by the gas–slag–metal equilibrium model. It is seen from Figure 9 and its inner graph that both measured oxygen content and the one predicted from the gas–slag–metal equilibrium model increase with higher MnO content.
It is well known that MnO in flux tends to decompose into O2 and significantly improves the oxygen level in the weld pool via Reaction (3). However, such a mechanism cannot be reflected in BI models. The gas–slag–metal equilibrium model, on the other hand, has taken the generation of O2 into account. As shown by the inner graph in Figure 9, an improvement in equilibrium pO2 is observed with a higher level of MnO addition, since Reaction (3) is driven to the right side.
( MnO ) = Mn ( g ) + 1 2 O 2 ( g )
When fluxes are designed, a common problem that people encounter is correctly differentiating the oxygen potential of SiO2 and MnO, since they are the most frequently used components, yet have high oxygen potential [11]. The measured and predicted oxygen levels in Figure 10 illustrate that the oxygen potential of SiO2 and MnO can be correctly distinguished when CaF2-bearing fluxes are utilized.

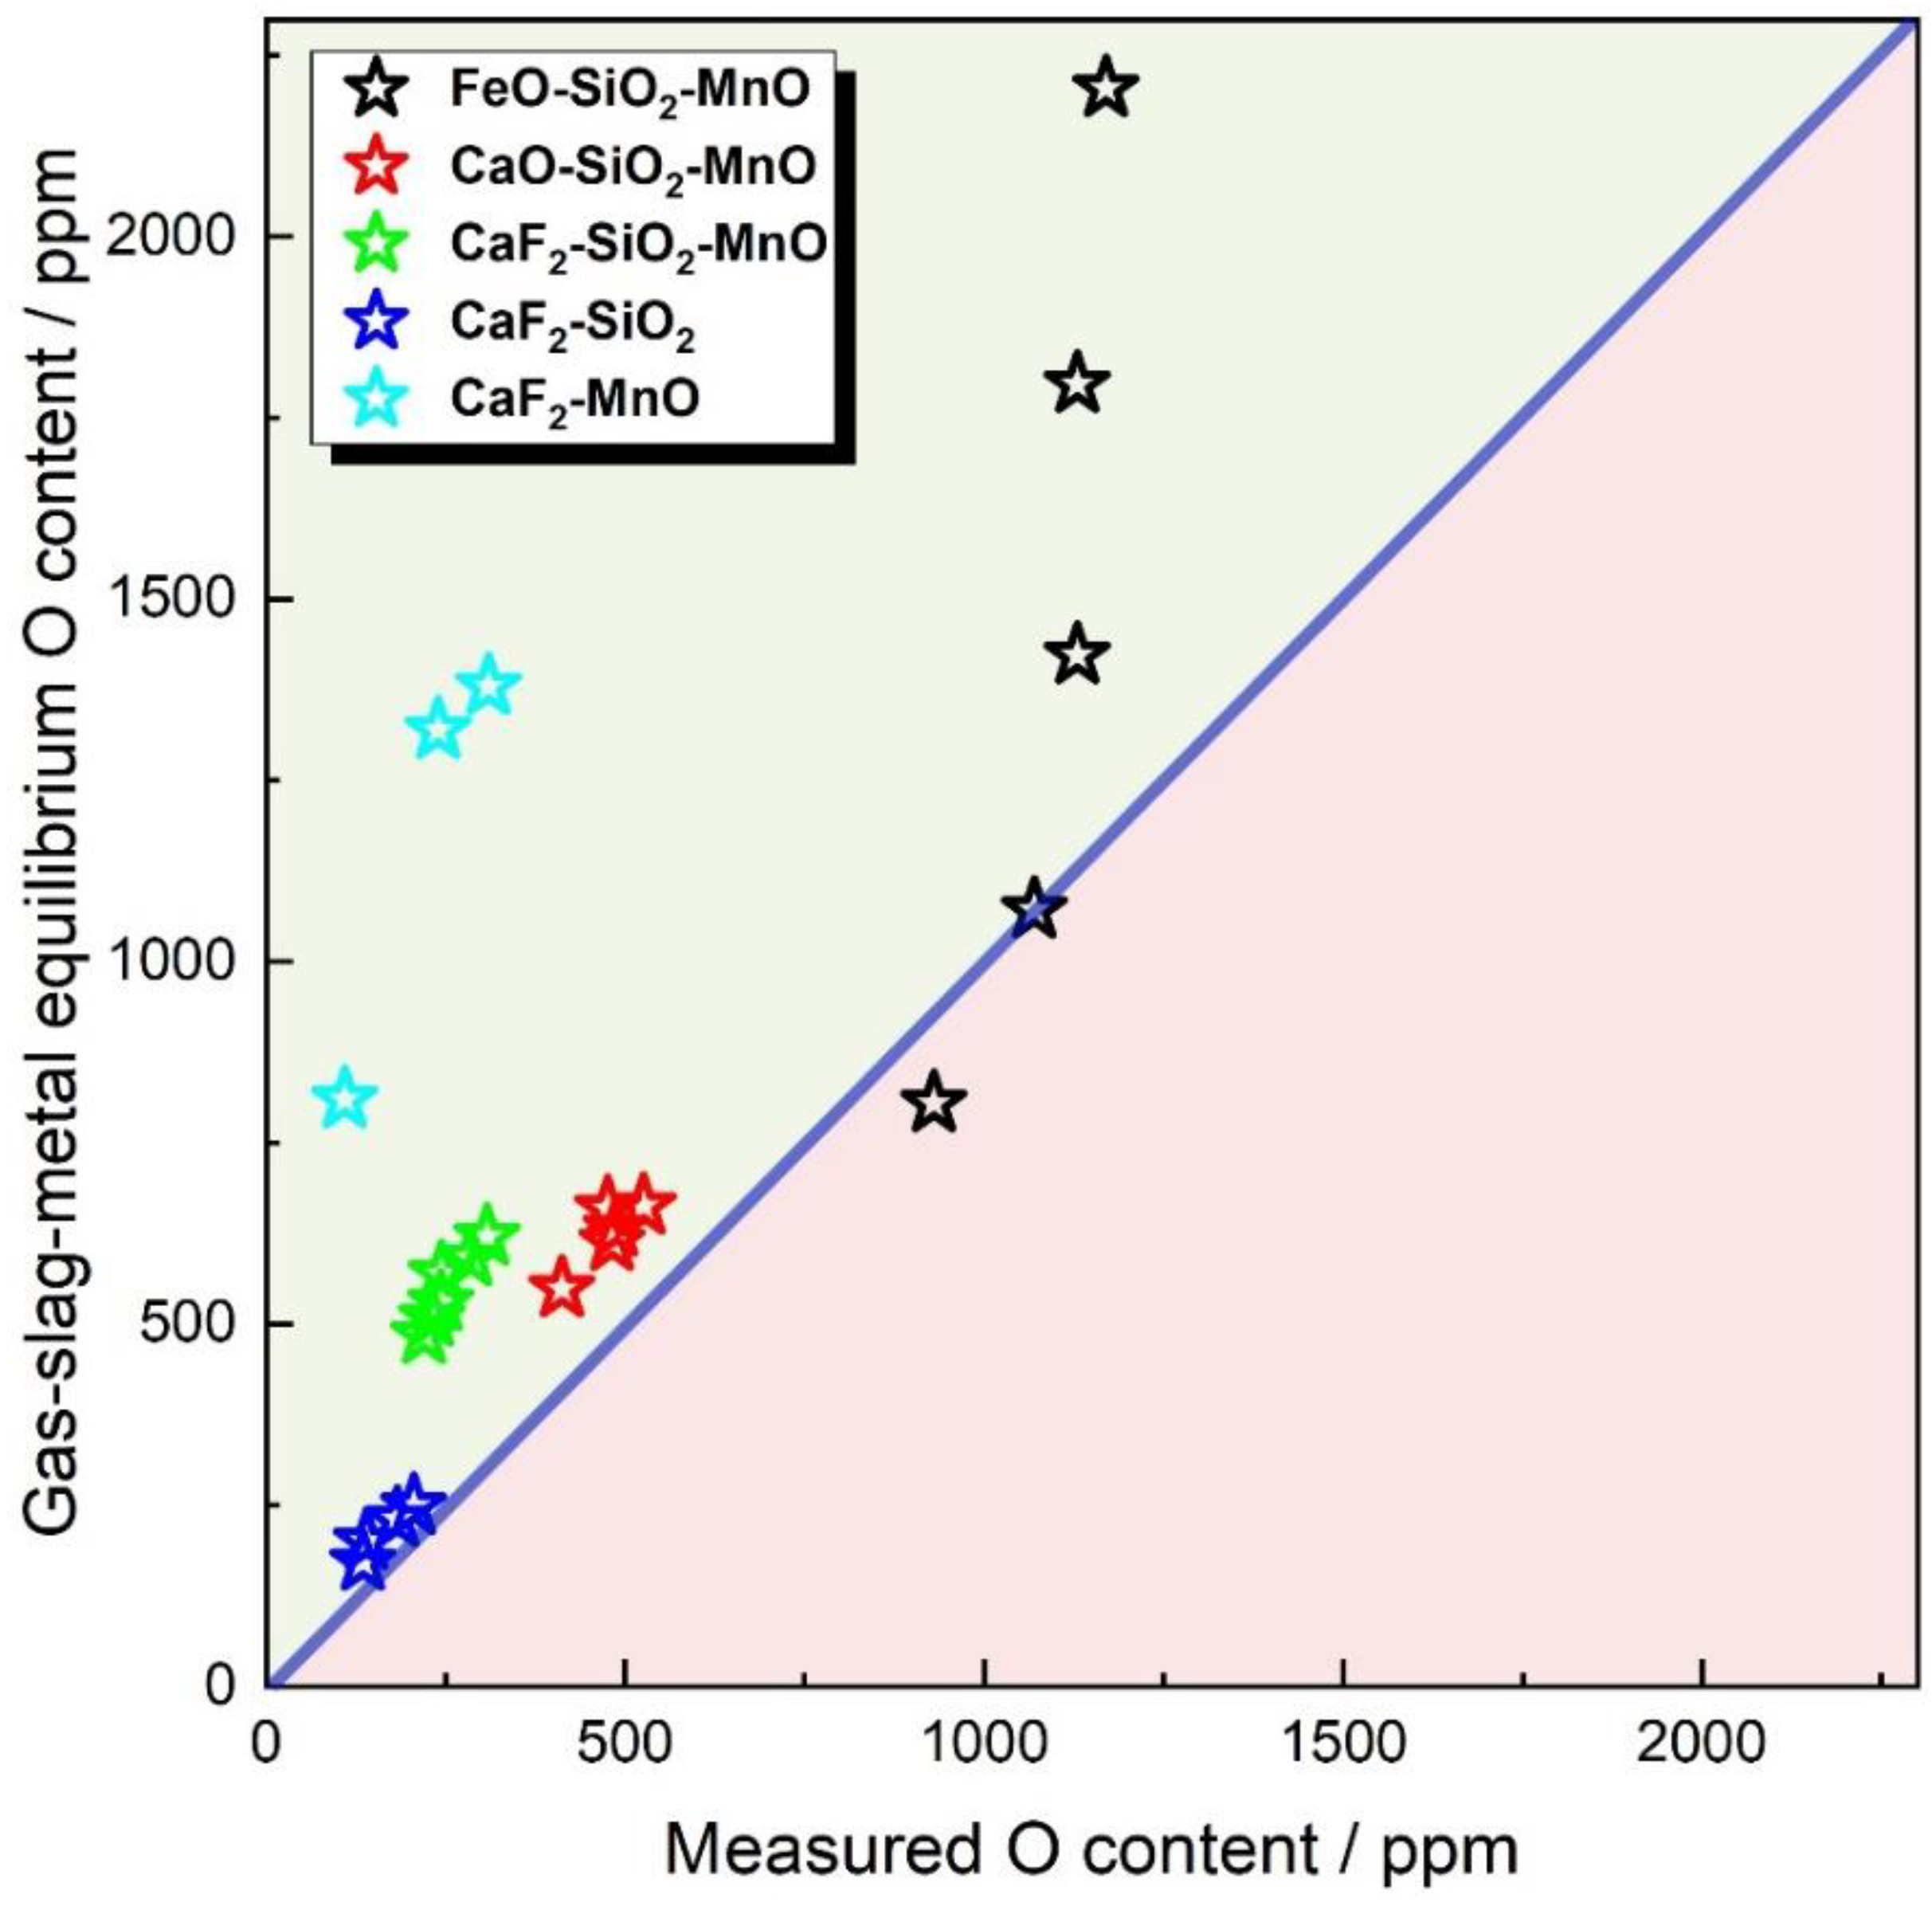
3.4. Bias between Equilibrium and Measured Oxygen Content

The measured and predicted oxygen data are summarized in Figure 11. It is seen from Figure 11 that only one dot falls into the red region, illustrating that the equilibrium oxygen content is higher than the measured one. This could be explained by the assumption discussed above; that is, the overall equilibrium could not be attained in SAW, which may provide experimental evidence for the assumption, subject to the non-thermodynamic-equilibrium status in the SAW process.
As was reported in the work of Zhang and Coetsee et al. [34], although thermodynamic equilibrium is not attained in the SAW process, the status of chemical reactions is closer to equilibrium under higher heat input. The typical kinetic model has been developed by Mitra et al. [35] However, to the knowledge of the authors, there are some deficiencies with respect to this model. We are investigating the transfer behavior that occurs when CaF2-SiO2-Na2O fluxes are applied under different heat inputs to evaluate the kinetic factors, which will be reported in our coming study.

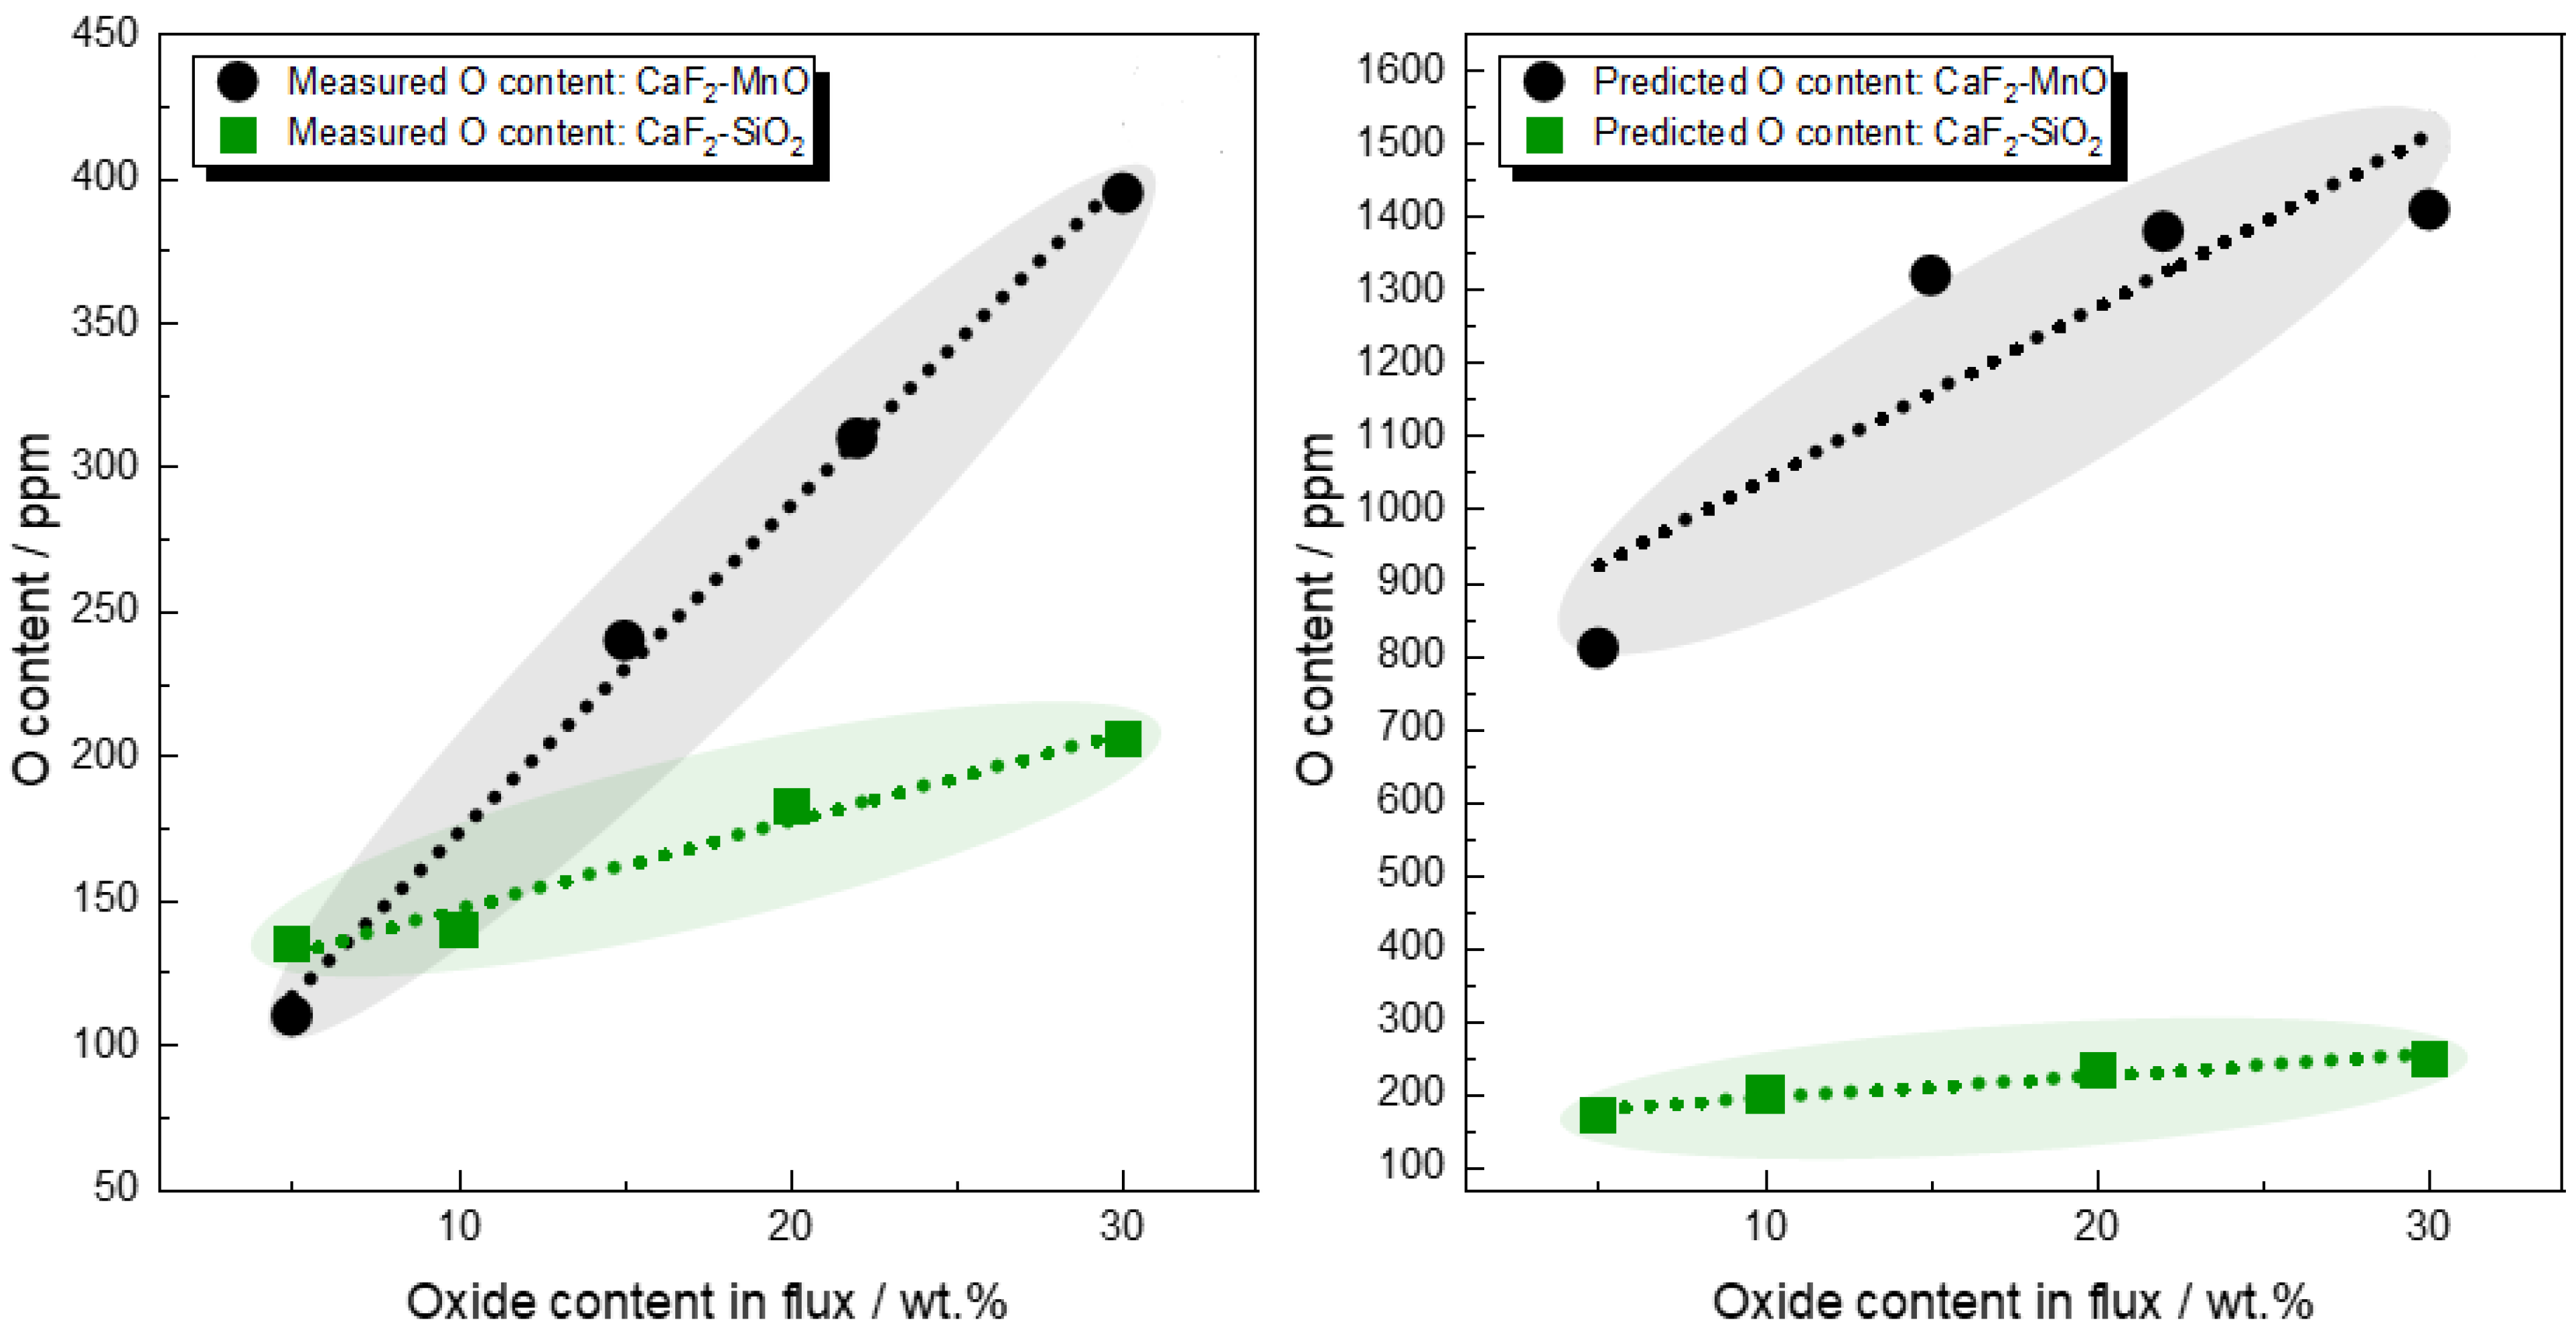
3.5. Role of CaF2 in the Determination of Flux O Potential

The measured and predicted oxygen content indicates that the Eagar BI model may incorrectly predict the changing trend of flux oxygen potential, especially for CaF2-enriched fluxes, since the deduction effect CaF2 of flux oxygen potential is not considered in the Eagar BI model. For CaF2-oxide binary fluxes, the Eagar BI model will be invalid, since the Eagar BI is incalculable.
Eagar [6] assumed that CaF2 only acts as a dilutant rather than an active species. As such, he excluded CaF2 from the Eagar BI model. However, as was reported by Coetsee et al. [3] and Zhang et al. [5], the chemical interaction between CaF2 and oxides should be considered, as shown by Reaction (4).
2 ( CaF 2 ) + ( MO x ) = 2 ( CaO ) + MF 2 x ( g )
It is well known that CaO is the flux oxide component with the lowest oxygen potential [10]. Therefore, the oxides in flux are converted to CaO via Reaction (4), leading to a reduction in flux oxygen potential. This can be reflected by the significant reduction in CaF2 levels and oxides after welding [36,37]. Gibbs free energy, surmised by Coetsee et al. [4], also confirms the occurrence of Reaction (4) in the SAW process. Hence, the consideration of CaF2 as a dilutant rather than an active species may underestimate the overall flux oxygen potential.

4. Conclusions

This study has evaluated the flux basicity concept geared toward flux oxygen potential estimation in SAW. The flux oxygen potential (WM oxygen content) is predicted by using the Tuliani BI model, the Eagar BI model, and the gas–slag–metal equilibrium model. It is revealed that the gas–slag–metal equilibrium model is capable of remedying shortcomings of the BI models on differentiating oxygen potentials of the fluxes with CaF2, CaO, SiO2, MnO, and FeO as major components. The main findings can be summarized as follows:
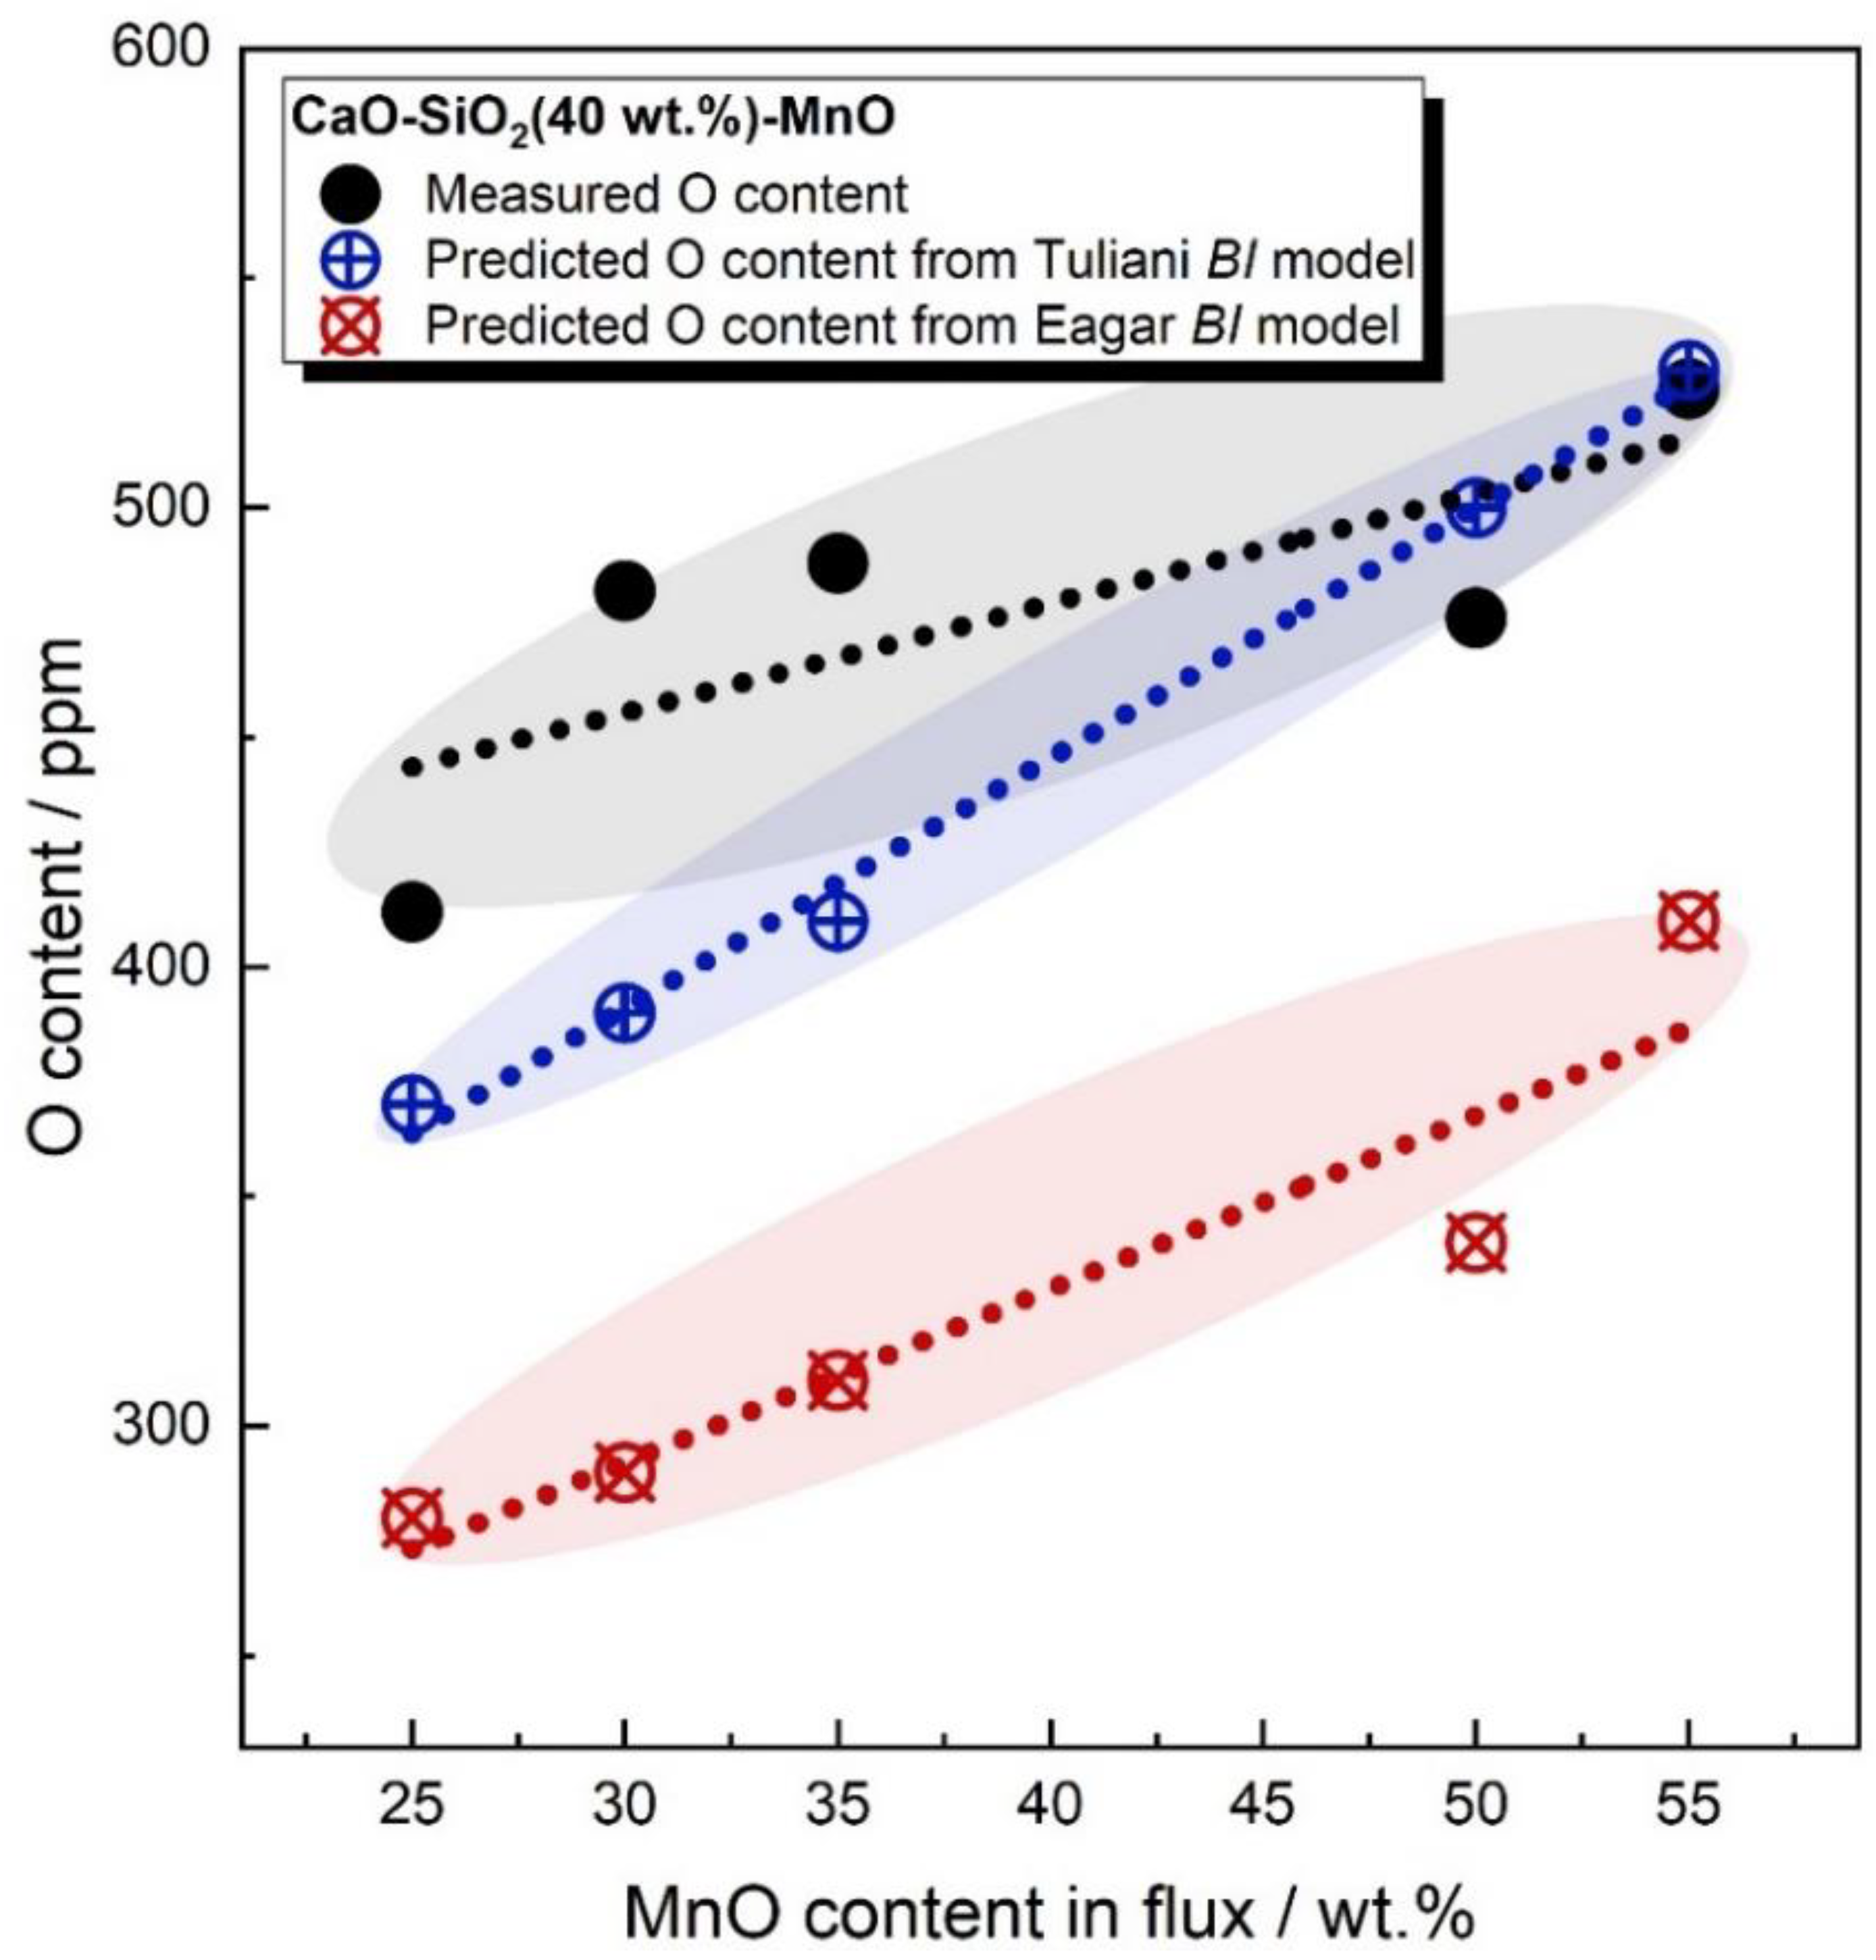
  • For CaF2-free fluxes, both Tuliani and Eagar BI models fail to differentiate the oxygen potential of FeO and MnO. For CaF2-enriched fluxes, the Eagar BI model may incorrectly predict the changing trend of WM oxygen content as a function of the flux formula. Additionally, both Tuliani and Eagar BI models fail to differentiate the oxygen potential of SiO2 and MnO in CaF2-based binary fluxes;
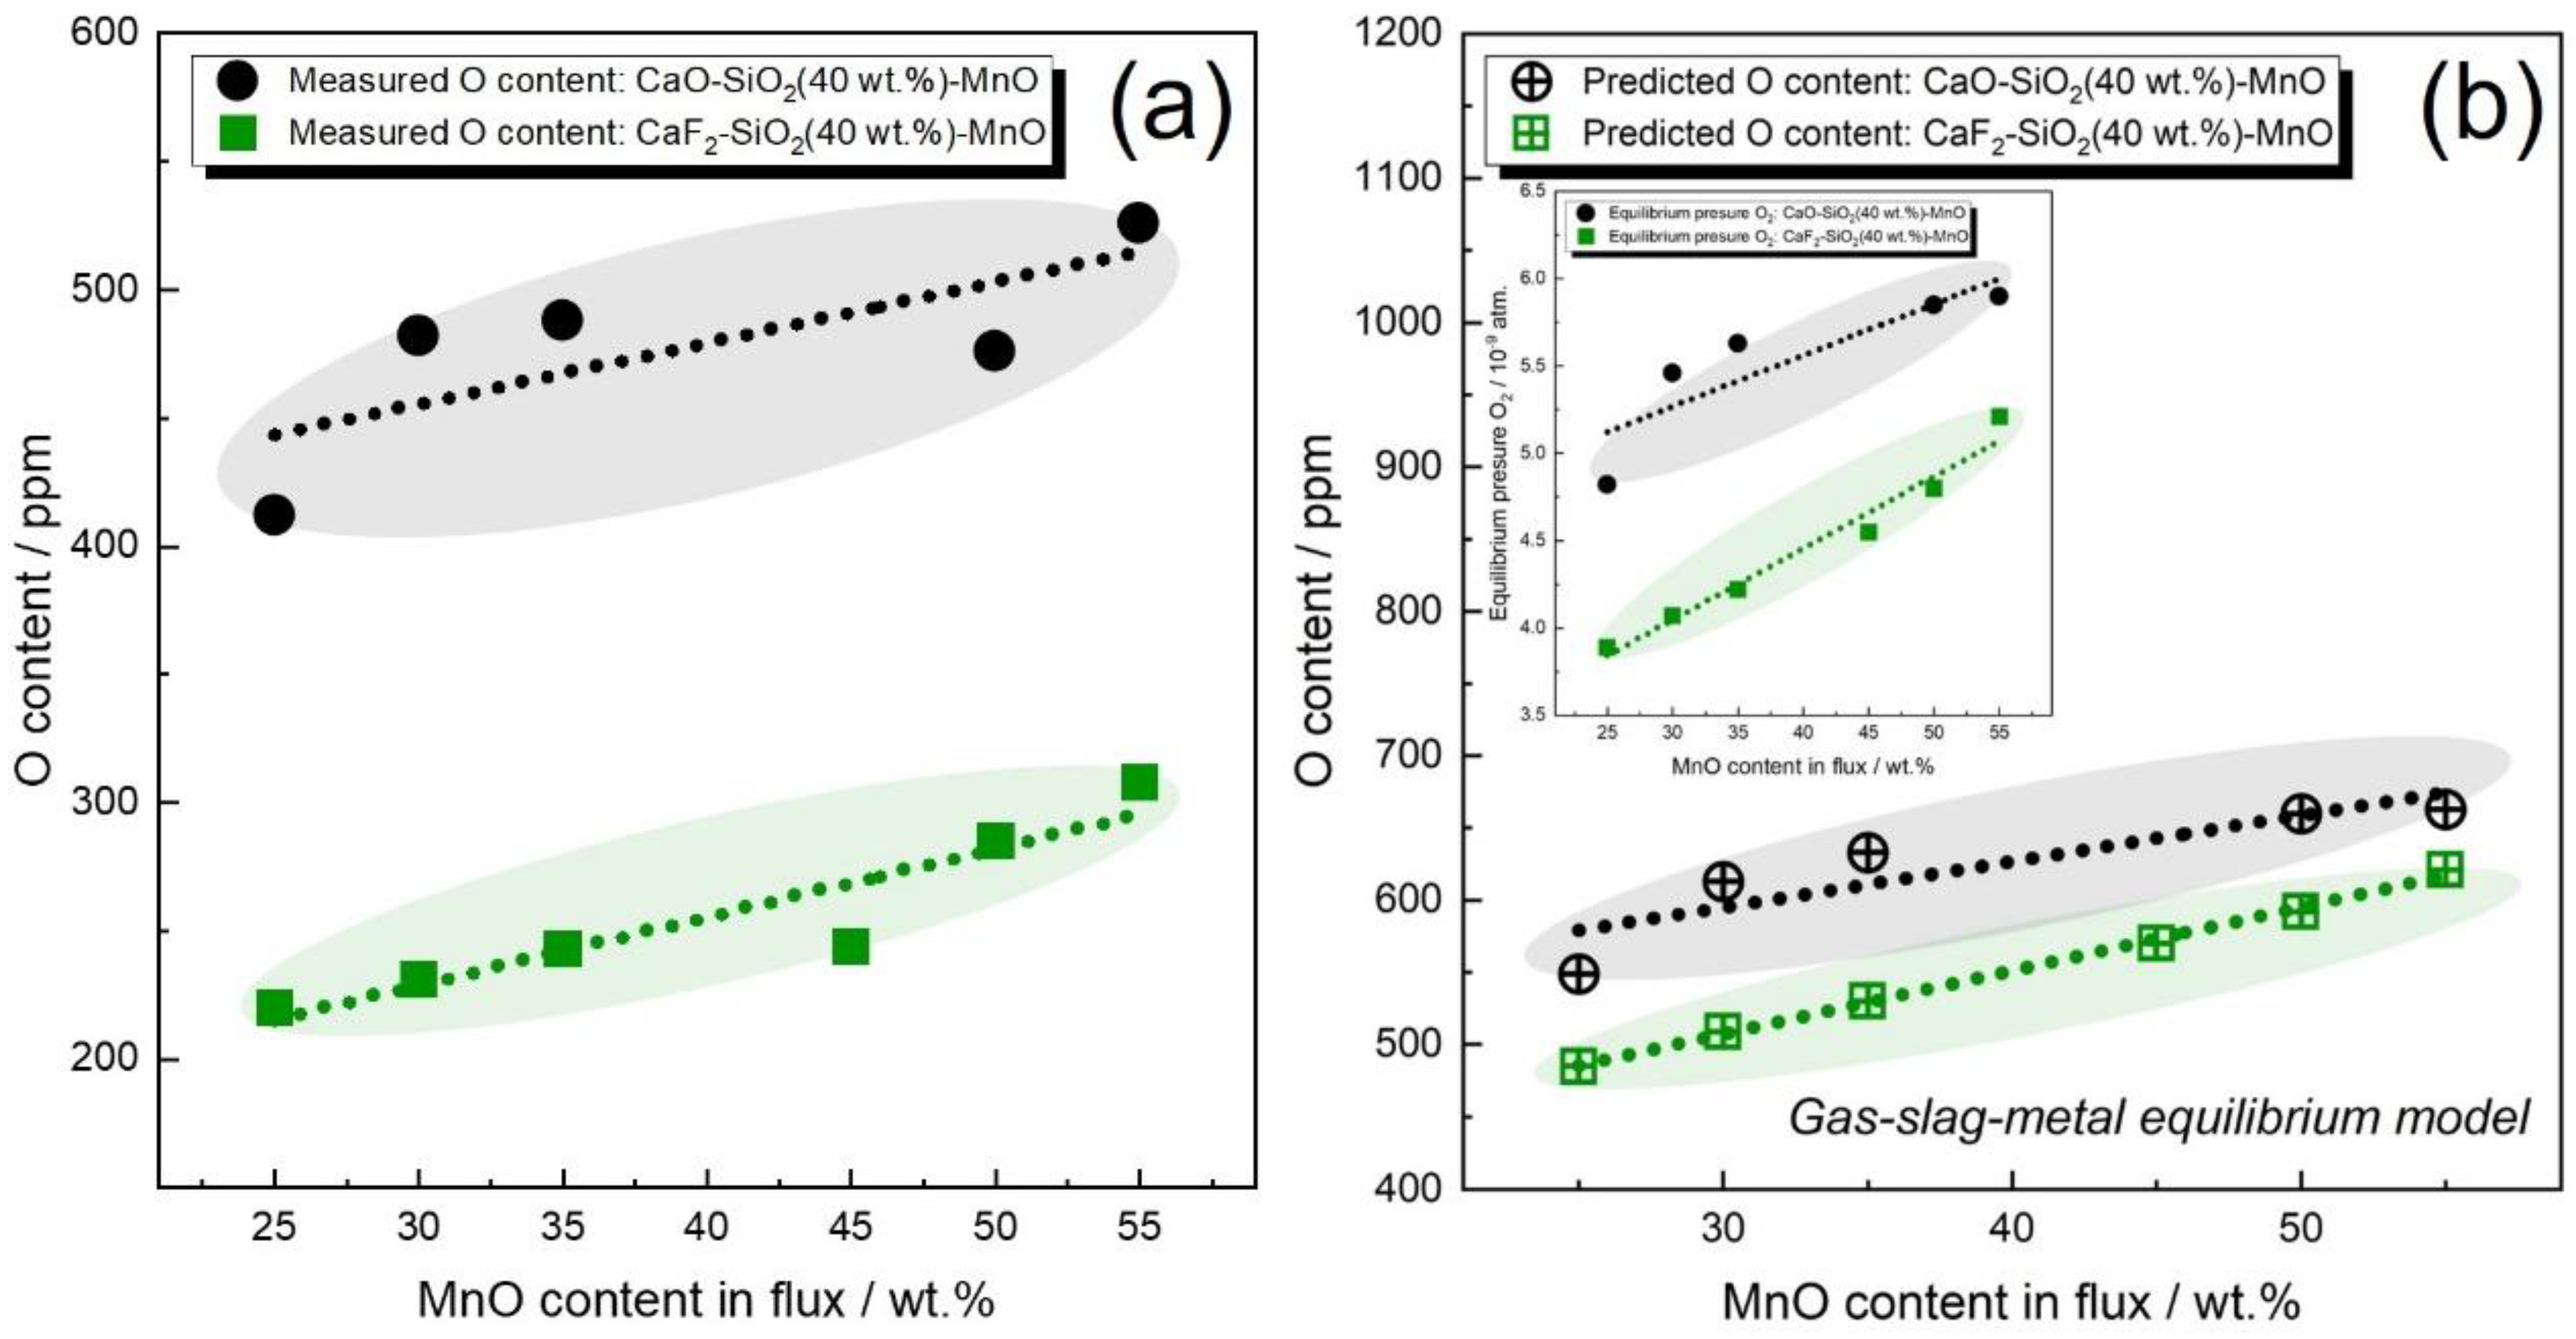
  • The gas–slag–metal equilibrium model can differentiate the oxygen potential of CaO, FeO, MnO, and SiO2. Additionally, the gas–slag–metal equilibrium model is capable of estimating the changing trend of WM oxygen content, even when BI models are inapplicable.
  • In comparison to flux BI, the gas–slag–metal equilibrium oxygen and pO2 is more feasible in differentiating the oxygen potential for fluxes of different formulas.
  • The measured data confirm that the overall equilibrium could not be attained in SAW, which may provide experimental evidence for assumptions subject to the non-thermodynamic-equilibrium status in SAW processes.
  • The sole consideration of CaF2 being a dilutant rather than an active species may underestimate the flux oxygen potential.

Author Contributions

Conceptualization, G.S. and Z.L.; methodology, Y.G.; software, J.F.; validation, Q.X.; writing—review and editing, J.Z. All authors have read and agreed to the published version of the manuscript.

Funding

This work was financially supported by the National Natural Science Foundation of China (No. 52171031), the Fundamental Research Funds for the Central Universities (No. N2225011), the Opening project fund of Materials Service Safety Assessment Facilities (No. MSAF-2021-009), the Initial Fund of Suqian University (No. 2022XRC040), Suqian Sci&Tech Program (No. K202113), and Natural Science Research Program of Jiangsu Higher Education Institutions (No. 21KJB430015).

Conflicts of Interest

The authors declare no conflict of interest.

References

  1. Sengupta, V.; Havrylov, D.; Mendez, P. Physical Phenomena in the Weld Zone of Submerged Arc Welding-A Review. Weld. J. 2019, 98, 283–313. [Google Scholar] [CrossRef]
  2. Natalie, C.A.; Olson, D.L.; Blander, M. Physical and Chemical Behavior of Welding Fluxes. Annu. Rev. Mater. Sci. 1986, 16, 389–413. [Google Scholar] [CrossRef]
  3. Coetsee, T.; Mostert, R.J.; Pistorius, P.G.H.; Pistorius, P.C. The Effect of Flux Chemistry on Element Transfer in Submerged Arc Welding: Application of Thermochemical Modelling. J. Mater. Res. Technol. 2021, 11, 2021–2036. [Google Scholar] [CrossRef]
  4. Coetsee, T. Phase Chemistry of Submerged Arc Welding (SAW) Fluoride Based Slags. J. Mater. Res. Technol. 2020, 9, 9766–9776. [Google Scholar] [CrossRef]
  5. Zhang, J.; Coetsee, T.; Basu, S.; Wang, C. Impact of Gas Formation on the Transfer of Ti and O from TiO2-bearing Basic-fluoride Fluxes to Submerged Arc Welded Metals: A Thermodynamic Approach. Calphad 2020, 71, 102195. [Google Scholar] [CrossRef]
  6. Eagar, T. Sources of Weld Metal Oxygen Contamination during Submerged Arc Welding. Weld. J. 1978, 57, 76–80. [Google Scholar]
  7. Lau, T.; Weatherly, G.; McLean, A. The Sources of Oxygen and Nitrogen Contamination in Submerged Arc Welding Using CaO-Al2O3 Based Fluxes. Weld. J. 1985, 64, 343–347. [Google Scholar]
  8. Zhang, J.; Leng, J.; Wang, C. Tuning Weld Metal Mechanical Responses via Welding Flux Optimization of TiO2 Content: Application into EH36 Shipbuilding Steel. Metall. Mater. Trans. B 2019, 50, 2083–2087. [Google Scholar] [CrossRef]
  9. Zhang, J.; Coetsee, T.; Dong, H.; Wang, C. Elucidating the Roles of SiO2 and MnO upon Decarburization during Submerged Arc Welding: A Thermodynamic Study into EH36 Shipbuilding Steel. Metall. Mater. Trans. B 2020, 51, 1805–1812. [Google Scholar] [CrossRef]
  10. Chai, C.; Eagar, T. Slag Metal Reactions in Binary CaF2-Metal Oxide Welding Fluxes. Weld. J. 1982, 61, 229–232. [Google Scholar]
  11. Kou, S. Welding Metallurgy, 3rd ed.; JohnWiley & Sons, Inc.: Hoboken, NJ, USA, 2003; pp. 22–122. [Google Scholar]
  12. Lau, T.; Weatherly, G.; McLean, A. Gas/metal/slag Reactions in Submerged Arc Welding Using CaO-Al2O3 Based Fluxes. Weld. J. 1986, 65, 31–38. [Google Scholar]
  13. Olson, D.; Liu, S.; Frost, R.; Edwards, G.; Fleming, D. Nature and Behavior of Fluxes Used for Welding. ASM Int. ASM Handb. 1993, 6, 55–63. [Google Scholar] [CrossRef]
  14. Lao, Y.; Gao, Y.; Deng, F.; Wang, Q.; Li, G. Effects of Basicity and CaF2 on the Viscosity of CaF2-CaO-SiO2 Slag for Electroslag Remelting Process. Metall. Res. Technol. 2019, 116, 638. [Google Scholar] [CrossRef]
  15. Jindal, S.; Chhibber, R.; Mehta, N. Effect of Flux Constituents and Basicity Index on Mechanical Properties and Microstructural Evolution of Submerged Arc Welded high Strength Low Alloy Steel. Mater. Sci. Forum 2013, 738–739, 242–246. [Google Scholar] [CrossRef]
  16. Liby, A.; Dixon, R.; Olson, D. Welding: Theory and Practice; Elsevier Science Publishers: Amsterdam, The Netherlands, 1990; pp. 151–169. [Google Scholar]
  17. Tuliani, S.; Boniszewski, T.; Eaton, N. Notch Toughness of Commercial Submerged Arc Weld metal. Weld. Met. Fabr. 1969, 37, 327–339. [Google Scholar]
  18. Palm, J. How Fluxes Determine the Metallurgical Properties of Submerged Arc Welds. Weld. J. 1972, 51, 358. [Google Scholar]
  19. Indacochea, J.E.; Blander, M.; Christensen, N.; Olson, D.L. Chemical Reactions During Submerged Arc Welding with FeO-MnO-SiO2 Fluxes. Metall. Trans. B 1985, 16, 237–245. [Google Scholar] [CrossRef]
  20. Zhang, Y.; Zhang, J.; Liu, H.; Wang, Z.; Wang, C. Addressing Weld Metal Compositional Variations in EH36 Shipbuilding Steel Processed by CaF2-SiO2-CaO-TiO2 Fluxes. Metall. Mater. Trans. B 2022, 53, 1329–1334. [Google Scholar] [CrossRef]
  21. Zhang, J.; Wang, C.; Coetsee, T. Thermodynamic Evaluation of Element Transfer Behaviors for Fused CaO-SiO2-MnO Fluxes Subjected to High Heat Input Submerged Arc Welding. Metall. Mater. Trans. B 2021, 52, 1937–1944. [Google Scholar] [CrossRef]
  22. Bale, C.W.; Bélisle, E.; Chartrand, P.; Decterov, S.; Eriksson, G.; Gheribi, A.; Hack, K.; Jung, I.-H.; Kang, Y.-B.; Melançon, J. Reprint of: FactSage Thermochemical Software and Databases, 2010–2016. Calphad 2016, 55, 1–19. [Google Scholar] [CrossRef]
  23. Jung, I.-H. Overview of the applications of thermodynamic databases to steelmaking processes. Calphad 2010, 34, 332–362. [Google Scholar] [CrossRef]
  24. Park, J.H. Solidification structure of CaO-SiO2-MgO-Al2O3(-CaF2) systems and computational phase equilibria: Crystallization of MgAl2O4 spinel. Calphad 2007, 31, 428–437. [Google Scholar] [CrossRef]
  25. Park, J.H. Formation of CaZrO3 at the interface between CaO-SiO2-MgO-CaF2(-ZrO2) slags and magnesia refractories: Computational and experimental study. Calphad 2007, 31, 149–154. [Google Scholar] [CrossRef]
  26. Bale, C.W.; Chartrand, P.; Degterov, S.; Eriksson, G.; Hack, K.; Mahfoud, R.B.; Melançon, J.; Pelton, A.; Petersen, S. FactSage Thermochemical Software and Databases. Calphad 2002, 26, 189–228. [Google Scholar] [CrossRef]
  27. Cong, W.; Zhang, J. Fine-tuning Weld Metal Compositions via Flux Optimization in Submerged Arc Welding: An Overview. Acta Metall. Sin. 2022, 57, 1126–1140. [Google Scholar] [CrossRef]
  28. Chai, C.; Eagar, T. Prediction of Weld-metal Composition during Flux-shielded Welding. J. Mater. Energy Syst. 1983, 5, 160–164. [Google Scholar] [CrossRef]
  29. Chai, C.; Eagar, T. Slag-metal Equilibrium during Ssubmerged Arc Welding. Metall. Trans. B 1981, 12, 539–547. [Google Scholar] [CrossRef]
  30. Zhang, J.; Wang, C.; Coetsee, T. Assessment of Weld Metal Compositional Prediction Models Geared Towards Submerged Arc Welding: Case Studies Involving CaF2-SiO2-MnO and CaO-SiO2-MnO Fluxes. Mater. Trans. B 2021, 52, 2404–2415. [Google Scholar] [CrossRef]
  31. Indacochea, J.; Blander, M.; Shah, S. Submerged Arc Welding: Evidence for Electrochemical Effects on the Weld Pool. Weld. J. 1989, 68, 11–14. [Google Scholar]
  32. Burck, P.; Indacochea, J.; Olson, D. Effects of Welding Flux Additions on 4340 Steel Weld Metal Composition. Weld. J. 1990, 3, 115–122. [Google Scholar]
  33. Dallam, C.; Liu, S.; Olson, D. Flux Composition Dependence of Microstructure and Toughness of Submerged Arc HSLA Weldments. Weld. J. 1985, 64, 140–151. [Google Scholar]
  34. Zhang, J.; Coetsee, T.; Dong, H.; Wang, C. Element Transfer Behaviors of Fused CaF2-SiO2-MnO Fluxes under High Heat Input Submerged Arc Welding. Metall. Mater. Trans. B 2020, 51, 885–890. [Google Scholar] [CrossRef]
  35. Mitra, U.; Eagar, T. Slag-metal Reactions During Welding: Part II. Theory. Metall. Trans. B 1991, 22, 73–81. [Google Scholar] [CrossRef]
  36. Zhang, J.; Coetsee, T.; Wang, C. Element Transfer Behaviors of Fused CaF2-SiO2 Fluxes Subject to High Heat Input Submerged Arc Welding. Metall. Mater. Trans. B 2020, 51, 16–21. [Google Scholar] [CrossRef]
  37. Zhang, J.; Coetsee, T.; Dong, H.; Wang, C. Element Transfer Behaviors of Fused CaF2-TiO2 Fluxes in EH36 Shipbuilding Steel during High Heat Input Submerged Arc Welding. Metall. Mater. Trans. B 2020, 51, 1953–1957. [Google Scholar] [CrossRef]
Figure 1. Predicted WM O level as a function of flux BI.
Metals 12 01530 g001
Figure 2. Schematic diagram of SAW and gas-associated reaction interface.
Metals 12 01530 g002
Figure 3. WM oxygen content as a function FeO content in flux.
Metals 12 01530 g003
Figure 4. WM O content and equilibrium pO2 as a function FeO content in flux.
Metals 12 01530 g004
Figure 5. WM O content as a function MnO content in flux.
Metals 12 01530 g005
Figure 6. WM O content as a function MnO content in flux.
Metals 12 01530 g006
Figure 7. WM O content and equilibrium pO2 as a function of MnO content in flux.
Metals 12 01530 g007
Figure 8. WM O content and equilibrium pO2 as a function of SiO2 content in flux.
Metals 12 01530 g008
Figure 9. WM O content and equilibrium pO2 as a function MnO content in flux.
Metals 12 01530 g009
Figure 10. WM O content as a function of oxide content in flux.
Metals 12 01530 g010
Figure 11. WM oxygen content as a function of oxide content in flux.
Metals 12 01530 g011
Publisher’s Note: MDPI stays neutral with regard to jurisdictional claims in published maps and institutional affiliations.

