Article

Stress Corrosion Cracking of Steam Turbine Steel: The Influence of Organic Acid Characteristics

1
Research Unit Sustainable Materials Science, Department of Materials, Textiles and Chemical Engineering, Ghent University, Technologiepark 46, 9052 Zwijnaarde, Belgium
2
Department of Green Chemistry and Technology, Ghent University, Coupure Links 653, 9000 Ghent, Belgium
*
Authors to whom correspondence should be addressed.
Metals 2022, 12(9), 1490; https://doi.org/10.3390/met12091490
Submission received: 31 July 2022 / Revised: 1 September 2022 / Accepted: 2 September 2022 / Published: 8 September 2022

Abstract

:
This work evaluates the impact of different organic acids on the corrosion sensitivity and stress-corrosion cracking (SCC) of NiCrMoV steam turbine steel. For all organic acids, potentiodynamic measurements shows linear relationships between corrosion rate and hydrogen proton concentration between pH 2.4 and 3.9. For solutions with the same pH, i.e., similar conductivity, the corrosion rate differs depending on the type of organic acid. The anodic dissolution in formic acid is the highest, followed by acetic, propanoic and nonanoic acid. The acid dissociation reaction is identified as the rate determining step in the corrosion process. Nonanoic acid, alternatively, clearly acts as a corrosion inhibitor. In situ four-point constant-extension tests in formic acid, acetic acid and nonanoic acid, at a pH value of 3.4 were performed to evaluate their impact on the SSC sensitivity. The general degradation followed the trend of the corrosion rate, although the synergetic effect of corrosion and stress resulted in a higher degradation depth. Though nonanoic acid induced little visible corrosion, still stress-corrosion cracks were still detected. It was shown that solutions of different organic acids with the same pH do not have the same influence on stress-induced degradation.

1. Introduction

Organic acids are commonly found in the first condensate in steam turbines, acidifying the aqueous environment of steam turbine materials [1,2,3]. The presence of organic acids in the first condensate was proven by experimental first condensate measurements [4,5]. The organic acids typically originate from (hydro)thermolysis of organic compounds present in the boiler feed water [3,6,7]. Moreover, with the degradation into organic acids, carbon dioxide is also formed [8,9]. The amounts and types of organic compounds in the boiler feed water sources are continuously changing. One of the causes for this is climate change, resulting in less rainfall and therefore leading to higher concentrations of organic compounds [10,11]. Another cause is the shift to alternative water sources in industry, for example from the use of tap water to surface water, or reuse of effluent [12]. Different water sources require other water treatment practices, therefore also influencing the boiler feed water quality [13,14,15]. In addition, the use of variable conditioning practices, such as dosing of film forming products (FFP), change the water quality in steam–water cycles [16,17,18,19]. It has been proven that corrosion inhibitors, such as oxygen scavengers and FFP, can also thermally degrade into organic acids [9,20,21,22,23]. Svoboda and Bodmer [4] detected 600 ppb of acetic acid by first condensate sampling experiments under normal plant operating conditions. In 2004, De Wispelaere [5] found 6000 ppb of acetic acid in the first condensate when adding alkalising amines and FFP to the steam–water cycle. However, due to the recent accelerations of climate change, the use of alternative water sources, new water treatment schemes and novel conditioning practices, organic acid concentrations in first condensates might already be higher in 2020 and could even further increase in the future. Therefore, corrosion issues in steam–water cycles should be studied even more closely.
The acidified first condensate in steam turbines can cause significant corrosion damage [24,25,26,27], such as acidic stress-corrosion cracking [28,29,30,31,32,33] and corrosion fatigue [34]. In addition, electrochemical impedance spectroscopy (EIS) indicated that acetic acid facilitates pitting of steam turbine steel in first condensates containing chlorides [35]. Furthermore, flow accelerated corrosion can be lowered when increasing the pH by lowering the organic acid concentration [34]. Hence, organic acids have a detrimental effect on the corrosion behaviour of steam turbines. Furthermore, corrosion can be promoted by accumulation of organic acids due to the cyclic process of the steam–water cycle [36,37], concentrating in the liquid first condensate by a factor of more than one hundred [38], local evaporation of condensate [34,39] and local concentrating in impurity traps such as crevices [34]. Gaining more insight on the impact of organic acids on the corrosion sensitivity of steam turbine steels is an absolute prerequisite for improved corrosion control and the avoidance of steam turbine failures.
It has been observed that each organic compound is vulnerable to hydrothermolysis to a different extent, as such leading to formation of different amounts and types of organic acids [40]. Therefore, not only the amount of total organic carbon (TOC), but also the type of TOC matters [41]. Several types of (organic) acids are present in steam–water cycles. Acetic acid and formic acid were found to be the main degradation products [2,6,8,9]. Furthermore, the presence of propionic acid [3,42] and butyric acid [9] have also been confirmed, as well as that of oxalic acid [9,43]. Savelkoul and van Lier [3] reported the presence of lactic acid in boiler water and turbine condensate. In addition, traces of glycolic acid in superheated steam were observed [42]. Even the presence of succinic acid has been reported [8]. Moed et al. [40] reported thermal stability to be key in determining the concentrations of each type of organic acid.
As a result, it is questioned whether the type of organic acid influences the corrosion sensitivity of steam turbine steel. One might think that the corrosion sensitivity is independent of the type of organic acid as long as the pH of the solution is the same. Otherwise, the (cation) conductivity of the solution has been put forward as dominant parameter in determining the SCC susceptibility of various steels in steam turbine phase transition zone environments [44,45]. Maeng and Macdonald [46] observed a linearity between the conductivity and the crack propagation rate of steam turbine steel in acetic acid solutions and concluded the importance of the conductivity in determining the SCC susceptibility of turbine steels. According to Ljungberg and Cubicciotti [47], a small increase in conductivity caused intergranular stress-corrosion cracking (IGSCC) of sensitised 304 stainless steel. Christman and Cragnolino [48] studied the effect of organic acids on the IGSCC of sensitised 304 stainless steel in high temperature aqueous solutions by using slow strain rate tests (SSRT). They reported an increased IGSCC in acetic acid, whereas formic and oxalic acids suppressed IGSCC [48]. For industry, knowledge on allowable types and concentrations of organic acids in steam–water cycles is very helpful to re-assess industrial guidelines and to design an appropriate water treatment to fulfil scientifically substantiated requirements for corrosion prevention and control.
In this work, the corrosion sensitivity of steam turbine steel is investigated for four organic acids: formic, acetic, propanoic and nonanoic acid. Acetic acid was chosen since it has been reported as main contributor of organic acids in the steam–water cycle chemistry [2,6,8,9]. Further, formic acid and propanoic acid have a shorter and longer hydrocarbon chain length, respectively. Finally, nonanoic acid has a much longer hydrocarbon tail than the others. In this way, the impact of the acid’s chain length on the corrosion behaviour will be evaluated. For this purpose, electrochemical measurements on steam turbine steel in different concentrations of the four organic acids will be performed. To investigate whether the pH is the main deciding factor, regardless of the type of organic acid, the corrosion behaviour in aqueous solutions with different types of organic acids, but with the same pH, will be investigated. It will be demonstrated to which extent the conductivity of the aqueous solutions containing different types of organic acids is influenced when having a same pH. As a consequence, it can be evaluated whether conductivity is the key factor in the corrosion behaviour of steam turbine steel. Furthermore, the SCC sensitivity is investigated with in situ four-point constant-extension tests with post mortem fractography by scanning electron microscopy (SEM). This technique will allow to investigate whether damage occurs in steam turbine steel when the steel is subjected to a sustained high load in an acidic aqueous environment containing organic acids. The influence of the type of organic acid will be examined by submersing the steam turbine steel under load in different organic acids with the same pH.

2. Materials and Methods

2.1. Steam Turbine Steel and Organic Acids

The steel used in this work was a NiCrMoV steam turbine steel of the type 27NiCrMoV15-6, with chemical composition given in Table 1, determined via spark source optical emission spectroscopy (SS-OES). The steam turbine steel was produced by following an industrial quenched and tempered (Q&T) treatment. This resulted in a tempered martensitic microstructure with precipitates. A more in-depth microstructural characterisation of NiCrMoV steam turbine steel can be found in previous work [49] or in the literature by other authors such as Gates et al. [50].
The four different organic acids used in this study, i.e., formic acid ( CH 2 O 2 ), acetic acid ( C 2 H 4 O 2 ), propanoic acid ( C 3 H 6 O 2 ) and nonanoic acid ( C 9 H 18 O 2 ), differ in several characteristics, such as hydrocarbon chain length, molar mass, density and boiling temperature. As can be seen in Table 2, increasing the chain length of the organic acid, results in a larger molar mass, a lower density and a higher boiling temperature.
To compare the impact of the different organic acids on the corrosion behaviour of the NiCrMoV steam turbine steel, aqueous solutions with the same pH, i.e., the same hydrogen proton concentration, were prepared using one organic acid at a time. Details on how these aqueous solutions were made as well as the consequences on the solutions’ conductivity are provided in the next section.

2.2. pH and Conductivity of the Aqueous Solutions

The (equilibrium) dissociation constant K d (M) of the dissociation reaction of a weak monoprotic acid HZ , cf. Equation (1),
HZ H + + Z
where, H + is a hydrogen proton and Z for the anionic part, can be determined via the standard Gibbs free energy Δ G 0 (J/mol), according to Equation (2),
Δ G 0 = RT   lnK d
where, R is the universal gas constant (8.314 J/K mol) and T is the temperature (K). The standard Gibbs free energy Δ G 0 can be calculated by knowing the standard enthalpy Δ H 0 (J/mol) and the standard entropy Δ S 0 (J/K mol), cf. Equation (3).
Δ G 0 = Δ H 0 T Δ S 0
The dissociation constant K d and pK d , according to Equation (4), for the different organic acids are shown in Table 3 [51].
pK d = logK d
Ostwald [52] proposed a relationship between the dissociation constant K d and the degree of dissociation α of a weak electrolyte. His dilution law for the dissociation reaction of a weak monoprotic acid HZ , cf. Equation (1), is given in Equation (5),
K d = [ H + ] [ Z ] [ HZ ] = α 2 1 α c
where, the square brackets denote concentration and c is the total concentration of electrolyte (mol/m³). Equation (5) can be solved to express the degree of dissociation α as a function of the dissociation constant K d and the total concentration of electrolyte c , according to Equation (6).
α = K d 2 c ( K d + 4 c K d )
For the different organic acids, the degree of dissociation α is plotted versus the total concentration of the electrolyte c in Figure 1. For a large total concentration of electrolyte c , i.e., for a very small degree of dissociation α , Equation (6) becomes Equation (7).
α = K d c .
Since only free ions can participate in the transport of current through a solution of an electrolyte, the degree of dissociation α can also be expressed in terms of molar conductivity Λ m [S m²/mol], cf. Equation (8) [53],
α = Λ m Λ 0
where, Λ 0 is the molar conductivity at infinite dilution, which corresponds to complete dissociation [54]. According to Kohlrausch’s law of independent ion migration, each ion is assumed to make its own contribution to the molar conductivity, irrespective of the nature of the other ion with which it is associated [54]. Therefore, the molar conductivity at infinite dilution Λ 0 can be written as the sum of the ion conductivities at infinite dilution, λ + 0 and λ 0 , for the cation and anion, respectively, cf. Equation (9) [54].
Λ 0 = λ + 0 + λ 0
The molar conductivity at infinite dilution Λ 0 was calculated for the different organic acids and can be found in Table 4.
The conductivity, also known as specific conductance, κ [S/m] of a solution containing one electrolyte is dependent on the molar conductivity Λ m and total concentration of the electrolyte c , cf. Equation (10).
κ = Λ m · c
When combining Equations (6), (8) and (10), the conductivity κ can be written as a function of the molar conductivity at infinite dilution Λ 0 , the dissociation constant K d and the total concentration of the electrolyte c , cf. Equation (11).
κ = Λ 0 K d 2 ( K d + 4 c K d )
In Figure 2, the conductivity κ is plotted versus the total concentration of the electrolyte c for the different organic acids. In case of high total concentrations of electrolyte c , i.e., for very small degrees of dissociation α , Equation (11) becomes Equation (12).
κ = Λ 0 K d   c .
The pH of an aqueous solution is determined by the concentration of protons, according to Equation (13).
pH = log [ H + ]
Based on Equations (5) and (6), the hydrogen proton concentration of the aqueous solution can also be approximated by Equation (14).
[ H + ] = α · c = K d 2 ( K d + 4 c K d )
It can be seen that depending on the type of organic acid, different total concentrations c are needed to prepare solutions with the same pH, due to their different dissociation constants K d , which are determined by thermodynamics. When taking Equation (11) into account, Equation (14) can be written as Equation (15).
[ H + ] = κ Λ 0
Since the molar conductivity at infinite dilution Λ 0 is roughly quite similar for the different organic acids, cf. Table 4, the conductivity κ of aqueous solutions with the same pH does not differ much for different types of organic acids. Test solutions of the different organic acids were prepared at four fixed pH values: 3.9, 3.4, 2.9 and 2.4. These four pH values were determined by calculating the pH of four concentrations of acetic acid: 1, 10, 100 and 1000 mM, respectively. Acetic acid was chosen as reference, because of its predominant contribution to the steam–water cycle chemistry due to its high thermal stability [2,9]. A concentration of 1 mM acetic acid (pH = 3.9) is one order of magnitude more concentrated than found in normal first condensate as reported by De Wispelaere [5] (6 ppm, pH = 4.5), to take the effect of deviating water quality into account. Such increased concentrations can become representative for practice, as amongst others climate change is leading to shifts towards alternative water sources with potentially deviating water quality [11,13,14,15]. Furthermore, higher acetic acid concentrations were investigated for the sake of fundamental evaluation. Based on the acetic acid concentrations, test solutions with the same pH values for the other organic acids were calculated and prepared. The total concentrations c and conductivities κ of these aqueous solutions are summarised in Table 5. It can be seen that for the same pH, significantly different concentrations of organic acids were required. The lowest concentration was needed for formic acid, which has the largest dissociation constant, whereas for nonanoic acid the highest concentration was needed due to its smallest dissociation constant, cf. Table 3. Furthermore, as can be seen in Table 5, conductivities were quite similar for test solutions with the same pH. These conductivities were confirmed by experimental conductivity measurements (WTW conductivity probe LR 925/01-P IDS). Therefore, when evaluating the impact of different types of organic acids by comparing solutions with the same pH, this also implies that the different organic acid types are compared at roughly the same conductivity.

2.3. Electrochemical Measurements

To study the corrosion behaviour, potentiodynamic scans were performed on NiCrMoV steam turbine steel at 25 °C in the different acidic aqueous solutions as shown in Table 5. Polarisation curves were obtained by using a potentiostat (Ivium CompactStat.h) and a three-electrode system: the steam turbine steel as working electrode (WE), a platinum gauze as counter electrode (CE) and a saturated leakless Ag/AgCl electrode (0.197 V vs. SHE (standard hydrogen electrode)) as reference electrode (RE). All measurements were performed at 25 °C and for all tests a scan rate of 5 mV/s was applied. Further details about both the set-up and method used for conducting electrochemical measurements can be found in previous work [49,55,56,57]. Faraday’s law, cf. Equation (16), was used to determine corrosion rates CR (µm/s),
CR = M n   F   ρ j corr
with, j corr (A/m²) the corrosion current density, F (96 485 C/mol) the Faraday constant, n the number of electrons in the reaction, M (g/mol) and ρ (7.87 g/cm³) the molar mass and the density of the steel, respectively. The corrosion current density j corr was determined at the intersection of corrosion potential E corr (V) and anodic Tafel-slope α a , M · f , according to Equation (17),
j = j corr ( e α a , M   f   η corr e α c , EA   f   η corr )
with, α a , M and α c , EA the anodic charge transfer coefficient of the metal M and the cathodic charge transfer coefficient of the electron acceptors EA , respectively, f equal to nF / RT with R (8.314 J/K mol) the universal gas constant and T (K) the temperature, η corr (V) the corrosion overpotential equal to E E corr (V). The Tafel relation indicates a linear relation between the potential and the logarithm of the current [58]. To illustrate the determination of the corrosion current density j corr , a polarisation curve with appropriate anodic Tafel plot is shown in Figure 3. After recording the polarisation curve (shown in blue), the corrosion potential E corr was determined (shown in green). At 100 mV above E corr , the Tafel plot (shown in black) was constructed as tangent of the polarisation curve. The intersection of Tafel plot and E corr (shown with a red dot) resulted in the corrosion current density j corr . The cathodic Tafel plot was not used for determination of the corrosion rate, since the total cathodic current might consist of multiple currents of coexisting reduction reactions [59]. The cathodic Tafel-slope, for example, falls short for a combination of the reduction of protons and oxygen. In contrast, the anodic Tafel-slope is only determined by the oxidation of the steel in the tested conditions. For each condition, a region of linearity on the polarisation curve at 100 mV above E corr was identified, as such justifying the method with Tafel plots. The effect of ohmic potential drops was negligible for the determination of corrosion rates. Electrochemical measurements were performed at least twice and repeated until a maximum standard deviation of 10 mV for the corrosion potential was obtained.

2.4. In Situ Four-Point Constant-Extension Tests

In situ four-point constant-extension tests were performed to gain information on the SCC sensitivity of steam turbine steel in acidic aqueous environments containing organic acid. These tests were based on ASTM G39, NACE TM0177 and NACE TM0284 standards [60,61,62]. Figure 4 shows a schematic representation of the in situ four-point constant-extension set-up, including a reference system.
The steam turbine steel was subjected to an extension, related to a σxx (maximal tensile stress at the surface) of 115% σy (yield strength = 820 MPa), and immersed in test solutions of formic acid, acetic acid and nonanoic acid at room temperature (pH = 3.4) for one month. After the tests, cross-sections were made for post mortem fractography. The cross-sectional surface (x-z plane) was polished. To investigate the presence of (stress-corrosion) cracks, post mortem SEM analysis (Quanta FEG 450—spot size of 5 nm and accelerating voltage of 20 kV) was performed.

3. Results and Discussion

3.1. Corrosion Behaviour

Representative polarisation curves of NiCrMoV steam turbine steel in the different types of organic acids, i.e., formic, acetic, propanoic and nonanoic acid, at the four pH values as given in Table 5, i.e., pH 3.9, 3.4, 2.9 and 2.4, are shown in Figure 5 and Figure 6. Potentials E (V vs. SHE) are plotted versus their current density j (μA/cm²). In Figure 5, polarisation curves are grouped by organic acid: (a) formic acid, (b) acetic acid, (c) propanoic acid and (d) nonanoic acid. Alternatively, potentiodynamic curves are grouped by pH in Figure 6: (a) pH 3.9, (b) pH 3.4, (c) pH 2.9 and (d) pH 2.4.
Corrosion rates (µm/year) of these 16 situations were determined and are summarised in Figure 7 and Table 6. As described in previous work [49], the corrosion rate of the NiCrMoV steam turbine steel in demineralised water without acids was determined to be about 1.3 µm/year. Two interesting trends can be noticed in Figure 7. (i) When lowering the pH, the corrosion rate increases for formic, acetic as well as for propanoic acid, whereas the corrosion rate in nonanoic acid stays virtually the same. (ii) For solutions with the same pH, the corrosion rate differs depending on the type of organic acid. The ranking of the corrosion rates for the different types of organic acids is similar for each pH value. The sequence is always ‘formic acid, acetic acid, propanoic acid, nonanoic acid’ (from the highest to the lowest corrosion rate). These two trends will be discussed in more detail in the next sections.

3.2. Influence of Organic Acid Concentration

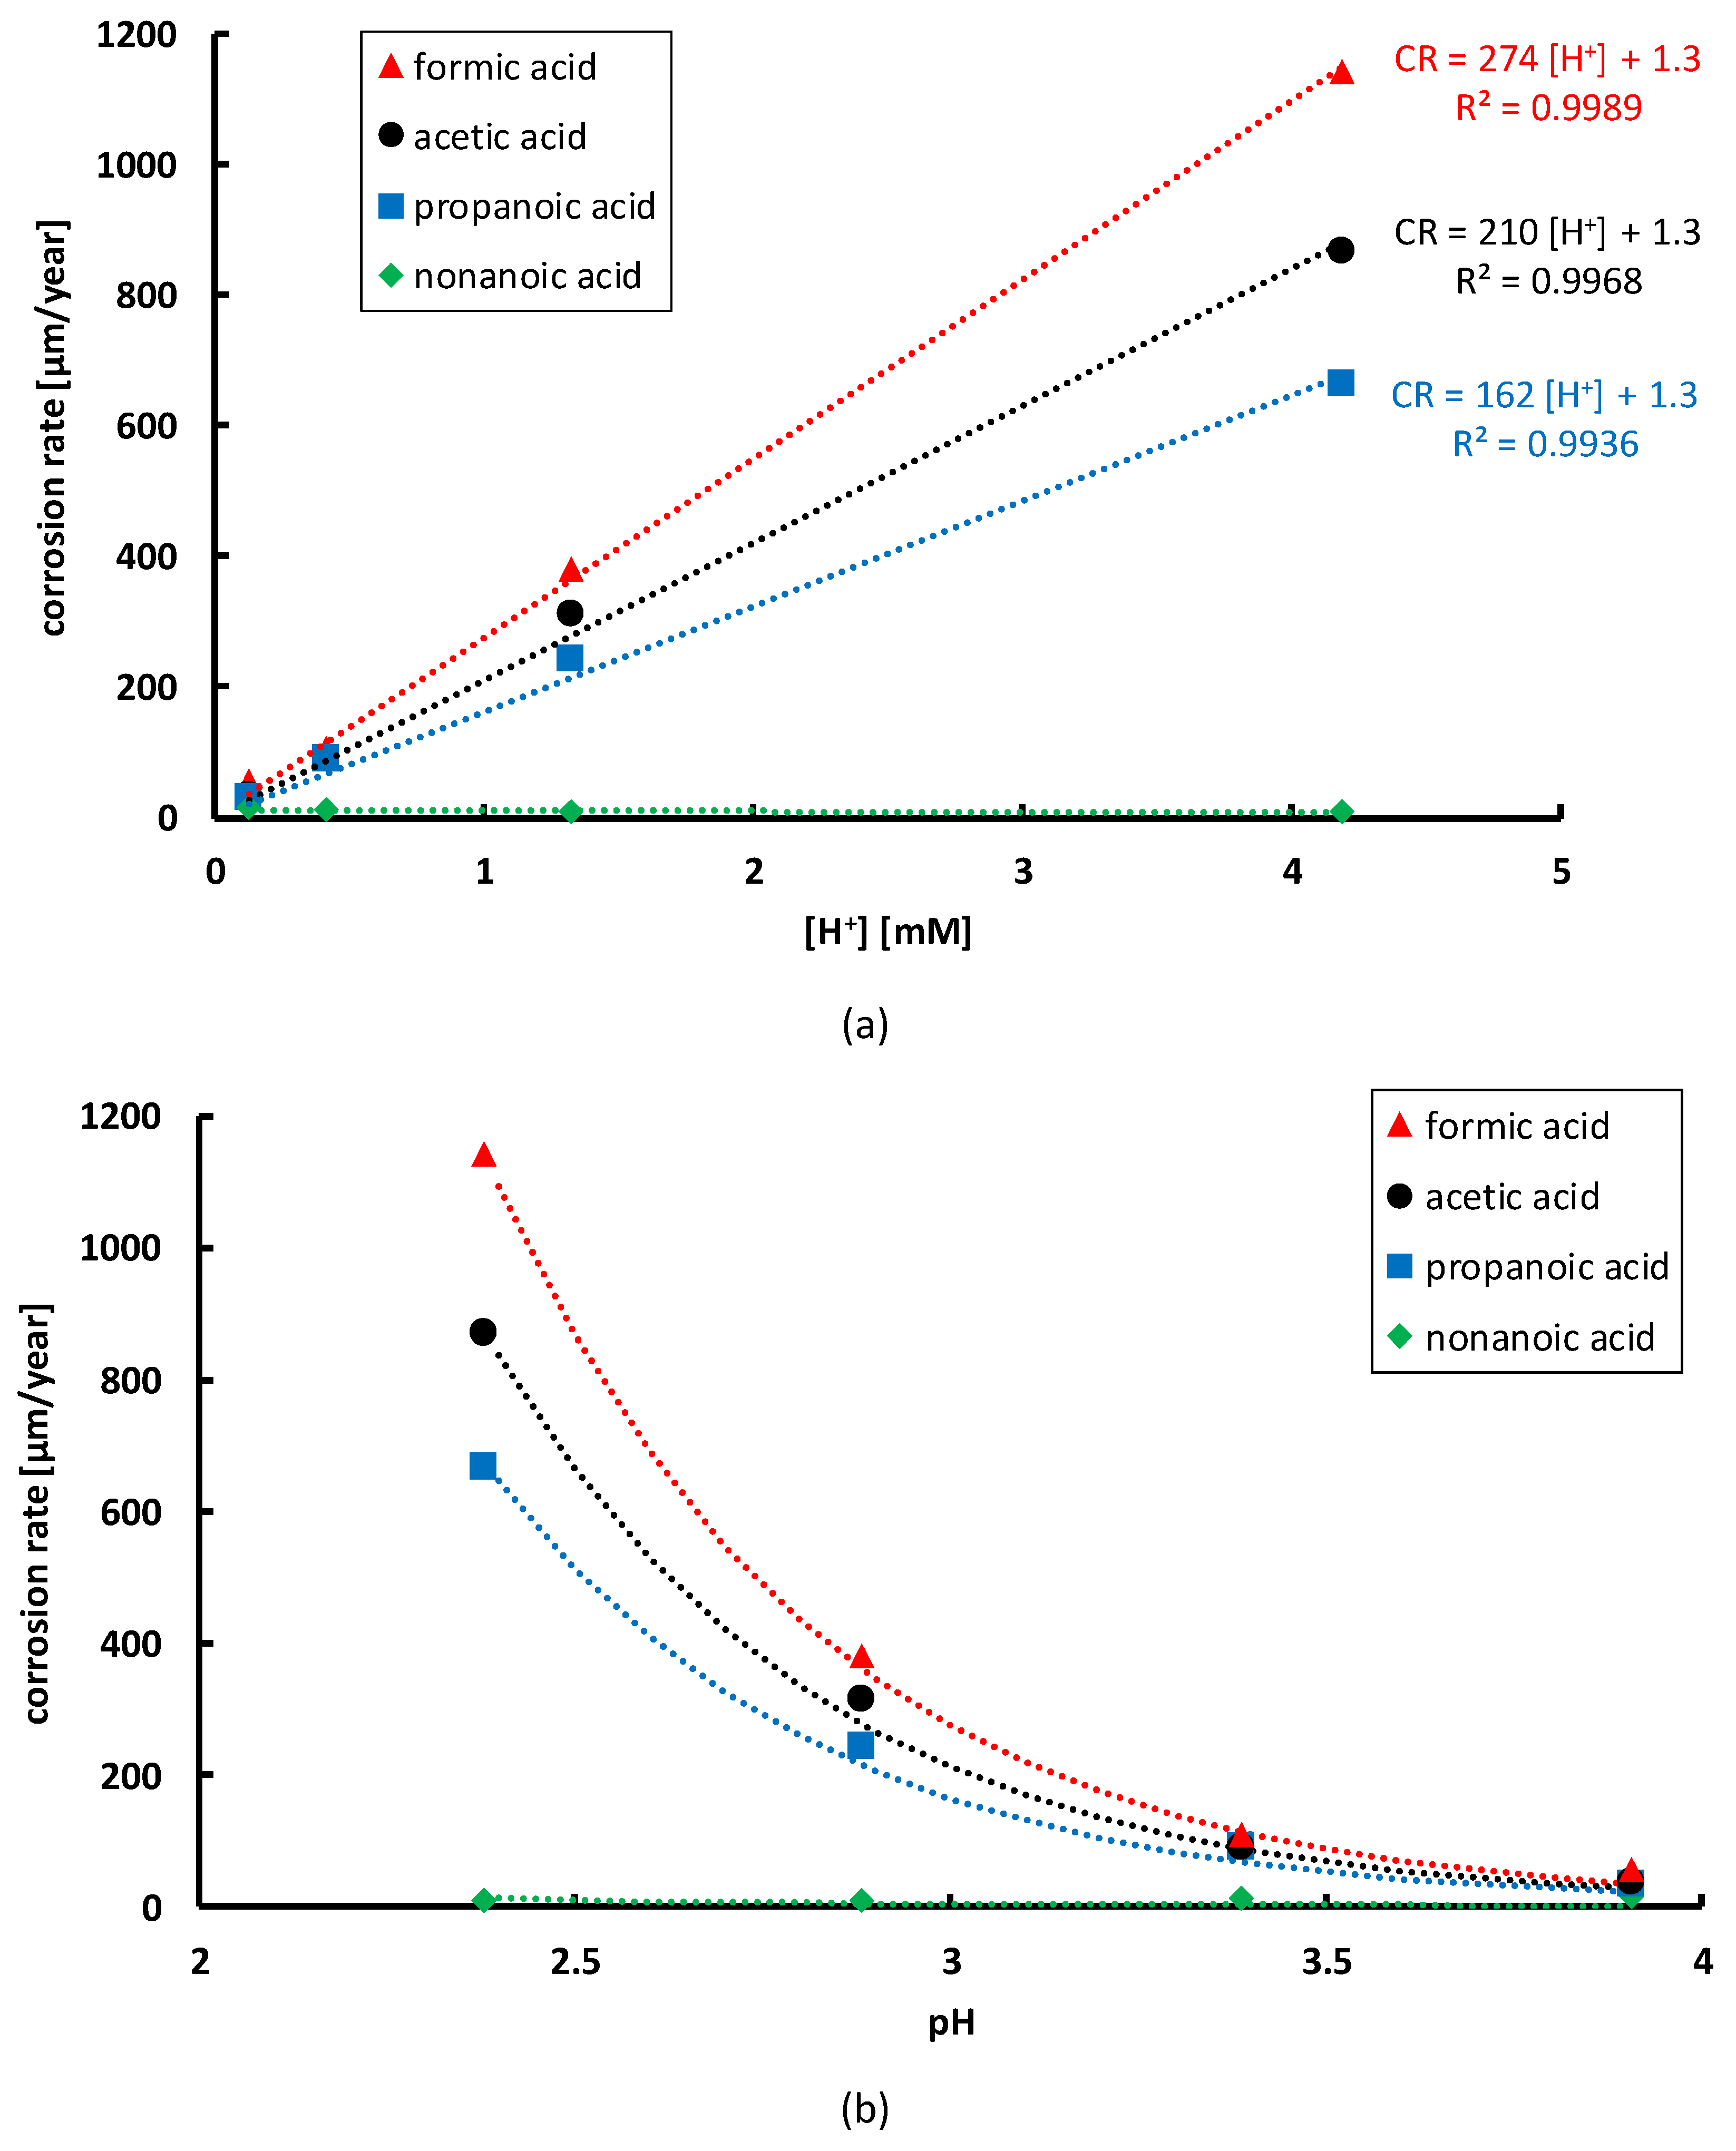
To investigate the effect of the organic acid concentration on the corrosion rate of NiCrMoV steam turbine steel in the different acids, the corrosion rates are plotted versus the hydrogen proton concentration in Figure 8a, as well as versus the pH in Figure 8b. The relation between the organic acid concentration and the hydrogen proton concentration is given by Equation (14), whereas the link with pH is given by Equation (13). Linear relationships between corrosion rate CR (µm/year) and hydrogen proton concentration [ H + ] (mM), according to Equation (18), can be identified [49,56,57].
CR = a · [ H + ] + b
As can be seen in Figure 8a, the steepest increase in corrosion rate with increasing hydrogen proton concentration is observed for formic acid, followed by acetic and propanoic acid. For nonanoic acid, no increase in corrosion rate was observed. Moreover, even a small decrease in corrosion rate with increasing concentrations was measured for nonanoic acid, as can be seen in Figure 7. Therefore, no trend line for nonanoic acid is given in Figure 8. When combining Equations (13) and (18), the corrosion rate can be written as a function of the pH, according to Equation (19).
CR = a · 10 pH + b
This correlation is visualised in Figure 8b. Lowering the pH has a large influence on the corrosion rate of the NiCrMoV steel and it is clear that this influence is dependent on the type of organic acid.
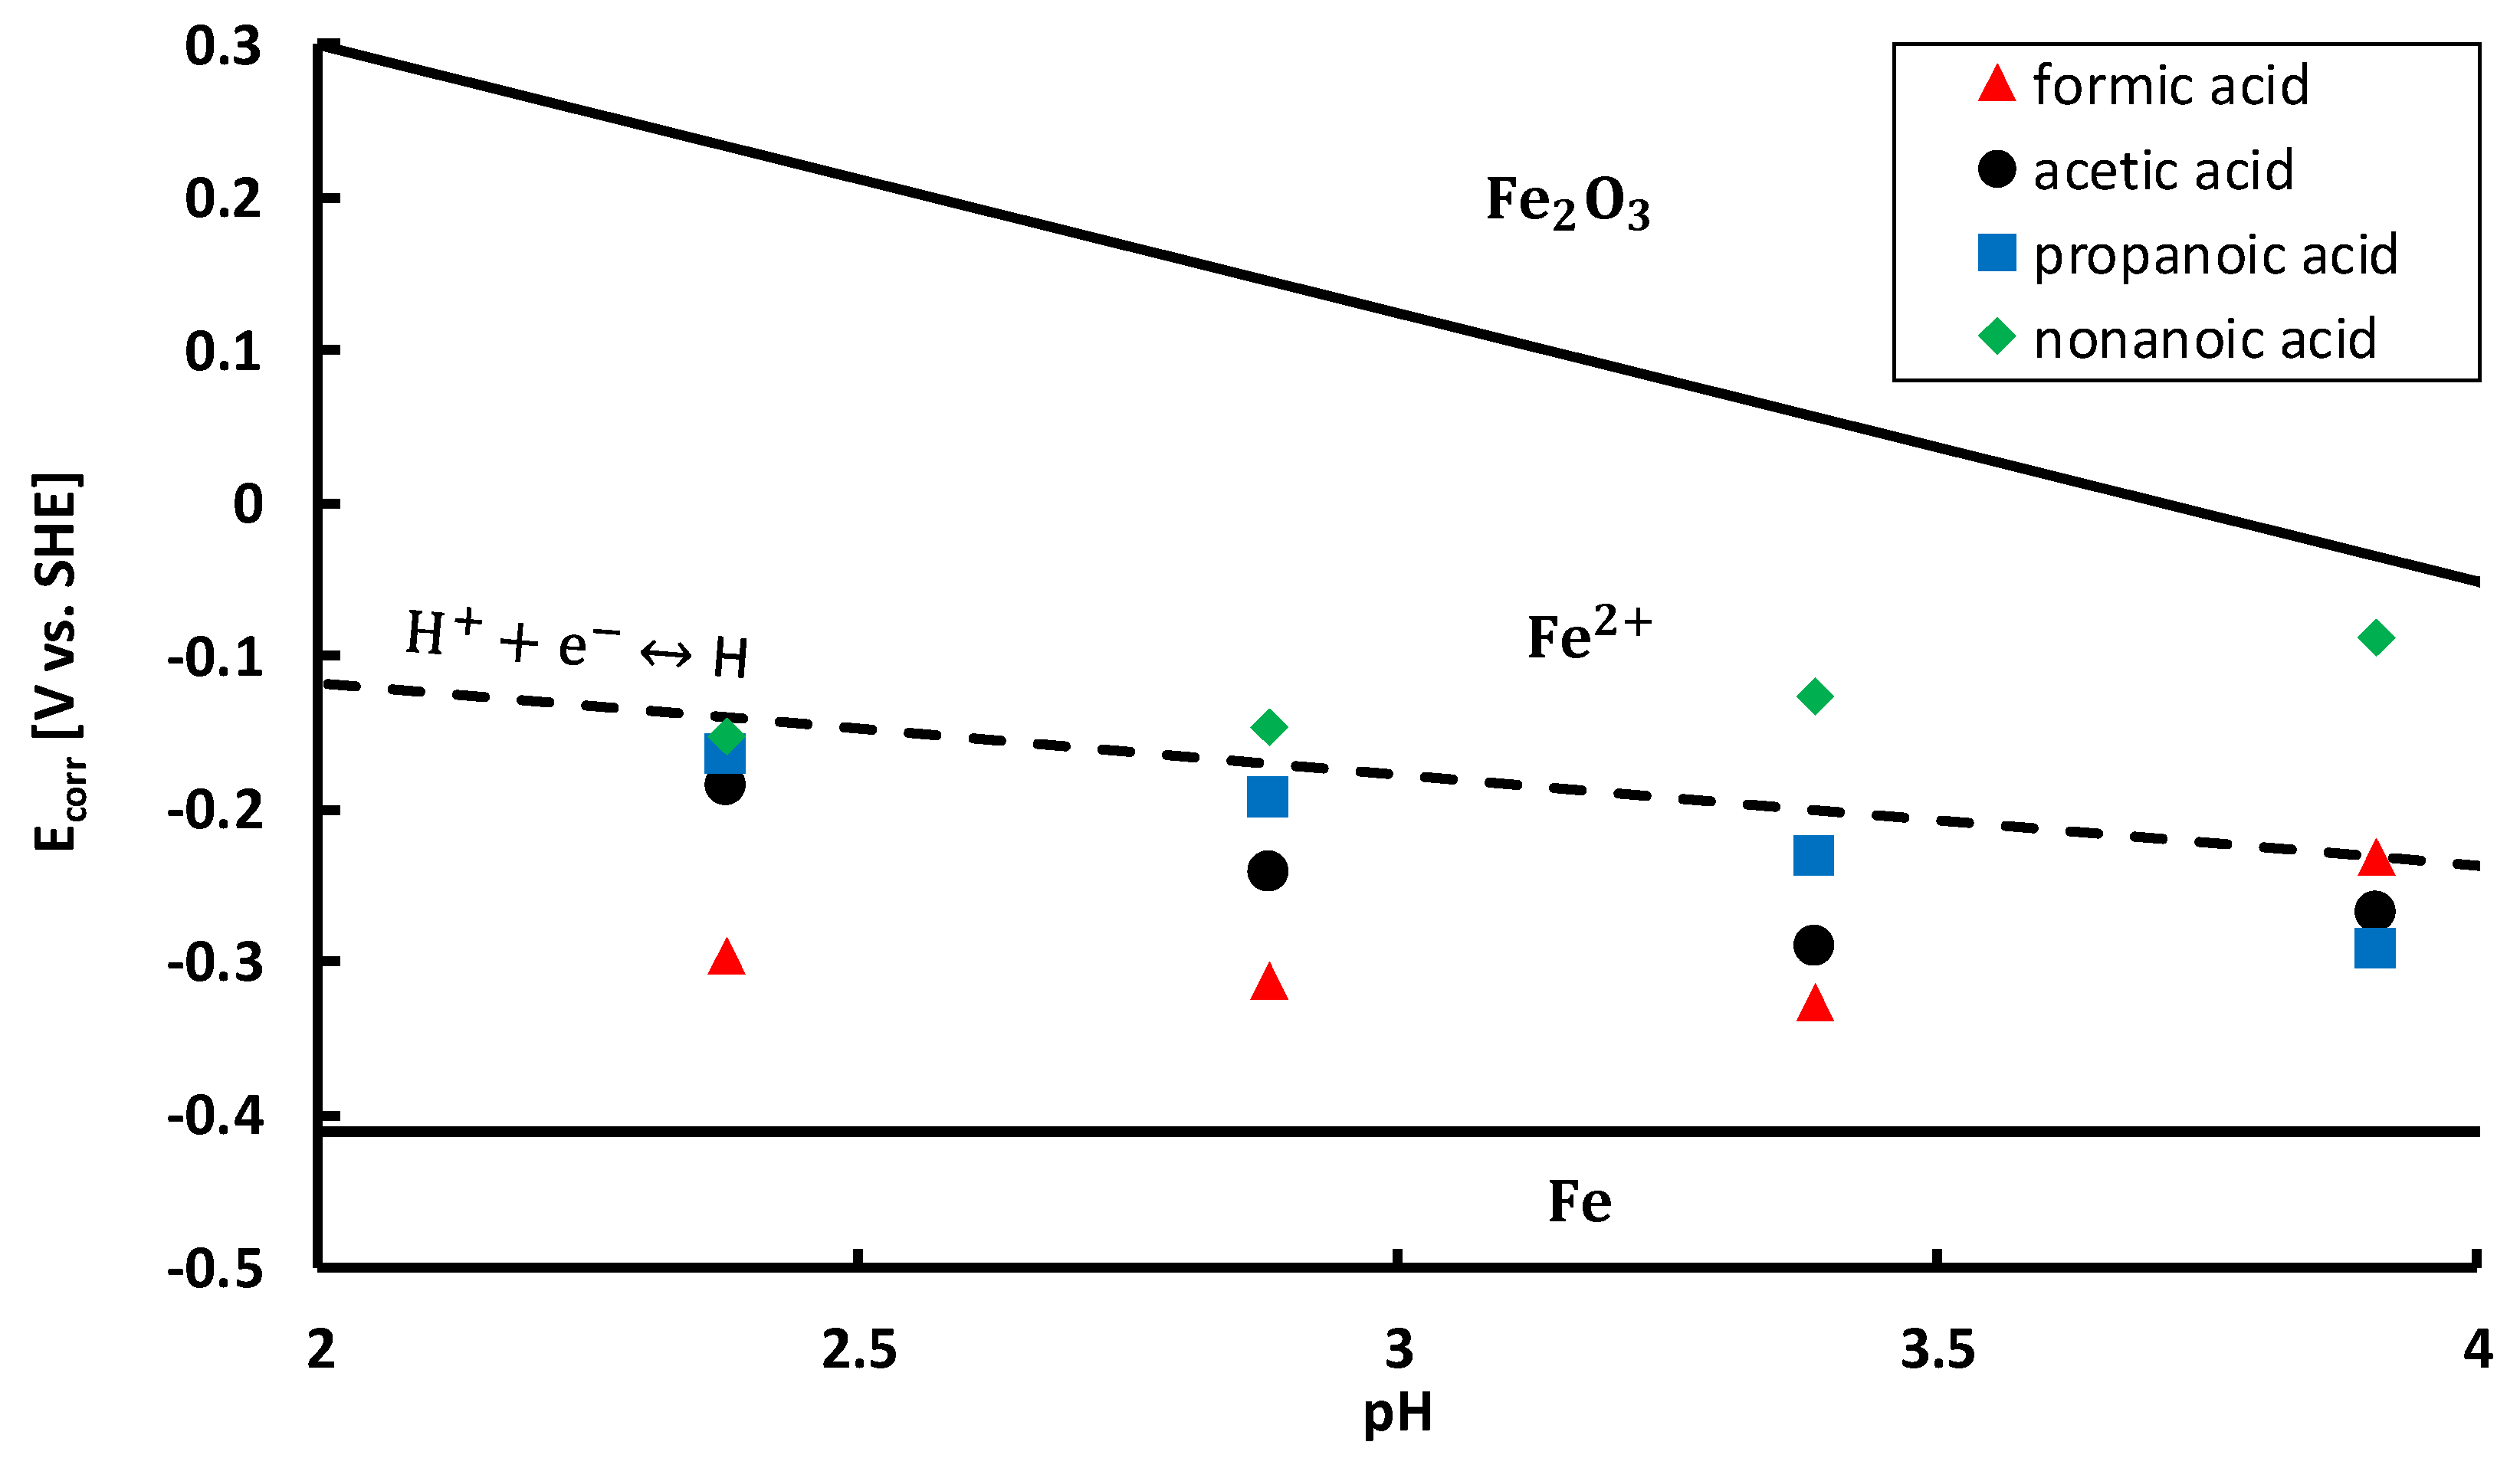
To gain more insight in the active corrosion mechanisms, corrosion potentials E corr (V) were measured and plotted on a Pourbaix diagram [63,64,65,66,67,68,69]. Corrosion potentials of the acidic aqueous solutions, given in Table 5, were determined from the polarisation curves and included on a Pourbaix diagram in Figure 9. The Pourbaix diagram was constructed based on thermodynamic data from FactSage©. The diagram was calculated for iron at 25 °C with an iron molality of 1. Thermodynamically stable forms of iron are delimited by solid black lines. All corrosion potentials are situated in the Fe 2 + region, i.e., above the iron oxidation reaction line, cf. Equation (20).
Fe Fe 2 + + 2 e .
As such, anodic dissolution of the steel takes place in all conditions. The anodic reaction is coupled with at least one reduction reaction in a redox system. All corrosion potentials are situated below the oxygen reduction reaction line, cf. Equation (21).
O 2 + 4 H + + 4 e 2 H 2 O
This line is not shown in Figure 9, since it is situated at higher potentials, according to the Nernst equation for the oxygen reduction reaction at 25 °C, cf. Equation (22),
E 0 = 1.23 0.059   pH   ( V   vs .   SHE )
where, E 0 (V vs. SHE) is the equilibrium potential. Since all corrosion potentials are situated below the oxygen reduction reaction line, the reduction of oxygen takes place in all tested conditions. Furthermore, almost all corrosion potentials, except for most of the nonanoic acid solutions, are also located below the hydrogen proton reduction reaction line, cf. Equation (23) (Volmer reaction) [65,66].
Volmer   reaction   H + + e H
This means that in almost every situation, protons are reduced to atomic hydrogen, as a second reduction reaction in the redox system. Hydrogen atoms adsorbed on the metal surface can recombine by chemical desorption (Tafel reaction), cf. Equation (24), recombine by electrochemical desorption (Heyrovsky reaction), cf. Equation (25), or absorb into the steel, cf. Equation (26) [65,66].
Tafel   reaction   2   H ads   H 2
Heyrovsky   reaction   H ads +   H + +   e     H 2
H ads   H abs
Hydrogen absorption into steel, followed by hydrogen diffusion through the lattice, can cause hydrogen embrittlement [70,71,72,73]. Based on the positioning of the corrosion potentials in Figure 9 and the corrosion rates in Figure 7, the most significant hydrogen embrittlement would be expected in formic acid, followed by acetic acid, propanoic acid and nonanoic acid. Moreover, in most conditions of nonanoic acid, no hydrogen embrittlement of the steam turbine steel would be expected.
Knowing that protons participate in the reduction reactions of the corrosion process, cf. Equations (21) and (23), the linear correlation between corrosion rate and hydrogen proton concentration, cf. Equation (18) and Figure 8a, can be substantiated with formulas. According to Faraday’s law, cf. Equation (16), the corrosion rate is proportional to the corrosion current density j corr (A/m²). The current density j (A/m²) is related to the reaction rate v (mol/m²s) via Equation (27).
j = n   F   v
Furthermore, the rate equation for an electrochemical reaction can be written as Equation (28),
v = k O c R , 0 k R c O , 0
where, k O (m/s) and k R (m/s) are the rate constants for oxidation and reduction, respectively, whereas c R , 0 (M) and c O , 0 (M) are the concentrations of reductant and oxidant at the electrode surface, respectively. Therefore, concentrations of reacting species have a large influence on the reaction rate v , current density j , as well as on the corrosion rate. Although the kinetics of the oxygen reduction reaction and hydrogen proton reduction reaction are different, the hydrogen proton concentration plays an important role in both reactions.
The kinetics of the oxygen reduction reaction in these conditions are determined by mass transfer [59,74]. The limiting current density j L (A/m²) can be written as Equation (29),
j L = n   F   k D   c O , b
where, c O , b is the concentration of oxidant in the bulk of the aqueous solution and k D (m/s) is the mass transfer coefficient, equal to Equation (30),
k D = D δ
where, δ (m) is the thickness of the diffusion layer and D (m²/s) is the diffusion coefficient of the reacting species, according to Equation (31),
D = D 0   e Δ G D RT
where, D 0 (m²/s) is a temperature-independent pre-exponential and Δ G D (J/mol) is the activation energy for diffusion. The kinetics of the oxygen reduction reaction, cf. Equation (21), can be limited by oxygen diffusion, but also by hydrogen proton diffusion [75,76]. In the latter case, the limiting current density increases when increasing the hydrogen proton concentration in the bulk solution, cf. Equation (29).
In contrast, the kinetics of the hydrogen proton reduction reaction are determined by the charge transfer rate. For this situation, the current density can be written according to the Butler–Volmer equation, cf. Equation (32),
j = n   F   ( k O , 0   e α a nFE RT c R , 0 k R , 0   e α c nFE RT c O , 0 )
where, α a and α c are the anodic and cathodic charge transfer coefficients, respectively; k O , 0 (m/s) and k R , 0 (m/s) are equilibrium rate constants for oxidation and reduction, respectively. The reaction rate constants k (m/s) typically follow an Arrhenius equation, cf. Equation (33),
k = A   e Δ G RT
where, A (m/s) is a pre-exponential factor and Δ G (J/mol) is the activation energy for the reaction. Note the similarity of Equation (31) and Equation (33). The concentration of oxidant c O , 0 in the Butler–Volmer Equation of Equation (32) can be identified with the hydrogen proton concentration in the hydrogen proton reduction reaction (Volmer reaction), cf. Equation (23). As such, increasing the hydrogen proton concentration leads to an increase in current density. In addition, as can be seen in Figure 9, it must be taken into account that also the equilibrium potential E 0 of the hydrogen proton reduction reaction is dependent on the hydrogen proton concentration, cf. Equation (13) and the Nernst equation of the hydrogen proton reduction reaction at 25 °C, given in Equation (34) [49].
E 0 = 0.059   pH   ( V   vs .   SHE )
The concentration dependent equilibrium potential E 0 is present in the Butler–Volmer equation of Equation (32) since the potential E (V) is equal to E 0 + η (V), with η (V) the overpotential.
Therefore, when increasing the hydrogen proton concentration, the current densities of both the oxygen reduction reaction and the hydrogen proton reduction reaction, according to Equations (29) and (32), respectively, roughly increase linearly. When taking into account Faraday’s law, cf. Equation (16), this also leads to a linear increase in corrosion rate with increasing hydrogen proton concentration, as such explaining the linear correlation observed in Figure 8.

3.3. Influence of Organic Acid Type

Another remarkable observation is the difference in corrosion rate depending on the type of organic acid, for solutions with the same pH, as can be seen in Figure 7 and Figure 8. The rate of metal dissolution is determined by the kinetics of the reduction reactions. Based on the location of the corrosion potentials, cf. Figure 9, protons are consumed by both reduction reactions, cf. Equations (21) and (23). When protons are consumed, new protons are produced by organic acid dissociation, according to the principle of Le Chatelier. Hence, protons are continuously consumed and produced during the corrosion process. Therefore, the rate of acid dissociation, which depends on the type of organic acid, plays an important role. The equilibrium dissociation constant K d can be written as the quotient of the dissociation rate constant k d (s−1) and the association rate constant k a (M−1 s−1), cf. Equation (35).
K d = k d k a
Values of k d and k a for formic, acetic and propanoic acid are given in Table 7 [77,78,79]. It can be seen that a larger equilibrium dissociation constant K d corresponds with a larger dissociation rate constant k d for these organic acids. The organic acid with the largest dissociation rate constant k d , i.e., formic acid, can produce protons the fastest, which means that protons are again the earliest available for the reduction reactions, as such explaining the larger corrosion rate in formic acid, followed by acetic acid and propanoic acid, cf. Figure 7 and Figure 8. Although the solutions of different types of organic acids were prepared in such a way that their concentrations were balanced taking into account their different equilibrium dissociation constants, cf. Equation (14), as such incorporating thermodynamics, their difference in kinetics of acid dissociation still has a significant impact on the corrosion process. In 
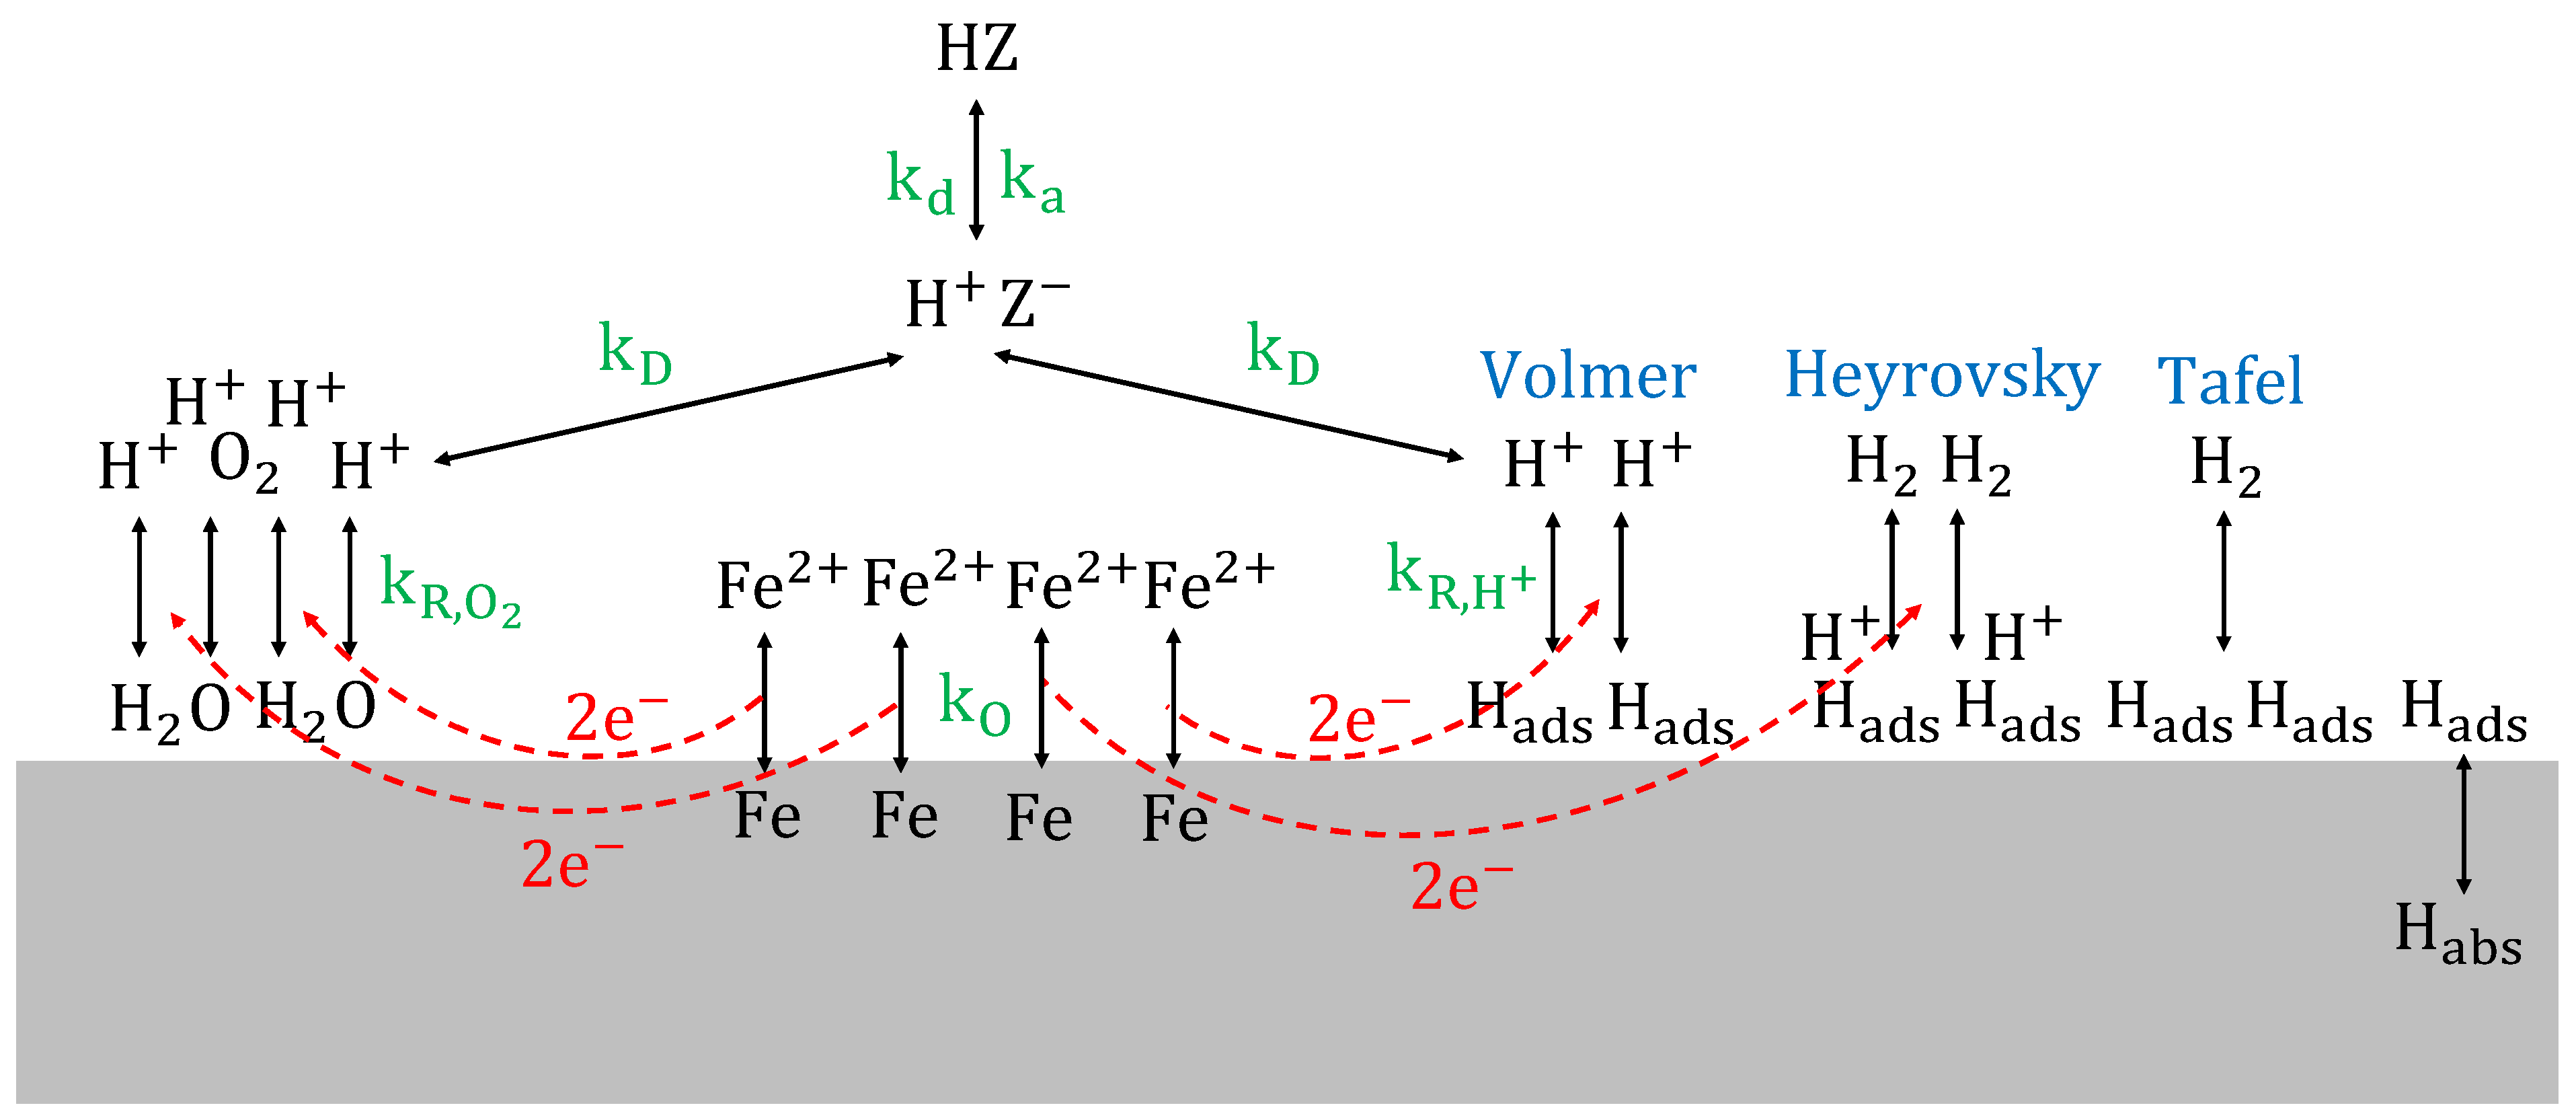
Figure 10, the acid dissociation reaction, acting as the rate determining step in the corrosion of steam turbine steel in organic acid solutions, is schematically represented.
The influence of the dissociation constant K d of the different organic acids on the overall kinetics of the corrosion process can be represented in a similar way as the Brønsted catalysis equation. The Brønsted catalysis equation constitutes the first linear free-energy relationship, i.e., Gibbs energy relation [80]. It gives a relationship between acid strength (dissociation constant K d ) and catalytic activity (reaction rate constant k ) in general acid catalysis, cf. Equation (36) [81,82],
log ( k ) = μ log ( K d ) + ν
where, μ is the slope and ν is the intercept. This equation implies that the strongest acids are the most effective in producing protons, as such contributing the most to reaction rate acceleration. In this work, the reaction rate constant k of Equation (36) can be represented by an Arrhenius relation, cf. Equation (37),
k t = A t   e Δ G t RT
where, k t (m/s), A t (m/s) and Δ G t (J/mol) are the reaction rate constant, the pre-exponential factor and the activation energy of the total reaction, respectively. When combining Equations (2), (36) and (37), it can be seen that the Gibbs free energy for proton dissociation Δ G 0 is proportional to the activation energy of the overall reaction Δ G t , as such resulting in a relationship according to the Evans–Polanyi principle, cf. Equation (38) [83,84],
Δ G t = σ   Δ G 0 + τ
where, σ is the slope and τ is the intercept. Therefore, a larger (i.e., more negative) Gibbs free energy for proton dissociation Δ G 0 , i.e., favoured thermodynamics, corresponds with a decrease in activation energy Δ G t , i.e., enhanced kinetics, which is in accordance with the experimental observations for the different organic acids, as such confirming Figure 7 and Figure 8.
Furthermore, the hydrocarbon chains of the organic acids can also influence the corrosion behaviour. Especially for nonanoic acid a lot of long chains were present in the test solutions due to its large molar mass, cf. Table 2, and its small dissociation constant, cf. Table 3, as such requiring large concentrations of nonanoic acid to obtain a certain low pH, according to Equations (13) and (14). Nonanoic acid, also known as pelargonic acid, has been reported to form an emulsion in water [85]. Without emulsifiers, such as surfactants, an unstable nonanoic acid emulsion progressively separates, and hydrocarbon chains can gather at the metal surface. Increased van der Waals interactions between long hydrocarbon chains and the charge density of the surface film can induce a change in local pH at the surface compared to bulk values [86,87,88]. As a result of the gathering at the metal surface, hydrocarbon chains can block the surface active sites for corrosion, as such acting as a corrosion inhibitor [89,90,91,92]. This can explain the low corrosion rates observed in Figure 7 and Figure 8. Moreover, when lowering the pH of the nonanoic solution, a decrease in corrosion rate can be noticed. When decreasing the pH, the effect becomes more pronounced due to the increasing nonanoic acid concentration, as such even more shielding the metal surface from its environment.
It must be mentioned that the oxygen concentration in the first condensate of steam–water cycles is much lower than in the tested solutions because of the partitioning of oxygen between the steam and liquid phases in the low-pressure steam turbine section [2]. The International Association for the Properties of Water and Steam (IAPWS) [2] reported that oxygen levels in the first condensate might be lower than 1 ppb for steam inlet oxygen levels of 150 ppb. However, the solutions were not deaerated in this study. The main goal of this study was to evaluate whether, next to the role of the concentration of organic acid, the type of organic acid also matters in terms of corrosion behaviour for steam turbine steel in an acidic aqueous environment with a certain pH. To investigate this, no deaeration of the solutions was required. Nevertheless, electrochemical measurements in deaerated conditions are recommended for more industrially relevant quantitative corrosion rates.
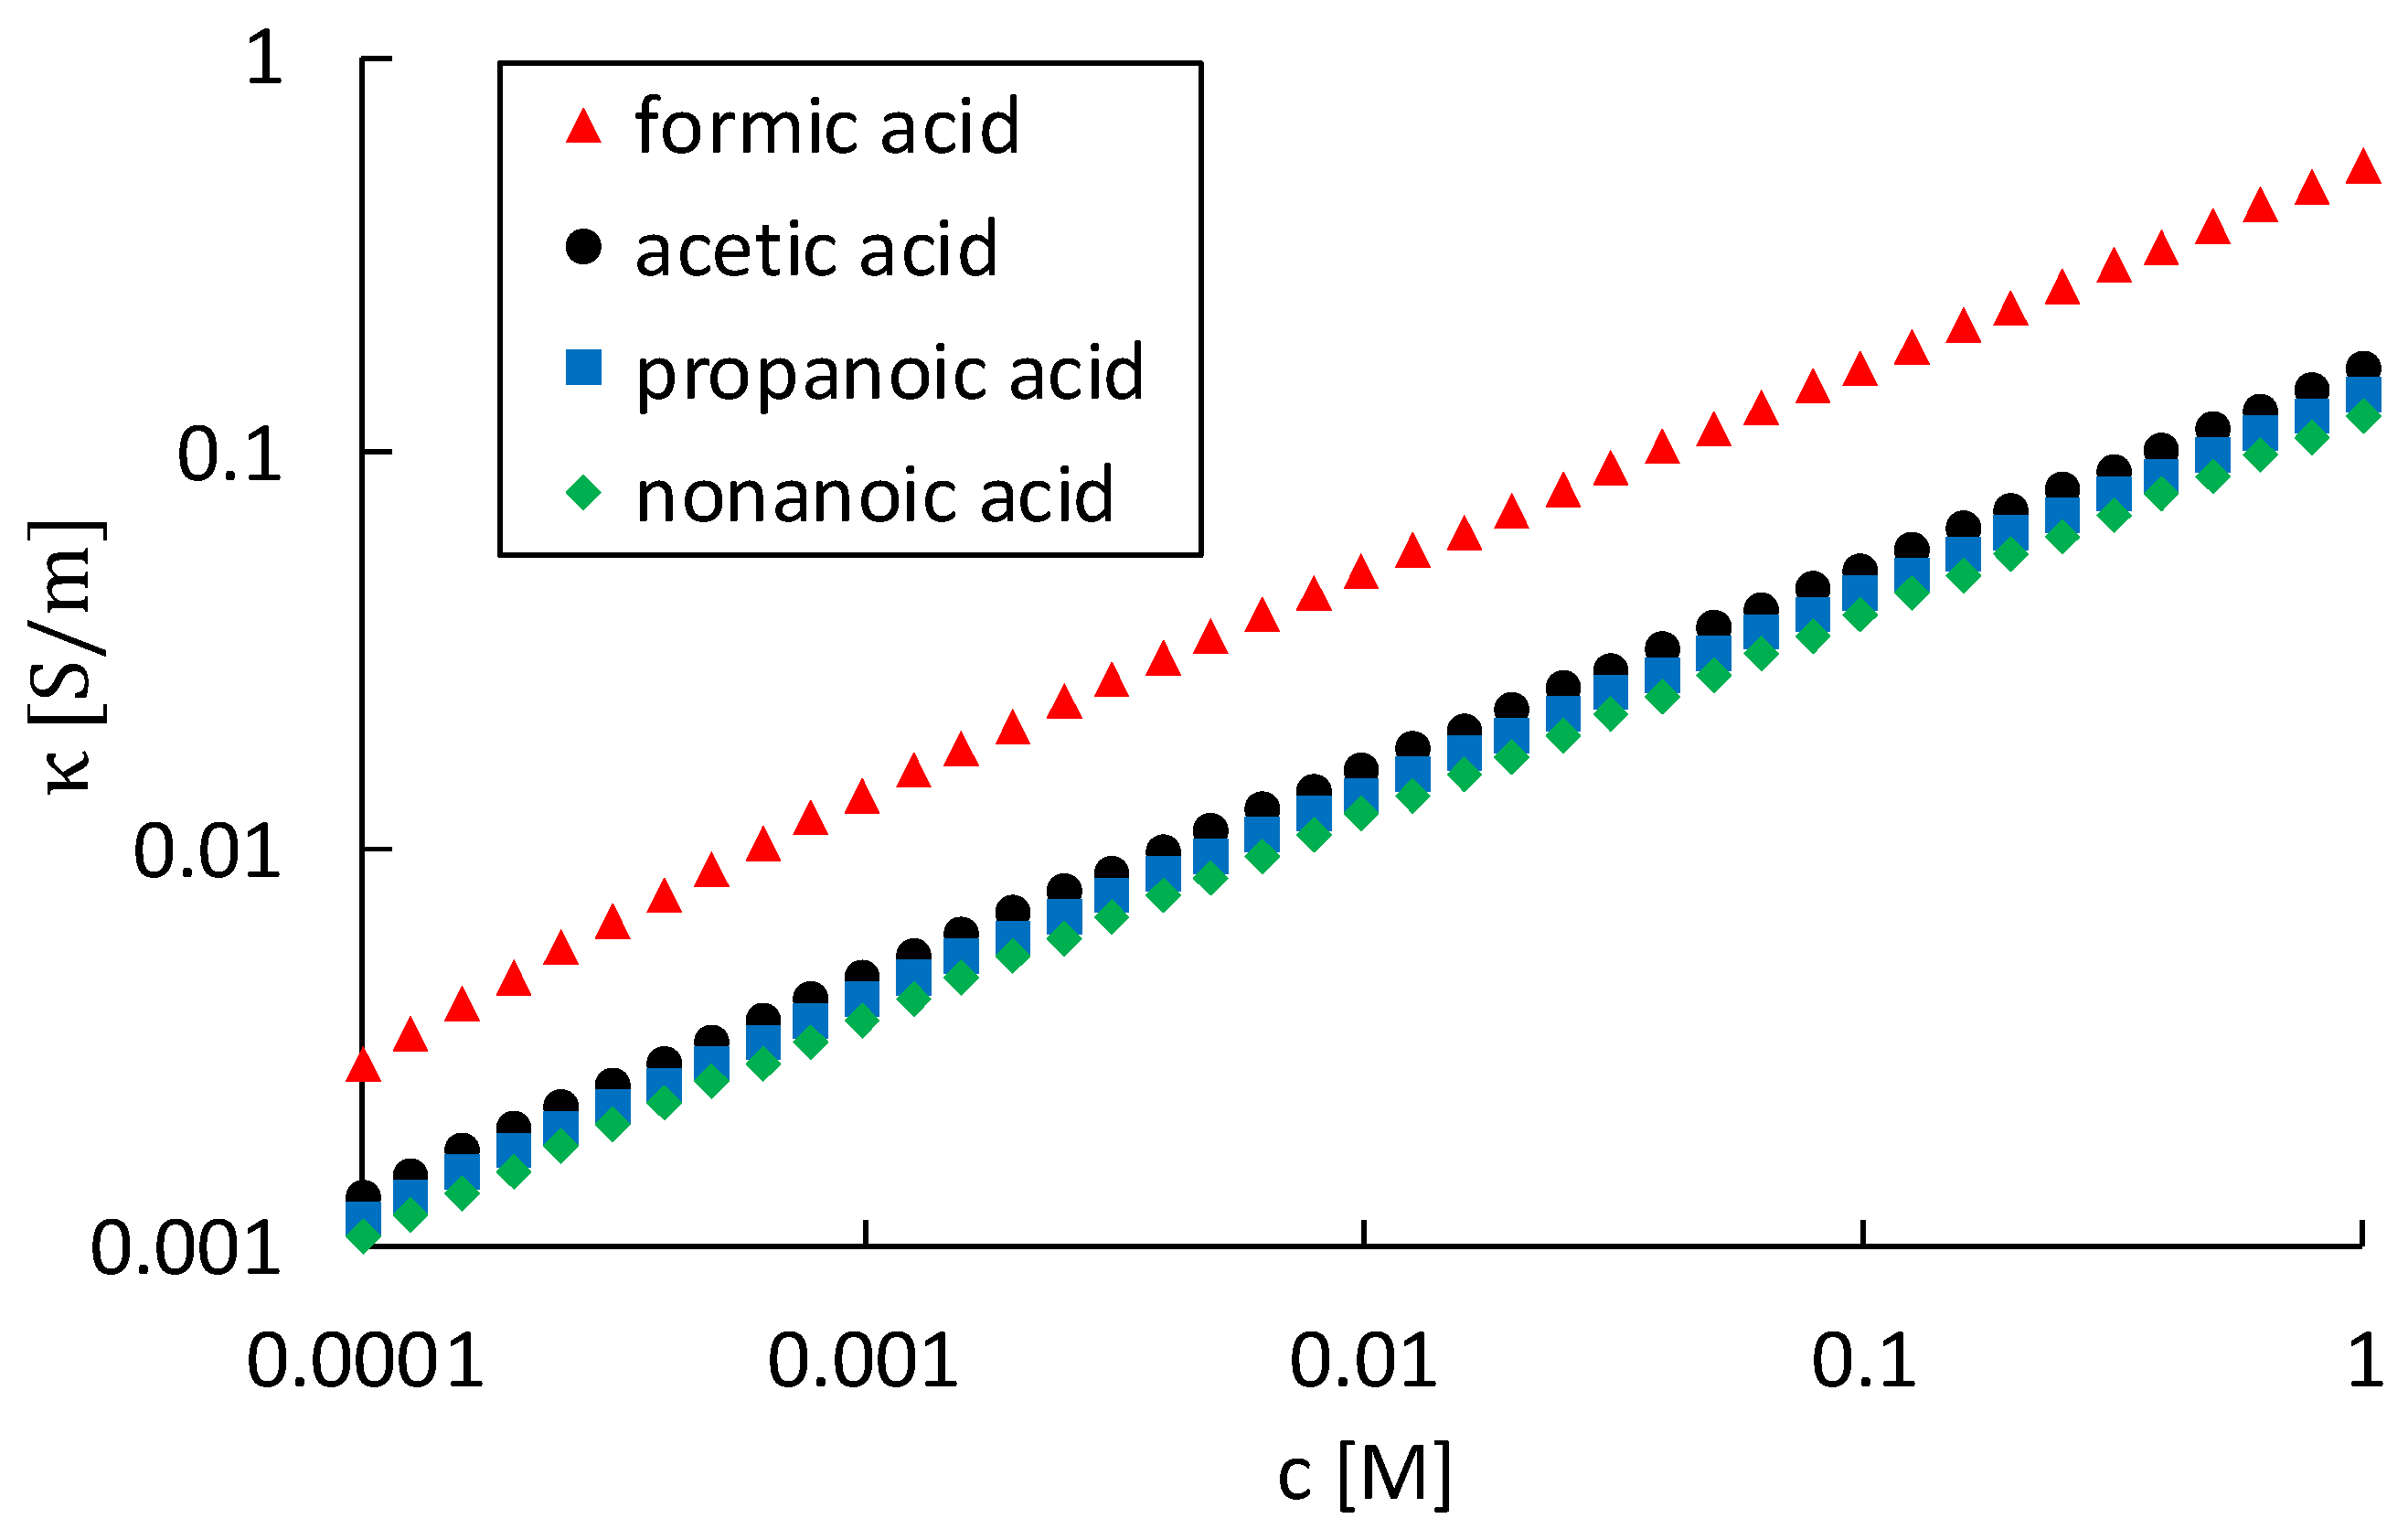
Conclusively, the experiments were designed to compare solutions of organic acids with the same pH, i.e., similar conductivity, according to Table 5. Based on the findings in this work, it can be stated that using (cation) conductivity as a guide value for general corrosion behaviour in steam–water cycles is only partially correct, cf. the increase in corrosion rate when increasing the organic acid concentration, cf. Figure 7 and Figure 8. However, based on these graphs, it can be seen that it is also important to know the type(s) of organic acids present in the aqueous solution, especially at low pH, i.e., at high organic acid concentrations. Therefore, drawing conclusions for corrosion monitoring on (cation) conductivity measurements alone fall short to some extent. By only measuring the conductivity, no information is gained on the composition of the organic acids, thus lacking information about the active dissociation kinetics, which play a crucial role. An inherent problem in practice is that organic acids with long chains are less stable at high temperatures, as such leading to a shift towards small, more corrosive, organic acids [40]. Unfortunately, knowing the exact composition of the aqueous environment is not at all straightforward in industry. Nevertheless, screening which compounds are detrimental on a fundamental level, combined with goal-oriented measurements of their concentrations, seems feasible. In this way, industrial guidelines should be re-assessed, and appropriate water treatments can be designed, as such aiming for a better corrosion prevention and control in steam–water cycles and beyond.

3.4. SCC Sensitivity

Cross-sections of the steam turbine steel after the in situ four-point constant-extension tests for one month in formic acid, acetic acid and nonanoic acid, are given in Figure 11a–c, respectively. Degradation was observed for all the organic acid solutions. The average degradation depth (cf. Table 8) showed an increasing trend from nonanoic acid (6 µm) to formic acid (32 µm), which can be linked to the increasing corrosion rate from nonanoic acid (12 µm/year) to formic acid (107 µm/year) (cf. Figure 7) for a pH of 3.4. Table 8 also shows the measured CR of steam turbine steel in formic acid, acetic acid and nonanoic acid (pH = 3.4) converted to µm/month. The average degradation depth, however, was generally higher than the CR per month. This phenomenon can be attributed to the synergetic effect of corrosion and stress.
Cracks were observed on the cross-sections of steam turbine steel tested in formic acid (cf. Figure 12a) and nonanoic acid (cf. Figure 12b). No cracks were found in the cross-section of acetic acid. Since nonanoic acid showed a low CR and it is known to shield the metal from its environment, no severe corrosion was expected. Indeed, the surface remained relatively intact after one month of submersion in nonanoic acid. However, perpendicular cracks were found that can be linked to SCC (cf. Figure 12b). No cracks were observed in acetic acid, because the CR was presumably high enough to even out the cracks by anodic dissolution. Only general corrosion was observed.
In formic acid, therefore, no cracks were expected, since the CR is even larger than for acetic acid. Yet cracks were observed on the cross section of steam turbine steel tested in formic acid (cf. Figure 12a). However, the observed cracks were parallel rather than perpendicular to the surface. Another factor was, therefore, contributing to the formation of cracks in formic acid. On top of the general degradation, that was also observed in acetic acid, more local degradation, caused by the high amount of anodic dissolution, was observed in formic acid as well. This local degradation created additional stress concentrations. Moreover, since formic acid has the highest dissociation rate constant (kd) (cf. Table 7), it can produce protons the fastest, which means that protons are again the earliest available for the reduction reactions. This causes, on the one hand, a higher corrosion rate, but on the other hand, it also causes the highest probability for hydrogen adsorbed to the metal surface to be absorbed into the metal, which can result in H embrittlement. It is energetically favourable for hydrogen atoms to diffuse to regions of high tri-axial stresses, such as these present at a crack tip or around local degradation. Consequently, stressed regions were embrittled due to a locally increased hydrogen concentration, leading to crack initiation below the surface. This phenomenon is called hydrogen induced cracking (HIC).
In industry, steam turbines are regularly checked for corrosion damage or damage in general. Since formic acid and acetic acid caused more noticeable corrosion, measures would be taken to prevent and protect the steam turbine against corrosion and the steam turbine would be checked for damage regularly. Since nonanoic acid caused no substantially noticeable corrosion, it would be tempting to assume no damage was induced. However, the combination of nonanoic acid and stress created a favourable situation for stress-corrosion cracking to occur.

4. Conclusions

Potentiodynamic measurements on NiCrMoV steam turbine steel in different types of organic acids, i.e., formic, acetic, propanoic and nonanoic acid, at different pH values, i.e., pH 3.9, 3.4, 2.9 and 2.4, were conducted to evaluate the impact of different organic acids on the corrosion sensitivity of steam turbine steel. To evaluate and verify the impact of different organic acids on the stress-corrosion cracking sensitivity of steam turbine steel, in situ four-point constant-extension tests in different types of organic acids at a pH value of 3.4 were conducted as well. The main takeaways were summarized below.
  • Based on the positioning of the corrosion potentials, both anodic dissolution and oxygen reduction took place in all tested conditions. Furthermore, the most hydrogen embrittlement was expected in formic acid, followed by acetic acid and propanoic acid, whereas in most conditions of nonanoic acid no hydrogen embrittlement of the steam turbine steel was expected. Linear relationships between corrosion rate and hydrogen proton concentration were identified for all organic acids. This was explained by the increase in linear proportion of current densities of both the oxygen reduction reaction and the hydrogen proton reduction reaction when increasing the hydrogen proton concentration.
  • For solutions with the same pH, the corrosion rate in formic acid was the highest, followed by those in acetic, propanoic and nonanoic acid. Although the solutions of different types of organic acids were prepared in such a way that their concentrations were balanced with respect to their different equilibrium dissociation constants, as such taking into account thermodynamics, their difference in kinetics of acid dissociation still had a significant impact on the corrosion process. The acid dissociation reaction acted as a rate determining step in the corrosion of steam turbine steel in organic acid solutions. The conductivity appeared to be an insufficient guide value for corrosion due to the significant difference in corrosion rate in solutions of different organic acids with similar conductivities. When lowering the pH, a small decrease in corrosion rate was measured for nonanoic acid. Long hydrocarbon chains of nonanoic acid blocked active sites for corrosion, as such acting as a corrosion inhibitor.
  • For the same pH value of 3.4, the general degradation in formic acid was the highest, followed by acetic acid and nonanoic acid, nicely in agreement with the trend of the corrosion rate. However, the general degradation depth was higher than what could be predicted by the measured corrosion rates. This could be explained by the synergetic effect of corrosion and stresses applied to the material. Moreover, stress–corrosion cracks were present after the test in nonanoic acid. This could lead to potentially dangerous situations, since nonanoic acid would induce the least amount of visible corrosion. Consequently, no severe damage would be expected, while stress-corrosion cracks are initiating and propagating. Another type of cracks was found in formic acid. The parallel cracks are presumably caused by the combination of additional stress concentrations, induced by localised corrosion, and hydrogen embrittlement.

Author Contributions

T.D.S.: Investigation, Methodology, Formal analysis, Writing—Original Draft, Visualization, E.L.: Investigation, Formal analysis, A.R.D.V.: Writing—Review and Editing, Funding acquisition, T.D.: Conceptualization, Methodology, Writing—Review and Editing, Supervision, Funding acquisition, Project administration and K.V.: Writing—Review and Editing, Supervision, Funding acquisition, Project administration. All authors have read and agreed to the published version of the manuscript.

Funding

This work was supported by Ghent University and the IMPROVED project. The IMPROVED project is financed by the Interreg V Flanders—The Netherlands program, a program for transregional collaboration with financial support from the European Regional Development Fund. More info: www.grensregio.eu and www.improvedwater.eu. TD holds a postdoctoral fellowship of the Research Foundation—Flanders (FWO) via grant 12ZO420N. The authors also wish to thank the Special Research Fund (BOF), UGent (grant BOF15/BAS/062, grant 24J069-17 and BOF19/GOA/026).

Institutional Review Board Statement

Not applicable.

Informed Consent Statement

Not applicable.

Data Availability Statement

The raw/processed data required to reproduce these findings cannot be shared at this time as the data also form part of an ongoing study.

Acknowledgments

The authors wish to thank Saarschmiede for the supply of NiCrMoV steam turbine steel.

Conflicts of Interest

The authors declare no conflict of interest.

References

  1. Dooley, R.B. Turbine Steam, Chemistry and Corrosion: Generation of Early Liquid Films in Turbines; Electric Power Research Institute: Palo Alto, CA, USA, 1999. [Google Scholar]
  2. Technical Guidance Document: Steam Purity for Turbine Operation; International Association for the Properties of Water and Steam: London, UK, 2013.
  3. Savelkoul, J.; van Lier, R. Operational Experience with Organics in Industrial Steam Generation. Power Plant Chem. 2005, 7, 733–739. [Google Scholar]
  4. Svoboda, R.; Bodmer, M. Investigations into the Composition of the Water Phase in Steam Turbines. In Proceedings of the 14th International Conference on the Properties of Water and Steam in Kyoto, Kyoto, Japan, 29 August–3 September 2004; pp. 594–601. [Google Scholar]
  5. De Wispelaere, M. Early Condensate in a Fossil Power Plant using organic treatment. In Proceedings of the 14th International Conference on the Properties of Water and Steam in Kyoto, Kyoto, Japan, 29 August–3 September 2004; pp. 602–605. [Google Scholar]
  6. Palmer, D.A.; Marshall, S.L.; Simonson, J.M.; Gruszkiewicz, M.S. The Partitioning of Acetic, Formic, and Phosphoric Acids between Liquid Water and Steam; Chemical and Analytical Sciences Division, Oak Ridge National Laboratory: Oak Ridge, TN, USA, 2008. [Google Scholar]
  7. Yasaka, Y.; Yoshida, K.; Wakai, C.; Matubayasi, N.; Nakahara, M. Kinetics and Equilibrium of the Reversible Formic Acid Decomposition in Hot Water. In Proceedings of the 15th International Conference on the Properties of Water and Steam, Berlin, Germany, 7–11 September 2008; pp. 1–10. [Google Scholar]
  8. Dooley, R.B.; Bursik, A. International Conference on the Interaction of Organics and Organic Cycle Treatment Chemicals with Water, Steam and Materials; Electric Power Research Institute: Palo Alto, CA, USA, 2005. [Google Scholar]
  9. Svoboda, R.; Gabrielli, F.; Hehs, H.; Seipp, H.-G.; Leidich, F.-U.; Roberts, B. Organic Impurities and Organic Conditioning Agents in the Steam/Water Cycle: A Power Plant Manufacturer’s Point of View. Power Plant Chem. 2006, 8, 502–509. [Google Scholar]
  10. Van Lipzig, N.; Willems, P. Actualisatie en Verfijning Klimaatscenario’s tot 2100 voor Vlaanderen; MIRA: Mechelen, Belgium, 2015. [Google Scholar]
  11. UNESCO. Wastewater: The Untapped Resource; UNESCO: Paris, France, 2017. [Google Scholar]
  12. De Meyer, E.; van Overstraeten, T.; Heyse, J.; Uddin, M.R.; Vanoppen, M.; Boon, N.; de Gusseme, B.; Verbeken, K.; Verliefde, A.R.D. Organic Matter and Microbial Cell Density Behavior during Ion Exchange Demineralization of Surface Water for Boiler Feedwater. Ind. Eng. Chem. Res. 2019, 58, 14368–14379. [Google Scholar] [CrossRef]
  13. Asano, T.; Levine, A.D. Wastewater reclamation, recycling and reuse: Past, present, and future. Water Sci. Technol. 1996, 33, 1–14. [Google Scholar] [CrossRef]
  14. Ma, H. Characterization of isolated fractions of dissolved organic matter from natural waters and a wastewater effluent. Water Res. 2001, 35, 985–996. [Google Scholar] [CrossRef]
  15. Anderson, J. The environmental benefits of water recycling and reuse. Water Sci. Technol. Water Supply 2003, 3, 1–10. [Google Scholar] [CrossRef]
  16. Gasnier, C.; Lister, D.H. The Effects of Chemical Additives on Magnetite Deposition in Boiling Heat Transfer. In Proceedings of the International Conference on Heat Exchanger Fouling and Cleaning, Budapest, Hungary, 9–14 June 2013; pp. 85–93. [Google Scholar]
  17. Gasnier, C. The Effect of Chemical Additives on the Deposition of Magnetite onto Alloy-800 under Nucleate Boiling Heat Transfer. Master’s Thesis, The University of New Brunswick, Fredericton, NB, Canada, 2014. [Google Scholar]
  18. Jack, M.; Weerakul, S.; Lister, D.H. The Interaction of a Film-Forming Amine with Surfaces of a Recirculating Experimental Water Loop. In Proceedings of the International Conference on Heat Exchanger Fouling and Cleaning, Enfield, Ireland, 7–12 June 2015; pp. 112–118. [Google Scholar]
  19. Hater, W.; Smith, B.; McCann, P.; de Bache, A. Experience with the Application of a Film Forming Amine in the Connah’s Quay Triple Stage Combined Cycle Gas Turbine Power Plant Operating in Cycling Mode. Power Plant Chem. 2018, 20, 136–144. [Google Scholar]
  20. McCloskey, T.H.; Dooley, R.B. Turbine Steam Path Damage: Theory and Practice; Electric Power Research Institute: Palo Alto, CA, USA, 1999. [Google Scholar]
  21. Betova, I.; Bojinov, M.; Saario, T. Film-Forming Amines in Steam/Water Cycles—Structure, Properties, and Influence on Corrosion and Deposition Processes; VTT: Espoo, Finland, 2014. [Google Scholar]
  22. Technical Guidance Document: Application of Film Forming Substances in Fossil and Combined Cycle Plants; International Association for the Properties of Water and Steam: Banff, AB, Canada, 2019.
  23. De Meyer, E.; de Seranno, T.; Hater, W.; Vanoppen, M.; Verbeken, K.; Verliefde, A.R.D. Degradation of oleyl-propylenediamine under steam generator conditions. Ph.D. Thesis, Ghent University, Ghent, Belgium, 2020. [Google Scholar]
  24. Liu, C.; Macdonald, D.D. Prediction of Failures of Low-Pressure Steam Turbine Disks. J. Press. Vessel. Technol. 1997, 119, 393. [Google Scholar] [CrossRef]
  25. Savelkoul, J.; Janssen, P.; Verhoef, H. Monitoring of First Condensate Corrosion (FCC) in Industrial Steam Systems. Power Plant Chem. 2001, 3, 326–330. [Google Scholar]
  26. McCloskey, T.H. Troubleshooting Turbine Steam Path Damage Mechanisms; Turbomachinery Laboratories, Texas A&M University: College Station, TX, USA, 2002; pp. 105–144. [Google Scholar] [CrossRef]
  27. Zhou, S.; Turnbull, A. Steam Turbine Operating Conditions, Chemistry of Condensates, and Environment Assisted Cracking—A Critical Review; NPL Report MATC (A); NPL: Teddington, UK, 2002; Volume 95. [Google Scholar]
  28. Kalderon, D. Steam Turbine Failure at Hinkley Point ‘A’. Proc. Inst. Mech. Eng. 1972, 186, 341–377. [Google Scholar] [CrossRef]
  29. Parker, J.G.; Pearce, W.G. Stress Corrosion Cracking of a Low Alloy Steel in Acetate Solutions. Corrosion 1974, 30, 18–23. [Google Scholar] [CrossRef]
  30. Parker, J.G.; Sadler, M.A. Stress corrosion cracking of a low alloy steel in high purity steam. Corros. Sci. 1975, 15, 57–63. [Google Scholar] [CrossRef]
  31. McMinn, A.; Lyle, F.F.; Leverant, G.R. Mechanical and metallurgical properties of retired 3.5NiCrMoV low pressure steam turbine discs. J. Mater. Energy Syst. 1984, 6, 184–199. [Google Scholar] [CrossRef]
  32. Lyle, F.F.; McMinn, A.; Leverant, G.R. Low-Pressure Steam Turbine Disc Cracking—An Update. Proc. Inst. Mech. Eng. Part A Power Process Eng. 1985, 199, 59–67. [Google Scholar] [CrossRef]
  33. Gras, J.M.; Vaillant, F.; Dordonat, M.; Dury, J.P. Stress Corrosion Cracking of Turbine Disc Steels: A Study of Mechanism; Electricité de France: Paris, France, 1993. [Google Scholar]
  34. Jonas, O.; Machemer, L. Steam Turbine Corrosion and Deposits Problems and Solutions. In Proceedings of the Thirty-Seventh Turbomachinery Symposium, College Station, TX, USA, 8–11 September 2008; pp. 211–228. [Google Scholar]
  35. Wei, J.; Zhou, B. Effect of Acetic Acid on the Pitting Corrosion of 2Cr12MoV Turbine Steel in Early Condensates Containing Chloride Ions. Int. J. Electrochem. Sci. 2017, 12, 3166–3178. [Google Scholar] [CrossRef]
  36. Dooley, R.B. International Conference on Boiler Tube and HRSG Tube Failures and Inspections; Electric Power Research Institute: Palo Alto, CA, USA, 2004. [Google Scholar]
  37. Van Lier, R.; Cuoq, F.; Peters, R.; Savelkoul, J. Ten Years of Experience with Polyamines in the High-Pressure Steam System of a Naphta Cracker. Power Plant Chem. 2015, 17, 356–363. [Google Scholar]
  38. Jonas, O. Steam, Chemistry, and Corrosion in the Phase Transition Zone of Steam Turbines: Volume 1; Electric Power Research Institute: Palo Alto, CA, USA, 1999. [Google Scholar]
  39. Morson, A.; Pepe, J.J.; Bievenue, R.T. A Review of GE Fossil Steam Turbine Rotors with Shrunk-On Wheels; GE Power Systems: Schenectady, NY, USA, 1988. [Google Scholar]
  40. Moed, D.H.; Verliefde, A.R.D.; Heijman, S.G.J.; Rietveld, L.C. Organic acid formation in steam–water cycles: Influence of temperature, retention time, heating rate and O2. Appl. Therm. Eng. 2014, 65, 194–200. [Google Scholar] [CrossRef]
  41. De Meyer, E.; Peeters, B.; Vanoppen, M.; Verbeken, K.; Verliefde, A.R.D. Organic Matter Composition More Important than Concentration in Ion Exchange Demineralization of Different Water Qualities for the Production of Steam. Ind. Eng. Chem. Res. 2018, 57, 3742–3752. [Google Scholar] [CrossRef]
  42. Moed, D.H.; Verliefde, A.R.D.; Rietveld, L.C. Effects of Temperature and Pressure on the Thermolysis of Morpholine, Ethanolamine, Cyclohexylamine, Dimethylamine, and 3-Methoxypropylamine in Superheated Steam. Ind. Eng. Chem. Res. 2015, 54, 2606–2612. [Google Scholar] [CrossRef]
  43. Van Lier, R.; de Smet, A.; Olsen, L.-M.; Halasa, M.; Fjaerem, T.A. Thirty Years of Experience with Film-Forming Amines at a Norwegian Fertilizer Production Site. Power Plant Chem. 2019, 21, 232–241. [Google Scholar]
  44. Ruther, W.E.; Soppet, W.K.; Ayrault, G.; Kassner, T.F. Effect of Sulfuric Acid, Oxygen, and Hydrogen in High Temperature Water on Stress Corrosion Cracking of Sensitized AISI 304 Stainless Steel. Corrosion 1984, 40, 518–527. [Google Scholar] [CrossRef]
  45. Svoboda, R.; Bodmer, M.; Sandmann, H. Impact of Organic Impurities on Steam Turbine Operation. Power Plant Chem. 2000, 2, 530–534. [Google Scholar]
  46. Maeng, W.Y.; Macdonald, D.D. The effect of acetic acid on the stress corrosion cracking of 3.5NiCrMoV turbine steels in high temperature water. Corros. Sci. 2008, 50, 2239–2250. [Google Scholar] [CrossRef]
  47. Ljungberg, L.G.; Cubicciotti, D. Effect of Water Impurities on Stress Corrosion Cracking in a Bolling Water Reactor. Corrosion 1985, 41, 290–295. [Google Scholar] [CrossRef]
  48. Christman, T.; Cragnolino, G. Effect of Organic Acids on the IGSCC of Sensitized AISI 304 Stainless Steel in High Temperature Aqueous Solutions. Corrosion 1988, 44, 345–353. [Google Scholar] [CrossRef]
  49. De Seranno, T.; Lambrechts, E.; Verliefde, A.R.D.; Depover, T.; Verbeken, K. Mechanistic interpretation on acidic stress-corrosion cracking of NiCrMoV steam turbine steel. Mater. Sci. Eng. A 2020, 802, 140433. [Google Scholar] [CrossRef]
  50. Gates, J.D.; Atrens, A.; Smith, I.O. Microstructure of As-quenched 3.5NiCrMoV Rotor Steel. Part I. General structure and retained austenite. Mater. Werkst. 1987, 18, 165–170. [Google Scholar] [CrossRef]
  51. Haynes, W.M. (Ed.) CRC Handbook of Chemistry and Physics, 97th ed.; CRC Press: Boca Raton, FL, USA, 2016. [Google Scholar]
  52. Ostwald, W. Über die Dissociationstheorie der Elektrolyte. Z. Phys. Chem. 1888, 2, 270–283. [Google Scholar] [CrossRef]
  53. Kortum, G.; Vogel, W.; Andrussow, K. Dissociation Constants of Organic Acids in Aqueous Solution; University of Tubingen: Tübingen, Germany, 1961; Volume 383. [Google Scholar]
  54. Laidler, K.J. Physical Chemistry with Biological Applications; The Benjamin/Cummings Publishing Company: San Francisco, CA, USA, 1978. [Google Scholar]
  55. De Seranno, T.; Vandewalle, L.; Depover, T.; Verliefde, A.R.D.; Verbeken, K. Mechanical degradation of Fe-C-X steels by acidic stress-corrosion cracking. Corros. Sci. 2020, 167, 108509. [Google Scholar] [CrossRef]
  56. De Seranno, T.; Depover, T.; Verliefde, A.R.D.; Verbeken, K. Evaluation of the active mechanism for acidic SCC induced mechanical degradation: A methodological approach. Mater. Sci. Eng. A 2020, 790, 139645. [Google Scholar] [CrossRef]
  57. De Seranno, T.; Lambrechts, E.; de Meyer, E.; Hater, W.; de Geyter, N.; Verliefde, A.R.D.; Depover, T.; Verbeken, K. Effect of film forming amines on the acidic stress-corrosion cracking resistance of steam turbine steel. Metals 2020, 10, 1628. [Google Scholar] [CrossRef]
  58. Brett, C.M.A.; Brett, A.M.O. Electrochemistry: Principles, Methods, and Applications; Oxford University Press: Oxford, UK, 1993. [Google Scholar]
  59. Roberge, P.R. Corrosion Engineering: Principles and Practice; McGraw-Hill Education: New York, NY, USA, 2008. [Google Scholar]
  60. NACE International. Standard Test Method: Laboratory Testing of Metals for Resistance to Sulfide Stress Cracking and Stress Corrosion Cracking in H₂S Environments; NACE International: Houston, TX, USA, 2005. [Google Scholar]
  61. Practice for Preparation and Use of Bent-Beam Stress-Corrosion Test Specimens; ASTM International: West Conshohocken, PA, USA, 2016. [CrossRef]
  62. Standard Test Method: Evaluation of Pipeline and Pressure Vessel Steels for Resistance to Hydrogen-Induced Cracking; NACE International: Houston, TX, USA, 2003.
  63. Pourbaix, M. Atlas of electrochemical equilibria in aqueous solutions. J. Electroanal. Chem. Interfacial Electrochem. 1974, 13, 471. [Google Scholar] [CrossRef]
  64. Jones, R.H. (Ed.) Stress-Corrosion Cracking; ASM International: Materials Park, OH, USA, 1992. [Google Scholar]
  65. Was, G.S. Fundamentals of Radiation Materials Science: Metals and Alloys; Springer: Berlin/Heidelberg, Germany, 2007. [Google Scholar]
  66. Lynch, S.P. Mechanistic and fractographic aspects of stress-corrosion cracking (SCC). In Stress Corrosion Cracking: Theory and Practice; Woodhead Publishing: Sawston, UK, 2011; pp. 3–89. [Google Scholar] [CrossRef]
  67. Cheng, Y.F. Fundamentals of Stress Corrosion Cracking. In Stress Corrosion Cracking of Pipelines; John Wiley & Sons, Inc.: Hoboken, NJ, USA, 2013; pp. 7–41. [Google Scholar] [CrossRef]
  68. Newman, J.; Thomas-Alyea, K.E. Electrochemical Systems, 3rd ed.; John Wiley & Sons, Inc.: Hoboken, NJ, USA, 2004. [Google Scholar]
  69. Alonso-Vante, N.; Roldán, C.A.C.; Huerta, R.d.G.; Sánchez, G.R.; Robledo, A.M. Fundamentals of Electrocatalyst Materials and Interfacial Characterization: Energy Producing Devices and Environmental Protection; John Wiley & Sons, Inc.: Hoboken, NJ, USA, 2019. [Google Scholar] [CrossRef]
  70. Santos, E.; Hindelang, P.; Quaino, P.; Schmickler, W. A model for the Heyrovsky reaction as the second step in hydrogen evolution. Phys. Chem. Chem. Phys. 2011, 13, 6992. [Google Scholar] [CrossRef]
  71. Djukic, M.B.; Zeravcic, V.S.; Bakic, G.M.; Sedmak, A.; Rajicic, B. Hydrogen damage of steels: A case study and hydrogen embrittlement model. Eng. Fail. Anal. 2015, 58, 485–498. [Google Scholar] [CrossRef]
  72. Shinagawa, T.; Garcia-Esparza, A.T.; Takanabe, K. Insight on Tafel slopes from a microkinetic analysis of aqueous electrocatalysis for energy conversion. Sci. Rep. 2015, 5, 13801. [Google Scholar] [CrossRef]
  73. Atrens, A.; Venezuela, J.; Liu, Q.; Zhou, Q.; Verbeken, K.; Tapia-Bastidas, C.; Gray, E.; Christien, F.; Wolski, K. Electrochemical and Mechanical Aspects of Hydrogen Embrittlement Evaluation of Martensitic Steels. In Reference Module in Chemistry, Molecular Sciences and Chemical Engineering; Elsevier: Amsterdam, The Netherlands, 2017; pp. 201–225. [Google Scholar] [CrossRef]
  74. Reuben, R.L. Materials in Marine Technology; Springer: London, UK, 1994. [Google Scholar] [CrossRef]
  75. Mentus, S. The evidence of limitation of oxygen reduction reaction by proton diffusion in low-concentration acid solutions. J. Electroanal. Chem. 2015, 738, 47–50. [Google Scholar] [CrossRef]
  76. Benn, E.E.; Gaskey, B.; Erlebacher, J.D. Suppression of Hydrogen Evolution by Oxygen Reduction in Nanoporous Electrocatalysts. J. Am. Chem. Soc. 2017, 139, 3663–3668. [Google Scholar] [CrossRef]
  77. Eigen, M. VII5. Relaxationsspektren chemischer Umwandlungen (Metallkomplexe und protolytische Reaktionen in wäßriger Lösung). Z. Elektrochem. 1960, 64, 115–123. [Google Scholar] [CrossRef]
  78. Eigen, M.; Schoen, J. StoBspannungsverfahren zur Untersuchung sehr schnell verlaufender Ionenreaktionen in wasseriger Losung. Z. Phys. Chem. 1955, 59, 483–494. [Google Scholar]
  79. Gostisa-Mihelcic, V.B.; Vielstich, W. Bestimmung der Geschwindigkeitskonstanten einiger schwacher Sauren mit Hilfe rotierender Elektroden—Einfluss des elektrischen Feldes in der Doppelschicht. Ber. Bunsenges. 1973, 77, 476–483. [Google Scholar] [CrossRef]
  80. Bell, R.P. The Brönsted Equation—Its First Half-Century. In Correlation Analysis in Chemistry; Chapman, N.B., Shorter, J., Eds.; Springer: Boston, MA, USA, 1978; pp. 55–84. [Google Scholar] [CrossRef]
  81. Brönsted, J.N.; Pedersen, K. Die katalytische Zersetzung des Nitramids und ihre physikalisch-chemische Bedeutung. Z. Für Phys. Chem. 1923, 108, 185–235. [Google Scholar] [CrossRef]
  82. Carey, F.A.; Sundberg, R.J. Advanced Organic Chemistry, 5th ed.; Springer: New York, NY, USA, 2007. [Google Scholar]
  83. Evans, M.G.; Polanyi, M. Some applications of the transition state method to the calculation of reaction velocities, especially in solution. Trans. Faraday Soc. 1935, 31, 875. [Google Scholar] [CrossRef]
  84. Evans, M.G.; Polanyi, M. Further considerations on the thermodynamics of chemical equilibria and reaction rates. Trans. Faraday Soc. 1936, 32, 1333. [Google Scholar] [CrossRef]
  85. Registration Report—Beloukha, Part A National Assessment, Germany; Belchim Crop Protection: Londerzeel, Belgium, 2018.
  86. Zhao, X.; Ong, S.; Wang, H.; Eisenthal, B. New method for determination of surface pKa, using second harmonic generation. Chem. Phys. Lett. 1993, 214, 203–207. [Google Scholar] [CrossRef]
  87. Kanicky, J.R.; Poniatowski, A.F.; Mehta, N.R.; Shah, D.O. Cooperativity among Molecules at Interfaces in Relation to Various Technological Processes: Effect of Chain Length on the pKa of Fatty Acid Salt Solutions. Langmuir 2000, 16, 172–177. [Google Scholar] [CrossRef]
  88. Wellen, B.A.; Lach, E.A.; Allen, H.C. Surface pKa of octanoic, nonanoic, and decanoic fatty acids at the air–water interface: Applications to atmospheric aerosol chemistry. Phys. Chem. Chem. Phys. 2017, 19, 26551–26558. [Google Scholar] [CrossRef]
  89. Mayne, J.E.O.; Ramshaw, E.H. Inhibitors of the corrosion of iron. II. Efficiency of the sodium, calcium and lead salts of long chain fatty acids. J. Appl. Chem. 1960, 10, 419–422. [Google Scholar] [CrossRef]
  90. Dulat, J.; Collins, J.F. Corrosion Inhibitor Compositions. U.S. Patent US3240708A, 15 March 1966. [Google Scholar]
  91. Darden, J.W.; Triebel, C.A.; van Neste, W.A.; Maes, J.P. Monobasic-Dibasic Acid/Salt Antifreeze Corrosion Inhibitor. U.S. Patent US4647392A, 27 December 1985. [Google Scholar]
  92. Swathi, P.N.; Rasheeda, K.; Samshuddin, S.; Alva, V.D. Fatty Acids and its Derivatives as Corrosion Inhibitors for Mild Steel—An Overview. J. Asian Sci. Res. 2017, 7, 301–308. [Google Scholar] [CrossRef] [Green Version]
Figure 1. Degree of dissociation α versus the total concentration of the electrolyte c (M), for different organic acids.
Metals 12 01490 g001
Figure 2. Conductivity κ (S/m) versus the total concentration of the electrolyte c (M), for different organic acids.
Metals 12 01490 g002
Figure 3. Schematic representation of the in situ four-point constant-extension set-up.
Metals 12 01490 g003
Figure 4. Illustration of the determination of the corrosion current density j corr (polarisation curve in 0.01 M acetic acid at 25 °C).
Metals 12 01490 g004
Figure 5. Influence of pH on polarisation curves of NiCrMoV steam turbine steel in organic acids: (a) formic acid, (b) acetic acid, (c) propanoic acid, (d) nonanoic acid.
Metals 12 01490 g005
Figure 6. Influence of organic acid type on polarisation curves of NiCrMoV steam turbine steel in organic acids: (a) pH 3.9, (b) pH 3.4, (c) pH 2.9, (d) pH 2.4.
Metals 12 01490 g006
Figure 7. Corrosion rates CR (µm/year) of NiCrMoV steam turbine steel in different types of organic acids at four pH’s.
Metals 12 01490 g007
Figure 8. Influence of the type and concentration of organic acid on the corrosion rate of steam turbine steel (a) corrosion rate (µm/year) versus hydrogen proton concentration (mM) (b) corrosion rate (µm/year) versus pH.
Metals 12 01490 g008
Figure 9. Corrosion potentials E corr (V vs. SHE) for NiCrMoV steam turbine steel in different types and concentrations of organic acid. Dashed line represents the hydrogen proton reduction reaction line. Thermodynamically stable forms of iron (molality of 1) are delimited by black solid lines. Diagram based on thermodynamic data from FactSage©.
Metals 12 01490 g009
Figure 10. Schematic representation of the acid dissociation reaction, acting as the rate determining step in the corrosion of steam turbine steel in organic acid ( HZ ) solutions. k d = dissociation rate constant of organic acid, k a = association rate constant of organic acid, k D = mass transfer coefficient of hydrogen proton, k R , O 2 = rate constant of oxygen reduction, k R , H + = rate constant of hydrogen proton reduction, k O = rate constant of iron oxidation.
Metals 12 01490 g010
Figure 11. Cross-sections of steam turbine steel at 115% σy for one month (pH = 3.4), (a) formic acid, (b) acetic acid and (c) nonanoic acid.
Metals 12 01490 g011aMetals 12 01490 g011b
Figure 12. Cross-sections of steam turbine steel at 115% σy for one month (pH = 3.4) showing cracks (indicated with white arrows), (a) formic acid and (b) nonanoic acid.
Metals 12 01490 g012aMetals 12 01490 g012b
Table 1. Chemical composition of 27NiCrMoV15-6 in wt%.
FeCNiCrMoV
balance0.273.701.500.350.10
Table 2. Chemical formula, molar mass (g/mol), density (kg/L) and boiling temperature (°C) of the different organic acids.
Organic AcidChemical FormulaMolar Mass (g/mol)Density (kg/L)Boiling Temperature (°C)
formic acidCH2O246.021.22100.8
acetic acidC2H4O260.051.05118.5
propanoic acidC3H6O274.080.99141.2
nonanoic acidC9H18O2158.240.90254.0
Table 3. Dissociation constant K d (M) and pK d for the different organic acids at 25 °C [51].
Organic AcidKd (M)pKd
formic acid1.77 × 10−43.75
acetic acid1.74 × 10−54.76
propanoic acid1.34 × 10−54.87
nonanoic acid1.11 × 10−54.96
Table 4. Limiting cation conductivity λ + 0 , limiting anion conductivity λ 0 and molar conductivity at infinite dilution Λ 0 of the different organic acids at 25 °C [54,90,91].
Organic Acid λ + 0   ( mS   m 2 / mol ) [54] λ 0   ( mS   m 2 / mol ) [54,90,91] Λ 0   ( mS   m 2 / mol )
formic acid35.05.440.4
acetic acid35.04.139.1
propanoic acid35.03.638.6
nonanoic acid35.02.537.5
Table 5. Total concentration c and conductivity κ of test solutions prepared with different organic acids, for four pH values.
pHFormic AcidAcetic AcidPropanoic AcidNonanoic Acid
c (mM)κ (μS/cm)c (mM)κ (μS/cm)c (mM)κ (μS/cm)c (mM)κ (μS/cm)
3.90.2501.0481.2481.547
3.41.416610.016012.615915.8154
2.911.1533100.0512127.0509159.6494
2.4103.116931000.016271272.816161601.31571
Table 6. Organic acid type, pH, corrosion potential E corr , corrosion rate CR and corrosion current density j corr .
AcidpH E corr   ( V   vs .   SHE ) C R   ( µ m / year ) j corr   ( µ A / cm 2 )
formic3.9−0.23355.74.80
formic3.4−0.328106.89.21
formic2.9−0.313380.232.78
formic2.4−0.2981142.298.48
acetic3.9−0.26835.23.03
acetic3.4−0.29190.47.79
acetic2.9−0.241312.526.94
acetic2.4−0.186868.874.91
propanoic3.9−0.29332.82.83
propanoic3.4−0.23389.27.69
propanoic2.9−0.193243.120.96
propanoic2.4−0.166665.657.39
nonanoic3.9−0.08815.81.36
nonanoic3.4−0.12812.11.04
nonanoic2.9−0.1489.30.80
nonanoic2.4−0.1539.00.78
Table 7. Dissociation rate constant k d (s−1) and association rate constant k a (M−1 s−1) of formic, acetic and propanoic acid [74,75,76].
Organic Acid k d   ( s 1 ) k a   ( M 1   s 1 )
formic acid 1.0 × 10 7 5.0 × 10 10 [74]
acetic acid 8.0 × 10 5 4.5 × 10 10 [75]
propanoic acid 6.5 × 10 5 3.0 × 10 10 [76]
Table 8. Degradation depth of steam turbine steel at 115% σy for one month (pH = 3.4) and CR per month in formic, acetic and nonanoic acid.
Organic AcidDegradation Depth (µm)CR (µm/Month)
formic acid32 ± 78.9
acetic acid15 ± 37.5
nonanoic acid6 ± 21
Publisher’s Note: MDPI stays neutral with regard to jurisdictional claims in published maps and institutional affiliations.

