Article

Microstructural Evolution of the TLP Joints of RAFM Steel during Aging and Creep

School of Materials Science & Engineering, Tianjin University, Tianjin 300354, China
*
Authors to whom correspondence should be addressed.
Metals 2022, 12(8), 1333; https://doi.org/10.3390/met12081333
Submission received: 20 July 2022 / Revised: 4 August 2022 / Accepted: 6 August 2022 / Published: 10 August 2022
(This article belongs to the Topic Advanced Processes in Metallurgical Technologies)

Abstract

:
In this study, transient liquid-phase (TLP) bonding was adopted to obtain a reliable reduced-activation ferritic/martensitic (RAFM) steel joint with Fe-Si-B amorphous foil. The aging tests and creep tests of the TLP joints were carried out at 550 °C to study the microstructural evolution in the service process. The effect of stress loading on the microstructural evolution of the TLP joint was investigated. The results show that creep fractures in the TLP joints occur in the base material. The main factors affecting the creep performance of TLP joints are the recovery of substructures and the coarsening and deformation of martensitic laths. In addition, the M23C6 carbides in the base material were coarser than in the weld zone. Compared with aging samples and creep samples undergoing the same test temperature, the dislocation density in the isothermal solidification zone (ISZ) increased significantly with increases in the stress level. Furthermore, it is worth noting that the microstructure of the weld zone changed from large-sized ferrite to a mixed, fine microstructure of ferrite and martensite, which increases the heat resistance of the TLP joints, and thus results in creep fractures in the base metal.

1. Introduction

RAFM steel has been intensively used as the preferred structural material for the first wall of nuclear fusion reactors because of its excellent comprehensive properties, low thermal expansion coefficient, high geometric stability, high thermal conductivity, and good radiation-expansion resistance [1,2,3]. However, because of the severe operating environment of the long-term, high temperature, load, and 14-MeV neutron irradiation of a nuclear fusion reactor, the microstructure and performance of RAFM steel will obviously degrade [4,5]. In order to achieve the safe, efficient, and stable operation of nuclear fusion reactors, the welding technology and research processes of RAFM steel have become key technologies for the manufacture and commercial application of nuclear fusion reactors [6,7,8]. Hence, there are higher requirements for the high-temperature mechanical properties of the joints. The service temperature of RAFM steel in a nuclear fusion reactor is about 550~600 °C [9,10]. It has been reported that, with the combined effects of high temperature and load, creep deformation is one of the most important factors affecting the service life of the joints [11]. The precipitated phases undergo precipitation, growth, dissolution, reaction, diffusion, etc. [12], and grains grow, recrystallize, and recover under long-term, high temperatures [13]. The microstructural evolution is critical to the high-temperature creep-resistance of the joint [14].
TLP bonding possesses the advantages of both diffusion bonding and brazing [15,16]. TLP bonding has been widely investigated for nickel-based superalloy, ceramic, carbon steel and heat-resistant steel [17,18,19,20]. Because of the diffusion of the melting point depressants such as B, Si, and P in the interlayer, the TLP bonding process is generally divided into four stages: interlayer melting, base-material dissolution, isothermal solidification, and joint homogenization [15,21]. The TLP joint obviously consists of three separate regions: the ISZ (isothermal solidification zone), the DAZ (diffusion-affected zone), and the BM (base material) [22].
The creep-failure mechanism in the TLP joints composed of a nickel-based superalloy has been studied widely. Liu et al. [23] studied the creep-fracture mechanism of TLP joints of a Ni-base, single-crystal superalloy. It was found that a number of micro-porosities nucleate near the subgrain boundaries during creep deformation. With more creep deformation, microcracks can initiate at those micropores, resulting in the failure of the TLP joint right at the bonding zone. It has been recognized that the fine-grained heat-affected zone and the intercritical heat-affected zone in the fusion-welded joint of 9% Cr steel is the weakest parts during long-term creep at high temperatures [24]. These two areas form fine grains after the welding thermal cycle. Due to the segregation of the elements during the thermal cycle, there are fewer second phases precipitated on the grain boundaries, leading to the instability of the microstructure during long-term creep tests. Eventually, the creep cracks initiate and propagate. Therefore, it is of great significance to study the high-temperature-creep resistance of joints in the high-temperature-load environment. Furthermore, in order to optimize the microstructure after long-term thermal exposure, it is significant to investigate the microstructural evolution of the joints during the aging process. A previous study on the microstructural evolution after the aging process was concentrated on the coarsening of the grains and the second phases [25].
In our previous study [26], a reliable joint of RAFM steel with a Fe-Si-B interlayer was been obtained. In addition, the effects of homogenization time on the microstructural and mechanical properties of the TLP joints were investigated. However, the study on the high-temperature-creep tests and the grain structural characteristics after the aging process of the TLP joints of RAFM steel have seldom been reported.
In this work, TLP bonding was employed to join RAFM steel with an Fe-Si-B interlayer. The microstructural evolution and the creep-failure mechanism of the TLP joints after the creep test were investigated. Additionally, the grain structural characteristics after the aging process were investigated. In addition, as compared with the creep samples and aging samples, the effect of creep stress on the microstructural evolution was studied.

2. Experiments Details

In this study, the chemical composition of RAFM steel and Fe-Si-B amorphous foil as an interlayer are demonstrated in Table 1. The raw material of RAFM steel was cut into cylindrical specimens with a size of Φ 40 × 40 mm for the diffusion bonding. Transient liquid-phase bonding was adopted to join RAFM steel using Fe-Si-B amorphous foil. Prior to TLP bonding, all jointed surfaces of the RAFM steel were ground with a grinding machine, and the surfaces of the foil were ground by SiC papers up to #1500. All of the samples were ultrasonically degreased with acetone and alcohol for 20 min, respectively. Then, the cylindrical samples were acid-washed with a mixed solution of 20% nitric acid, 5% hydrofluoric acid, and 75% deionized water to remove the oxide film. The TLP bonding process was carried out in a vacuum diffusion furnace. The TLP joints of RAFM steel with an Fe-Si-B interlayer were obtained at 1200 °C for 30 min. A uniaxial pressure of 0.8 MPa was applied to the assemblies to keep the joined surface in close contact.
The aging tests for the TLP joints were carried out at 550 °C for 5 h, 20 h, 100 h, and 500 h, respectively. The creep tests were carried out using a creep-testing machine at 550 °C with 160 MPa, 180 MPa, and 220 MPa loads, respectively. Correspondingly, the creep samples were numbered as 3-550-160, 3-550-180, and 3-550-220. The aging and creep tests were both conducted in an air atmosphere. The size of the creep specimens is shown in Figure 1. The loading scheme for the creep test was that an incremental tensile load with a rate of 1 kN/min was applied until the target stress was reached.
To observe the microstructure by optical microscope (OM, Leica DMI 8, Leica, Solms, Germany) and scanning electron microscope (SEM, S4800, Hitachi, Tokyo, Japan), the specimens were ground to #2000, polished, and etched with a mixed solution of 5% nitric acid, 2% hydrofluoric acid, and 93% water. Transmission electron microscope (TEM, JEM-2100F, Akishima, Tokyo, Japan) samples were prepared by ion-beam thinning. Electron back-scattered diffraction (EBSD, JSM-7800F, Hitachi, Tokyo, Japan) specimens were prepared by electrolytic polishing with a mixed solution of 5% perchloric acid and 95% alcohol. The creep-fracture morphology was observed by SEM.

3. Results and Discussion

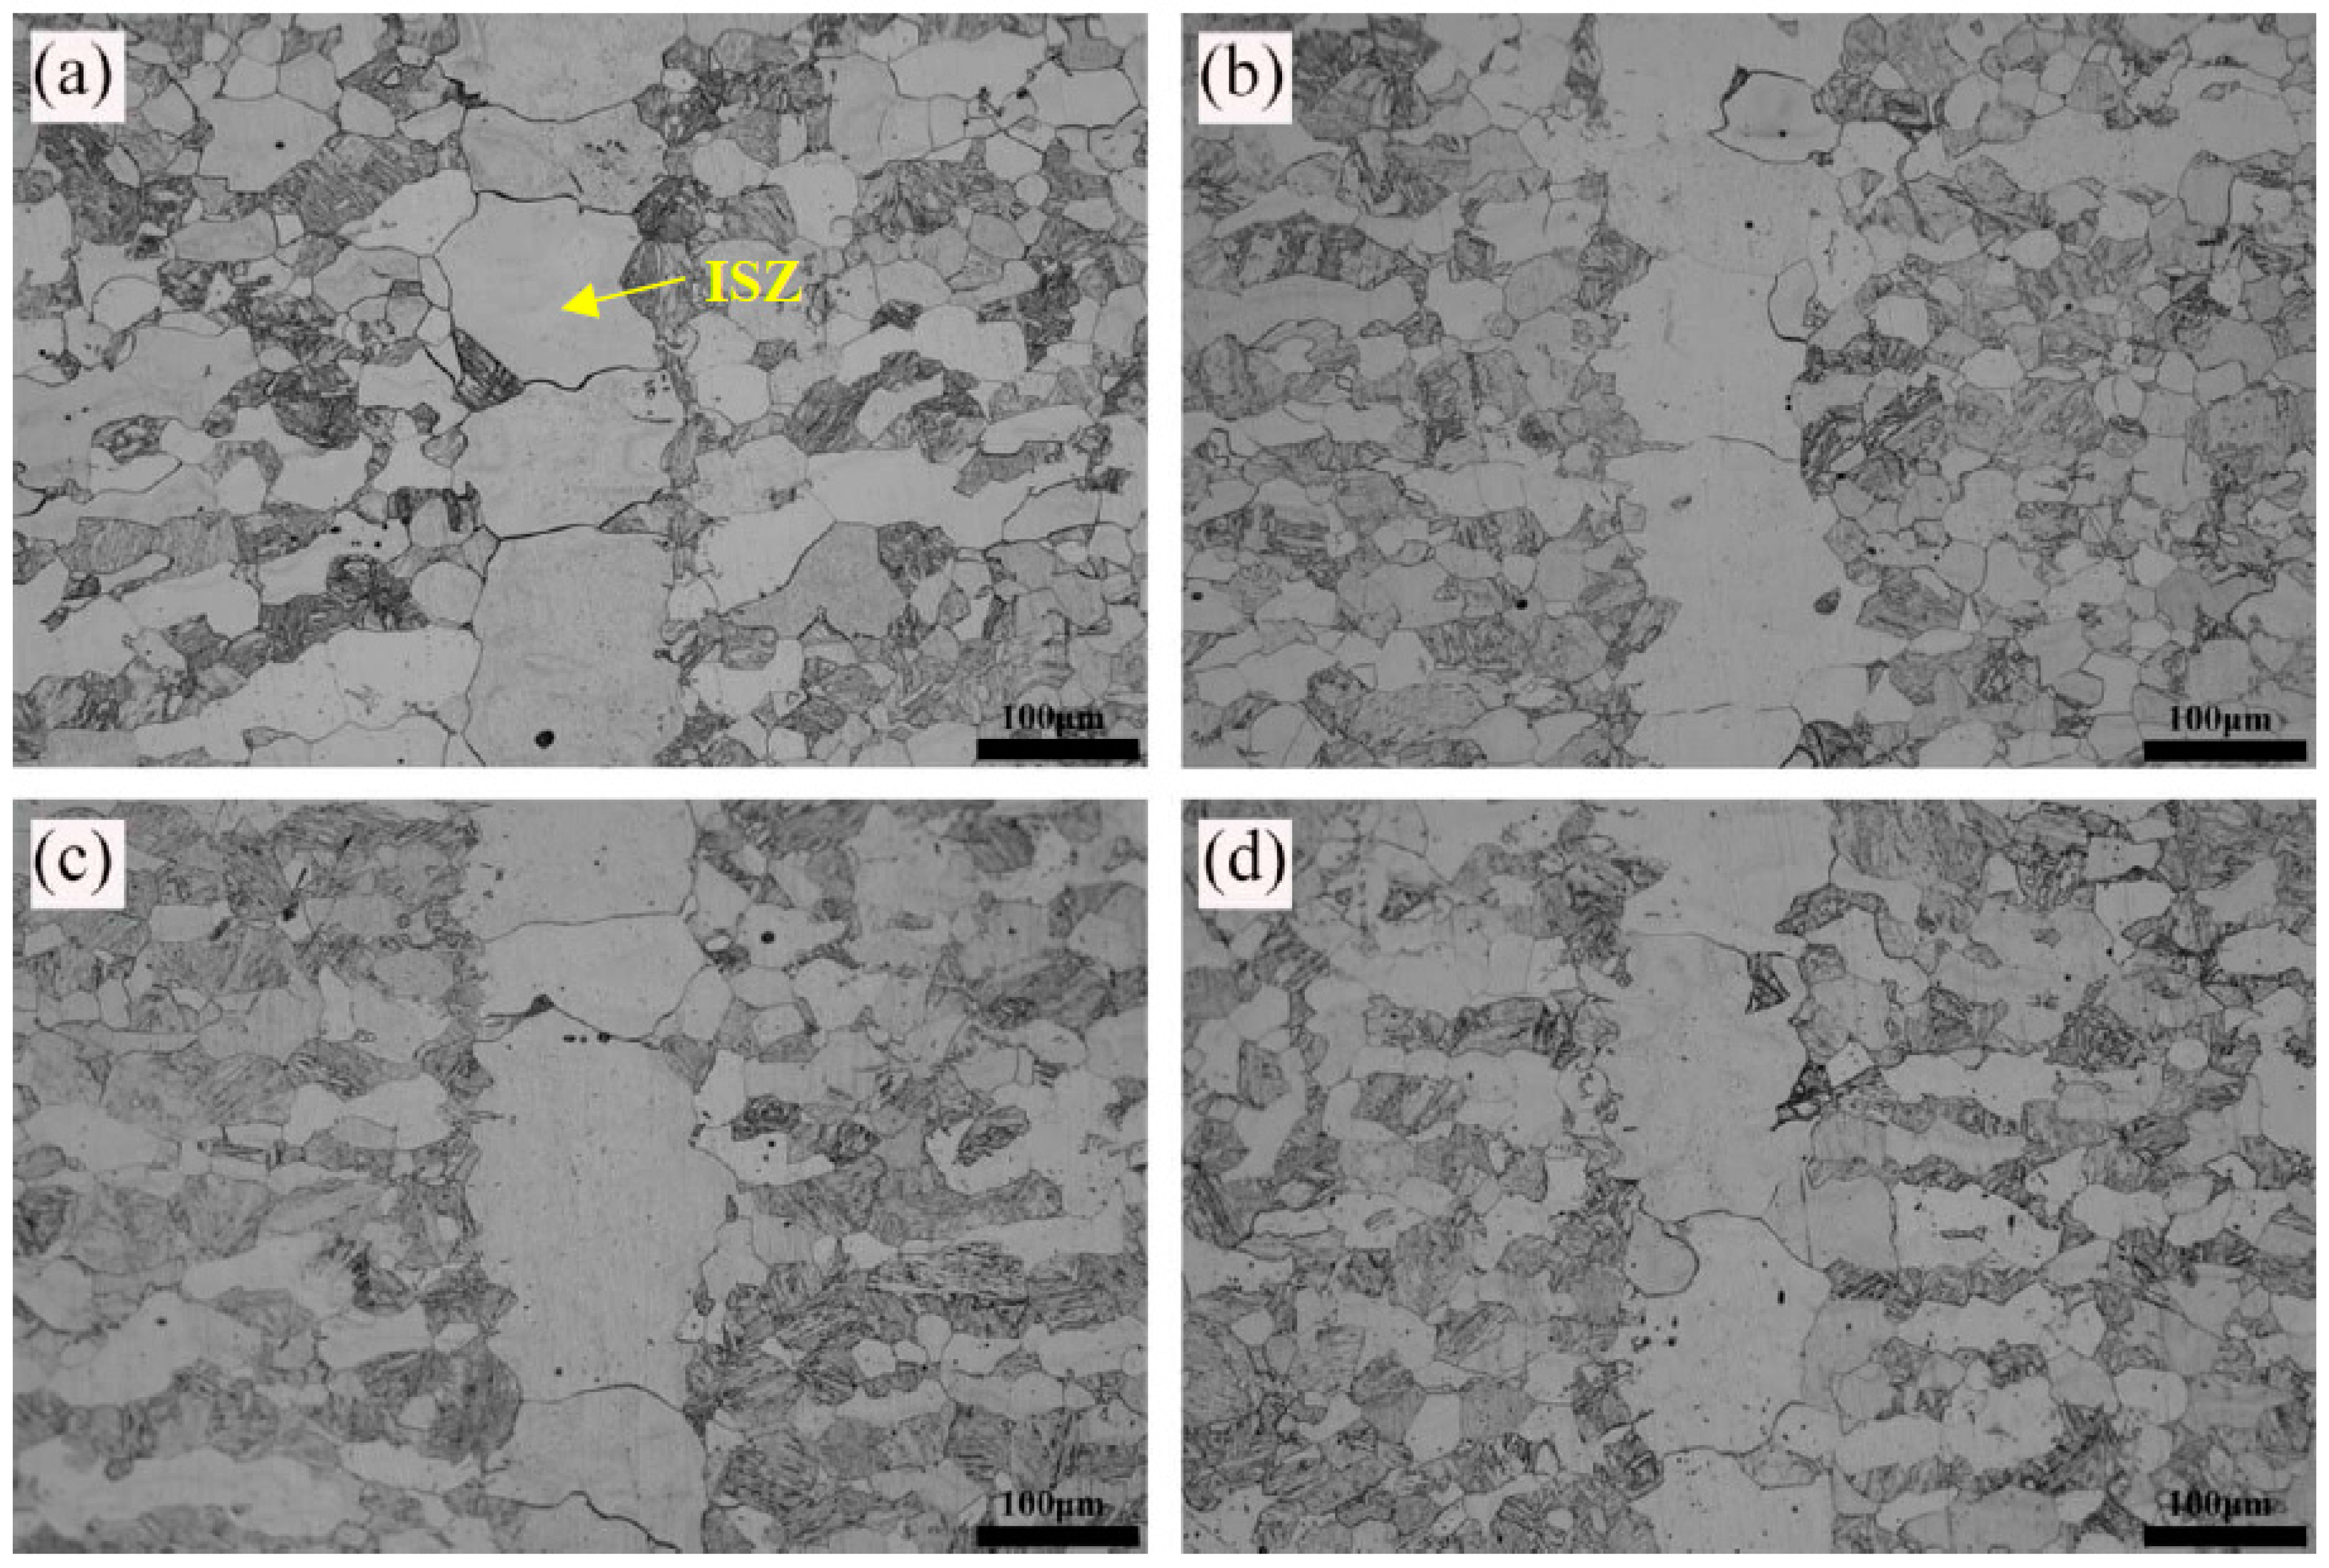
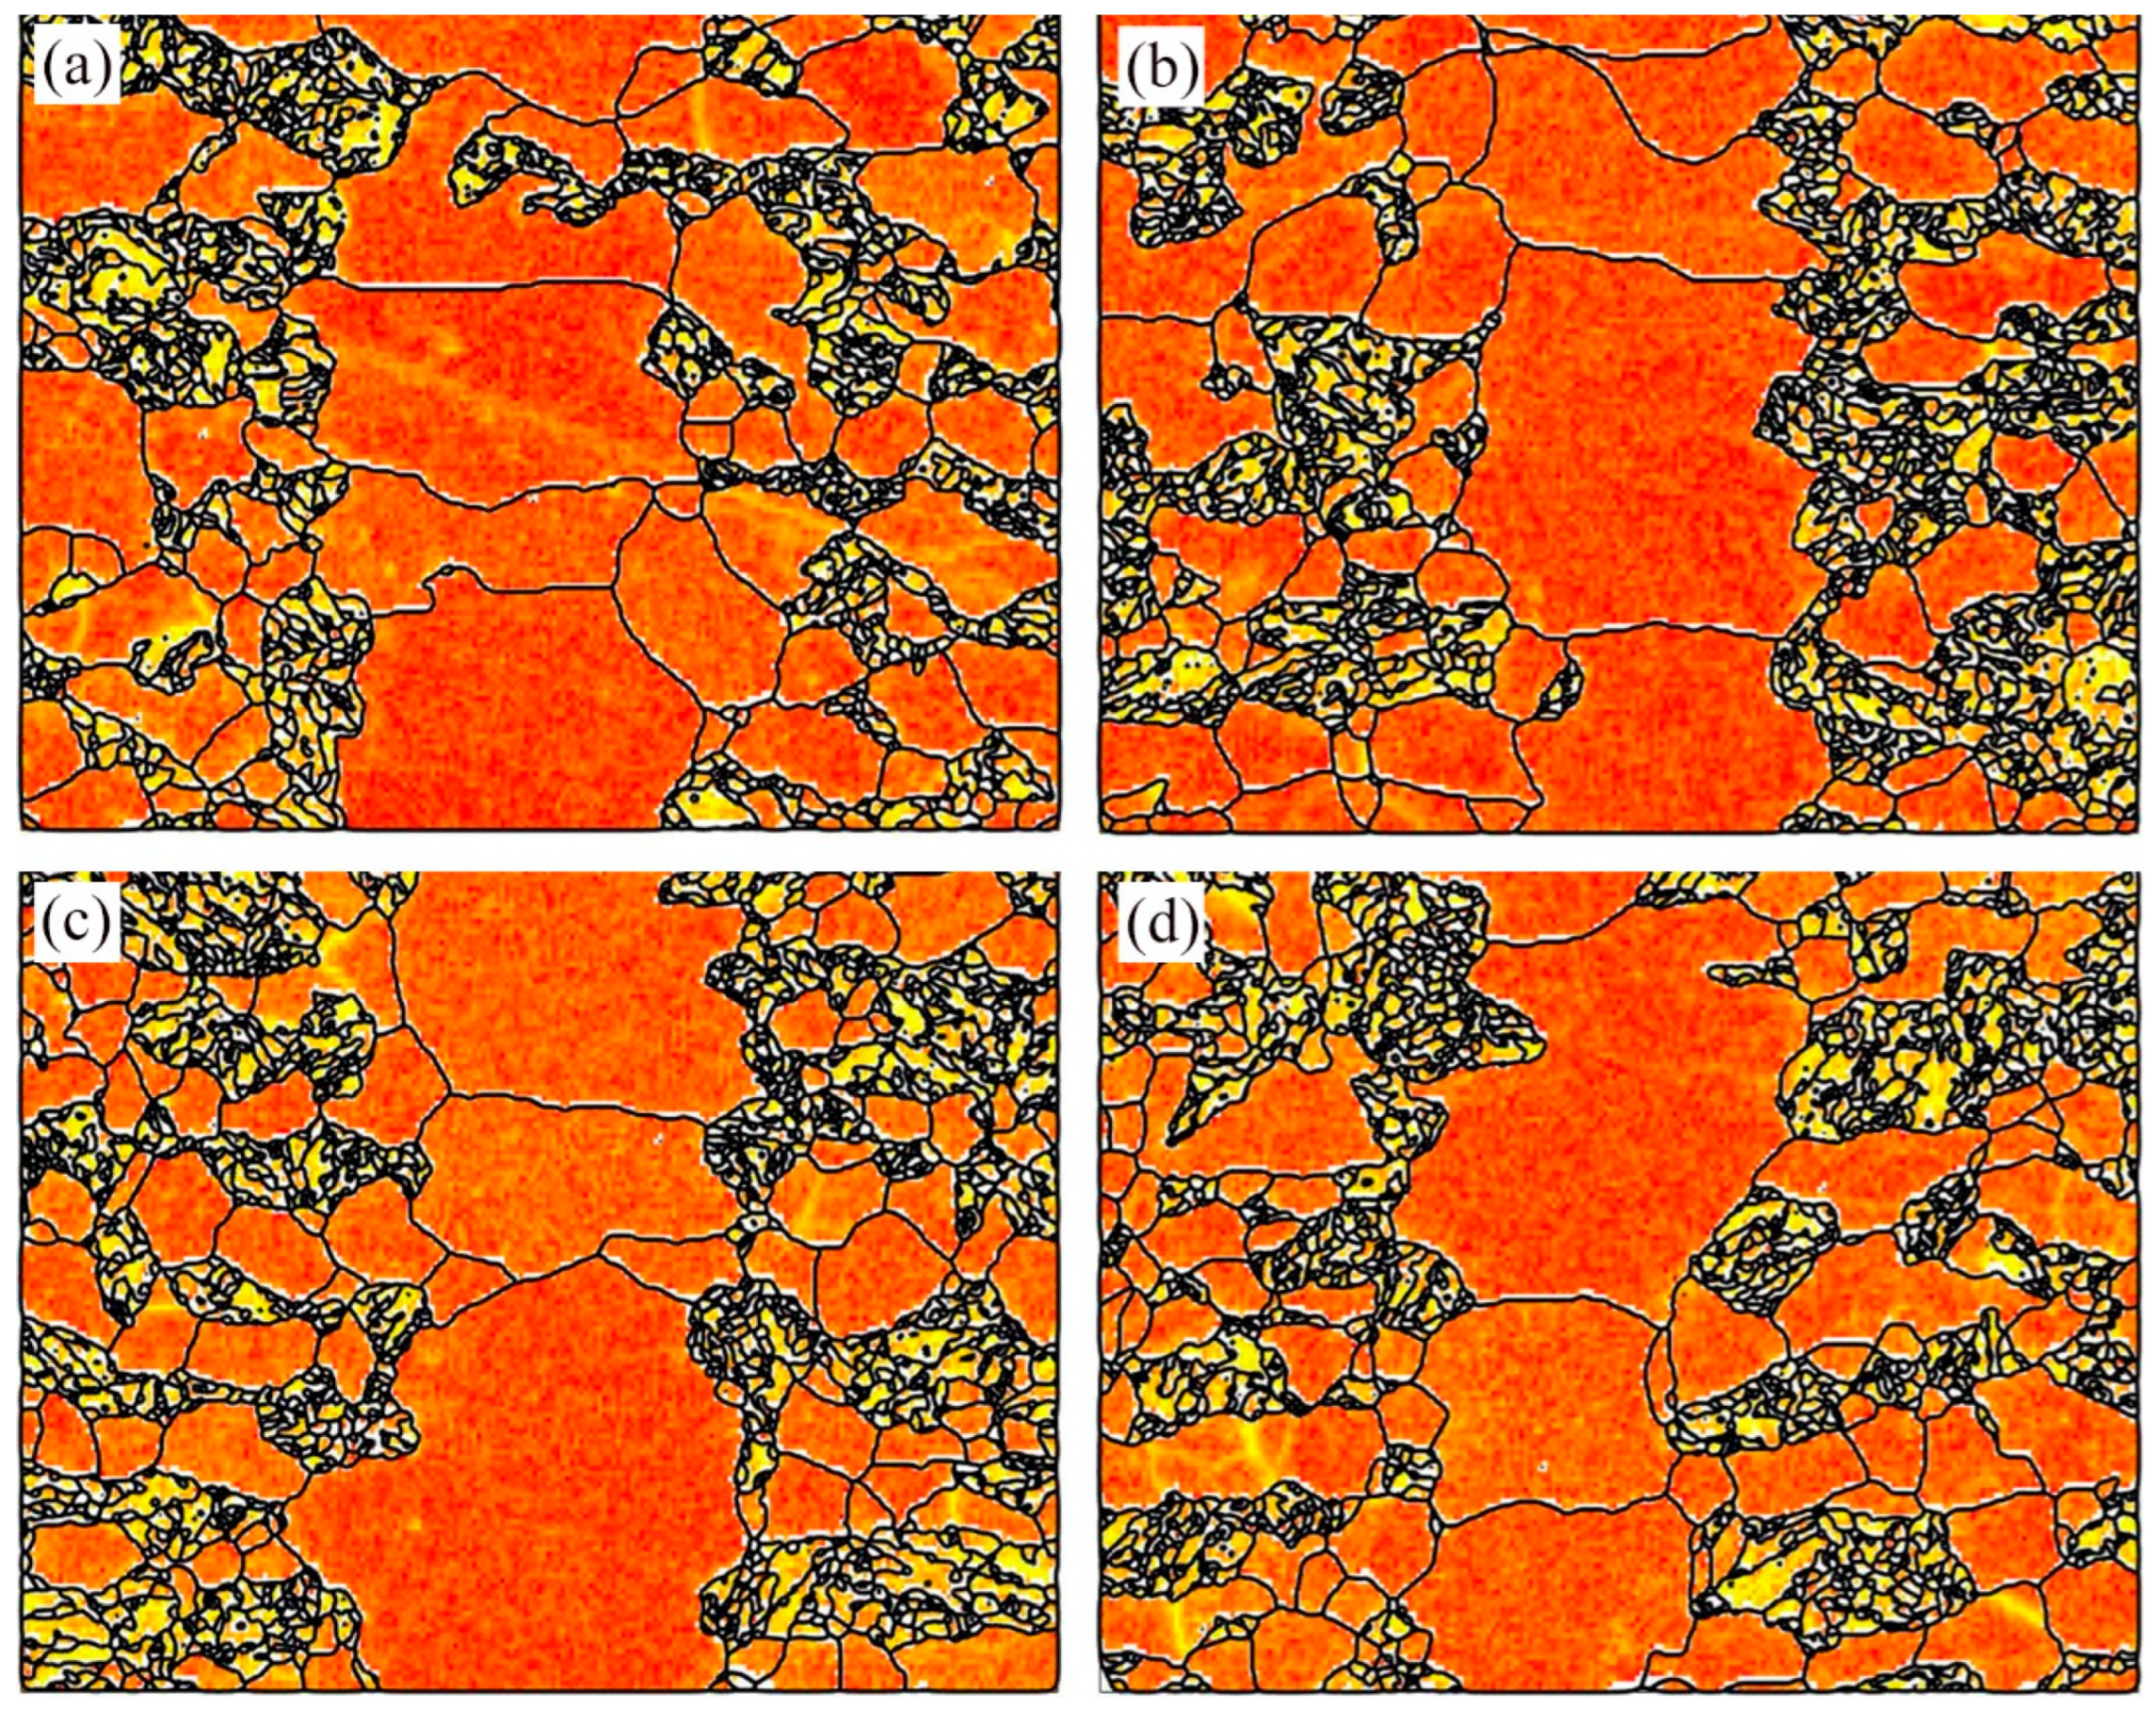
3.1. Microstructural Evolution of TLP Joints during Aging

The microstructures of the TLP joints for the different aging times at 550 °C are shown in Figure 2. We found that the ISZ (isothermal solidification zone) exhibits the typical morphology of polygonal ferrite due to the chemical composition of the Fe-Si-B interlayer. Obviously, the prolongation of the aging time has almost no effect on the width of the ISZ, which may be attributed to the relatively low aging temperature and short aging time. Besides, holes or pores were not observed in the TLP joints.
Figure 3 and Figure 4 show the maps of the grain-boundary distribution and grain-size statistics of the TLP joints, respectively. These two figures are both derived from EBSD analyses. It should be pointed out that the criterion for a low-angle boundary is 4°~15° of the misorientation angle in degrees. A misorientation angle of less than 4° is classified as a subgrain boundary, which is not shown in Figure 3 and Figure 4. A misorientation angle of more than 15° is judged as a high-angle boundary. Thus, the statistics on the average grain size only contain the low- and high-angle grains.
The effect of the grain-size on the material properties is mainly reflected in the fact that the grain boundary, or lath boundary, increases the resistance of dislocation movement; the grain boundary, or lath boundary, interacts with the second phase, and there is a change in grain-boundary strength. The average grain-size of TLP joints is 55 μm, 56 μm, 60 μm, and 65 μm, respectively, for aging 5 h, 20 h, 100 h, and 500 h, as seen in Table 2. Compared with the sample before aging, the average grain-size of which was about 51 μm, the average grain-size of the TLP joints aged for 500 h increased by about 27%. It is obvious that the grain-size of TLP joints increases with the extension of the aging time. Therefore, grain-coarsening is an obvious characteristic of the microstructural change of TLP joints during aging experiments.
High-temperature aging also has a significant effect on the formation of low-angle grain boundaries in TLP joints. With an increase in the aging time from 5 h to 500 h, the ratio of high-angle boundaries decreased from 48.6% to 44%, while the ratio of low-angle boundaries increased from 51.4% to 56%. Furthermore, the total length of the high-angle boundaries decreased by 22.6%. It has been reported that the prior austenite grain boundaries and ferrite boundaries are mainly high-angle boundaries, while the martensite lath and subgrain boundaries tend to be low-angle boundaries [27,28], which is consistent with the distribution characteristics of grain boundaries in Figure 3. The decrease of the proportion of high-angle boundaries may be due to grain-coarsening during high-temperature aging, resulting in the reduction of the length of high-angle grain boundaries in a unit area.

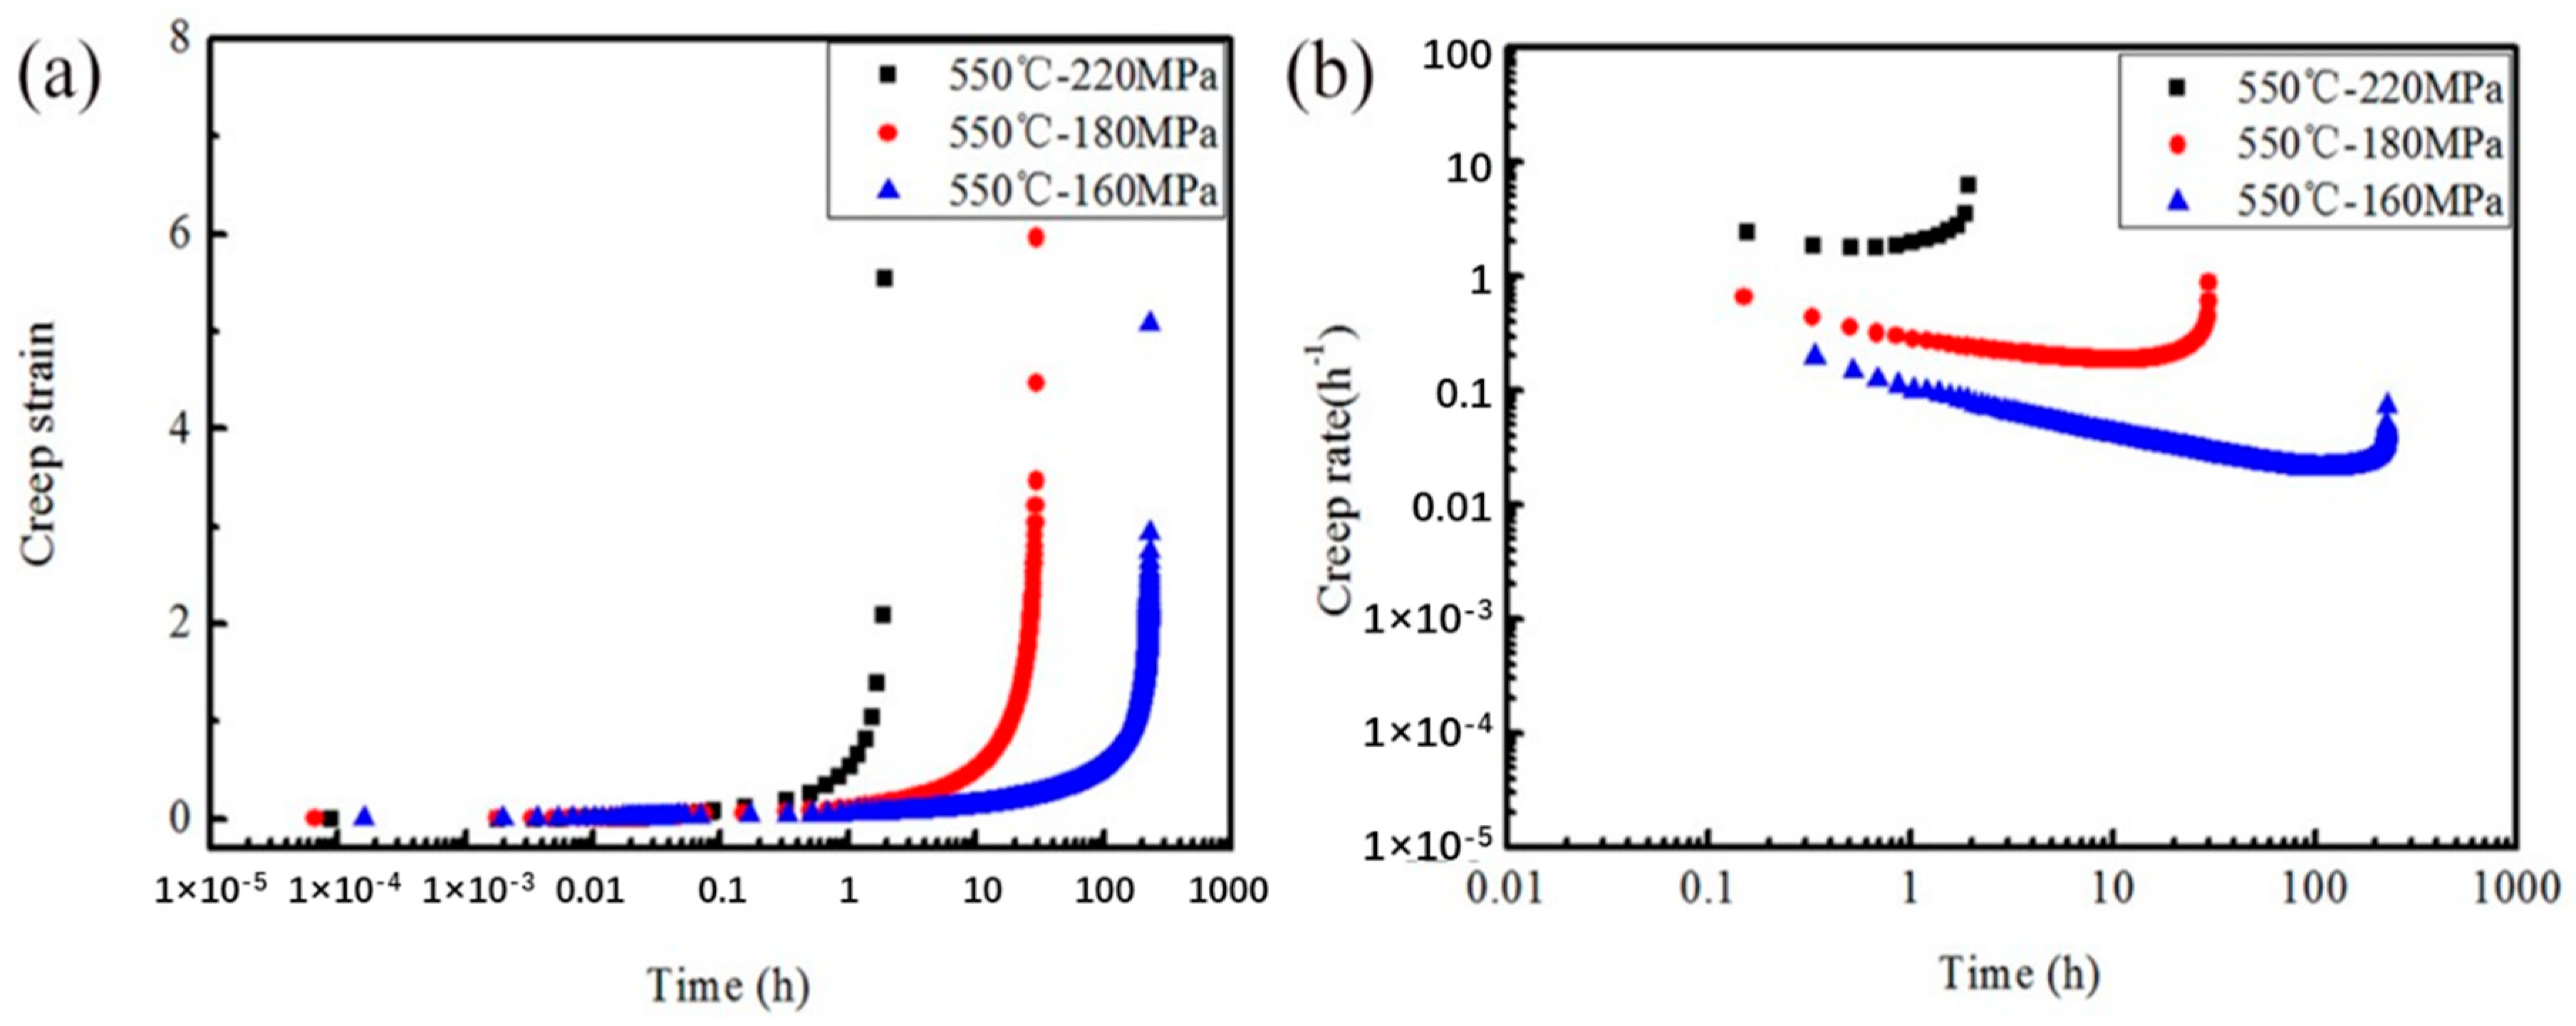
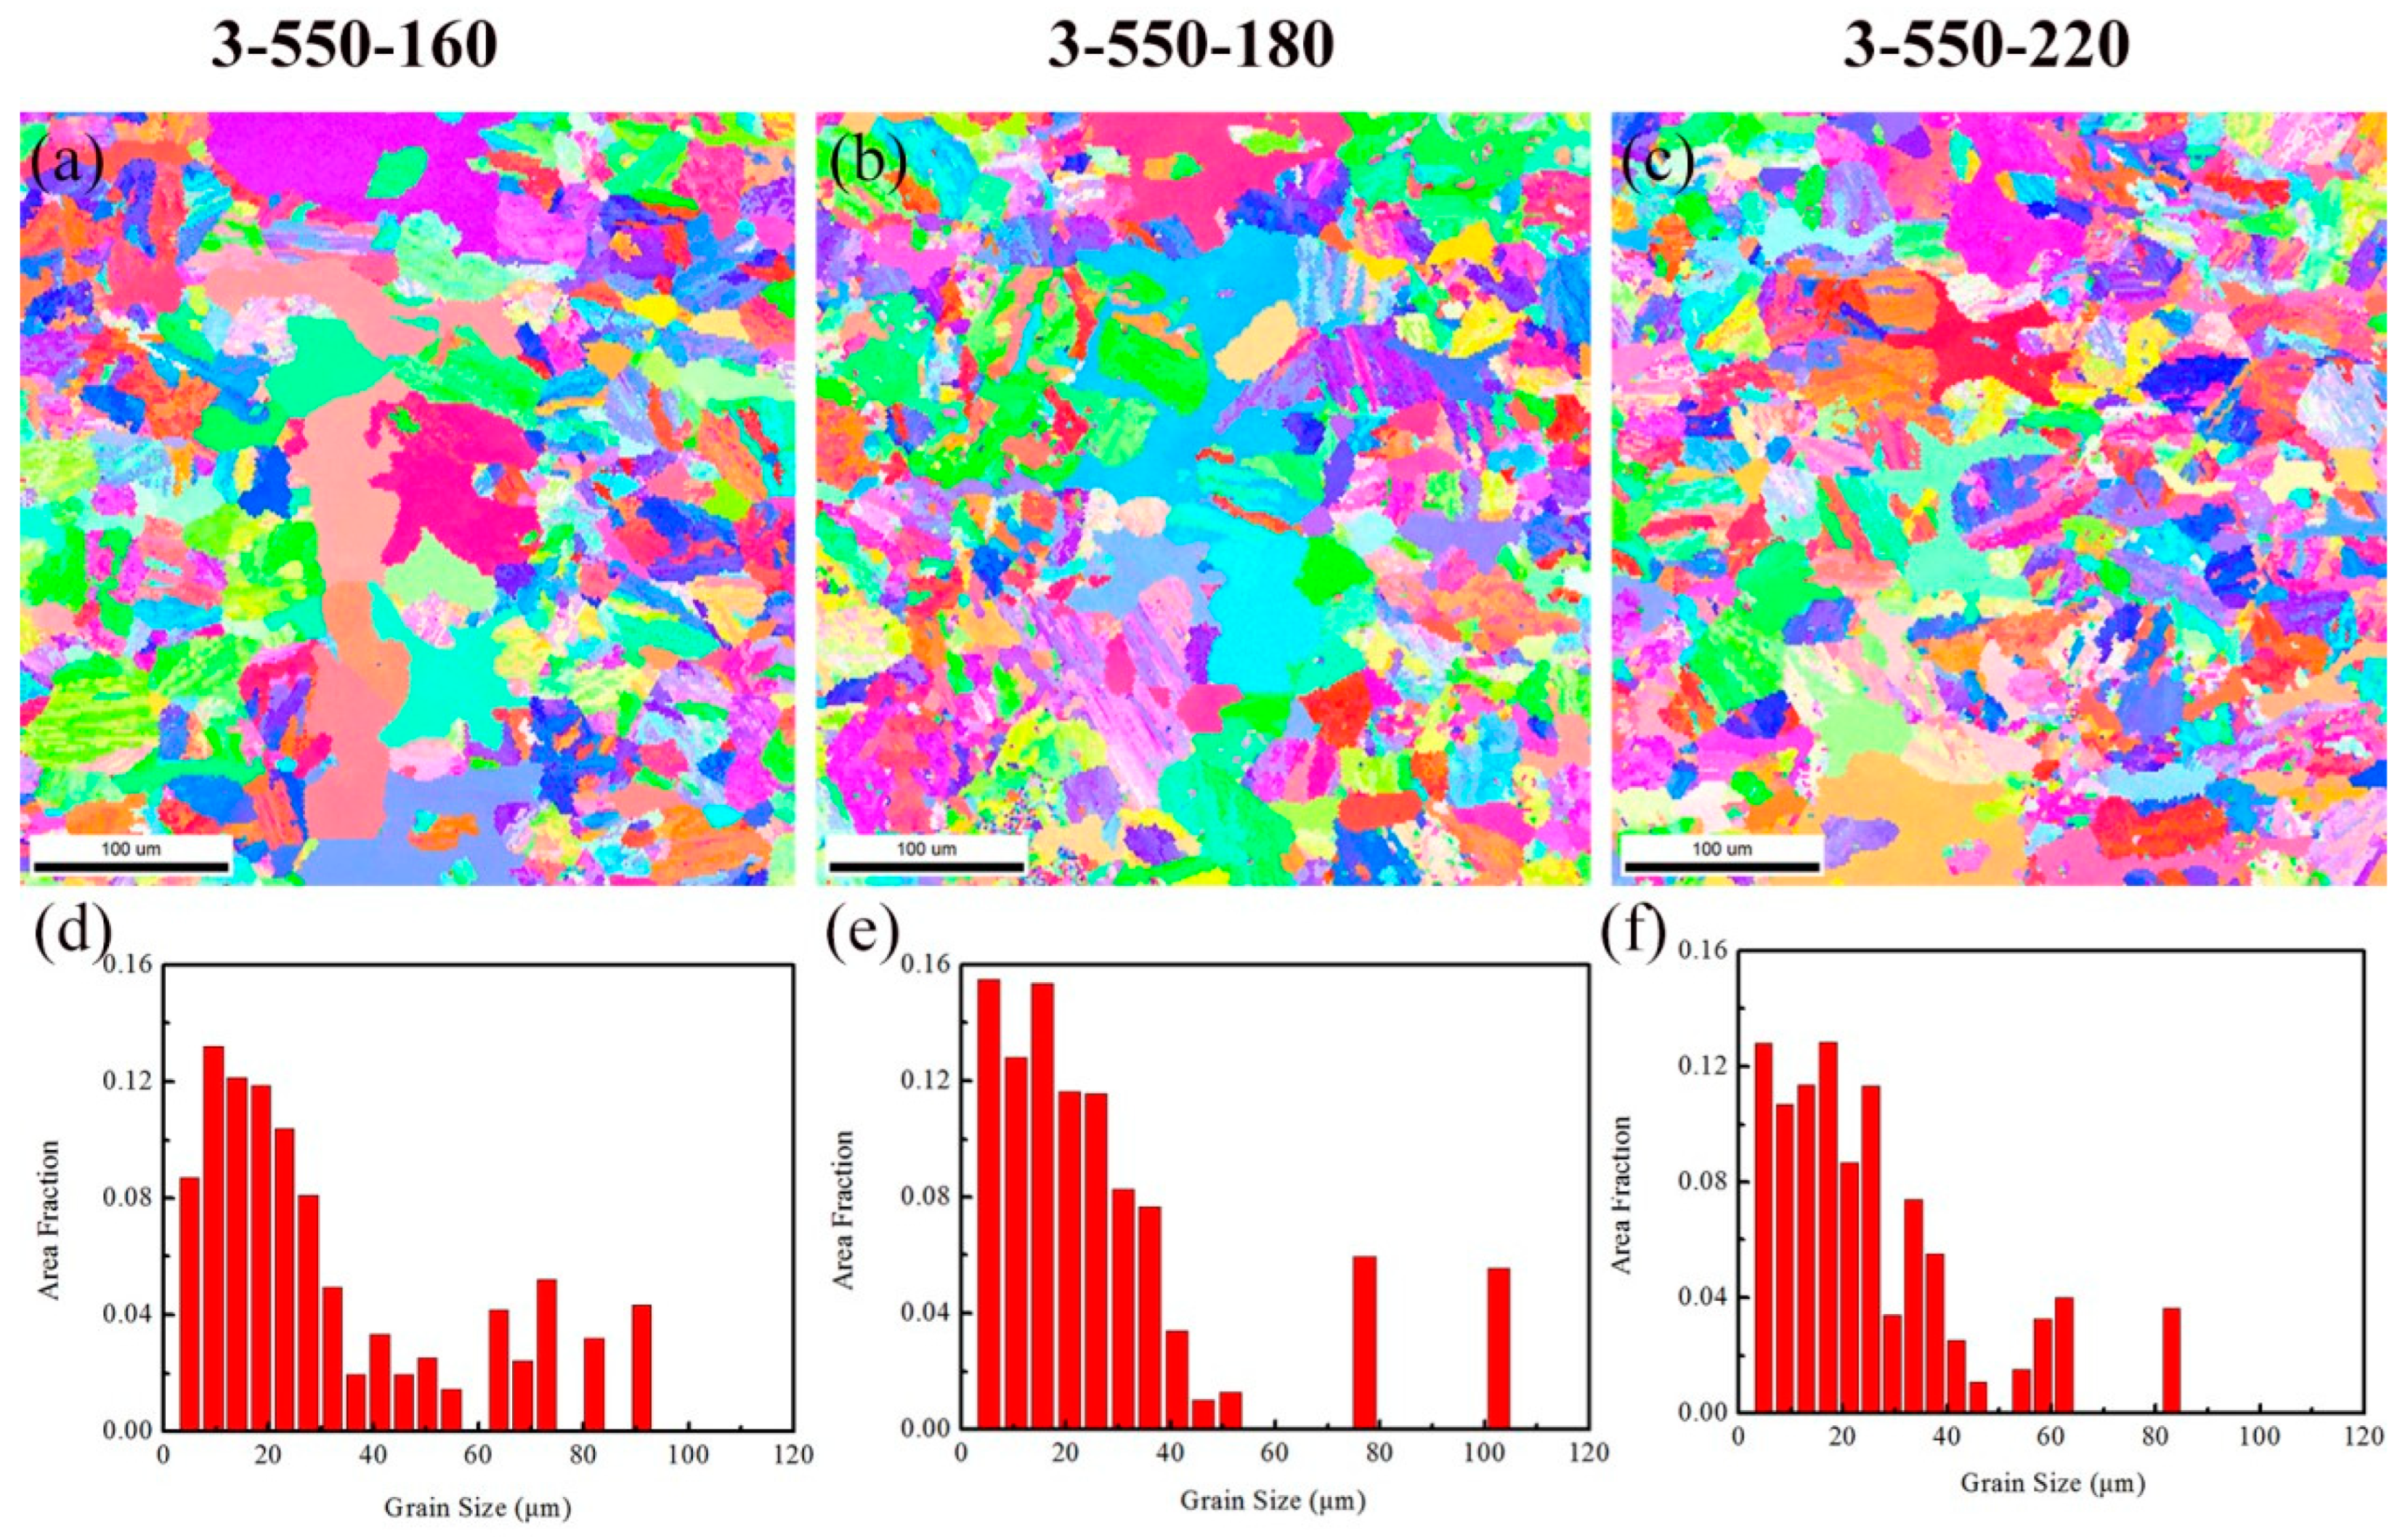
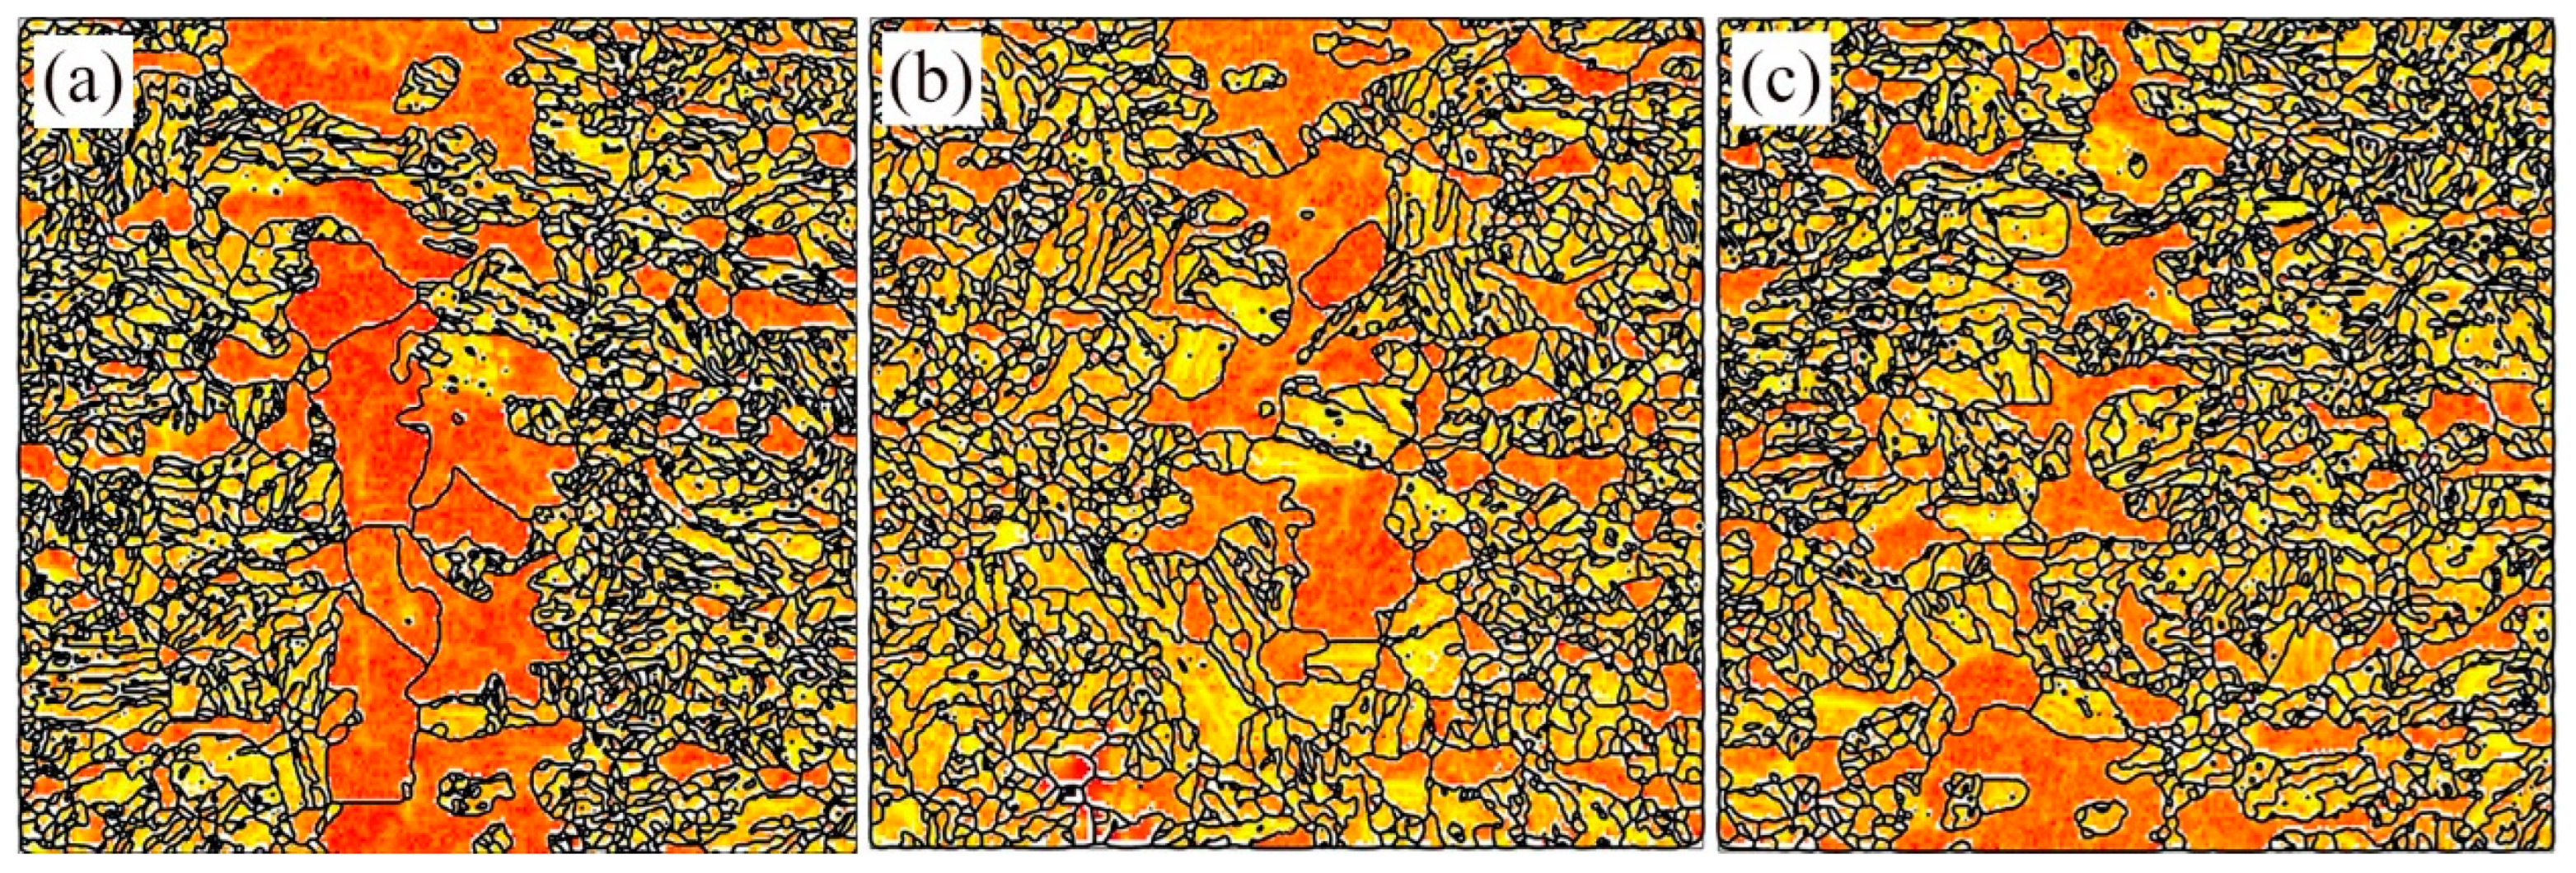
3.2. Creep Behaviors and Microstructural Evolution of TLP Joints during Creep

Figure 5 shows the creep curves of the TLP joints with different stress levels at 550 °C. As shown in Figure 5a, the creep-rupture time of the creep specimens is directly related to the creep stress. As the stress level decreases, the creep-rupture time of the samples increases. Generally, according to the change of the creep rate, each creep curve is divided into three stages: the transient creep stage, the steady-state creep stage, and the accelerated creep stage. The creep curves in Figure 5b show the obvious three-stage creep characteristics.
The fractures in creep specimens all occur in the base material, which suggests that the TLP joints may be stronger than the base material during the creep process. The SEM images for the fracture morphology of creep-fractured specimens for the different stress levels are shown in Figure 6. All of the samples exhibit ductile fracture morphology. The fracture morphology has typical micro-void-accumulation-fracture characteristics. The sizes and shapes of the dimples are related to the plastic deformation ability, external load, and temperature. With a decrease in the stress level, the sizes of the dimples become smaller and shallower.
The microstructure near the creep fracture for the sample after creep rupture under a creep stress of 160 MPa is shown in Figure 7. During the high-temperature creep process, the micro-voids mainly form on the austenite-grain boundaries or on the martensite lath boundaries. In addition, there are some coarse second-phases near the cavities, which may be attributed to the fact that the inclusions and the second phases tend to nucleate preferentially at the grain boundaries. In addition, recrystallized ferrite with relatively low strength and hardness has a much harder time resisting the creep deformation than martensite, which leads to creep-void aggregation, crack propagation, and fracture in the recrystallized ferrite [29].
As mentioned above, all of the creep samples sustained ruptures in the base material, rather than in the joint regions. This would be related to the microstructural evolution of the base material and the joints during the creep process. Figure 8 shows the microstructure of the creep joints after creep for the different stress levels. It can be seen that creep stress had a significant effect on the microstructural evolution of ISZ. For the aged samples, as seen in Figure 2, the ISZ and base metal were well-defined; the former is characterized by polygonal ferrite, while the latter exhibits the typical morphology of martensitic lath. However, the absence of a sharp division between the ISZ and base metal was observed in the creeped samples (see Figure 8), regardless of the creep-stress level. The microstructure of the ISZ is composed of polygonal ferrite and lath martensite, forming a uniform microstructure with the base material. Under creep-stress loading, martensite grains in the base metal grow into the ISZ along the direction of the creep stress, which leads to the grain-crushing of the polygonal ferrite in the ISZ. Obviously, creep stress is the main factor for the microstructural evolution for the TLP joints during the creeping process.
Kim et al. [30] indicated that grain-boundary migration during creep in polycrystalline materials plays a key role in the additional grain-boundary sliding of the elongated grain. The rapid grain-boundary migration would be favor creep deformation. Furthermore, grain-rotation-induced grain coalescence and grain-boundary decomposition in the vicinity of certain triple junctions also contribute to the creep deformation [31]. The micro-hardness of the base metal is higher than that of the ISZ in the TLP joints of RAFM steel [32]. Thus, the ISZ would afford more deformation than would the base metal during creep. As a result, grain-boundary migration accompanied with grain rotation results in the martensite growing from the base metal into the ISZ so as to coordinate the creep deformation. Due to this microstructural evolution of the ISZ during creep, creep fractures do not occur in the TLP joints although the polygonal ferrite in the ISZ is supposed to have a lower creep-resistance than the martensite in the base metal. Besides, an increase in the stress level accelerates the creep rate (as seen in Figure 5b), and thus promotes the grain growth of the martensite into the ISZ. As a result, the amount of martensite in the ISZ is increased by the increase of the creep stress (see Figure 9).
Figure 9 shows the SEM images and the EDS result of the TLP joints for the sample after creep fracture with a stress of 220 MPa. As shown in Figure 9b, a large number of the fine and dispersed particles were precipitated at the martensite lath and the prior austenite grain-boundaries. It is possible to make these particles into M23C6 carbides according to EDS analysis (marked by a circle in Figure 9b, as seen in Figure 9c). M23C6 carbides can effectively pin the grain boundaries, preventing the migration of the grain boundaries during creep-deformation, thereby improving the creep-resistance [33]. However, M23C6 carbides tend to coarsen rapidly at relatively high temperatures. Compared with M23C6 carbide, MX carbonitride has better high-temperature stability and a smaller size. Fine MX carbonitrides can act as obstacles to dislocation movement and annihilation, thus promoting a dislocation strengthening effect. Hence, MX particles have a better effect in improving long-term, high-temperature creep-resistance than do M23C6 carbides. However, MX carbonitrides are difficult to identify using SEM due to their small size.
The TEM images of the weld zone and base metal after creep fractures for different stress levels are shown in Figure 10. The sample of base metal for TEM observation was taken from the creep sample near the fracture, while that of weld zone was taken from the center line of the joint. The left side of Figure 10 denotes the base metal, while the right side represents the weld zone. The base metal exhibits the typical morphology of lath martensite, whereas the weld zone shows the microstructure of polygonal ferrite.
For the base metal (see the left side of Figure 10), it can be seen that a decrease in creep-stress results in an increase in the martensitic lath width, which would be due to the increase in the creep-time. Besides, the decrease in the creep-stress also led to the coarsening of the precipitates. For the different stress-levels of 160 MPa, 180 MPa, and 220 MPa, the average widths of the martensite laths were 736 nm, 640 nm, and 582 nm, and the average sizes of precipitates were 141 nm, 129 nm, and 120 nm, respectively. This would be related with the creep-time. For lower creep-stress, the creep-time is longer, which promotes the coarsening of the martensite lath and precipitates.
For the weld zone (see the right side of Figure 10), we found that the higher creep-stress caused larger polygonal ferrites. For the different stress levels of 160 MPa, 180 MPa, and 220 MPa, the average sizes of the polygonal ferrites were 970 nm, 721 nm, and 638 nm, respectively. Furthermore, the increase in the creep-stress results in the decrease of average size of the precipitates, with 161 nm, 140 nm, and 133 nm for the creep-stresses of 160 MPa, 180 MPa, and 220 MPa, respectively. These results are consistent with those of the base metal, as indicated in the previous paragraph, which can be also attributed to the difference in creep-time. It should also be noted that, under a higher creep-stress, the martensite laths migrated from the base metal to the weld zone, which was also realized in the OM images (see Figure 8).
Figure 11 demonstrates the inverse pole figure (IPF) and grain-size statistics of the weld zone for different stress levels. Different colors in the IPF represent different orientations. From Figure 11a,b, it can be seen that the grain-orientation of the ISZ is various and uniformly distributed. There is no obvious texture or preferred orientation distribution. According to the statistical results of the grain-sizes shown in Figure 11d–f, the average grain-sizes are 32 μm, 28 μm, and 25 μm for 160 MPa, 180 MPa, and 220 MPa, respectively. With increases in the stress level, the microstructure of the ISZ was significantly refined. Grain-size may also be an important factor affecting high-temperature creep properties. Reference [34] has indicated that the prior austenite grain-size plays a key role in the creep-resistance in 9% Cr steel.
The grain-boundary distribution map and misorientation statistics of the weld zone are shown in Figure 12. The contents of high-angle grain-boundaries in the weld zone were 31.4%, 36.9%, and 40.7% for 160 MPa, 180 MPa, and 220 MPa, respectively. The high-angle grain-boundaries gradually increased with increasing the stress level. This may be attributed to the refinement of the grains and the increases in the number of grains at high stress levels. In addition, the dual effects of temperature and stress made the martensite-lath coarsening and subgrains recover, accelerating the transition from low-angle grain boundaries to high-angle grain boundaries [35]. The increase in high-angle grain boundaries can change the crack-propagation path frequently, thereby effectively hindering crack-propagation [36].

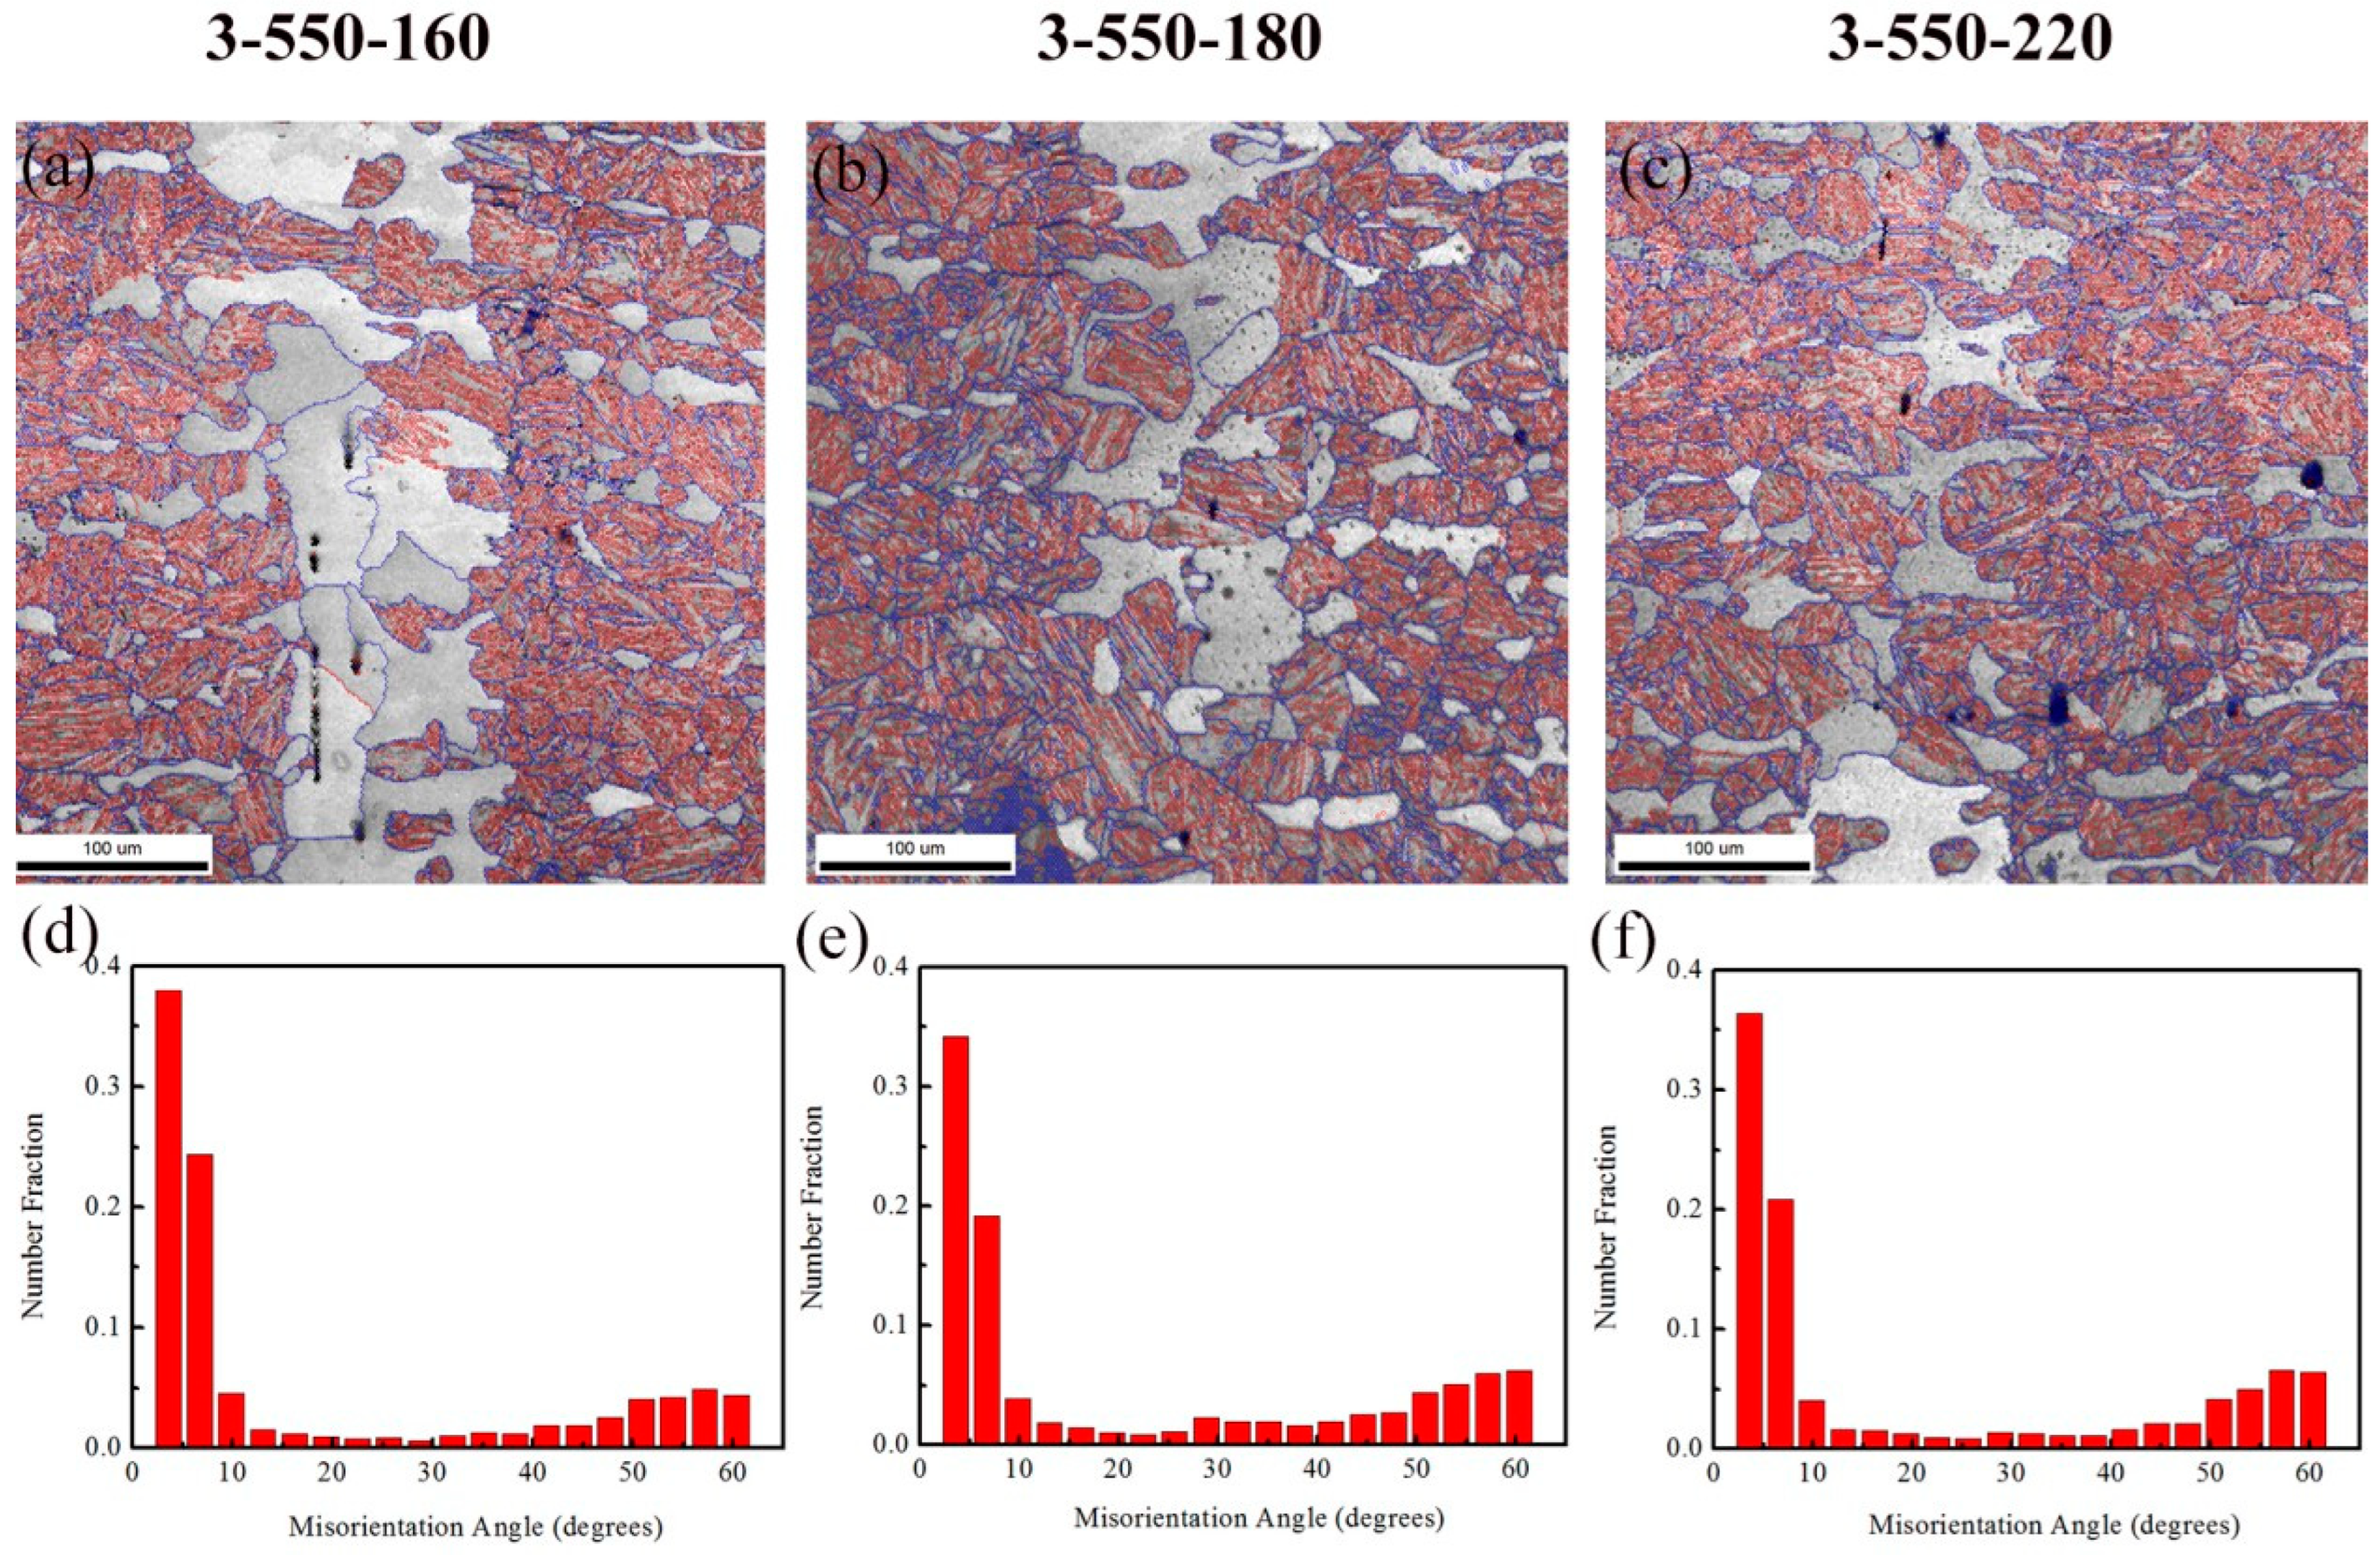
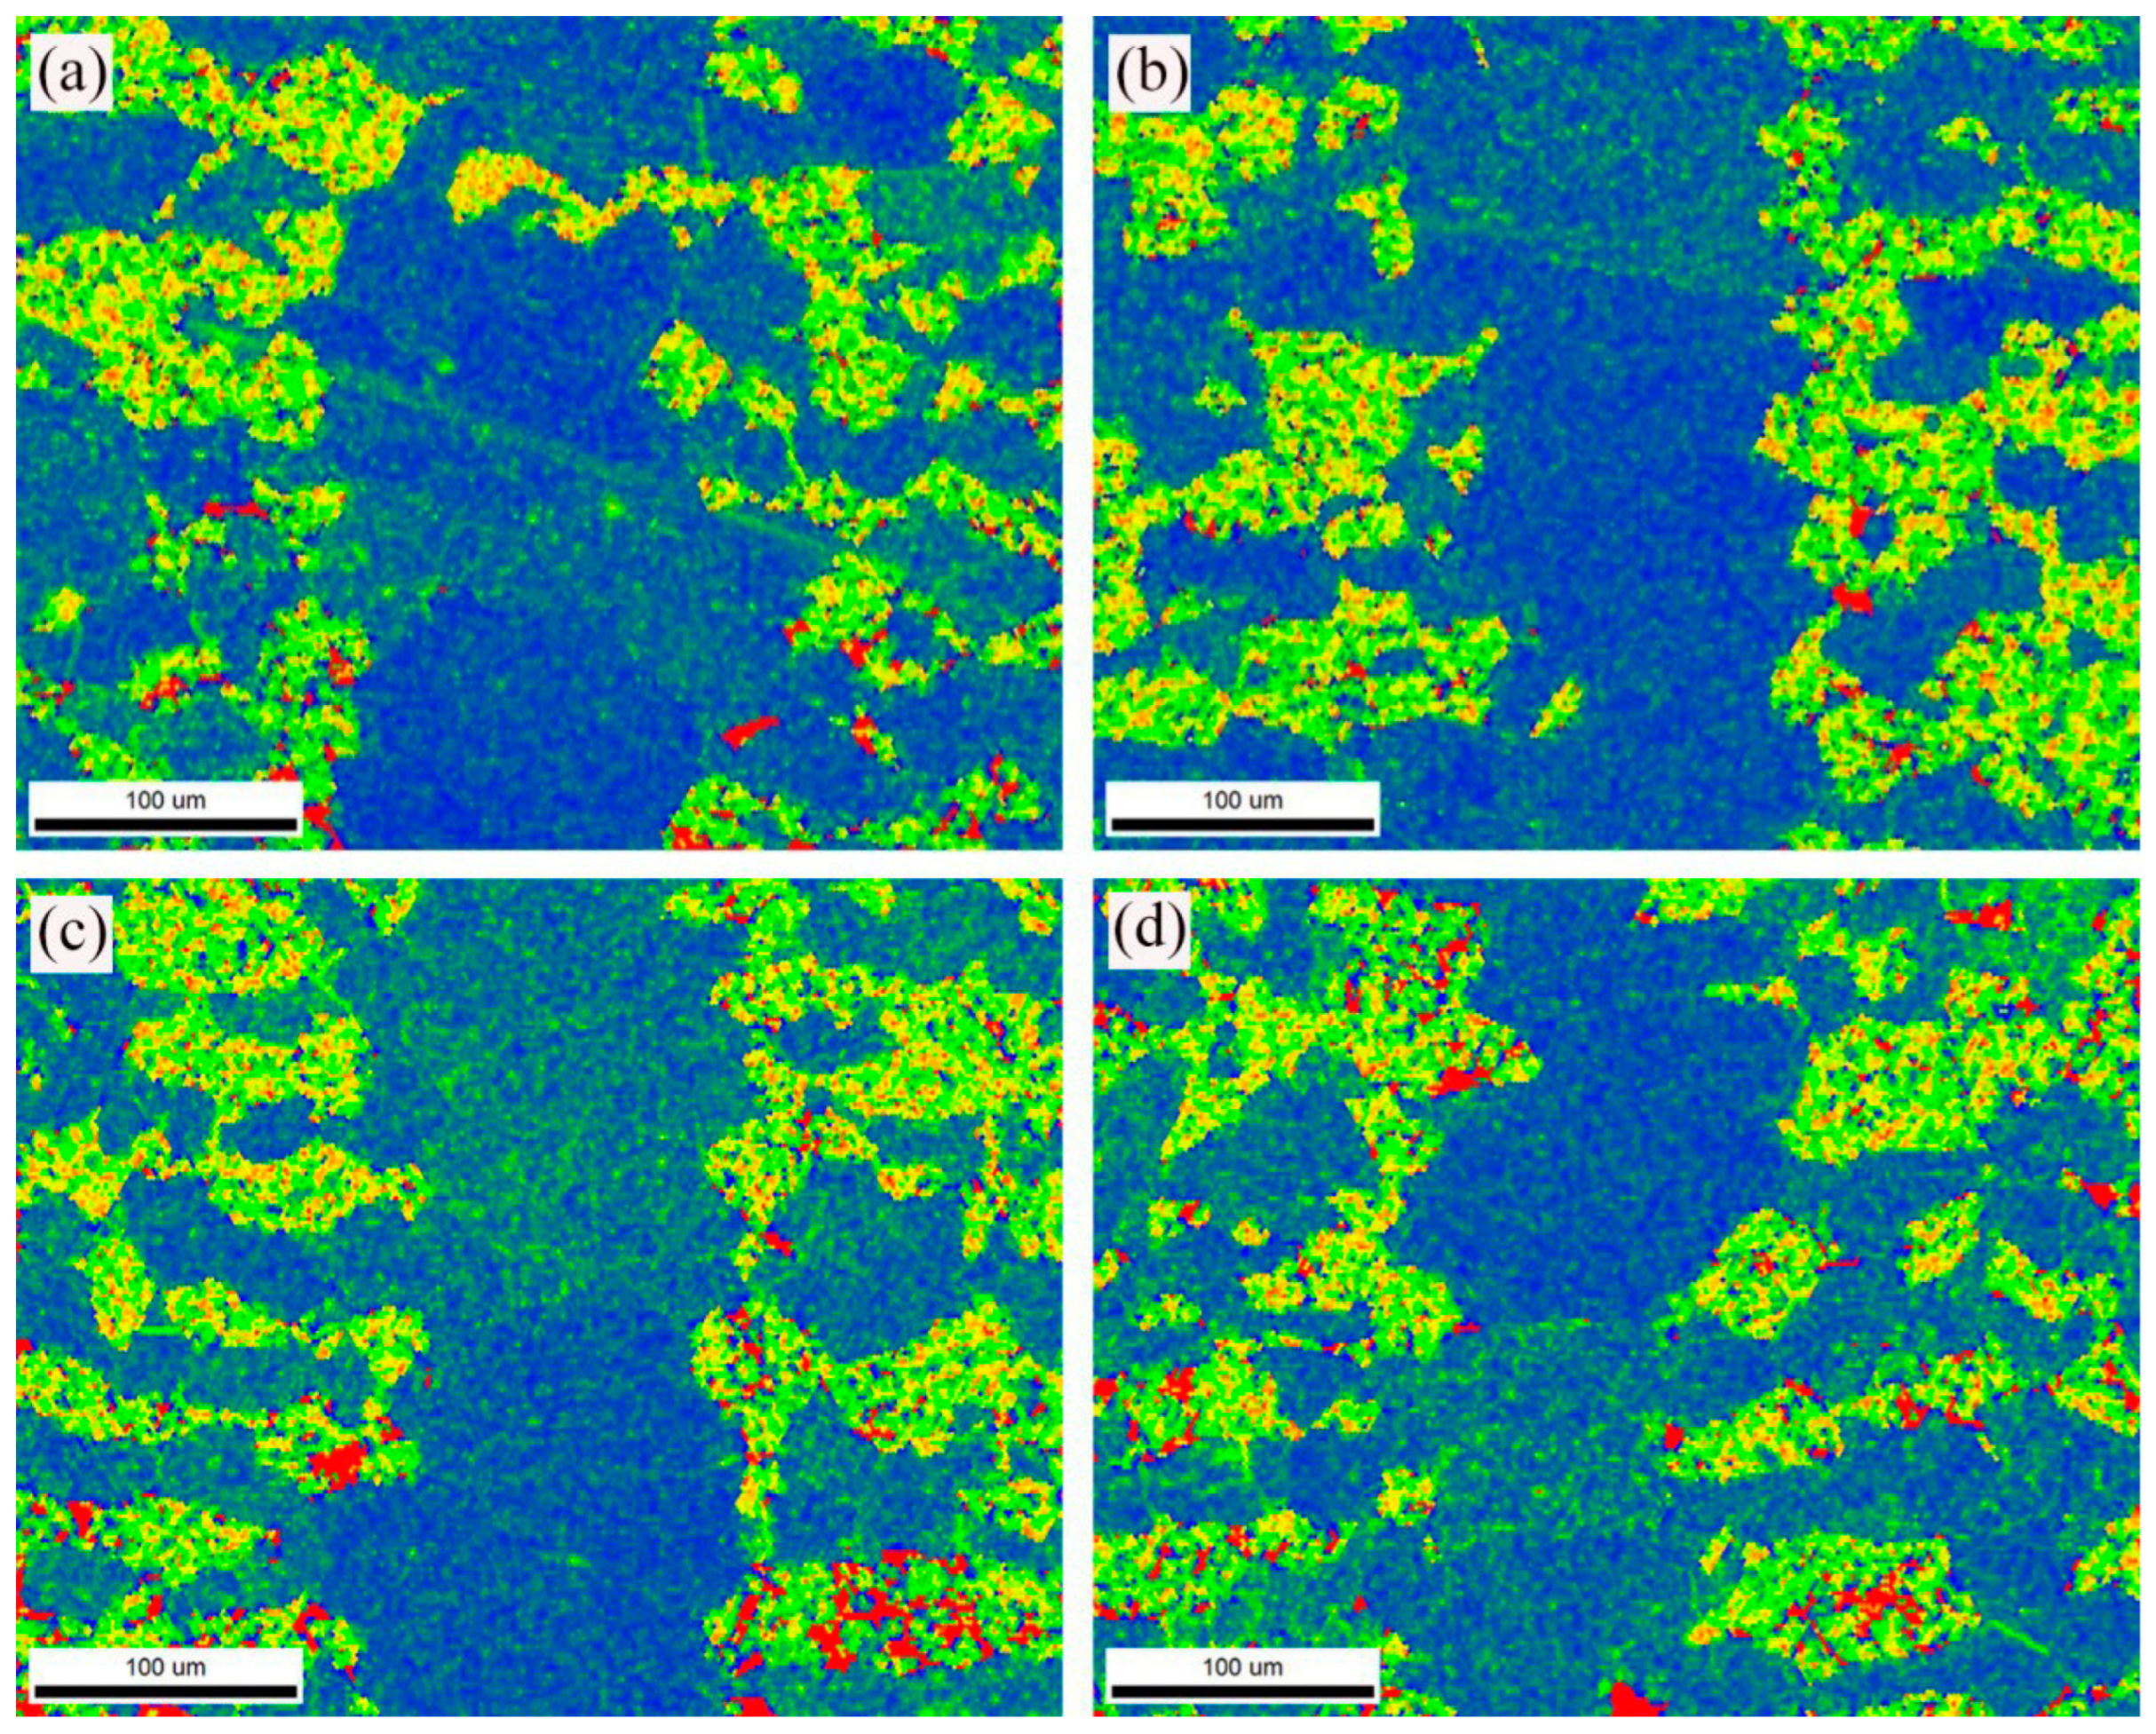
3.3. Effect of Stress Loading on the Microstructural Evolution of TLP Joints

During the high-temperature aging process, dislocations are activated, and dislocations multiply and interact to form subgrains. The dislocations are annihilated through sliding and climbing, reducing dislocation tangles. As a result, the dislocation density is reduced, and the effect of dislocation strengthening is weakened. The KAM (kernel average misorientation) quantifies the average misorientation around a measuring point with respect to a defined set of nearest-neighbor points [37]. The KAM value distribution can characterize the dislocation density. As can be seen, the blue areas with the lowest values of KAM indicate a low dislocation density, while the green areas with higher KAM values indicate a higher dislocation density. The KAM distribution of the joint for different aging times is demonstrated in Figure 13. The KAM value in ferrite is lower, and the KAM value in martensite is higher. With increases in the aging time, the dislocation density gradually decreases and then stabilizes. However, dislocation strengthening is not the main mechanism of strengthening during creep. A high dislocation density causes a large number of dislocations to entangle, resulting in local stress concentration and microcracks.
The KAM distribution map and TEM microstructure of the creep joint for different stress levels are demonstrated in Figure 14 and Figure 15. When the stress level is 160 MPa, the KAM value of the ISZ is low and characterizes lower dislocation density; when the stress level is 220 MPa, the KAM value in the ISZ increases significantly. This may be due to the fact that high stress causes the grain boundaries of large-sized ferrite grains in the ISZ to be damaged, and defects, such as dislocations within the grain, increase. The dislocation density inside the martensite in the ISZ zone is also higher, which increases the dislocation density of the weld.
The trend of the dislocation density change in the KAM is consistent with the phenomenon observed in Figure 15. The dislocation density in the weld gradually increases with the increasing stress level. In the ISZ with a low dislocation density, due to the limit of solute atoms and fine precipitates, the dislocation lines zigzag, indicating that the solute atoms and fine precipitates increased the resistance of the dislocation movement and made dislocation-slip difficult. A large number of dislocation movements are blocked at the grain boundaries or the martensite-lath boundaries. High-density dislocation tangles further form dislocation walls and even dislocation cells. However, the dislocation density in the base material region decreases as the stress level increases. This happens because, during the high-stress creep process, high-density dislocations in dislocation cells are rearranged in an orderly way to form subgrains, and the substructures recover, thereby reducing the dislocation density [38].
Two phenomena have been proposed to evaluate dislocation-densities using EBSD data: geometrically necessary dislocation (GND) and statistically stored dislocation (SSD). GNDs are generated as excess dislocations within a Burgers circuit to satisfy geometrical compatibility between the grains and strain gradients due to the geometrical constraints of the crystal lattice [39]. Usually, high dislocation density regions are generated during deformation to maintain lattice continuity [40]. The KAM value provides a basis for evaluating the dislocations, and the GND map can be further obtained through the measurement of the misorientation. There is an overlapping of the areas of higher KAM values with the higher GND densities, as expected, since GND is similar in nature to KAM [41]. The GND map can qualitatively evaluate the dislocation density in the grains by the color distribution. The GND maps of the joint for different aging times are shown in Figure 16. The color change from dark to light represents the change process of the GND density from low to high. As shown in Figure 16, the GND density in ferrite is lower, and the GND density in martensite is higher. The reason for this difference between ferrite and martensite is attributed to the different mechanical properties of these phases [42]. In general, ferrite improves the ductility of the material, and martensite increases the strength of the material. Martensite begins to deform at higher stresses, and that leads to higher GND values for the martensite phase.
The dislocation density may be related to stress [43]. The GND maps of the creep joint for different stress levels are shown in Figure 17. With increases in the stress level, the GND density of the ISZ increases. Compared with aging samples and creep samples for 550 °C, the stress-loading has an important role in the dislocation density. The dislocation density increased significantly with the stress-loading.

4. Conclusions

In this paper, high-temperature creep tests and aging tests of TLP joints for RAFM steel were carried out. The conclusions can be summarized as follow:
(1)
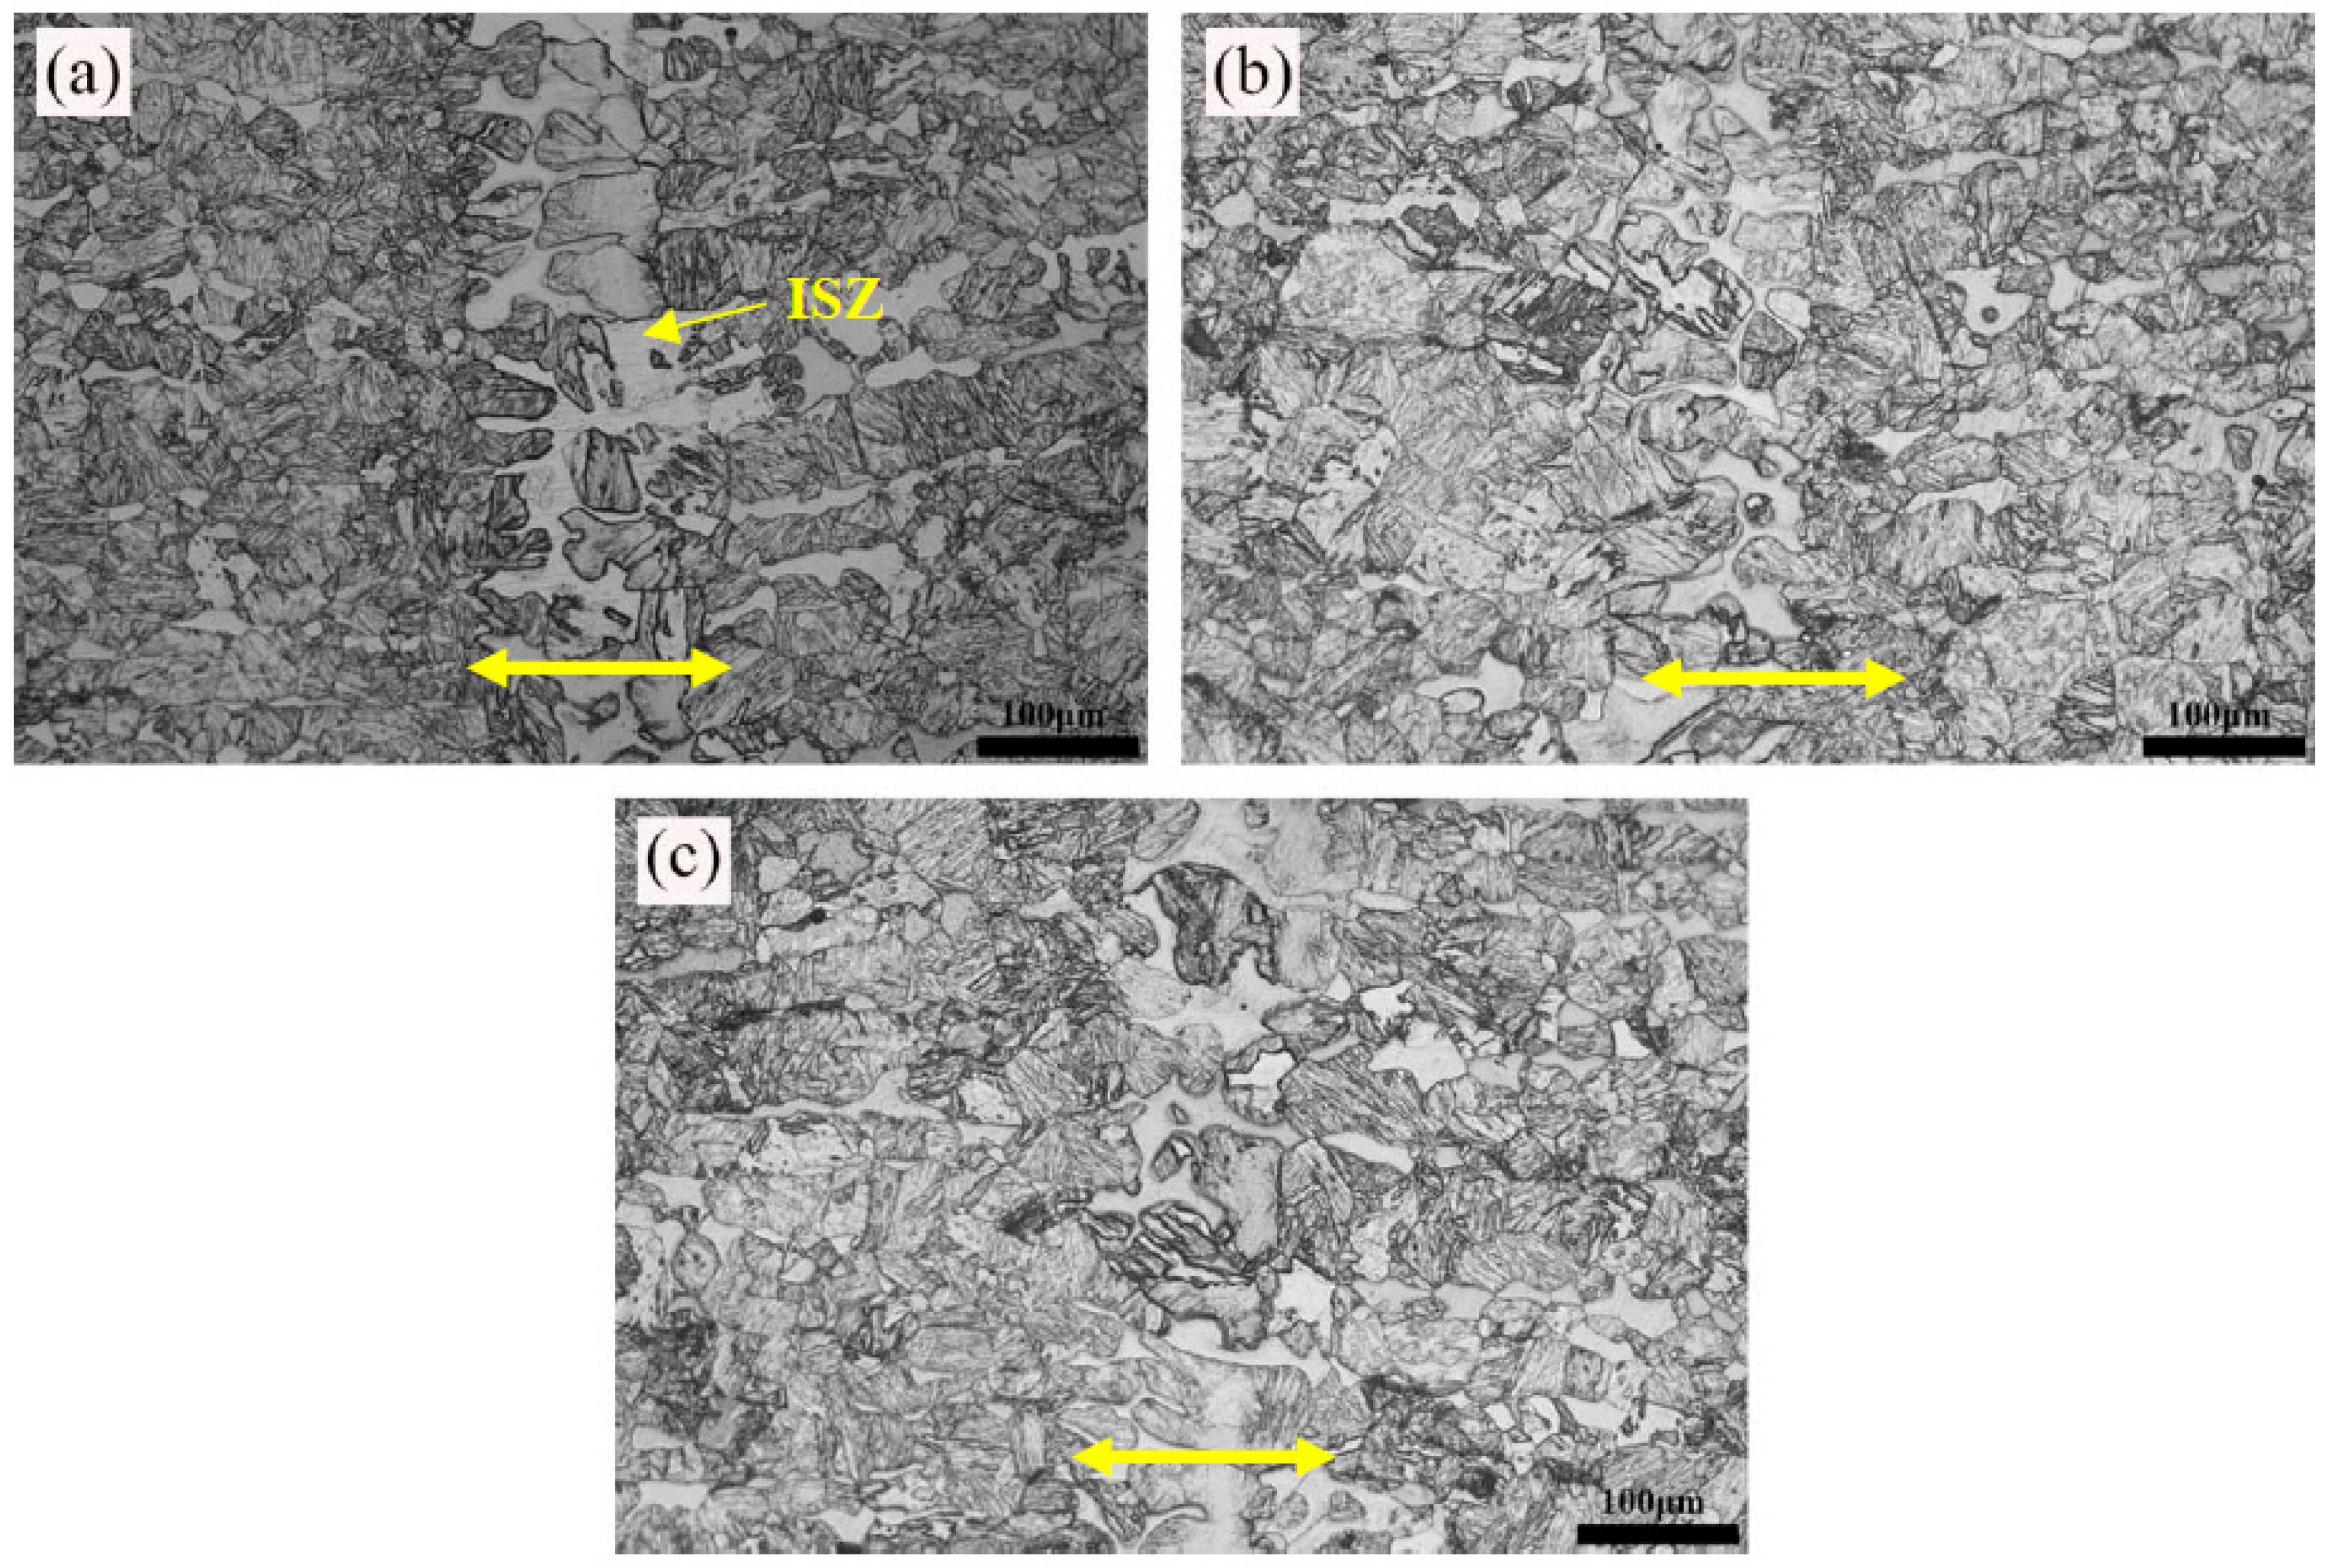
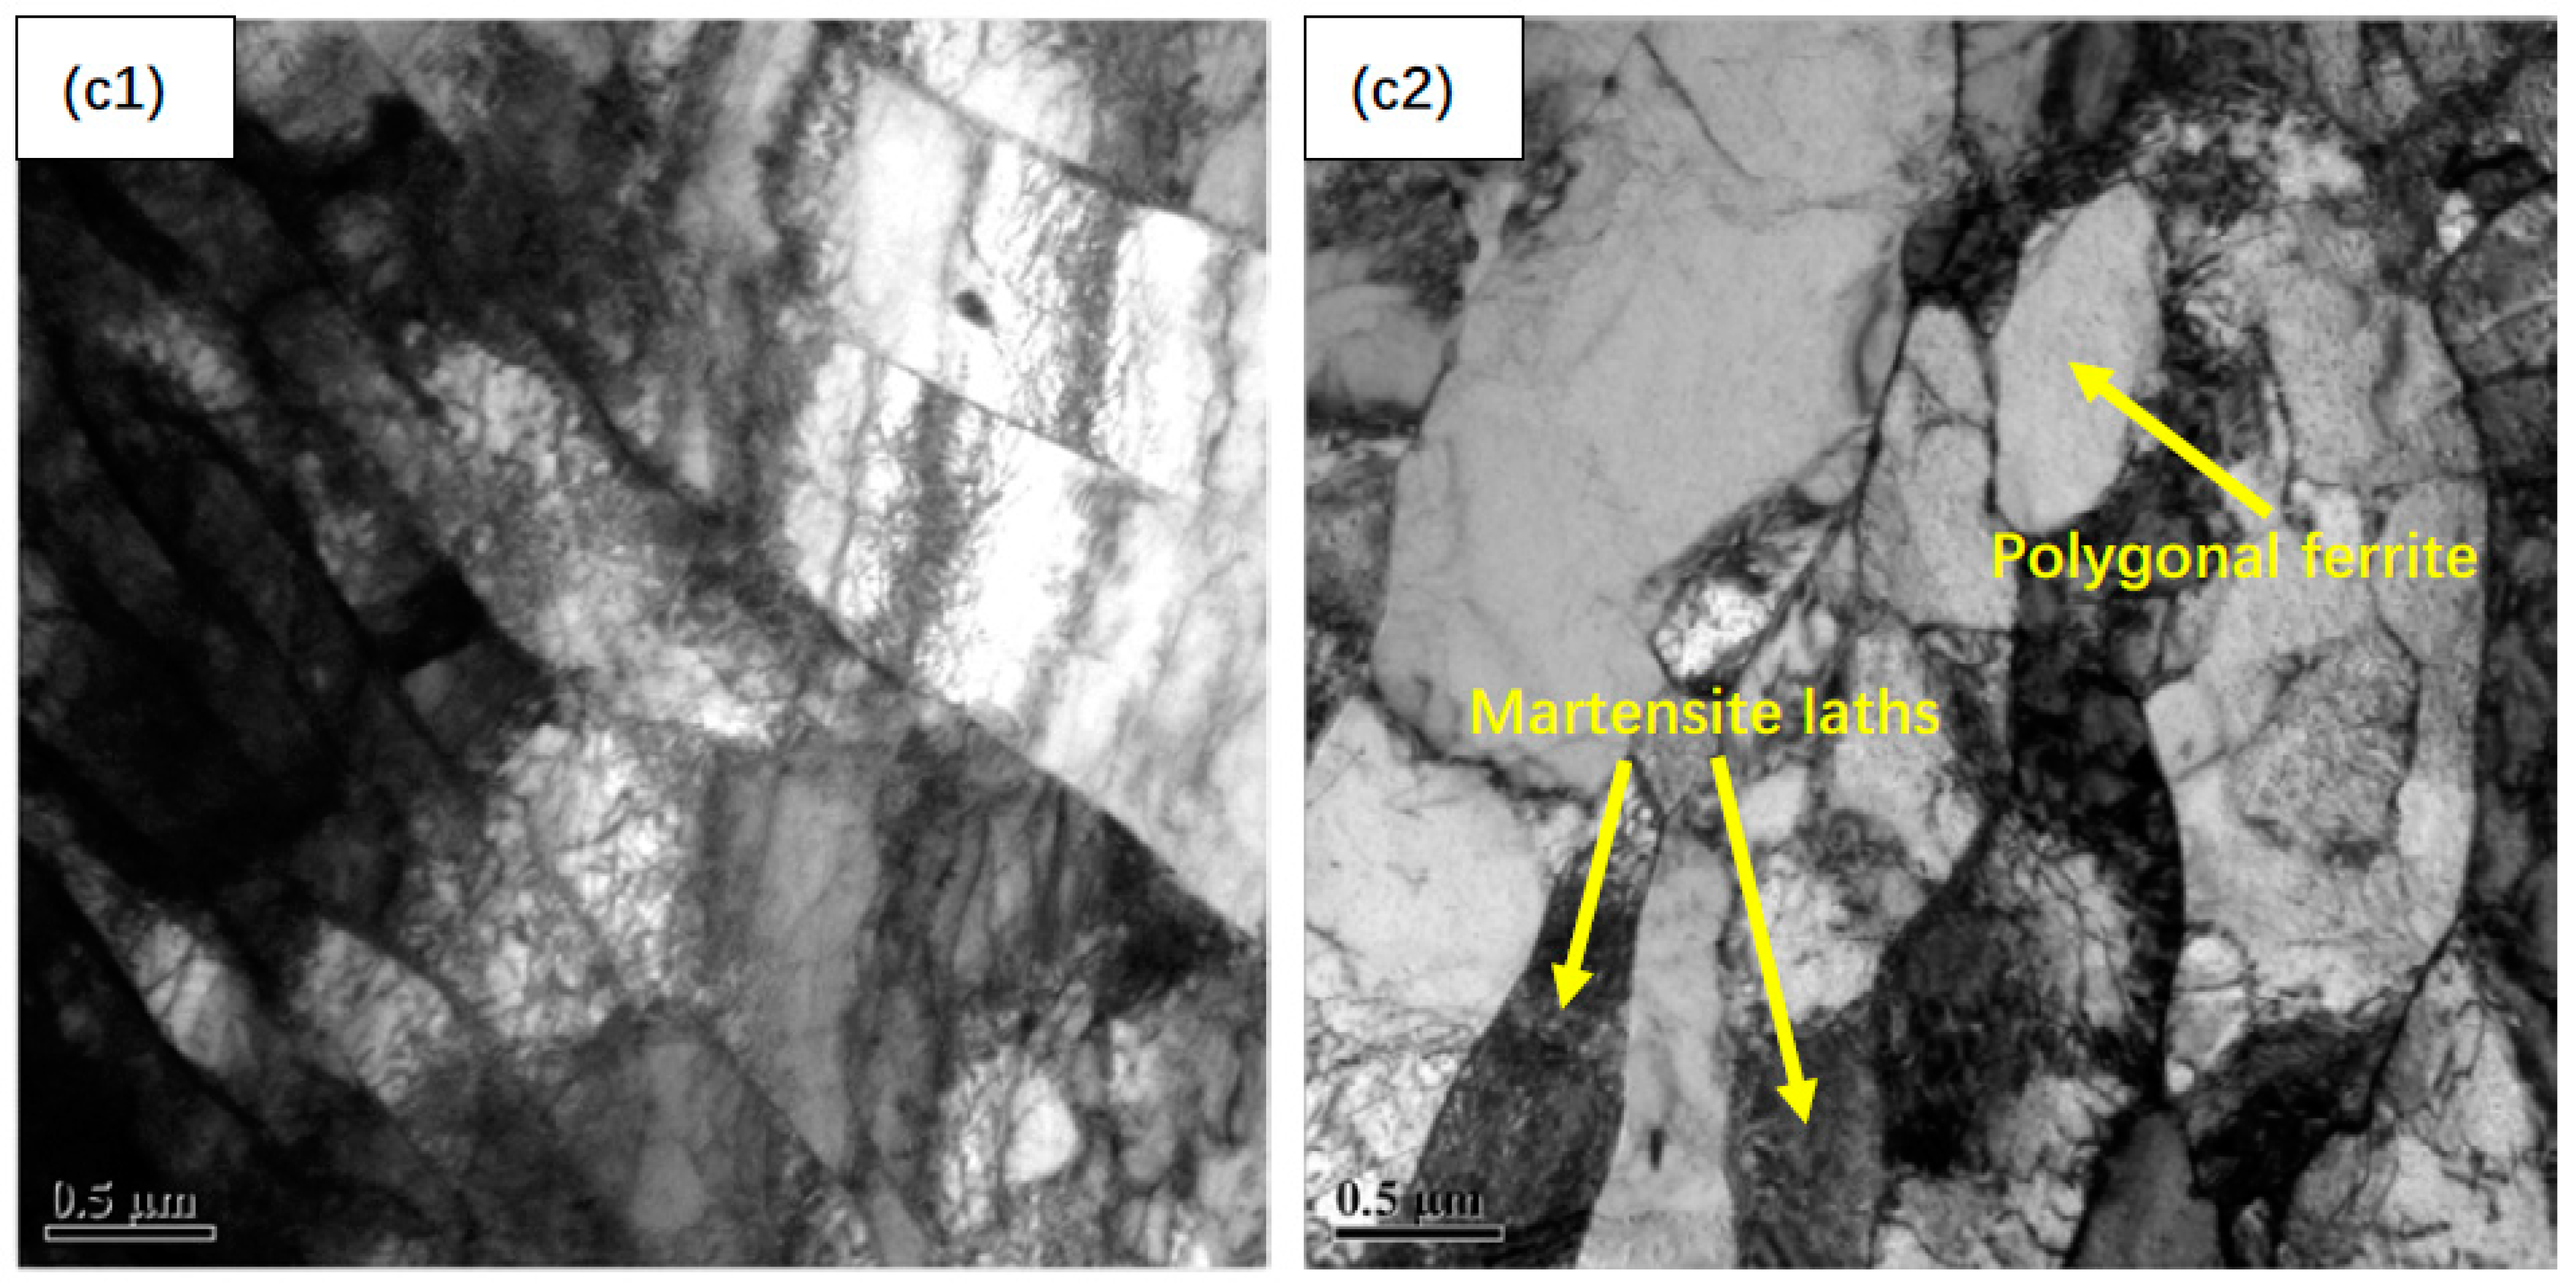
During the high-temperature creep process, the base material area is the weakest part of the TLP joint for RAFM steel. the stress load is the main factor leading to recovery and grain-refinement in the weld zone. The microstructure of the weld zone changed from large-sized ferrite to a mixed microstructure of ferrite and martensite with the increase of creep stress.
(2)
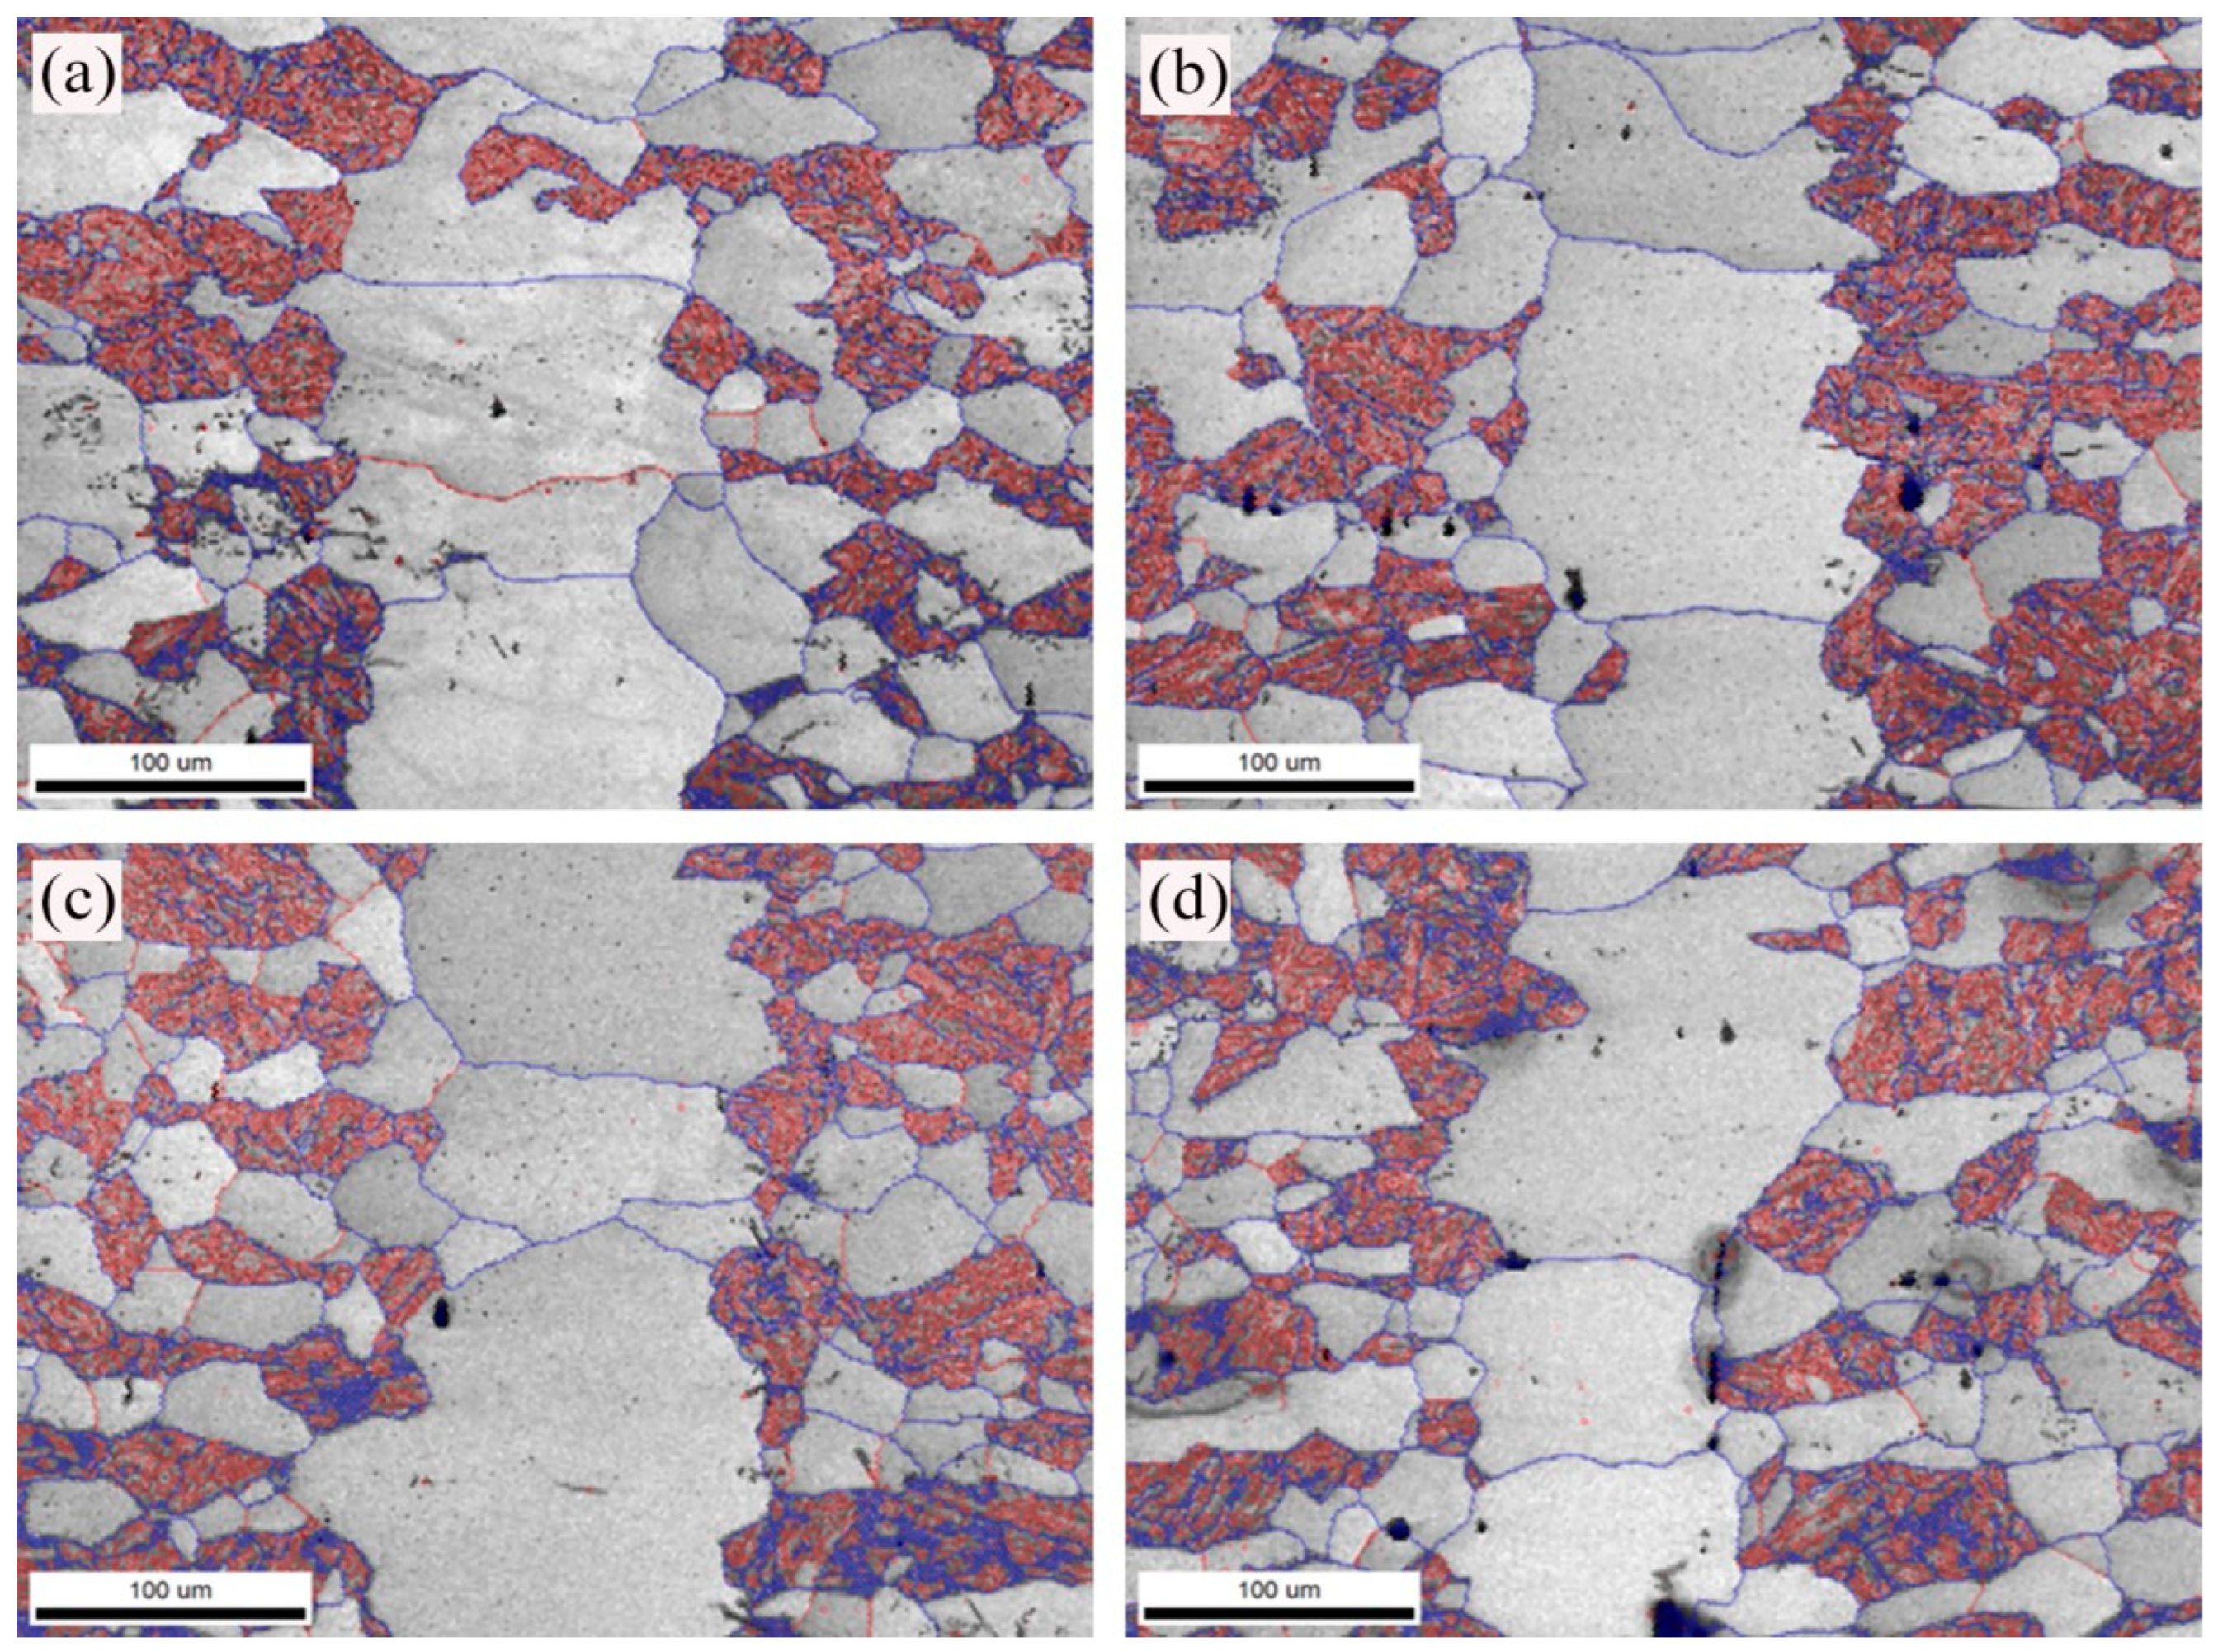
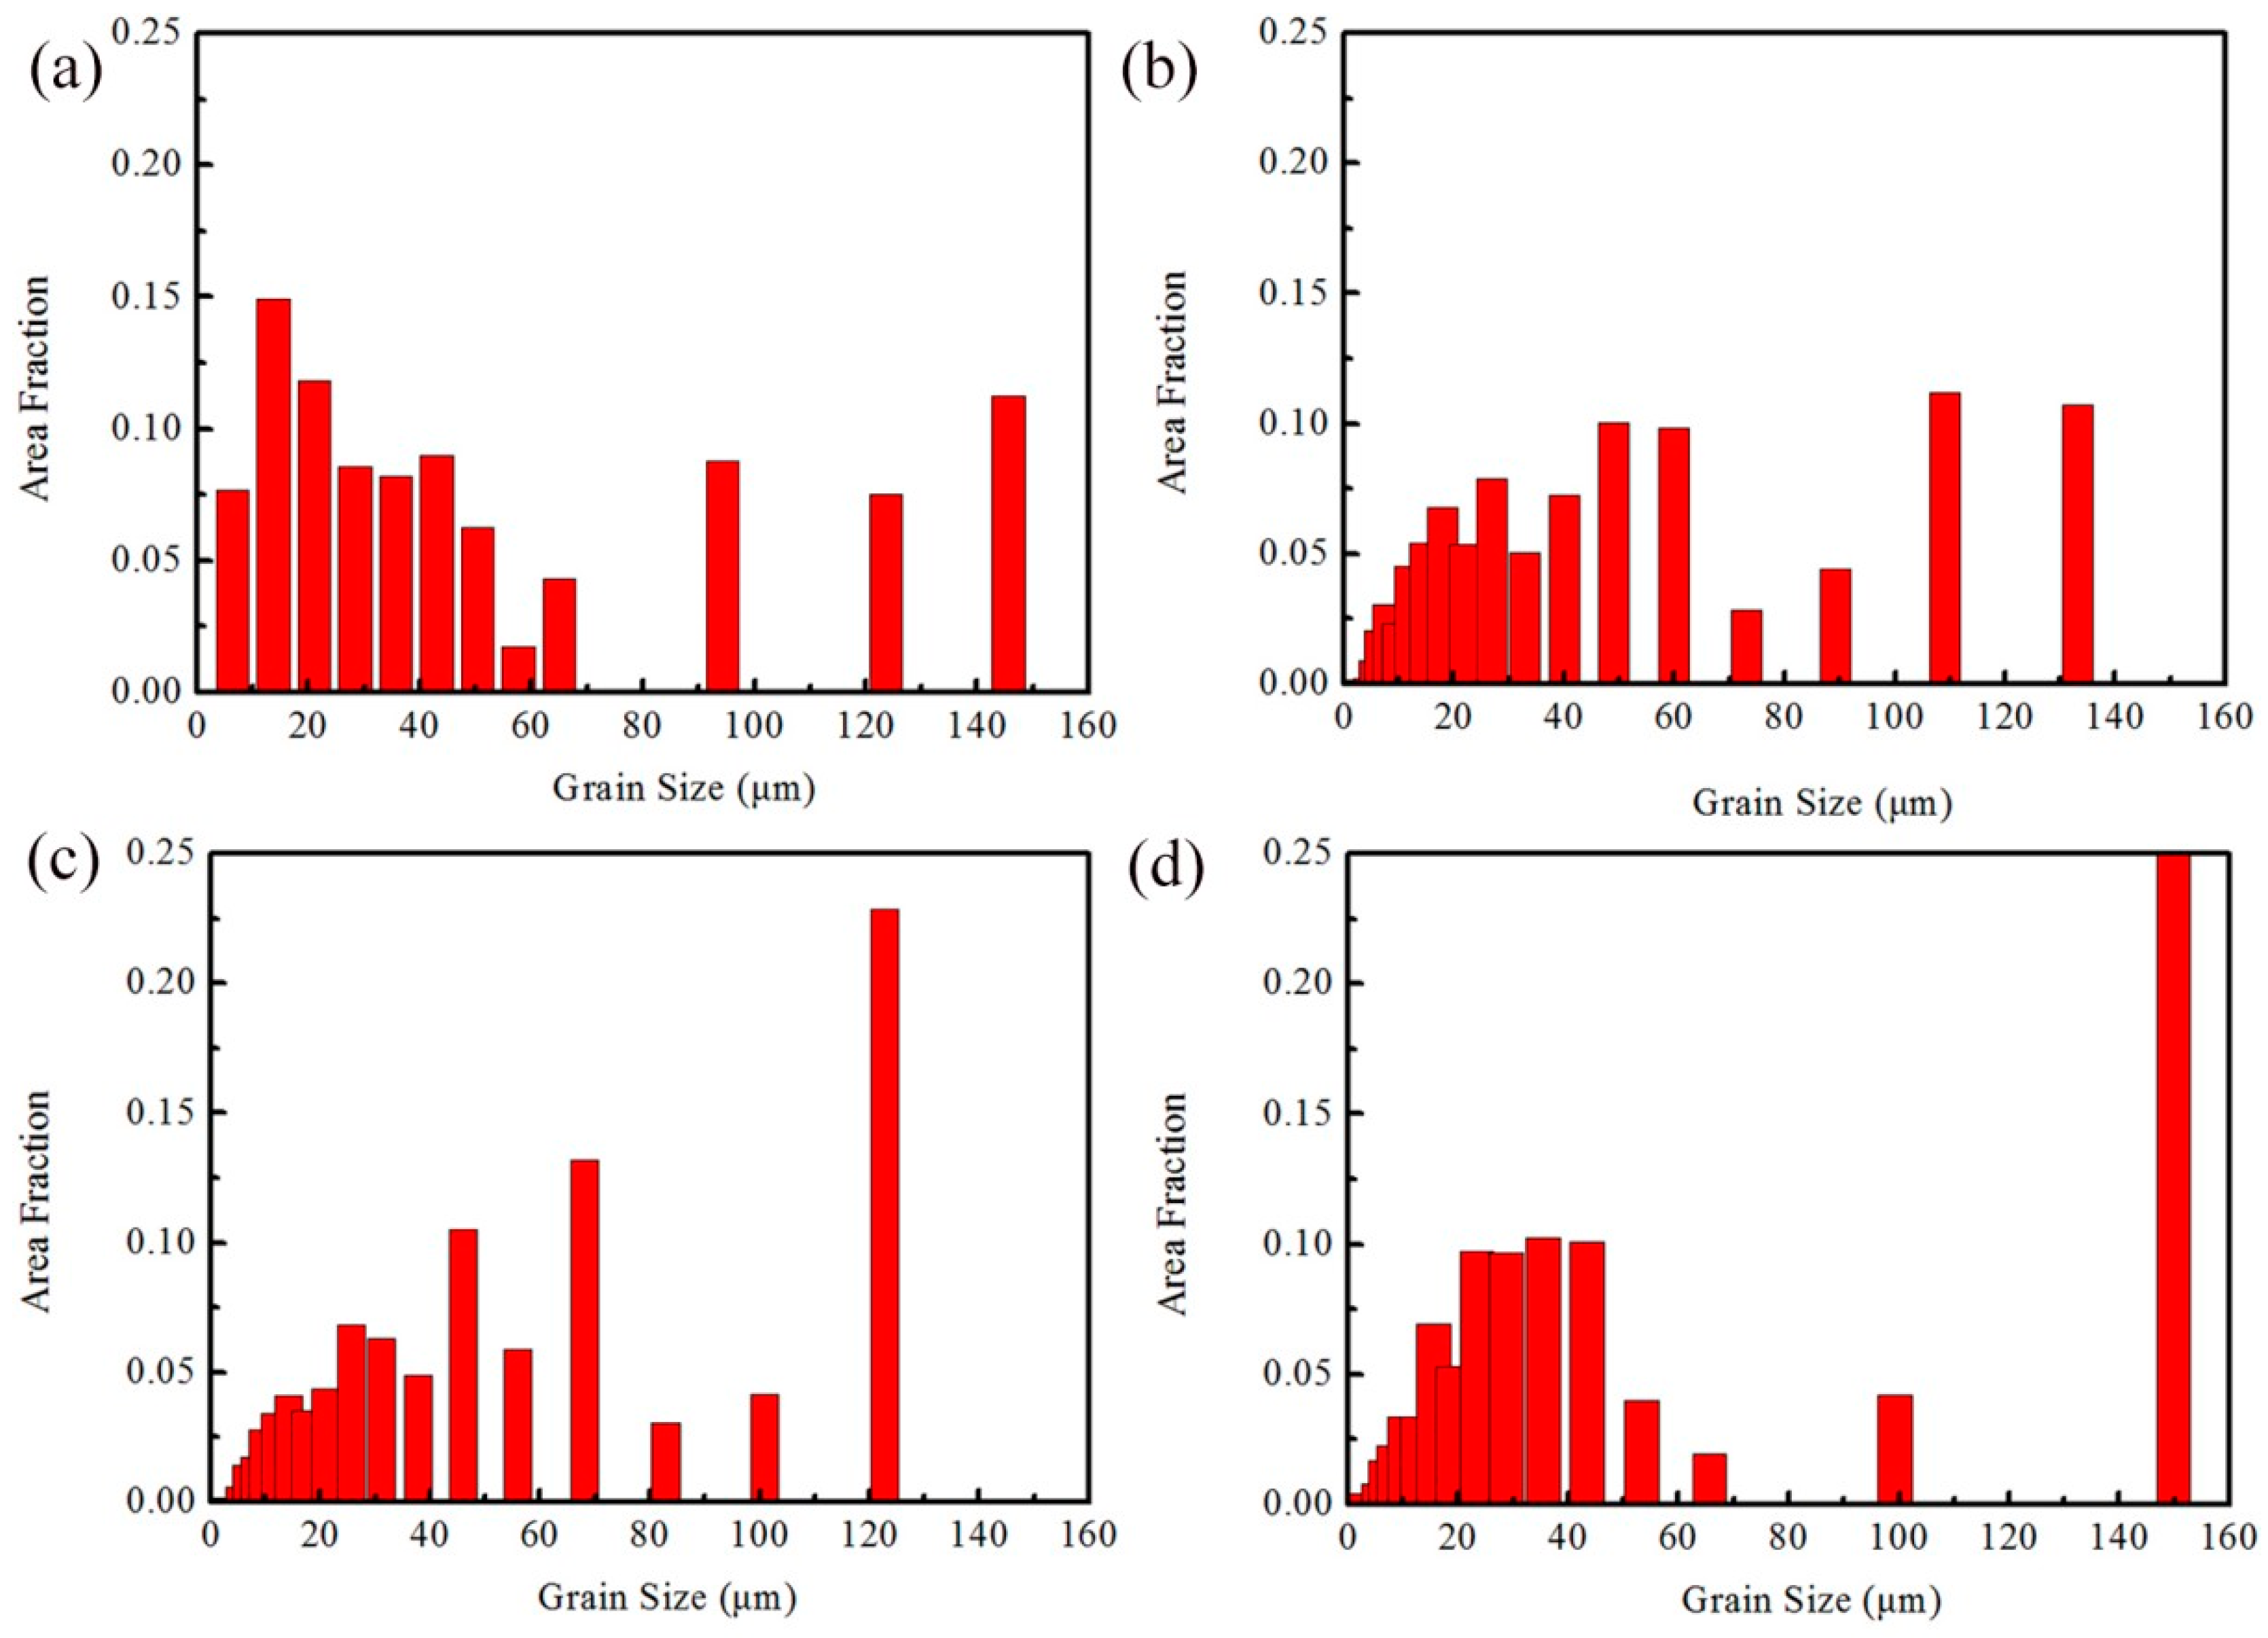
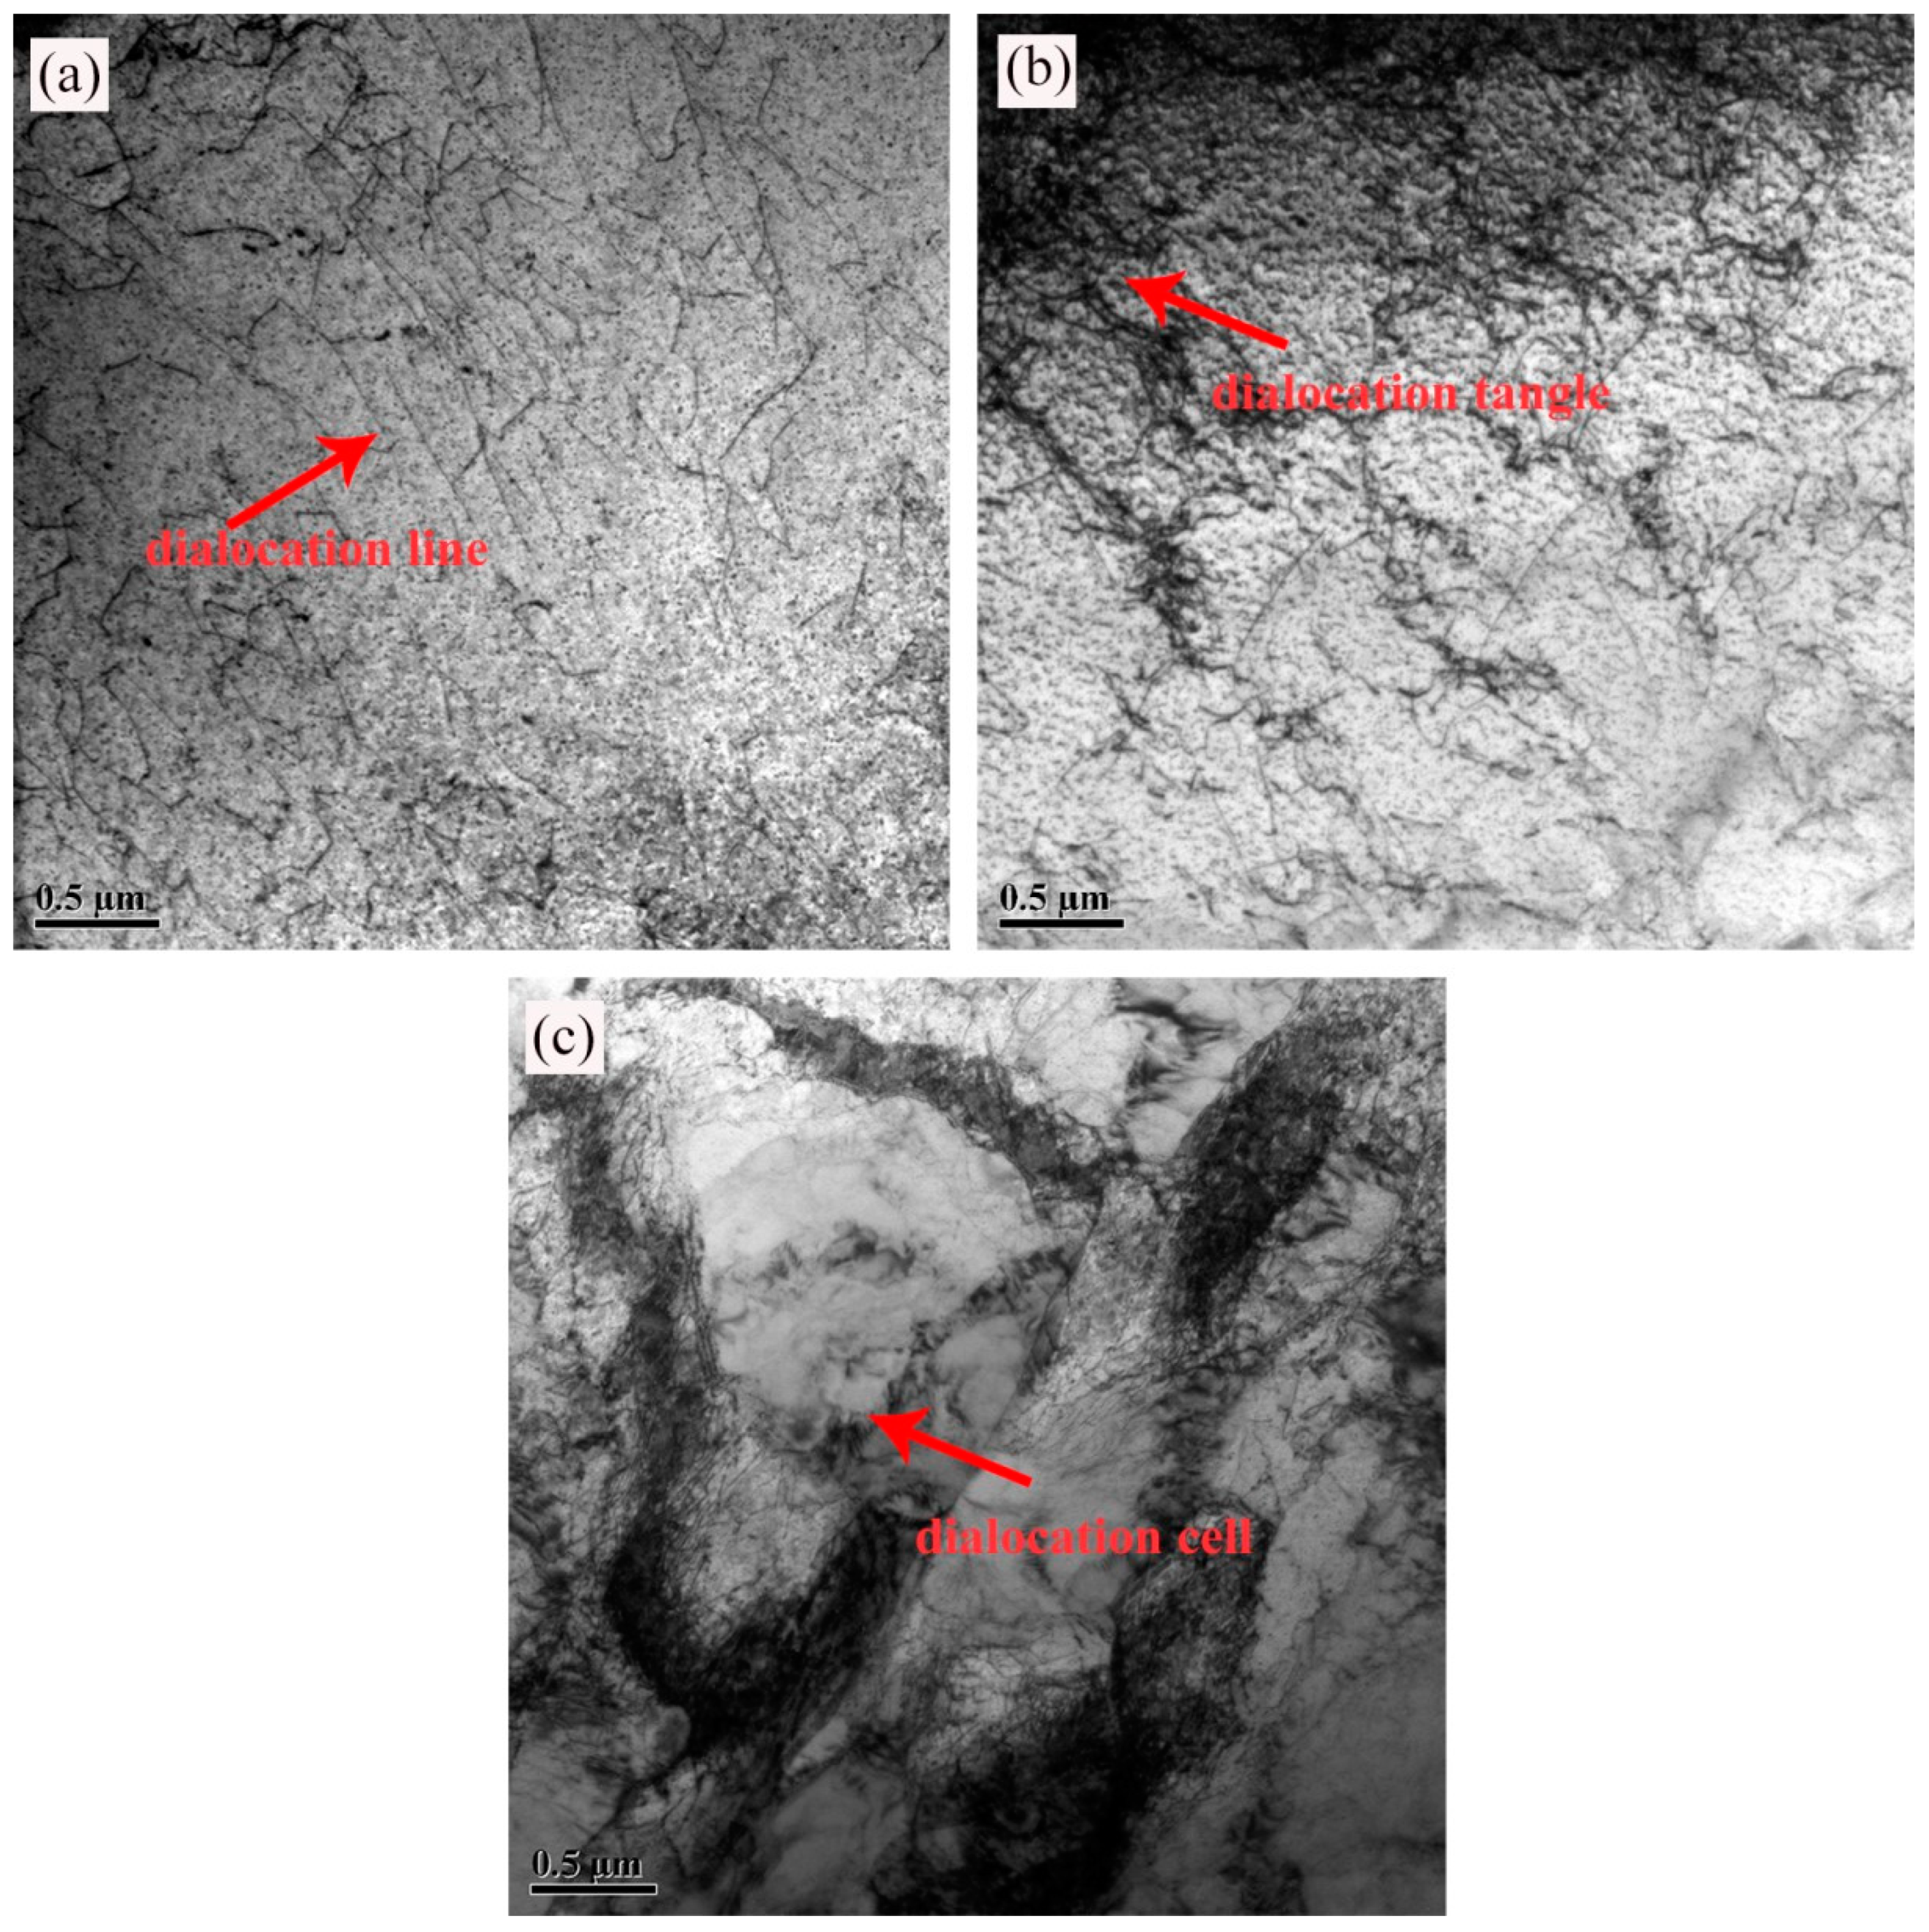
With increases in the stress level, the grains in the weld zone were refined, and the dislocation density increased.
(3)
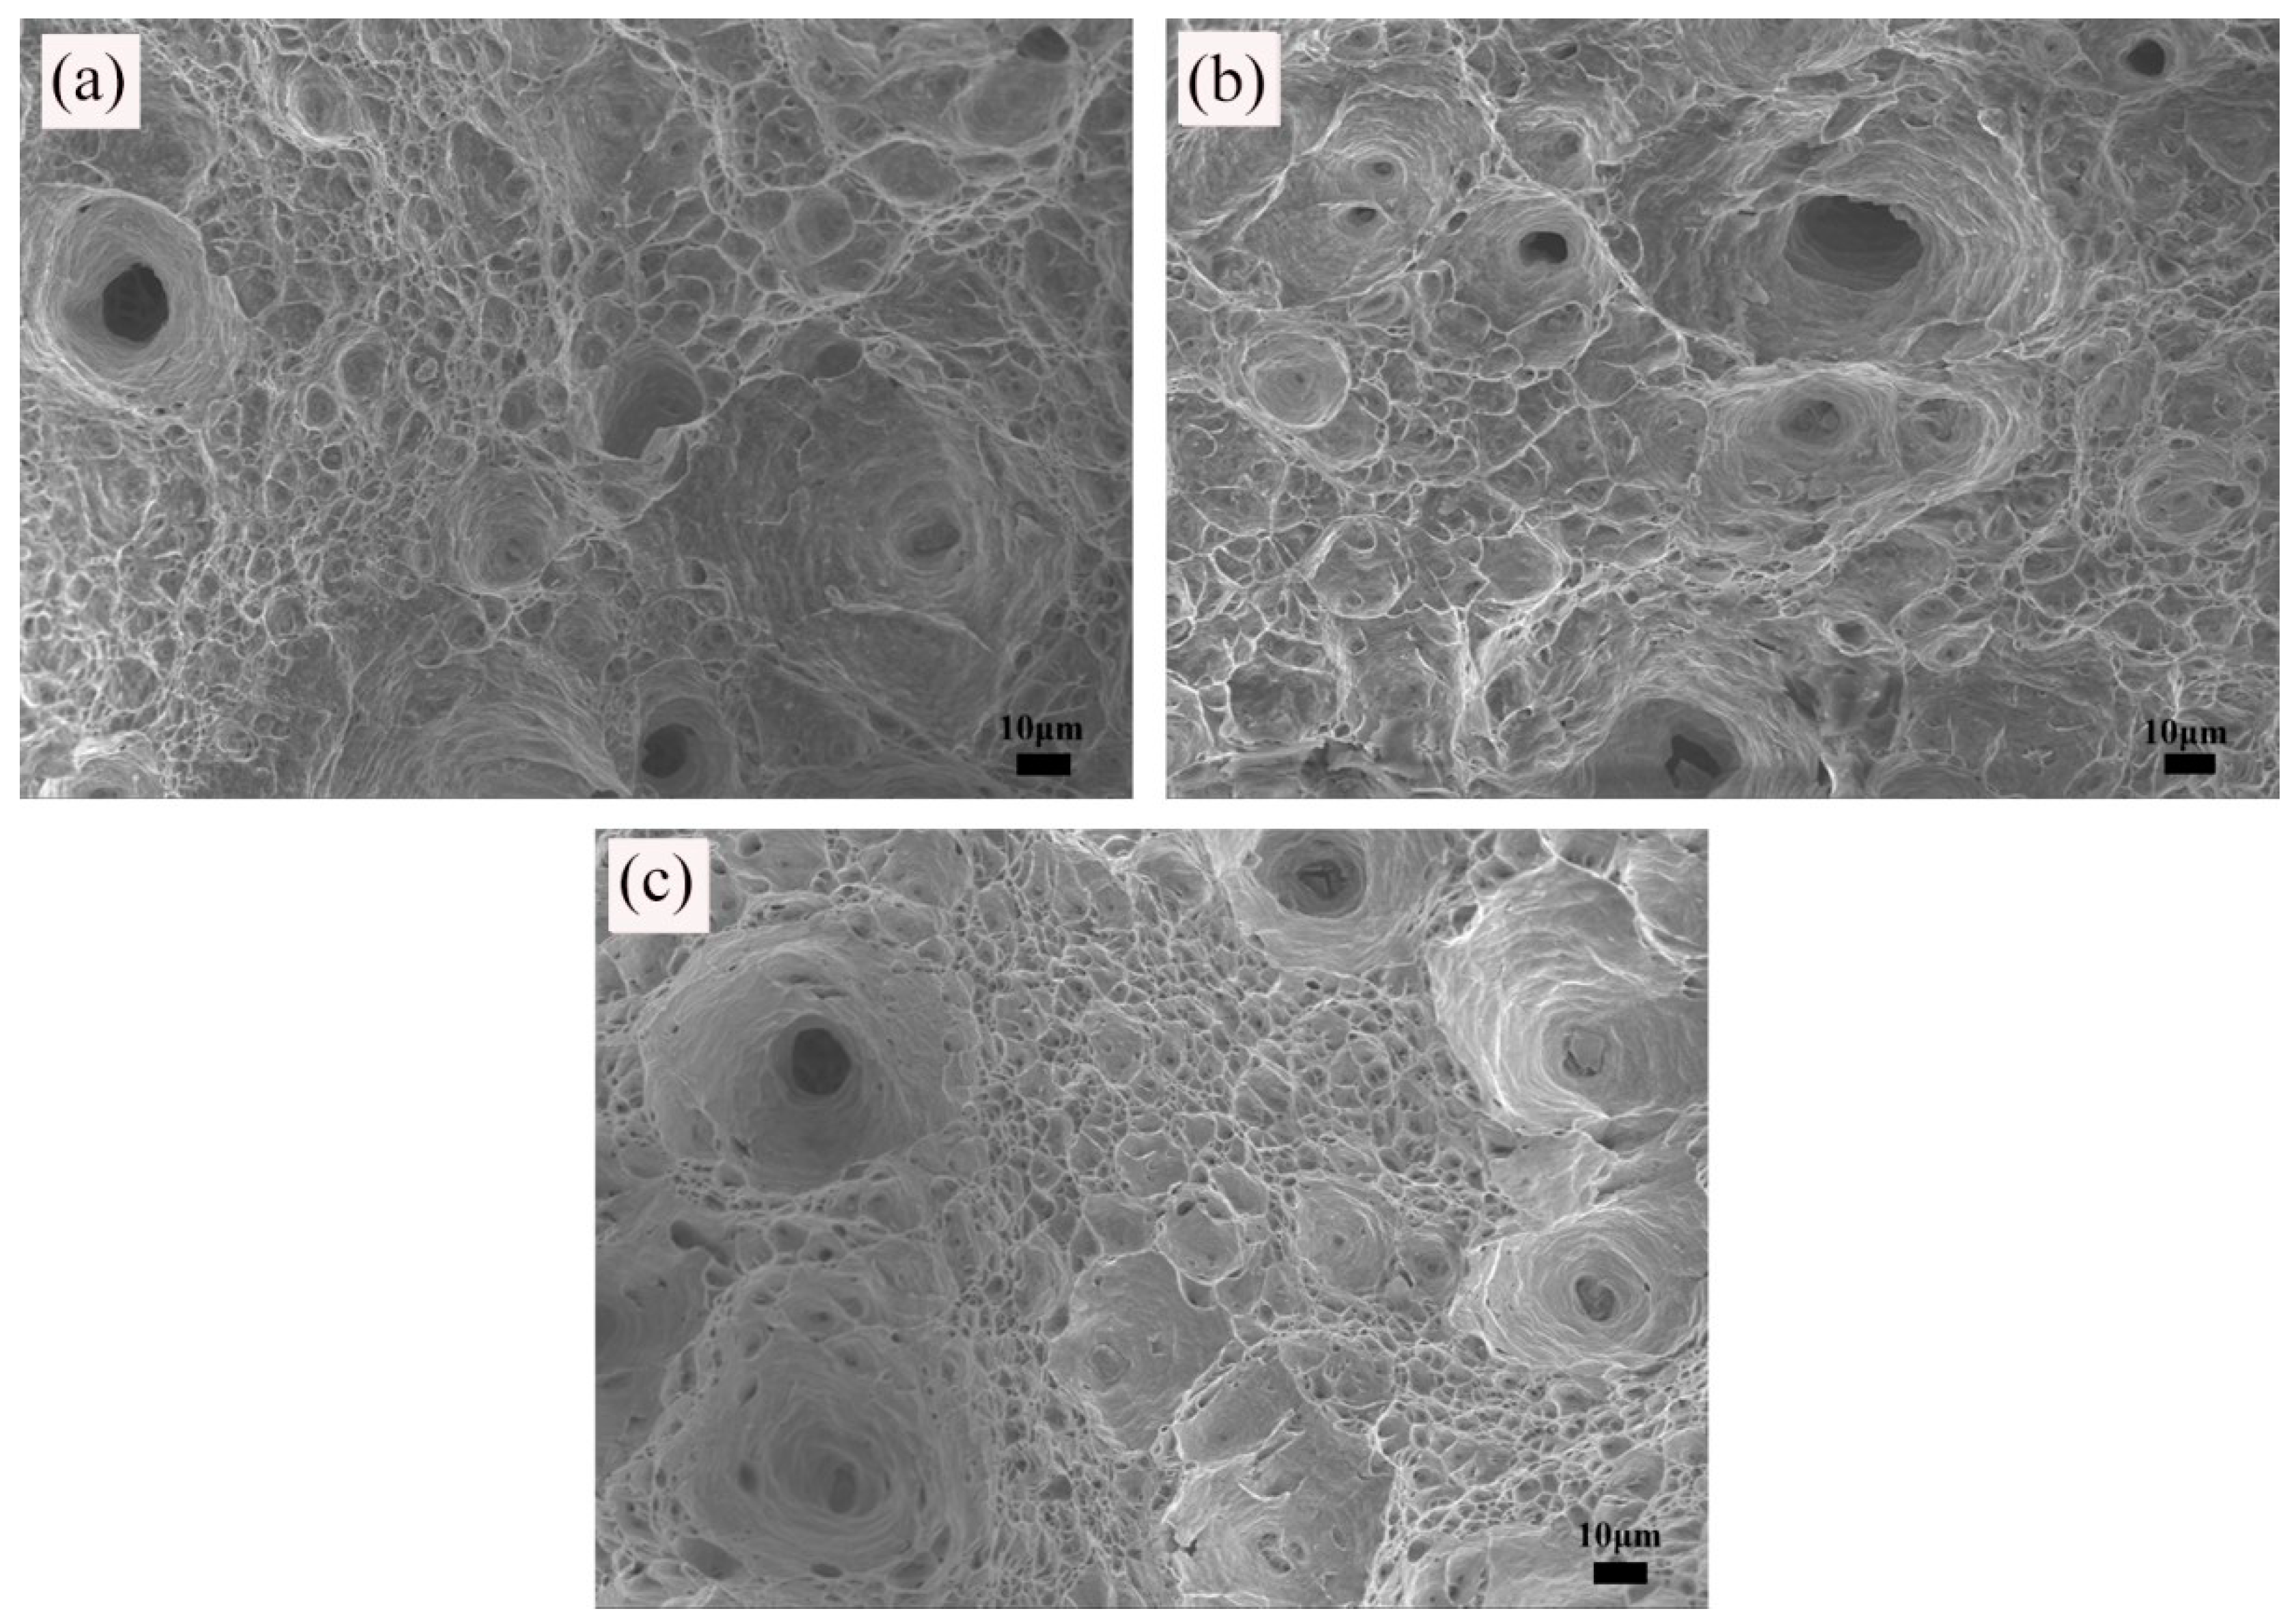
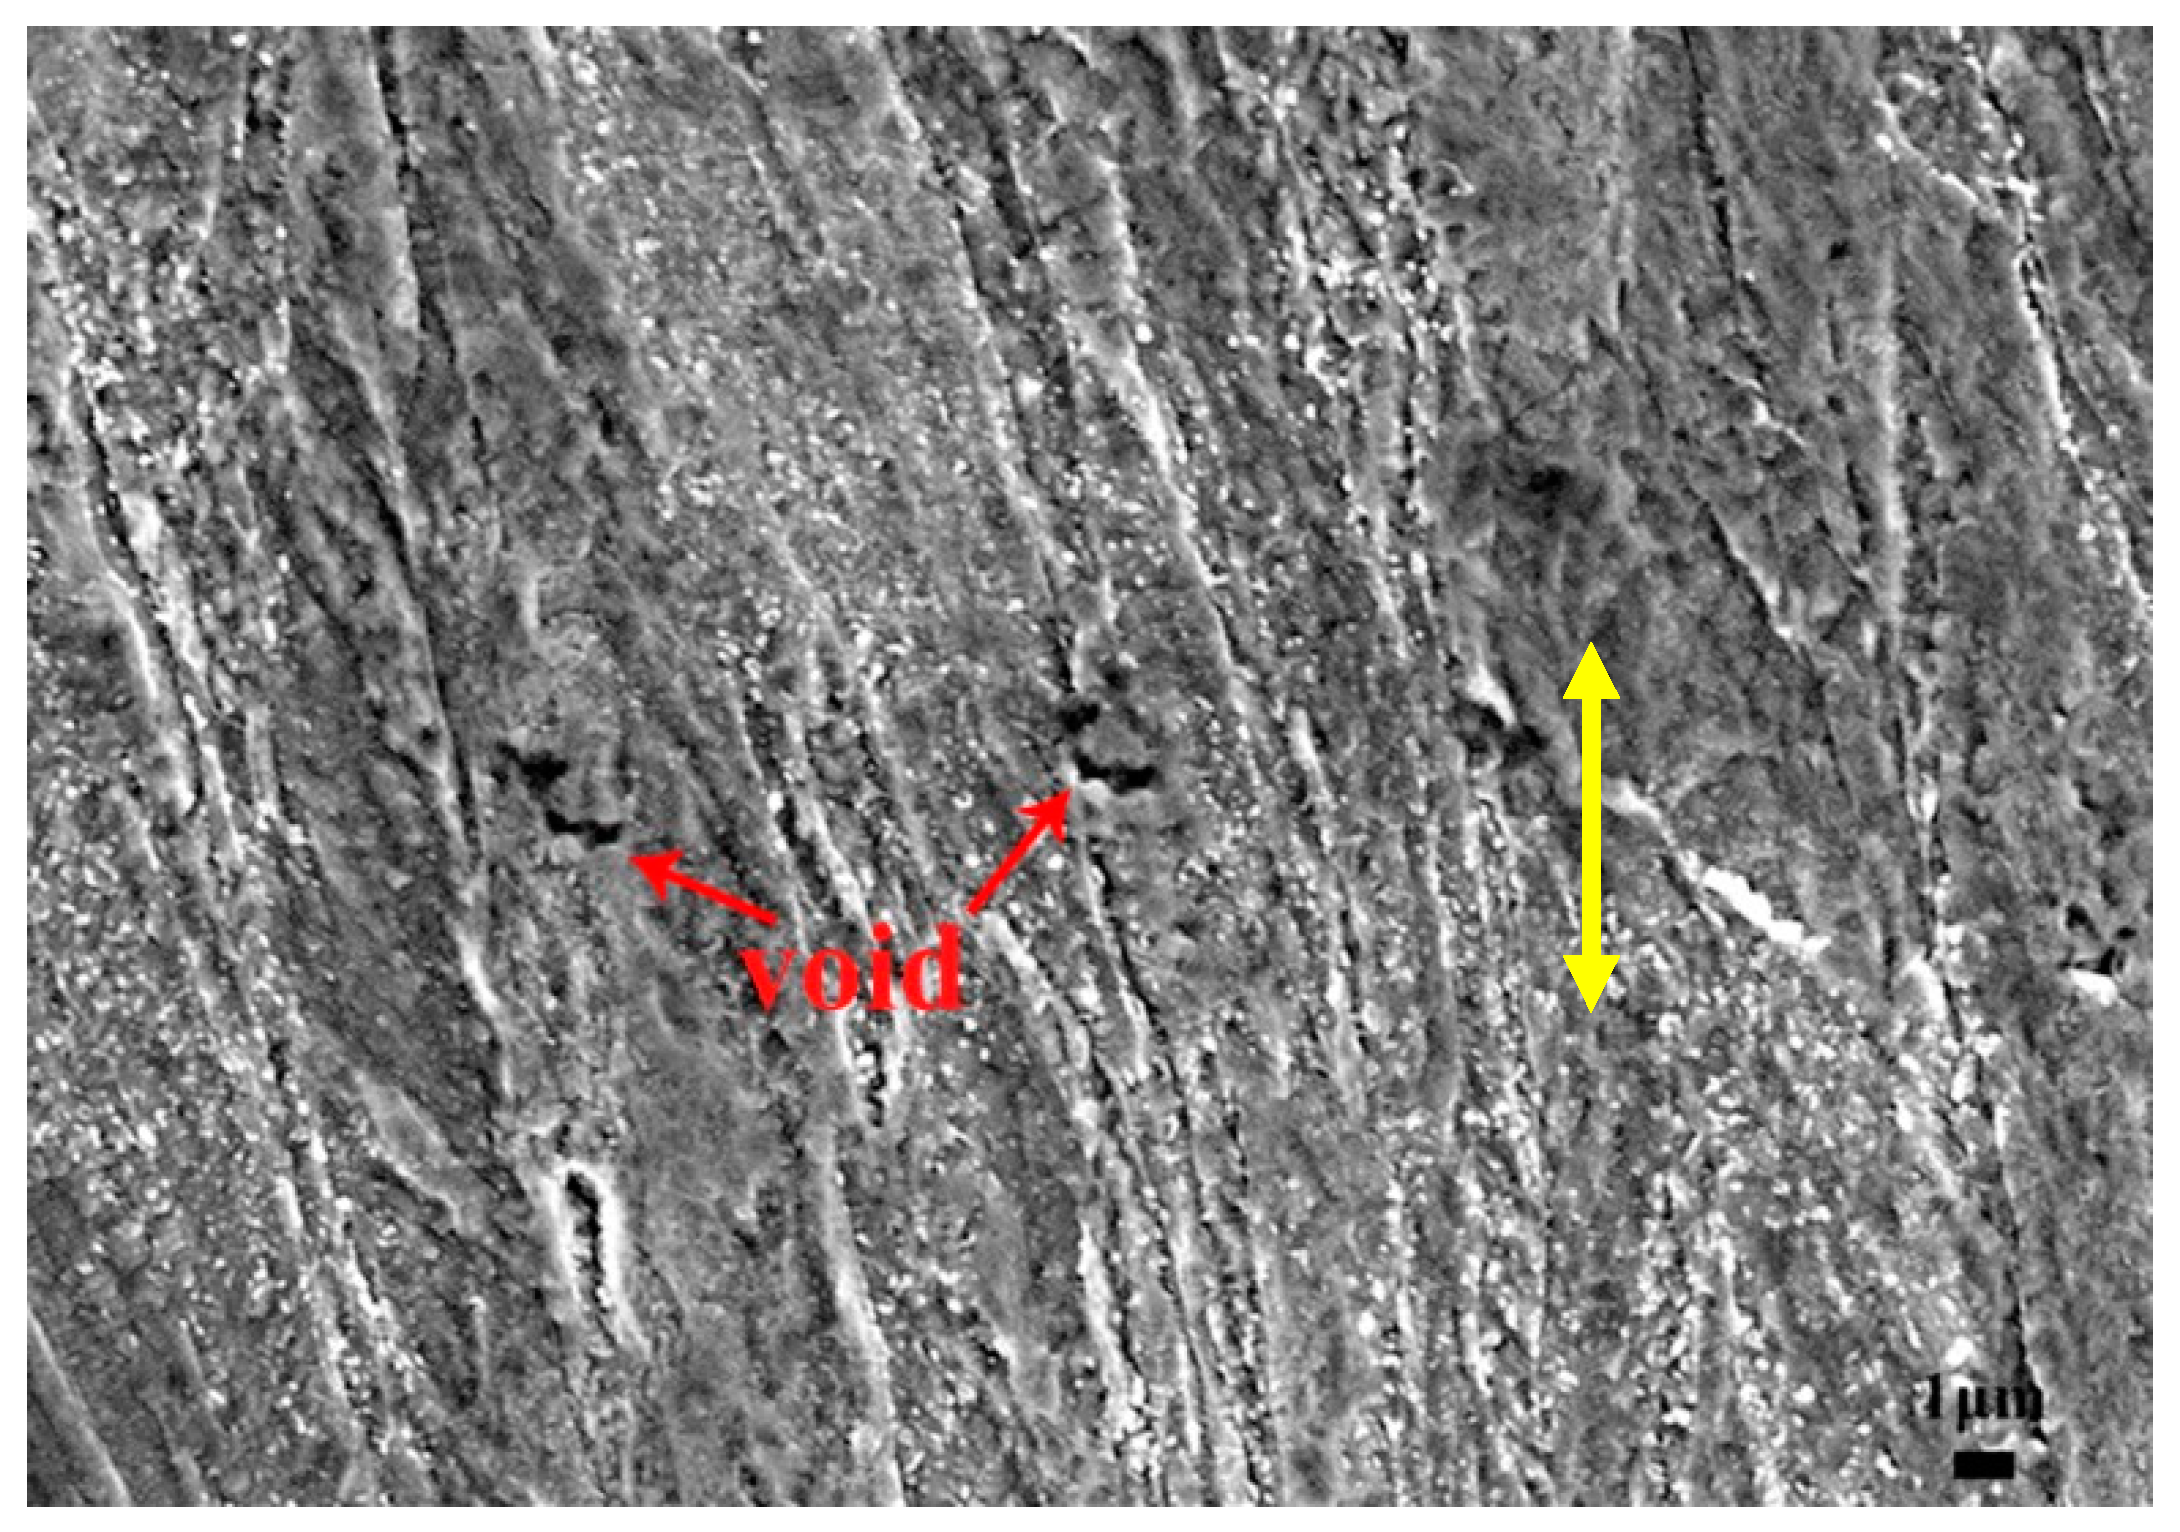
The creep-fracture mechanism of TLP joints for RAFM steel is micro-void accumulation fracture. Micro-voids are mainly nucleated near M23C6 carbides on the martensite-lath boundaries and the prior austenite grain-boundaries, forming microcracks.

Author Contributions

Conceptualization, C.L. and R.D.; methodology, C.L.; software, W.L.; validation, K.L. and R.D.; formal analysis, K.L.; investigation, W.L.; resources, C.L.; data curation, K.L.; writing—original draft preparation, K.L.; writing—review and editing, C.L.; visualization, W.L.; supervision, C.L.; project administration, R.D.; funding acquisition, C.L. All authors have read and agreed to the published version of the manuscript.

Funding

This research was funded by National Natural Science Foundation of China grant number 51975404. And The APC was funded by National Natural Science Foundation of China grant number 51975404.

Institutional Review Board Statement

Not applicable.

Informed Consent Statement

Not applicable.

Data Availability Statement

The raw/processed data required to reproduce these findings cannot be shared at this time as the data also forms part of an ongoing study.

Acknowledgments

The authors are grateful to the National Natural Science Foundation of China (No. 51975404) for the grant and financial support.

Conflicts of Interest

The authors declare no conflict of interest.

References

  1. Liu, C.; Mao, C.; Cui, L.; Zhou, X.; Yu, L.; Liu, Y. Recent Progress in Microstructural Control and Solid-State Welding of Reduced Activation Ferritic/Martensitic Steels. Acta Metall. Sin. 2021, 57, 1521–1538. [Google Scholar]
  2. Huang, Q.; Baluc, N.; Dai, Y.; Jitsukawa, S.; Kimura, A.; Konys, J.; Kurtz, R.J.; Lindau, R.; Muroga, T.; Odette, G.R.; et al. Recent progress of R&D activities on reduced activation ferritic/martensitic steels. J. Nucl. Mater. 2013, 442, S2–S8. [Google Scholar]
  3. Qiu, G.-X.; Zhan, D.-P.; Cao, L.; Jiang, Z.-H. Review on development of reduced activated ferritic/martensitic steel for fusion reactor. J. Iron Steel Res. Int. 2022, 29, 1343–1356. [Google Scholar] [CrossRef]
  4. Xia, L.-D.; Chen, H.; Yang, Z.-G.; Zhang, C. Experimental and theoretical analysis of equilibrium segregation and radiation-induced segregation of Cr at grain boundaries in a reduced activation ferritic/martensitic (RAFM) steel. J. Iron Steel Res. Int. 2021, 28, 445–452. [Google Scholar] [CrossRef]
  5. Tanigawa, H.; Shiba, K.; Sakasegawa, H.; Hirose, T.; Jitsukawa, S. Technical issues related to the development of reduced-activation ferritic/martensitic steels as structural materials for a fusion blanket system. Fusion Eng. Des. 2011, 86, 2549–2552. [Google Scholar] [CrossRef]
  6. Gao, Y.; Wang, Z.; Liu, Y.; Li, W.; Liu, C.; Li, H. Diffusion Bonding of 9Cr Martensitic/Ferritic Heat-Resistant Steels with an Electrodeposited Ni Interlayer. Metals 2018, 8, 1012. [Google Scholar] [CrossRef] [Green Version]
  7. Cardella, A.; Rigal, E.; Bedel, L.; Bucci, P.; Fiek, J.; Forest, L. The manufacturing technologies of the European breeding blankets. J. Nucl. Mater. 2004, 329, 133–140. [Google Scholar] [CrossRef]
  8. Liu, C.; Gao, Y.; Li, X.; Li, W.; Gan, K. Study on microstructure and mechanical property of linear friction welding on 9Cr reduced activation ferrite/martensite steel. J. Nucl. Mater. 2020, 531, 152011. [Google Scholar] [CrossRef]
  9. Muroga, T.; Gasparotto, M.; Zinkle, S. Overview of materials research for fusion reactors. Fusion Eng. Des. 2002, 61, 13–25. [Google Scholar] [CrossRef]
  10. Mao, C.; Liu, C.; Yu, L.; Liu, Y. Developing of containing Ta, Zr reduced activation ferritic/martensitic (RAFM) steel with excellent creep property. Mater. Sci. Eng. A 2022, 851, 143625. [Google Scholar] [CrossRef]
  11. Chen, Z.-Y.; Chen, Z.-Z.; Kou, D.-X.; Li, Y.-Q.; Ma, Y.-L.; Li, Y.-M. Evolution of microstructure in reheated coarse-grained zone of G115 novel martensitic heat-resistant steel. J. Iron Steel Res. Int. 2022, 29, 327–338. [Google Scholar] [CrossRef]
  12. Chen, J.; Liu, Y.; Xiao, Y.; Liu, Y.; Liu, C.; Li, H. Improvement of High-Temperature Mechanical Properties of Low-Carbon RAFM Steel by MX Precipitates. Acta Metall. Sin. 2018, 31, 706–712. [Google Scholar] [CrossRef] [Green Version]
  13. Zhong, B.; Huang, B.; Li, C.; Liu, S.; Xu, G.; Zhao, Y.; Huang, Q. Creep deformation and rupture behavior of CLAM steel at 823 K and 873 K. J. Nucl. Mater. 2014, 455, 640–644. [Google Scholar] [CrossRef]
  14. Falat, L.; Čiripová, L.; Kepič, J.; Buršík, J.; Podstranská, I. Correlation between microstructure and creep performance of martensitic/austenitic transition weldment in dependence of its post-weld heat treatment. Eng. Fail. Anal. 2014, 40, 141–152. [Google Scholar] [CrossRef]
  15. Cook, G.O.; Sorensen, C.D. Overview of transient liquid phase and partial transient liquid phase bonding. J. Mater. Sci. 2011, 46, 5305–5323. [Google Scholar] [CrossRef] [Green Version]
  16. AlHazaa, A.; Haneklaus, N. Diffusion bonding and transient liquid phase (TLP) bonding of type 304 and 316 austenitic stainless steel—A review of similar and dissimilar material joints. Metals 2020, 10, 613. [Google Scholar] [CrossRef]
  17. Zhang, Y.; Feng, D.; He, Z.-Y.; Chen, X.-C. Progress in joining ceramics to metals. J. Iron Steel Res. Int. 2006, 13, 1–5. [Google Scholar] [CrossRef]
  18. Wang, G.; Sun, Y.; Wang, X.; Liu, J.; Liu, J.; Li, J.; Yu, J.; Zhou, Y.; Jin, T.; Sun, X.; et al. Microstructure evolution and mechanical behavior of Ni-based single crystal superalloy joint brazed with mixed powder at elevated temperature. J. Mater. Sci. Technol. 2017, 33, 1219–1226. [Google Scholar] [CrossRef]
  19. Di Luozzo, N.; Boudard, M.; Doisneau, B.; Fontana, M.; Arcondo, B. Transient liquid phase bonding of carbon steel tubes using a Cu interlayer: Characterization and comparison with amorphous Fe–B–Si interlayer bonds. J. Alloys Compd. 2014, 615, S13–S17. [Google Scholar] [CrossRef]
  20. Chen, S.; Tang, H.; Jing, X. Transient liquid-phase bonding of T91 steel pipes using amorphous foil. Mater. Sci. Eng. A 2009, 499, 114–117. [Google Scholar] [CrossRef]
  21. Gale, W.F.; Butts, D. Transient liquid phase bonding. Sci. Technol. Weld. Join. 2004, 9, 283–300. [Google Scholar] [CrossRef]
  22. Khakian, M.; Nategh, S.; Mirdamadi, S. Effect of bonding time on the microstructure and isothermal solidification completion during transient liquid phase bonding of dissimilar nickel-based superalloys IN738LC and Nimonic 75. J. Alloys Compd. 2015, 653, 386–394. [Google Scholar] [CrossRef]
  23. Liu, J.-D.; Jin, T.; Li, W.; Sun, X.-F.; Guan, H.-R.; Hu, Z.-Q. Creep fracture mechanism of TLP joint of a Ni-base single crystal superalloy. J. Alloys Compd. 2008, 457, 185–190. [Google Scholar] [CrossRef]
  24. Wang, X.; Xu, Q.; Yu, S.-M.; Liu, H.; Hu, L.; Ren, Y.-Y. Laves-phase evolution during aging in fine grained heat-affected zone of a tungsten-strengthened 9% Cr steel weldment. J. Mater. Processing Technol. 2015, 219, 60–69. [Google Scholar] [CrossRef]
  25. Wang, W.; Zhang, J.; Xu, G. Effects of thermal aging on microstructure and hardness of China low activation martensitic steel welded joint. Nucl. Eng. Des. 2016, 305, 666–671. [Google Scholar] [CrossRef]
  26. Li, W.; Li, X.; Liu, Y.; Wang, Z.; Liu, C.; Li, H. Homogenization stage during TLP bonding of RAFM steel with a Fe–Si–B interlayer: Microstructure evolution and mechanical properties. Mater. Sci. Eng. A 2020, 780, 139205. [Google Scholar] [CrossRef]
  27. Chunfang, W.; Maoqiu, W.; Jie, S.; Weijun, H.; Han, D. Effect of microstructure refinement on the strength and toughness of low alloy martensitic steel. J. Mater. Sci. Technol. 2007, 23, 659. [Google Scholar]
  28. Karthikeyan, T.; Paul, V.T.; Saroja, S.; Moitra, A.; Sasikala, G.; Vijayalakshmi, M. Grain refinement to improve impact toughness in 9Cr–1Mo steel through a double austenitization treatment. J. Nucl. Mater. 2011, 419, 256–262. [Google Scholar] [CrossRef]
  29. Divya, M.; Das, C.R.; Albert, S.K.; Goyal, S.; Ganesh, P.; Kaul, R.; Swaminathan, J.; Murty, B.S.; Kukreja, L.M.; Bhaduri, A.K. Influence of welding process on Type IV cracking behavior of P91 steel. Mater. Sci. Eng. A 2014, 613, 148–158. [Google Scholar] [CrossRef]
  30. Kim, B.-N.; Hiraga, K. Simulation of diffusional creep accompanied by grain growth in two-dimensional polycrystalline solids. Acta Mater. 2000, 48, 4151–4159. [Google Scholar] [CrossRef]
  31. Haslam, A.; Yamakov, V.; Moldovan, D.; Wolf, D.; Phillpot, S.; Gleiter, H. Effects of grain growth on grain-boundary diffusion creep by molecular-dynamics simulation. Acta Mater. 2004, 52, 1971–1987. [Google Scholar] [CrossRef]
  32. Sun, W.; Li, X.; Chen, M.; Ding, R.; Qiao, Z.; Wang, Z.; Liu, C.; Liu, Y. Effect of post bonding heat treatment on the local strain evolution of transient liquid phase bonded RAFM steel. Mater. Sci. Eng. A 2022, 840, 143008. [Google Scholar] [CrossRef]
  33. Chen, J.-G.; Liu, Y.-C.; Liu, C.-X.; Yan, B.-Y.; Li, H.-J. Effects of tantalum on austenitic transformation kinetics of RAFM steel. J. Iron Steel Res. Int. 2017, 24, 705–710. [Google Scholar] [CrossRef]
  34. Plesiutschnig, E.; Beal, C.; Sommitsch, C.; Paul, S.; Zeiler, G. Ferritic phase transformation to improve creep properties of martensitic high Cr steels. Scr. Mater. 2016, 122, 98–101. [Google Scholar] [CrossRef]
  35. Han, W.; Kimura, A.; Tsuda, N.; Serizawa, H.; Chen, D.; Je, H.; Fujii, H.; Ha, Y.; Morisada, Y.; Noto, H. Effects of mechanical force on grain structures of friction stir welded oxide dispersion strengthened ferritic steel. J. Nucl. Mater. 2014, 455, 46–50. [Google Scholar] [CrossRef]
  36. Schlacher, C.; Pelzmann, T.; Beal, C.; Sommitsch, C.; Gupta, C.; Toda, H.; Mayr, P. Investigation of creep damage in advanced martensitic chromium steel weldments using synchrotron X-ray micro-tomography and EBSD. Mater. Sci. Technol. 2015, 31, 516–521. [Google Scholar] [CrossRef]
  37. Shirazi, H.; Miyamoto, G.; Nedjad, S.H.; Chiba, T.; Ahmadabadi, M.N.; Furuhara, T. Microstructure evolution during austenite reversion in Fe-Ni martensitic alloys. Acta Mater. 2018, 144, 269–280. [Google Scholar] [CrossRef]
  38. El-Desoky, O.; Abd El-Azim, M.; ElKossy, M. Analysis of creep behavior of welded joints of P91 steel at 600 C. Int. J. Press. Vessel. Pip. 2019, 171, 145–152. [Google Scholar] [CrossRef]
  39. Ariza-Echeverri, E.A.; Masoumi, M.; Nishikawa, A.S.; Mesa, D.; Marquez-Rossy, A.; Tschiptschin, A.P. Development of a new generation of quench and partitioning steels: Influence of processing parameters on texture, nanoindentation, and mechanical properties. Mater. Des. 2020, 186, 108329. [Google Scholar] [CrossRef]
  40. Kadkhodapour, J.; Schmauder, S.; Raabe, D.; Ziaei-Rad, S.; Weber, U.; Calcagnotto, M. Experimental and numerical study on geometrically necessary dislocations and non-homogeneous mechanical properties of the ferrite phase in dual phase steels. Acta Mater. 2011, 59, 4387–4394. [Google Scholar] [CrossRef]
  41. Kundu, A.; Field, D.P.; Chakraborti, P.C. Influence of strain amplitude on the development of dislocation structure during cyclic plastic deformation of 304 LN austenitic stainless steel. Mater. Sci. Eng. A 2019, 762, 138090. [Google Scholar] [CrossRef]
  42. Mazaheri, Y.; Jahanara, A.H.; Sheikhi, M.; Kalashami, A.G. High strength-elongation balance in ultrafine grained ferrite-martensite dual phase steels developed by thermomechanical processing. Mater. Sci. Eng. A 2019, 761, 138021. [Google Scholar] [CrossRef]
  43. Ho, H.S.; Sun, L.; Liu, K.; Niu, P.; Zhang, E. Microstructural evolution and strain hardening behavior of AISI 316L type austenitic stainless steel. Int. J. Mater. Res. 2018, 110, 287–296. [Google Scholar] [CrossRef]
Figure 1. Schematic of the creep specimen (Unit: mm).
Metals 12 01333 g001
Figure 2. Microstructures of TLP joints after aging at 550 °C with different aging times: (a) 5 h, (b) 20 h, (c) 100 h, and (d) 500 h.
Metals 12 01333 g002
Figure 3. Grain-boundary-distribution maps of joint regions for different aging times: (a) 5 h, (b) 20 h, (c) 100 h, and (d) 500 h. (The blue lines represent the high-angle boundaries, while the red lines denote the low-angle boundaries.)
Metals 12 01333 g003
Figure 4. Statistical diagrams of the grain-size of the joint regions for different aging times: (a) 5 h, (b) 20 h, (c) 100 h, and (d) 500 h.
Metals 12 01333 g004
Figure 5. Creep curves of TLP joints for different stresses: (a) relationship between creep strain and time; (b) relationship been creep rate and time.
Metals 12 01333 g005
Figure 6. Fracture morphology of the creep-fractured samples for the different stress levels: (a) 160 MPa, (b) 180 MPa, and (c) 220 MPa.
Metals 12 01333 g006
Figure 7. Microstructure of the sample after creep rupture for the stress of 160 MPa near the fracture. (The yellow arrow denotes the direction of the applied load.)
Metals 12 01333 g007
Figure 8. Microstructure of the joint area after creep fracture for the different stresses of (a) 160 MPa, (b) 180 MPa, and (c) 220 MPa. (The yellow arrow denotes the direction of the applied load.)
Metals 12 01333 g008
Figure 9. SEM images of the TLP joint after creep fracture under a stress of 220 MPa: (a) the low-magnification image, (b) the distribution of the M23C6 carbides, and (c) the EDS analysis of the M23C6 carbide indicated by circle in (b).
Metals 12 01333 g009
Figure 10. TEM images of the weld zone and base metal after creep-fracture for the different stress levels: (a1) base metal, 160 MPa; (a2) weld zone, 160 MPa; (b1) base metal, 180 MPa; (b2) weld zone, 180 MPa; (c1) base metal, 220 MPa; and (c2) weld zone, 220 MPa.
Metals 12 01333 g010aMetals 12 01333 g010b
Figure 11. The EBSD results of the weld zone of the creep samples for different stresses: (ac) are IPF maps; (df) are grain-size statistical diagrams.
Metals 12 01333 g011
Figure 12. The EBSD results of the weld zone of the creep samples for different stresses: (ac) are grain-boundary distribution maps; (df) are orientation-difference statistics diagrams.
Metals 12 01333 g012
Figure 13. KAM maps of the joint regions for different aging times: (a) 5 h, (b) 20 h, (c) 100 h, and (d) 500 h.
Metals 12 01333 g013
Figure 14. KAM maps of the weld zone of creep samples for different stresses: (a) 3-550-160, (b) 3-550-180, and (c) 3-550-220.
Metals 12 01333 g014
Figure 15. Microstructure of the base-material region of creep samples for different stresses: (a) 3-550-160; (b) 3-550-180; and (c) 3-550-220.
Metals 12 01333 g015
Figure 16. GND maps of the joint regions for different aging times: (a) 5 h, (b) 20 h, (c) 100 h, and (d) 500 h.
Metals 12 01333 g016
Figure 17. GND maps of the weld zone of creep samples for different stresses: (a) 3-550-160, (b) 3-550-180, and (c) 3-550-220.
Metals 12 01333 g017
Table 1. Chemical composition of materials for experiments (wt.%).
CCrWMnSiVTaBFe
RAFM steel0.048.931.710.440.040.220.073-Bal
Fe-Si-B interlayer----5.29--3.00Bal
Table 2. The average grain-size of TLP joints after aging.
Aging Time0 h5 h20 h100 h500 h
Average grain-size5155566065
Publisher’s Note: MDPI stays neutral with regard to jurisdictional claims in published maps and institutional affiliations.

