
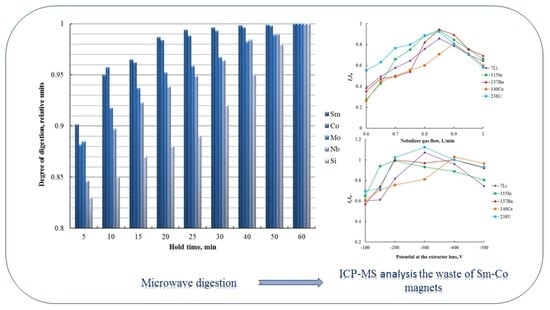
Microwave Digestion and ICP-MS Determination of Major and Trace Elements in Waste Sm-Co Magnets


Abstract
:
1. Introduction
2. Materials and Methods
2.1. Equipment
2.1.1. Microwave Digestion Systems
2.1.2. Inductively Coupled Plasma Optical-Emission Spectrometry
2.1.3. Inductively Coupled Mass-Spectrometry
2.2. Reagents and Solutions
3. Results and Discussion
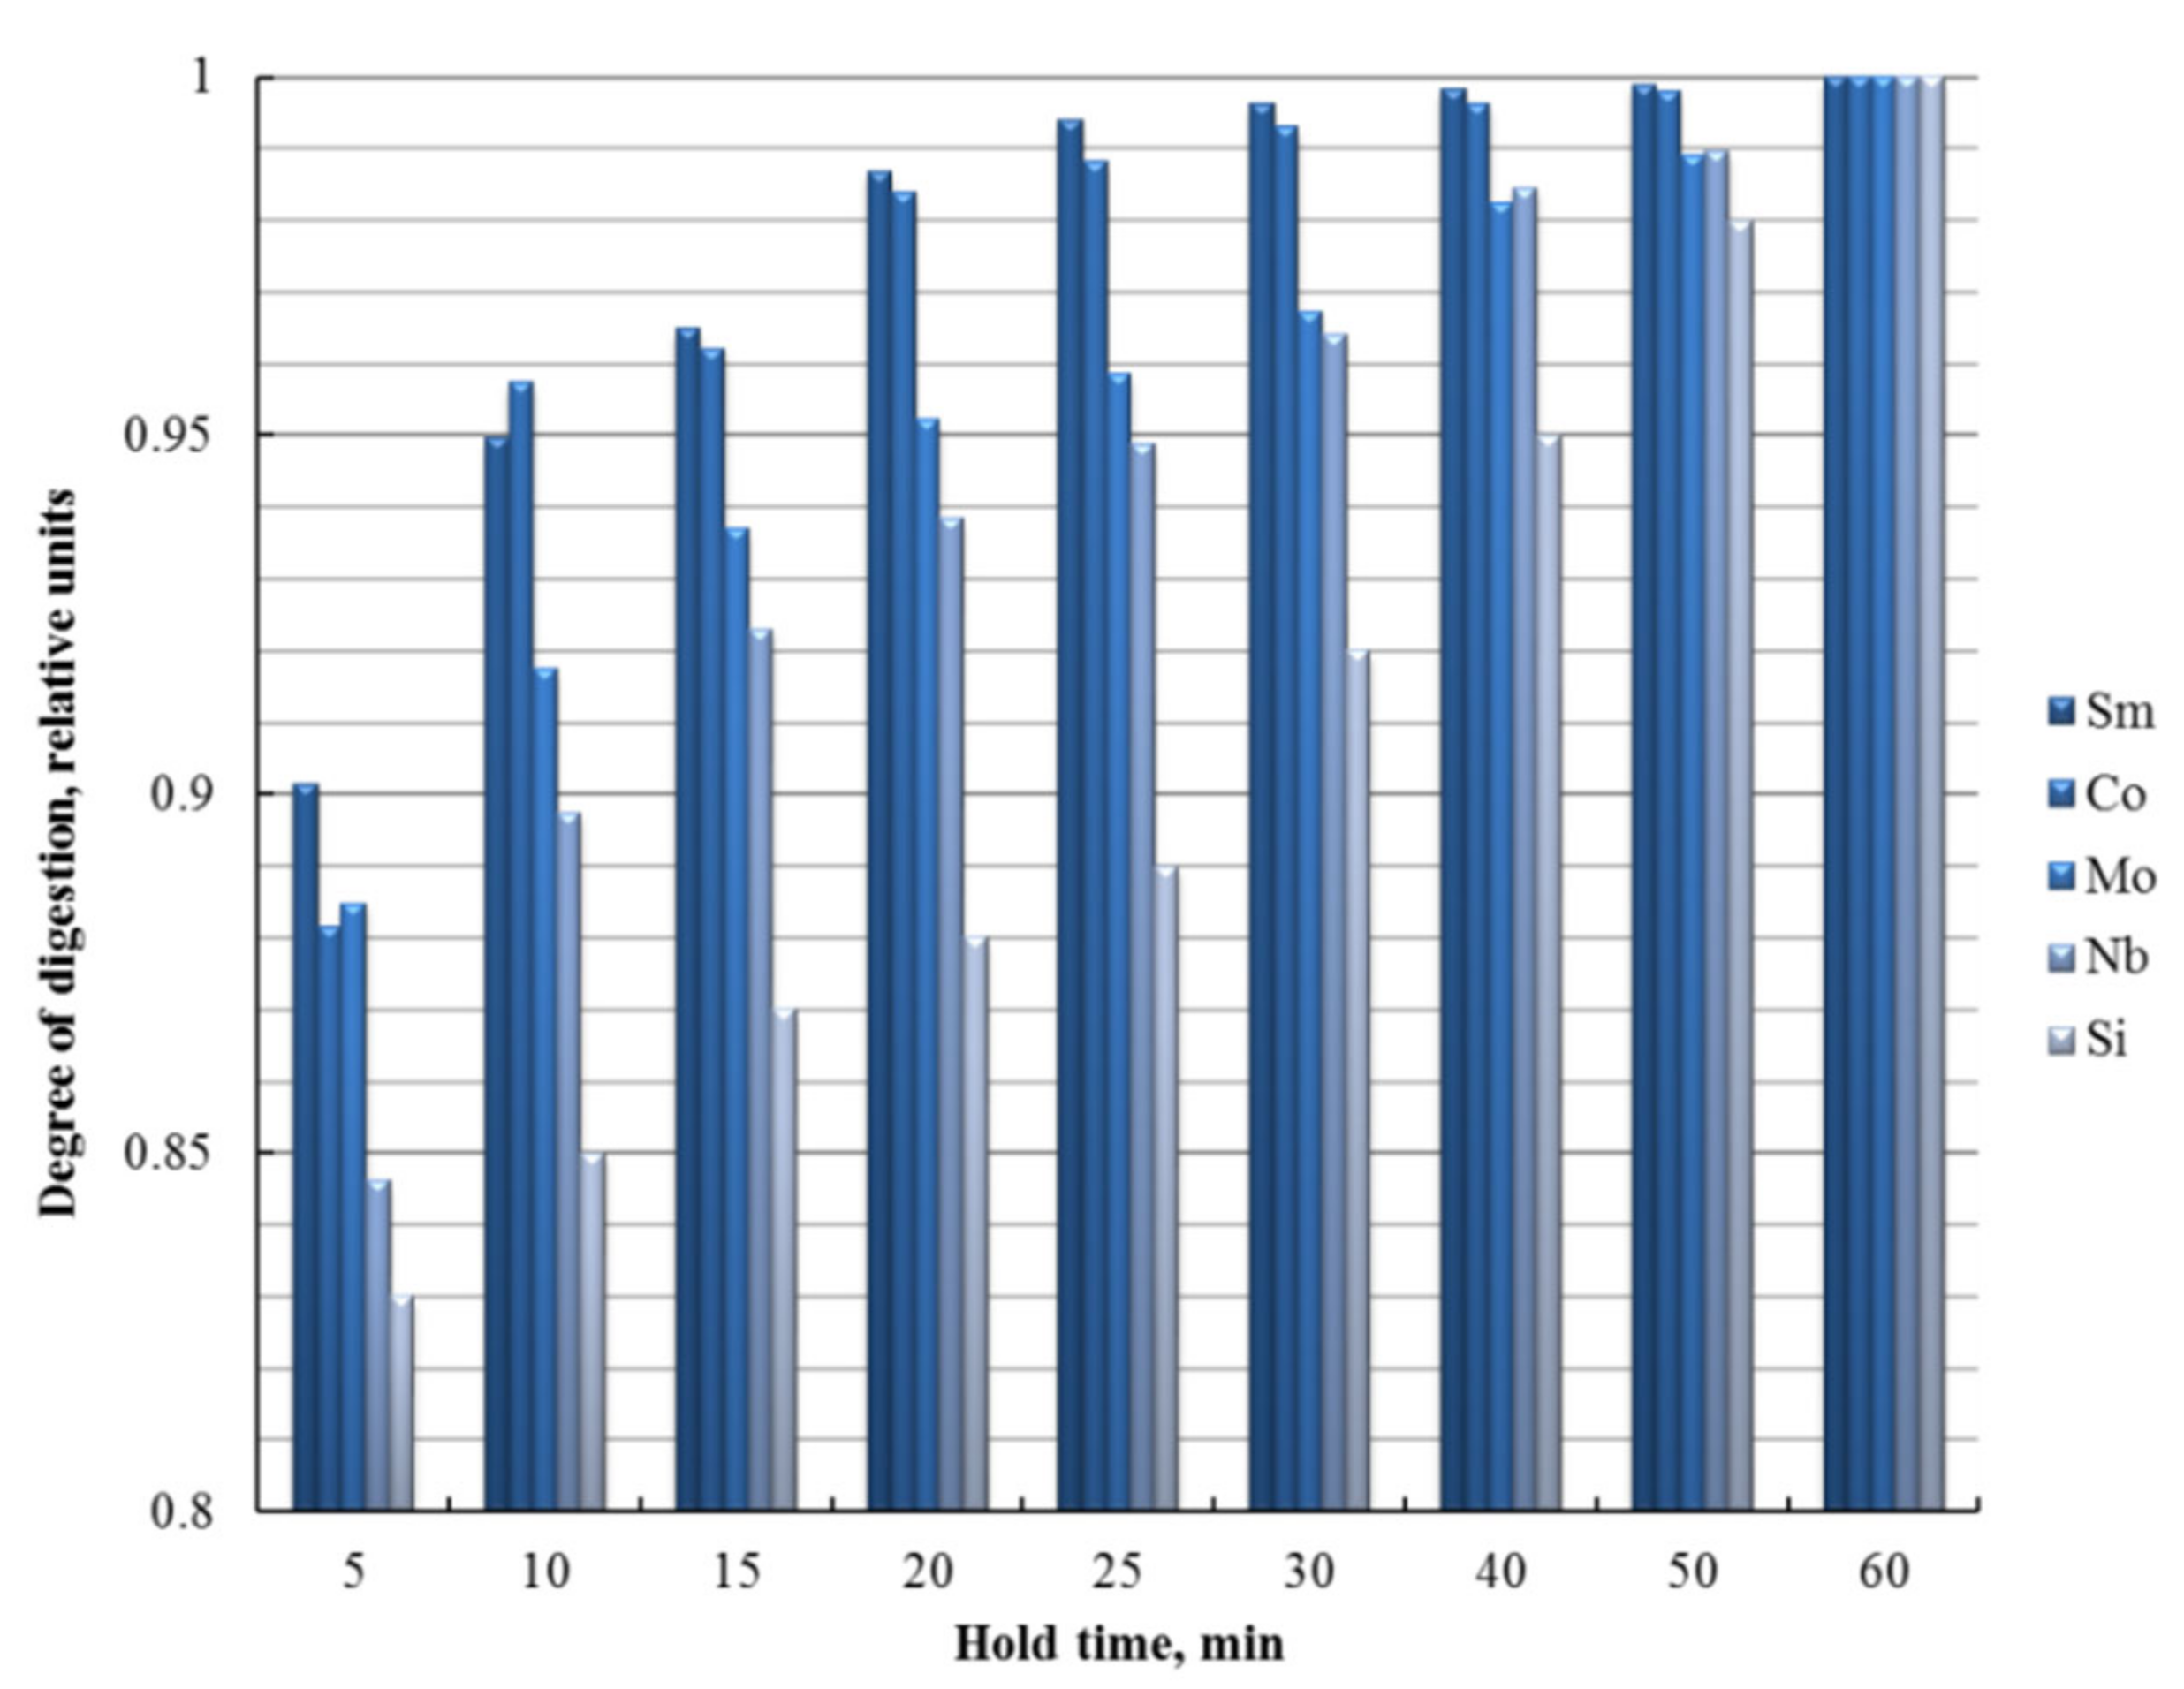
3.1. Optimization of Microwave Digestion Conditions
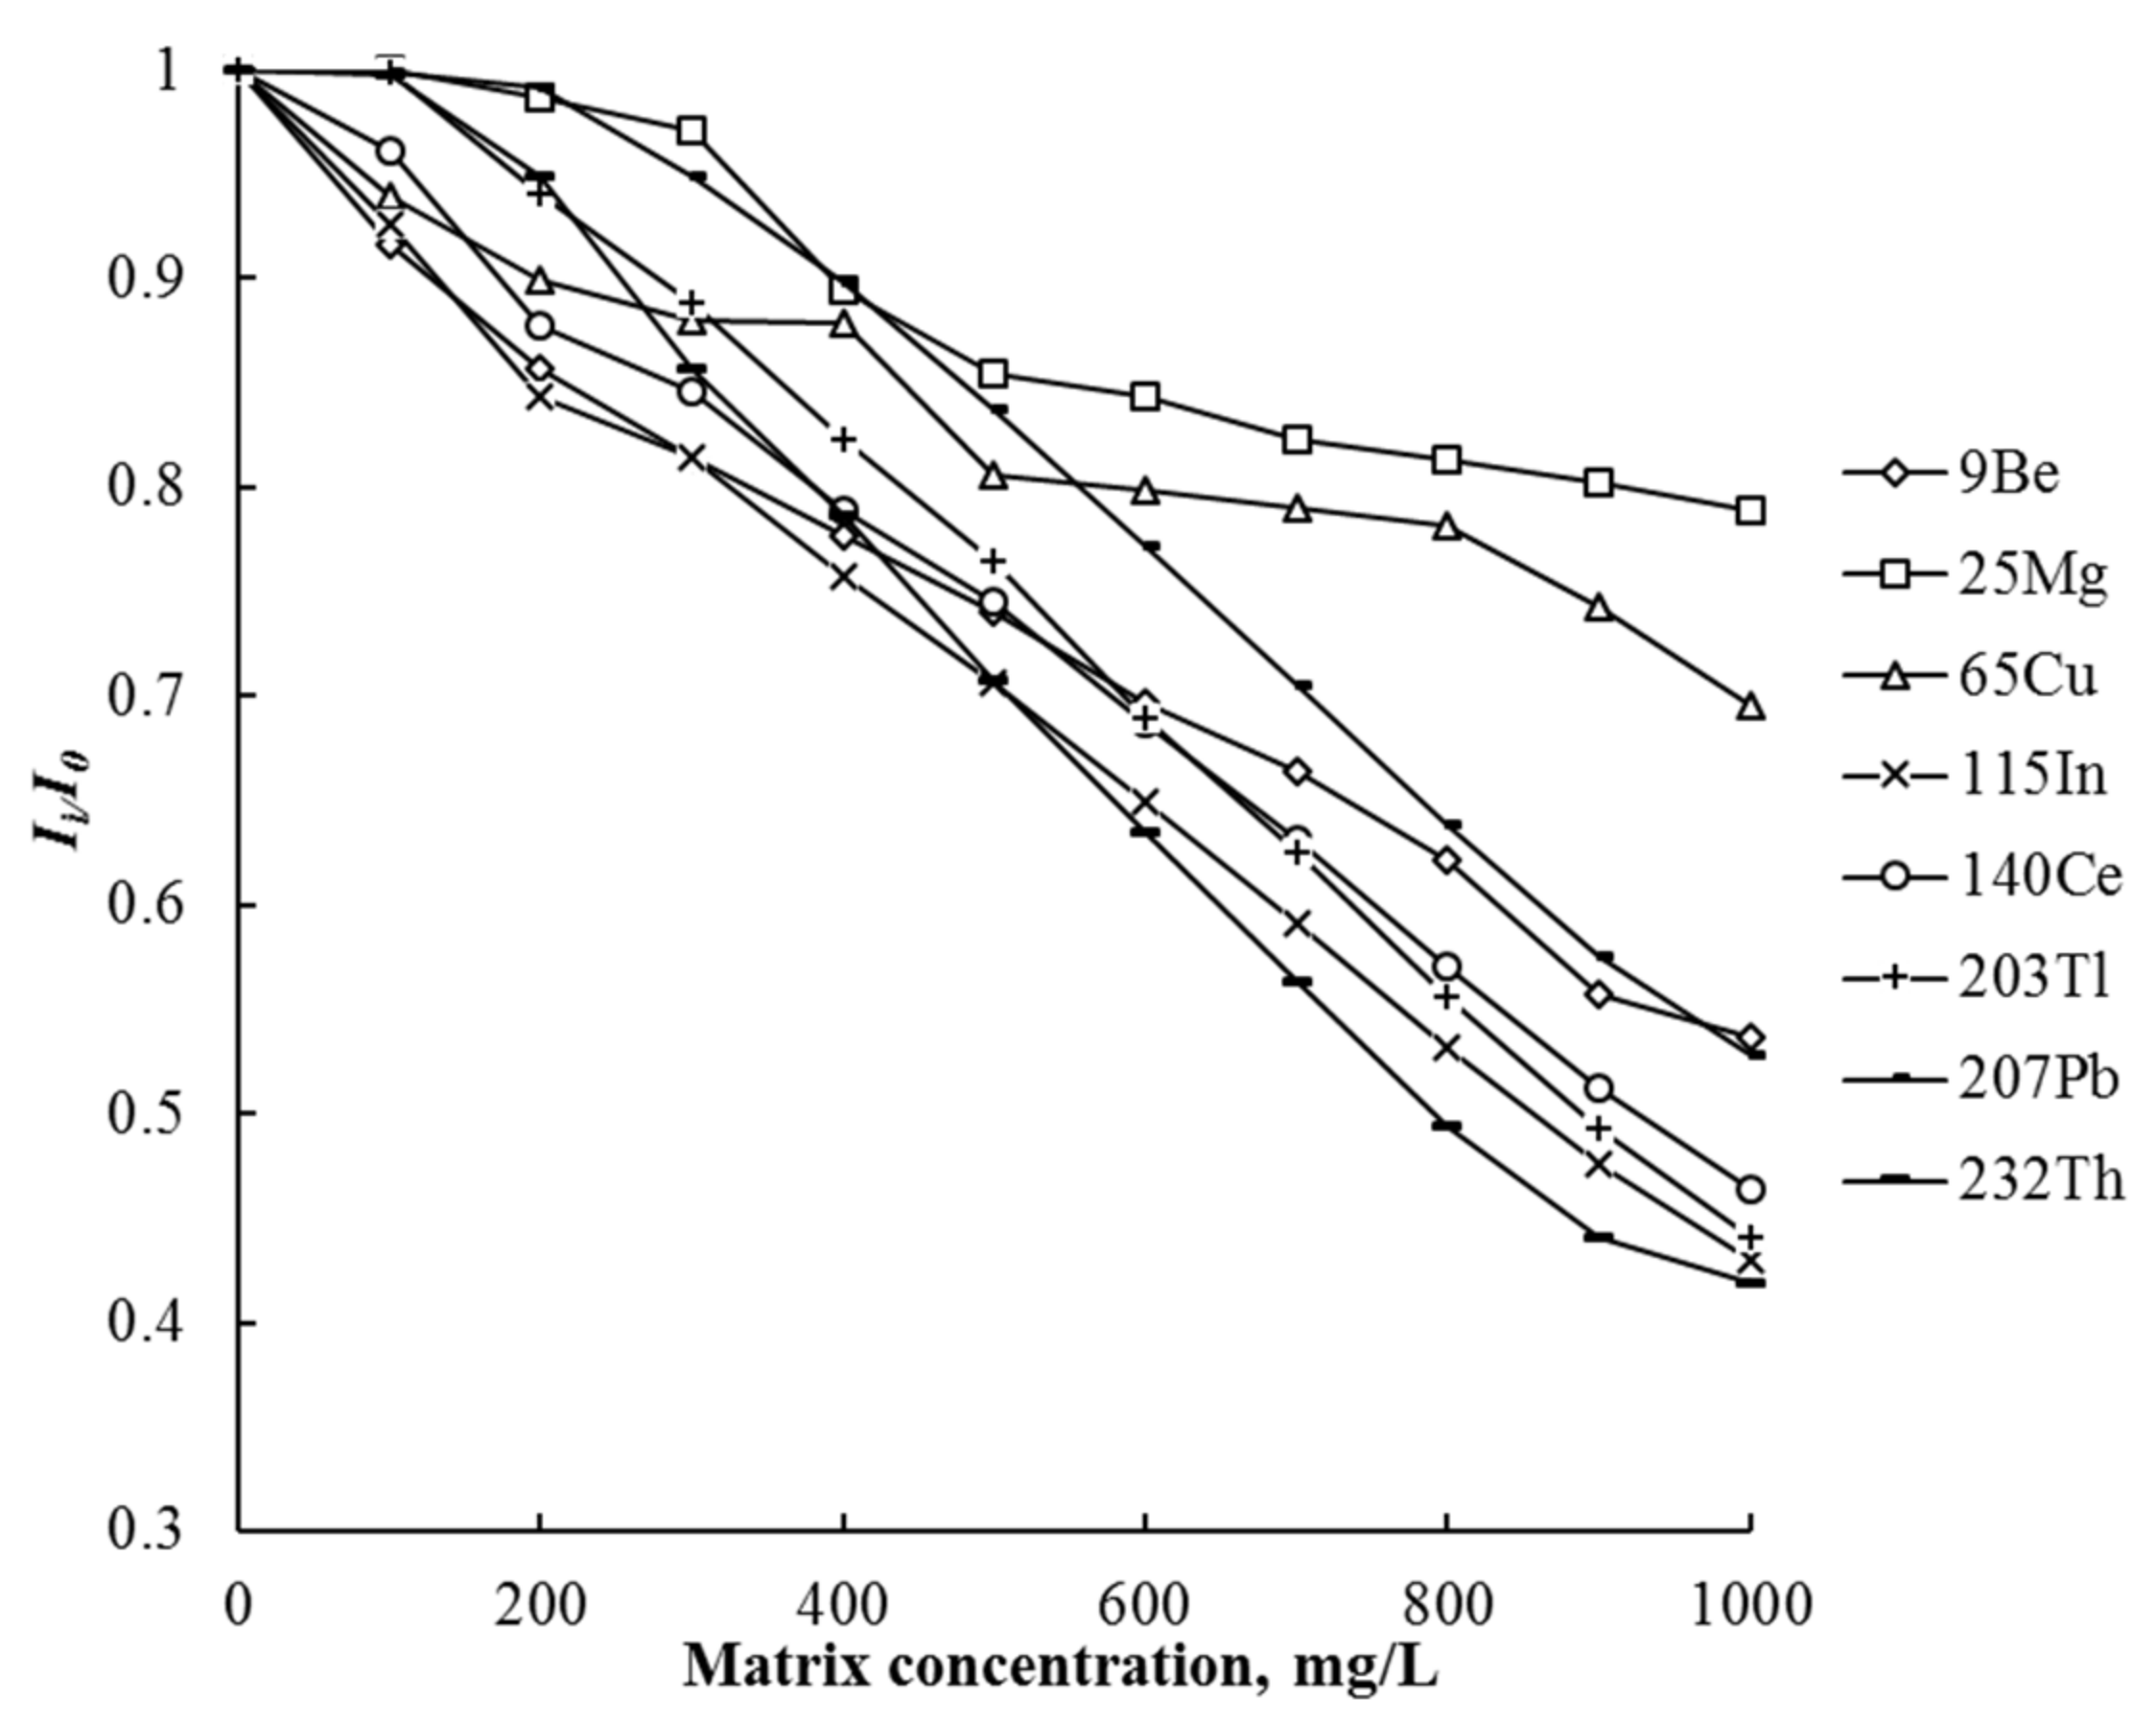
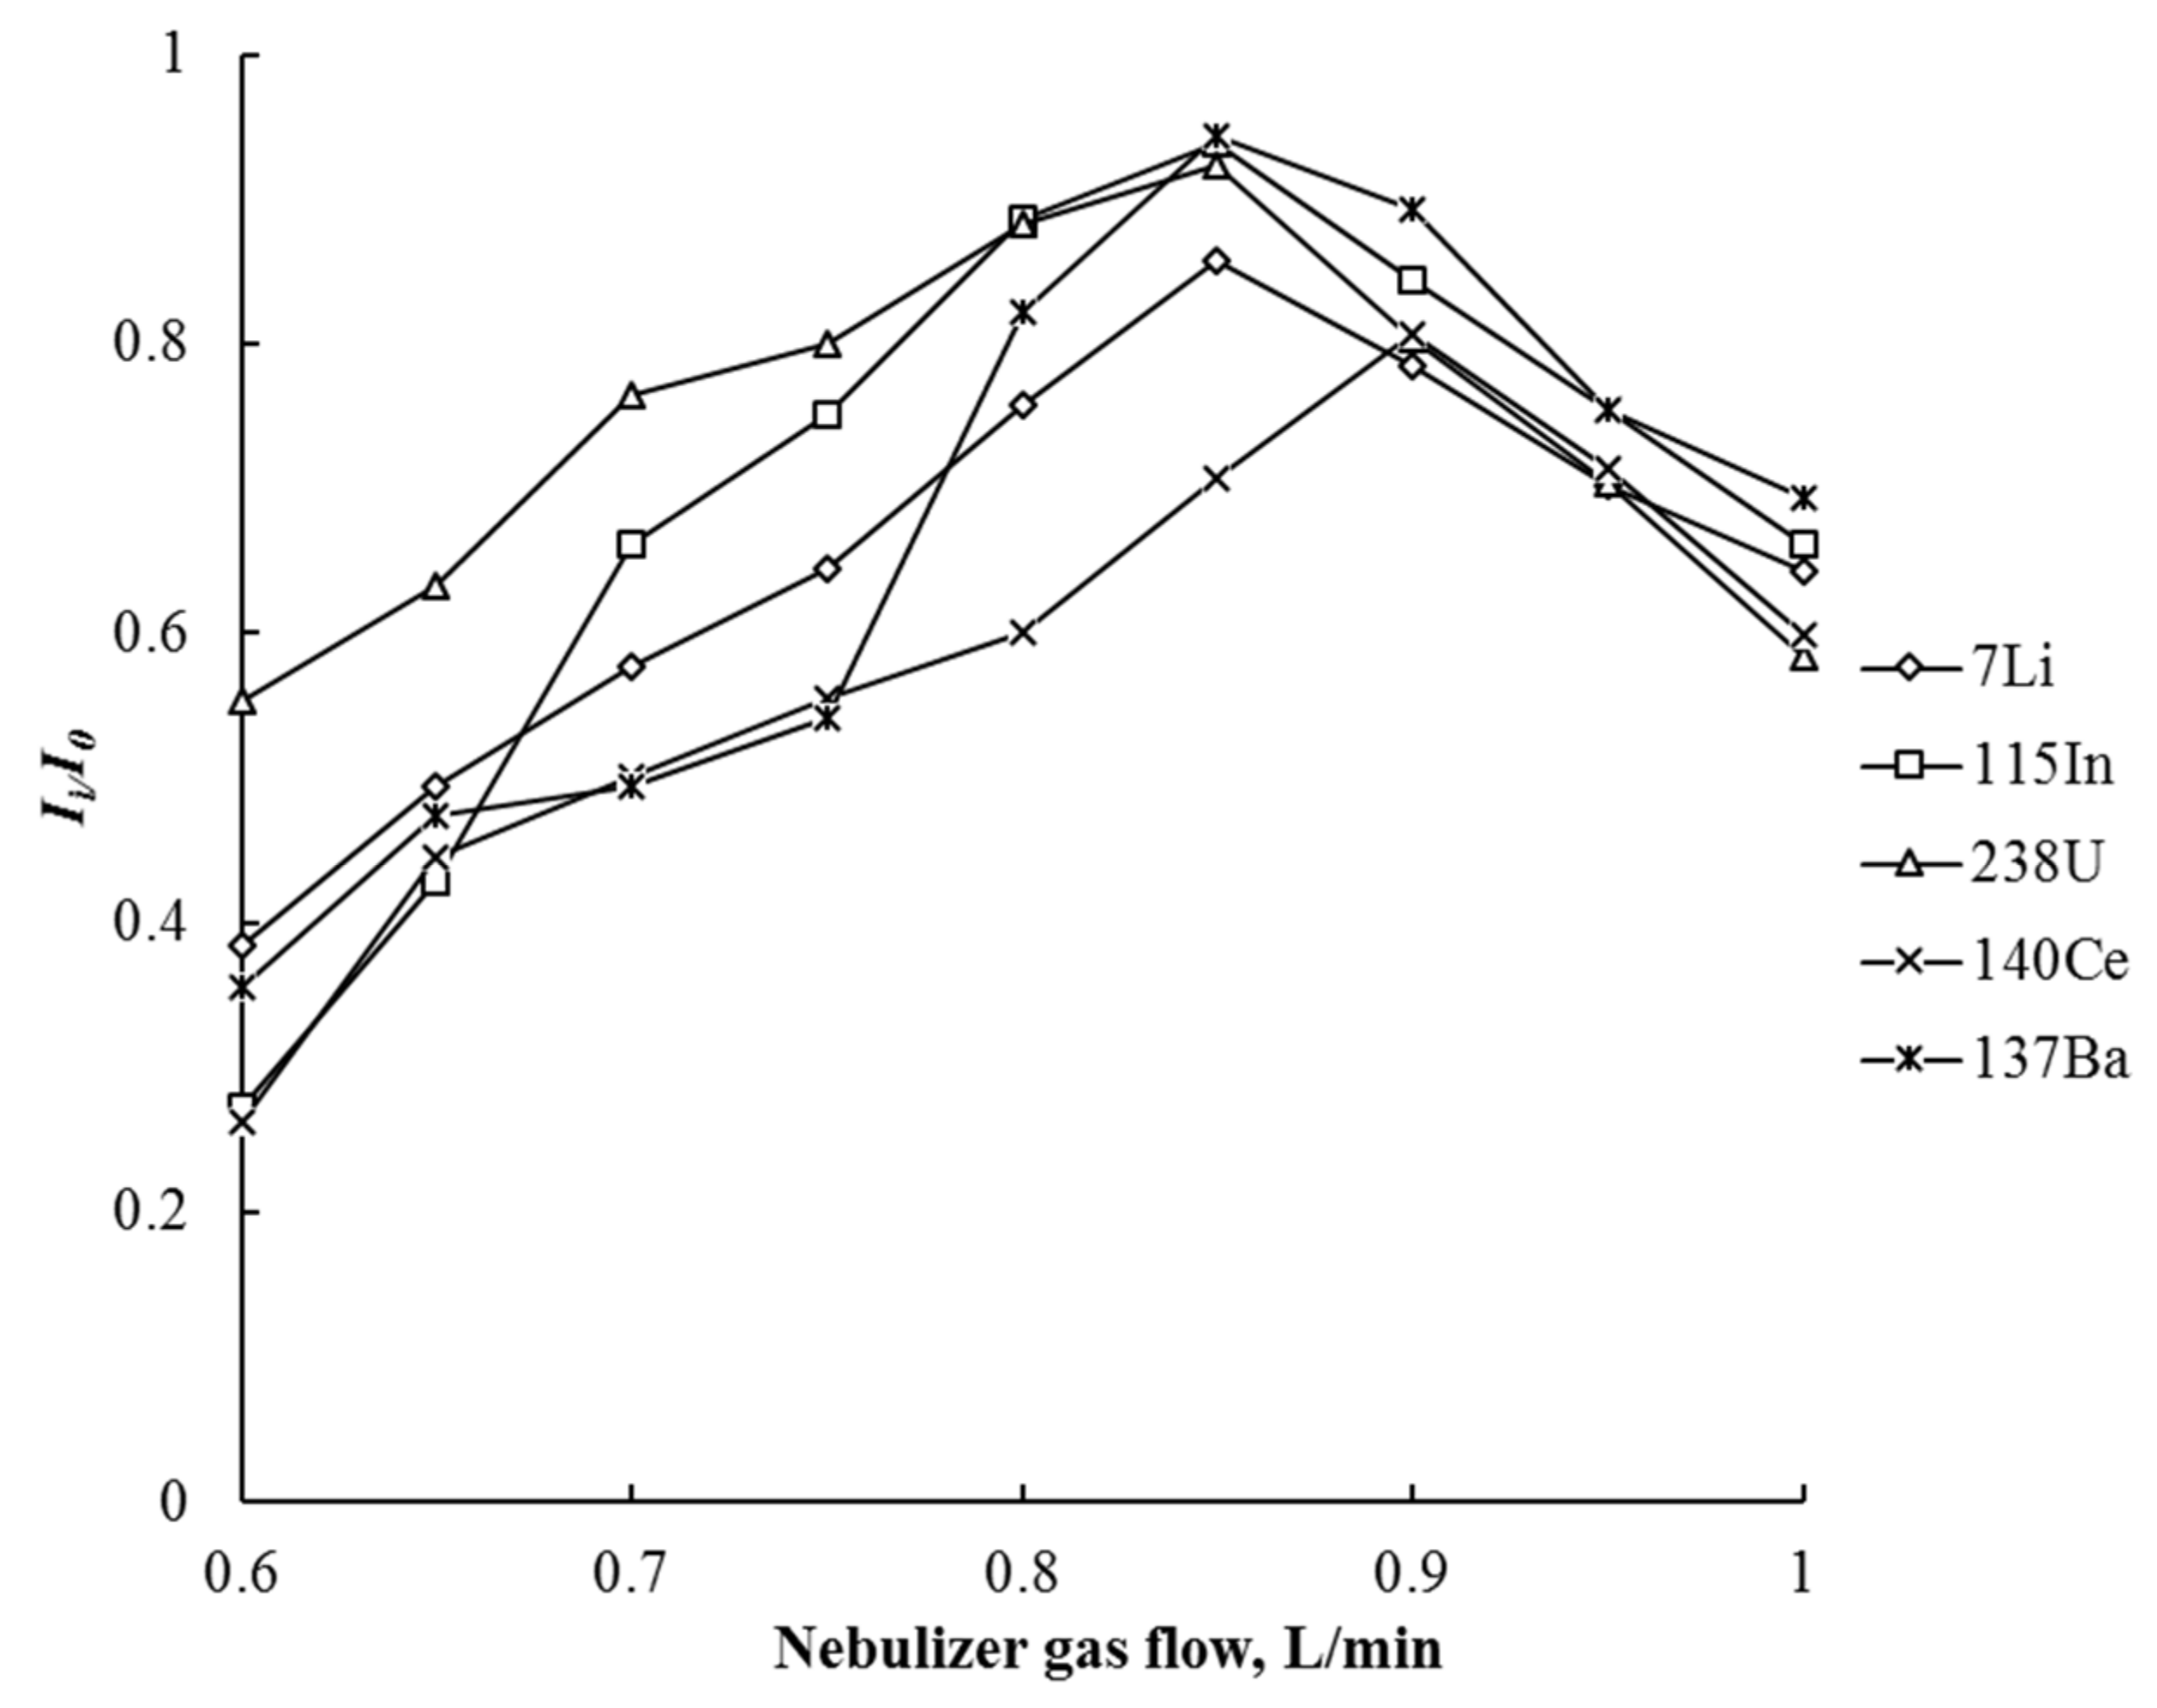
3.2. ICP-MS and ICP-OES Determination of Elements
4. Conclusions
Author Contributions
Funding
Institutional Review Board Statement
Informed Consent Statement
Data Availability Statement
Acknowledgments
Conflicts of Interest
References
- Sinha, M.K.; Pramanik, S.; Kumari, A.; Sahu, S.K.; Prasad, L.B.; Jha, M.K.; Yoo, K.; Pandey, B.D. Recovery of value added products of Sm and Co from waste SmCo magnet by hydrometallurgical route. Sep. Purif. Technol. 2017, 179, 1–12. [Google Scholar] [CrossRef]
- Li, X.; Li, Z.; Orefice, M.; Binnemans, K. Metal Recovery from Spent Samarium−Cobalt Magnets Using a Trichloride Ionic Liquid. ACS Sustain. Chem. Eng. 2019, 7, 2578–2584. [Google Scholar] [CrossRef] [Green Version]
- Papai, R.; Sousa de Freitas, M.A.; Torre da Fonseca, K.; Alves de Almeida, G.; Filipini da Silveira, J.R.; Nunis da Silva, A.L.; Ferreira Neto, J.B.; Lino dos Santos, C.A.; Gomes Landgraf, F.J.; Luz, M.S. Additivity of optical emissions applied to neodymium and praseodymium quantification in metallic didymium and (Nd, Pr)-Fe-B alloy samples by low-resolution atomic emission spectrometry: An evaluation of the mathematical approach used to solve spectral interferences. Anal. Chim. Acta 2019, 1085, 21–28. [Google Scholar] [CrossRef] [PubMed]
- München, D.D.; Veit, H.M. Neodymium as the main feature of permanent magnets from hard disk drives (HDDs). Waste Manag. 2017, 61, 372–376. [Google Scholar] [CrossRef] [PubMed]
- Bonin, M.; Fontaine, F.G.; Larivière, D. Comparative Studies of Digestion Techniques for the Dissolution of Neodymium-Based Magnets. Metals 2021, 11, 1149. [Google Scholar] [CrossRef]
- Kuchumov, V.A.; Shoomkin, S.S. Analysis of the chemical composition of the bearing alloy used in the production of Sm-Co-based permanent magnets. St. Petersburg Polytech. Univ. J. Eng. Sci. Technol. 2017, 23, 219–225. [Google Scholar] [CrossRef]
- Iwasaki, K.; Uchida, H. Rapid determination of Major and Minor Elements in Rare Earth-Cobalt Magnets by Inductively Coupled Plasma Atomic Emission Spectrometry. Anal. Sci. 1986, 2, 261–264. [Google Scholar] [CrossRef] [Green Version]
- Xu, X.; Khoshima, S.; Karajic, M.; Balderman, J.; Markovic, K.; Scancar, J.; Rozman, K.Z. Electrochemical routes for environmentally friendly recycling of rare-earth-based (Sm–Co) permanent magnets. J. Appl. Electrochem. 2022, 52, 1081–1090. [Google Scholar] [CrossRef]
- Dehghan, A.; Rezaee, M.; Veyseh, S.; AsliPashaki, S.N. Measurement of Light Rare Earth Element of Samarium in the Processing of Mineral Concentrate Samples by HLLME Pre-Concentration Method and ICP-MS. Minerals 2020, 10, 1–11. [Google Scholar] [CrossRef]
- Matthews, M.W.; Eggleston, H.C.; Pekarek, S.D.; Hilmas, G.E. Magnetically adjustable intraocular lens. J. Cataract Refract. Surg. 2003, 29, 2211–2216. [Google Scholar] [CrossRef]
- Akin, H.; Emre, C.M.; Topcuoglu, T.; Kemal Ozdemir, A. Can laser welding stop corrosion of new generation magnetic attachment systems. Mater. Res. Innov. 2011, 15, 66–69. [Google Scholar] [CrossRef]
- Petrova, K.V.; Baranovskaya, V.B.; Korotkova, N.A. Direct inductively coupled plasma optical emission spectrometry for analysis of waste samarium-cobalt magnets. Arab. J. Chem. 2022, 15, 103501. [Google Scholar] [CrossRef]
- Chausseau, M. High-resolution ICP-OES for the determination of trace elements in a rare earth element matrix and in NdFeB magnetic materials. Spectroscopy 2014, 29, 30–41. [Google Scholar]
- Kim, D.; Powell, L.E.; Delmau, L.H.; Peterson, E.S.; Herchenroeder, J.; Bhave, R.R. Selective extraction of rare earth elements from permanent magnet scraps with membrane solvent extraction. Environ. Sci. Technol. 2015, 49, 9452–9459. [Google Scholar] [CrossRef]
- Avdibegović, D.; Binnemans, K. Chromatographic separation of rare earths from aqueous and ethanolic leachates of NdFeB and SmCo magnets by a supported ionic liquid phase. RSC Adv. 2021, 11, 8207–8217. [Google Scholar] [CrossRef]
- Navarro, M.S.; Andrade, S.; Ulbrich, H.; Gomes, C.B.; Girardi, V.A. The direct determination of rare earth elements in basaltic and related rocks using ICP-MS: Testing the efficiency of microwave oven sample decomposition procedures. Geostand. Geoanal. Res. 2008, 32, 167–180. [Google Scholar] [CrossRef]
- Balaram, V.; Subramanyam, K.S.V. Sample preparation for geochemical analysis: Strategies and significance. Adv. Sample Prep. 2022, 1, 100010. [Google Scholar] [CrossRef]
- Karandashev, V.K.; Orlova, T.V.; Zybinsky, A.M.; Kordyukov, S.V.; Simakov, V.A.; Kolotov, V.P. Analysis of niobium-rare-earth ores by inductively coupled plasma mass spectrometry. J. Anal. Chem. 2018, 7, 364–373. [Google Scholar] [CrossRef]
- Hastiawan, I.; Bings, N.H.; Broekaert, J.A.C. Development and Optimization of Pre-Concentration Procedure of Rare-Earth Elements (REEs) in Their Minerals, Using Microwave—Assisted Sample Dissolution for ICP-Atomic Emission Spectrometric Detection. Procedia Chem. 2015, 17, 93–98. [Google Scholar] [CrossRef] [Green Version]
- Balarama, K.M.V.; Venkateswarlu, G.; Karunasagar, D. Development of a simple and robust microwave-assisted decomposition method for the determination of rare earth elements in coal fly ash by ICP-OES. Anal. Methods 2017, 9, 2031–2040. [Google Scholar] [CrossRef]
- Hassan, N.M.; Rasmussen, P.E.; Dabek-Zlotorzynska, E.; Celo, V.; Heidi, C. Analysis of Environmental Samples Using Microwave-Assisted Acid Digestion and Inductively Coupled Plasma Mass Spectrometry: Maximizing Total Element Recoveries. Water Air Soil Pollut. 2007, 178, 323–334. [Google Scholar] [CrossRef]
- Helmeczi, E.; Wang, Y.; Brindle, I.D. A novel methodology for rapid digestion of rare earth element ores and determination by microwave plasma-atomic emission spectrometry and dynamic reaction cell-inductively coupled plasma-mass spectrometry. Talanta 2016, 160, 521–527. [Google Scholar] [CrossRef] [PubMed]
- Sandroni, V.; Smith, C.M. Microwave digestion ofsludge, soil and sediment samples for metal analysis byinductively coupled plasma-atomic emission spectrometry. Anal. Chim. Acta 2002, 468, 334–335. [Google Scholar] [CrossRef]
- Aldabe, J.; Santamaria, C.; Elustondo, D.; Lasheras, E.; Santamaria, J.M. Application of microwave digestion and ICP-MS to simultaneous analysis of major and trace elements in aerosol samples collected on quartz filters. Anal. Methods 2013, 5, 554. [Google Scholar] [CrossRef]
- Balaram, V. Strategies to overcome interferences in elemental and isotopic geochemical analysis by quadrupole inductively coupled plasma mass spectrometry: A critical evaluation of the recent developments. Rapid Commun. Mass Spectrom. 2021, 35, e9065. [Google Scholar] [CrossRef]
- Wilschefski, S.C.; Baxter, M.R. Inductively coupled plasma mass spectrometry: Introduction to analytical aspects. Clin. Biochem. Rev. 2019, 40, 15. [Google Scholar] [CrossRef]
- Loula, M.; Kaňa, A.; Mestek, O. Non-spectral interferences in single-particle ICP-MS analysis: An underestimated phenomenon. Talanta 2019, 202, 565–571. [Google Scholar] [CrossRef]
- Agatemor, C.; Beauchemin, D. Matrix effects in inductively coupled plasma mass spectrometry: A review. Anal. Chim. Acta 2011, 706, 66–83. [Google Scholar] [CrossRef]
- Todoli, J.L.; Mermet, J.M. Liquid Sample Introduction in ICP Spectrometry; A Practical Guide, 1st ed.; Elsevier Science: Oxford, UK, 2008; p. 300. [Google Scholar]
- Tromp, J.; Pomares, M.; Álvarez-Prieto, M.; Cole, A.; Ying, H.; Salin, E. Exploration of robust operating conditions in inductively coupled plasma mass spectrometry. Spectrochim. Acta Part B At. Spectrosc. 2003, 58, 1927–1944. [Google Scholar] [CrossRef]

| Power/W | 800 |
| Vessels | EasyPrep iWave |
| No. of vessels | 12 |
| Vessel volume/mL | 30 |
| Sensor control | P |
| Ramp time/min | 10 |
| Hold time/min | 5–60 |
| Hold temperature/°C | 150–250 |
| Cooling time/min | 15 |
| Mass/mg | 200 |
| Volume of H2O/mL | 10 |
| Volume of HNO3/mL | 0–5 |
| Volume of HCl/mL | 0–15 |
| Volume of HF/mL | 0–1 |
| Volume of H2SO4/mL | 0–1 |
| Forward power/W | 1400 |
| Wavelength range | 167 to 852 nm |
| Coolant gas flow/L·min−1 | 15 |
| Auxiliary gas flow/L·min−1 | 0.35 |
| Nebulizer gas flow/L·min−1 | 0.5 |
| Sample flow rate/rpm | 60 |
| Pump tube/mm | 0.64 |
| Radial viewing height/mm | 10 |
| Injector diameter/mm | 2 |
| Pneumatic nebulizer | SeaSpray Nebulizer, Glass Expansion |
| Spray chamber | Cyclonic Spray Chamber, Glass Expansion |
| Wavelengths of determined elements/nm | Al 167.079, Mg 285.213, Ti 368.520, Cr 205.560, Cr 425.435, Mn 257.610, Nb 295.088, La 333.749, La 626.230, Nd 430.358, Nd 445.157, Eu 281.394, Gd 301.013, Tb 332.440, Tb 387.417, Dy 400.045, Dy 369.481, Tm 534.649, Tm 286.923, Yb 328.937, Lu 291.139, Hf 232.247, Ni 227.021, Ni 230.300, Cu 224.700, Fe 259.940, Zr 257.139, Mo 202.030, Si 212.412, Sm 359.260 and Co 235.342 |
| Forward power/W | 1300 |
| Coolant gas flow/L·min−1 | 0.8 |
| Auxiliary gas flow/L·min−1 | 13 |
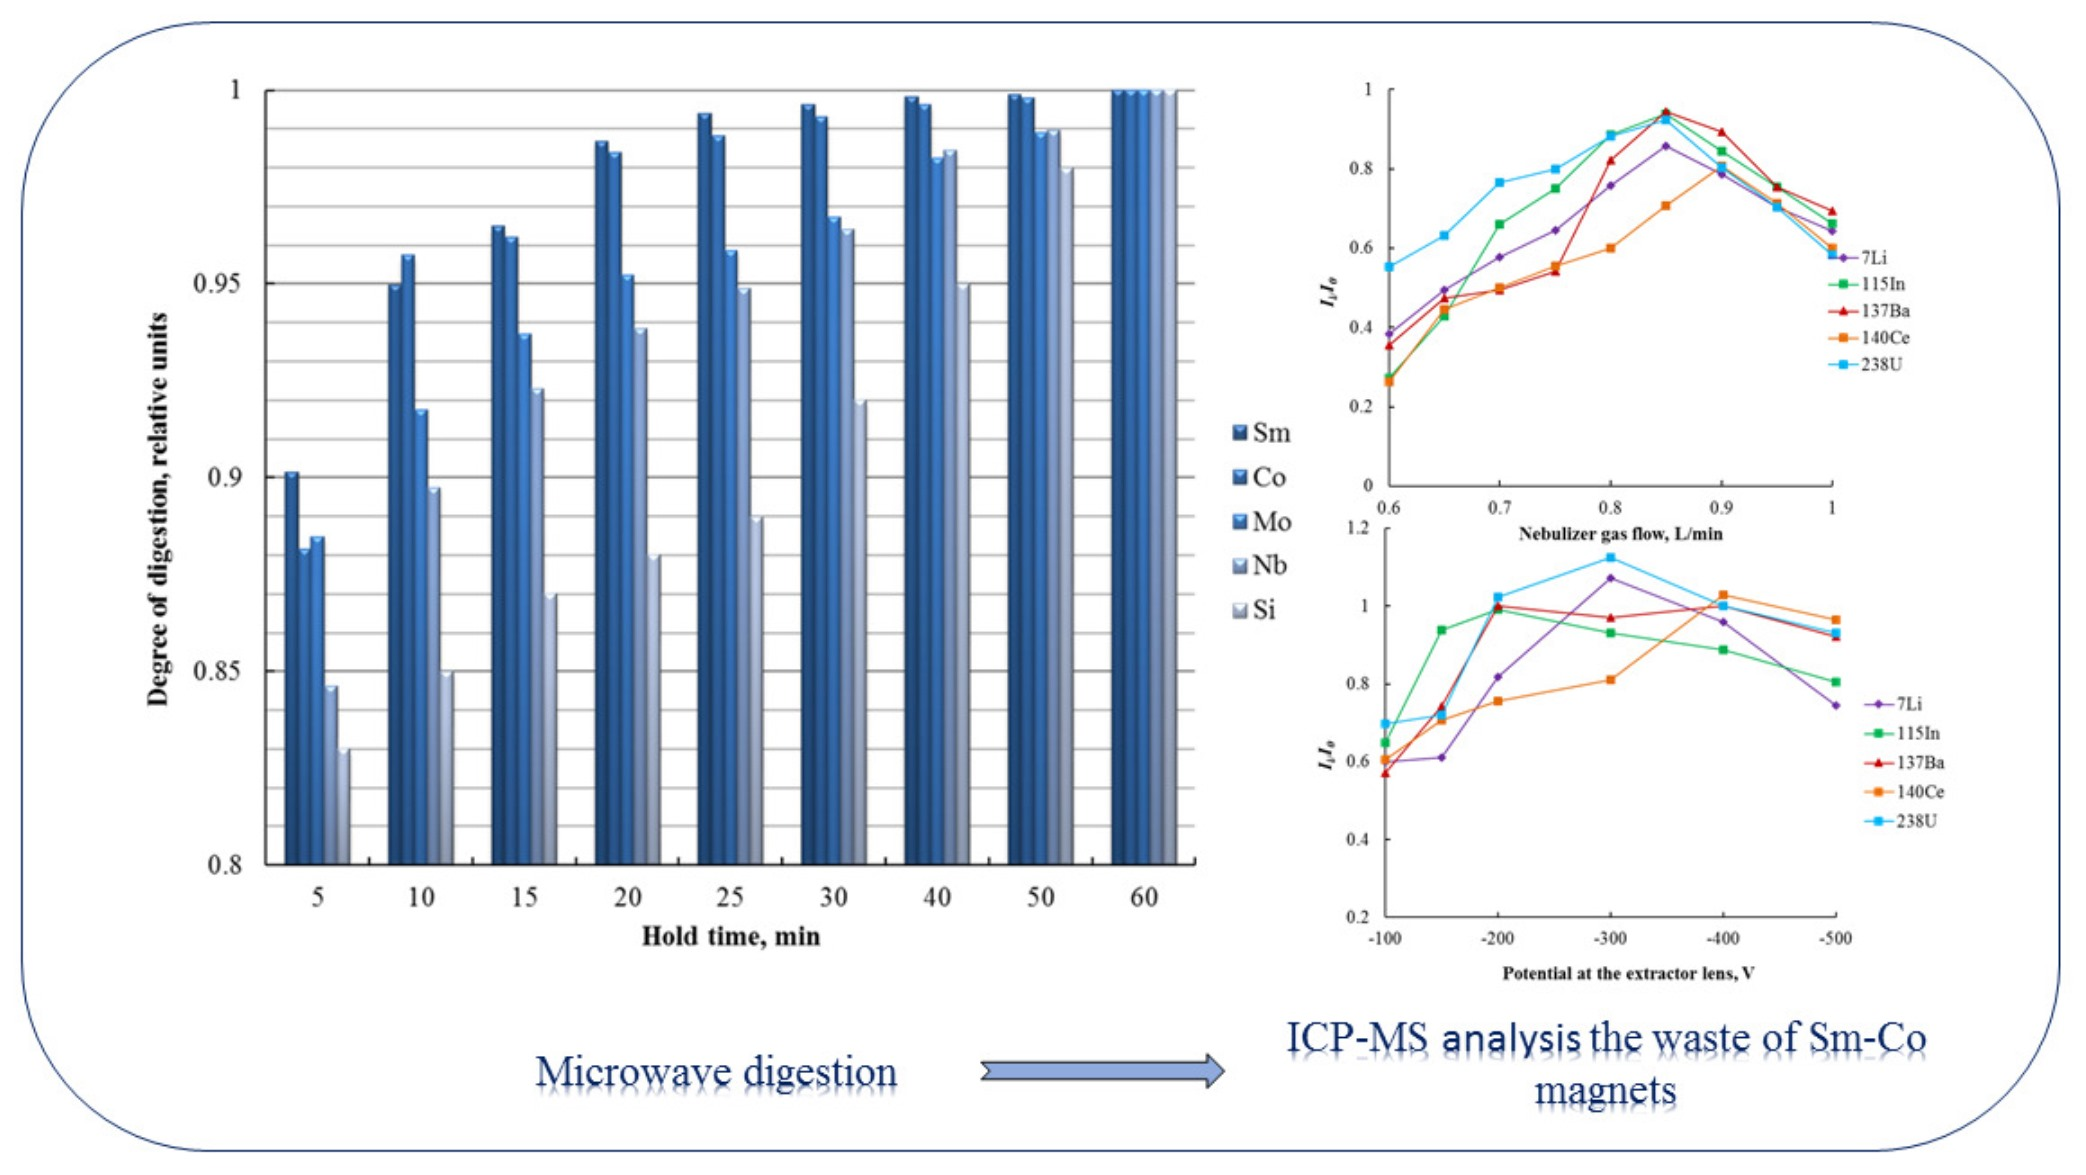
| Nebulizer gas flow/L·min−1 | 0.6–1.0 |
| Sample flow rate/rpm | 20–100 |
| Sampling depth/relative units | 100–500 |
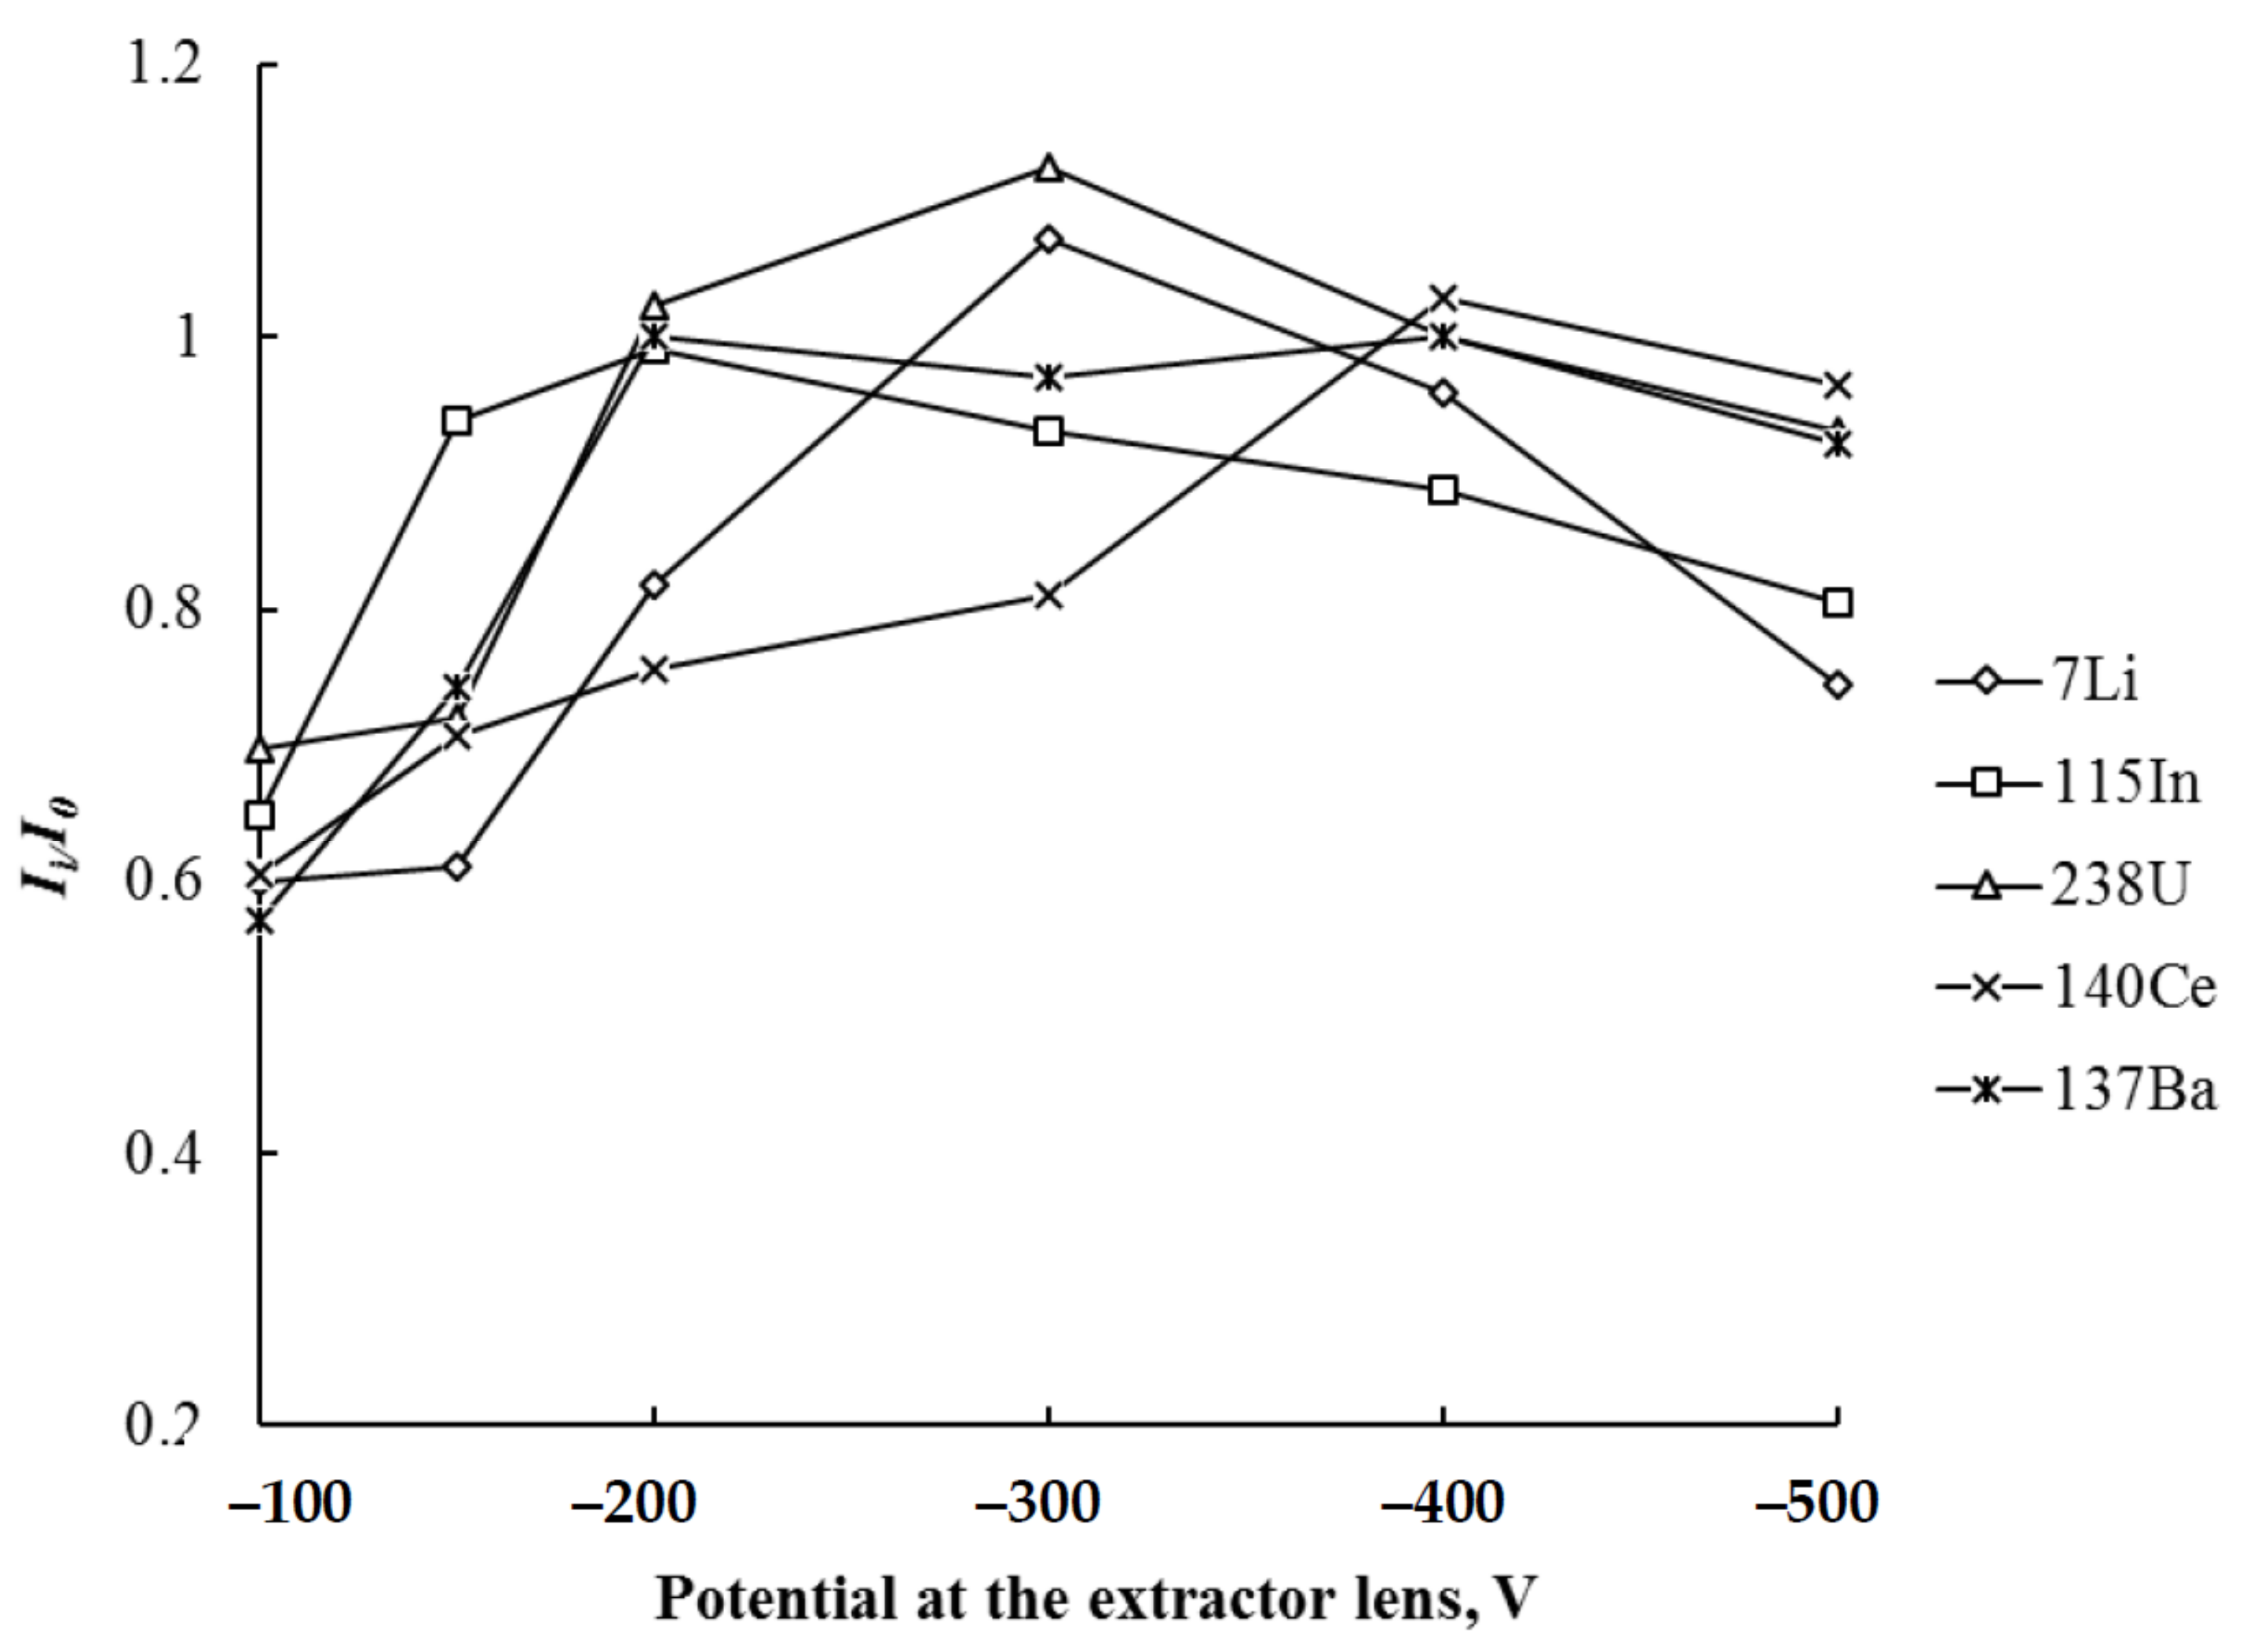
| Potential at the extractor lens/V | −100–−500 |
| Spray booth temperature/°C | 3 |
| Level of oxide ions/% | <2 |
| Level of doubly charged ions/% | <1.5 |
| Measurement mode | Peak hopping |
| Pneumatic nebulizer | SeaSpray Nebulizer, Glass Expansion |
| Spray chamber | Quartz conical, Peltier cooled |
| Isotopes of elements to be determined/m/z | 25Mg, 27Al, 45Sc, 47Ti, 52Cr, 55Mn, 57Fe, 62Ni, 63Cu, 89Y, 91Zr, 139La, 140Ce, 141Pr, 145Nd, 151Eu, 158Gd, 159Tb, 161Dy, 165Ho, 167Er, 169Tm, 174Yb, 175Lu, 177Hf |
| Internal standard | 115In |
| Hold Temperature, °C | Recovery, % | ||||
|---|---|---|---|---|---|
| Sm | Co | Mo | Nb | Si | |
| 150 | 74.3 | 72.1 | 72.7 | 77.8 | 72.4 |
| 170 | 90.4 | 90.6 | 92.3 | 90.2 | 81.2 |
| 200 | 95.1 | 94.9 | 95.5 | 95.3 | 95.6 |
| 220 | 95.2 | 95.5 | 96.1 | 95.4 | 95.9 |
| 250 | 100.1 | 99.3 | 100.2 | 100.0 | 99.5 |
| Element | Isotope | Polyatomic Ion | Apparent Concentration of the Element, µg/g |
|---|---|---|---|
| Eu | 151Eu | 150Sm1H+ | 0.06 |
| 153Eu | 152Sm1H+ | 0.35 | |
| Gd | 155Gd | 154Sm1H+ | 0.70 |
| 156Gd | 144Sm12C+ | 0.20 | |
| 157Gd | 144Sm13C+ | 0.10 | |
| 158Gd | 144Sm14N+ | 0.10 | |
| Dy | 161Dy | 144Sm16O1H+ | 2.0 |
| 162Dy | 147Sm15N+, 148Sm14N+, 149Sm13C+, 150Sm12C+ | 3.5 | |
| 163Dy | 147Sm16O+ | 50.5 | |
| 164Dy | 147Sm16O1H+, 148Sm16O+ | 18.0 | |
| Ho | 165Ho | 148Sm16O1H+, 149Sm16O+ | 5.0 |
| Er | 166Er | 149Sm16O1H+, 150Sm16O+ | 115.0 |
| 167Er | 150Sm16O1H+ | 4.0 | |
| 168Er | 152Sm16O+ | 110.0 | |
| 170Er | 154Sm16O+ | 150.0 | |
| Tm | 169Tm | 152Sm16O1H+ | 2.0 |
| Yb | 171Yb | 154Sm16O1H+ | 15.0 |
| Element | LOQs * of ICP-MS, wt. % | LOQs ** of ICP-OES, wt. % | Content, wt. % ( ± 1.96·Sr, (n = 3, p = 0.95)) | |
|---|---|---|---|---|
| ICP-MS, wt. % | ICP-OES, wt. % | |||
| Mg | 3.0 × 10⁻⁵ | 5.0 × 10⁻⁴ | (6.51 ± 0.09) × 10−3 | (6.78 ± 0.17) × 10−3 |
| Al | 1.0 × 10⁻⁵ | 2.0 × 10⁻⁴ | (2.61 ± 0.05) × 10−1 | (2.57 ± 0.05) × 10−1 |
| Si | 2.5 × 10⁻³ | 1.0 × 10⁻⁴ | ND *** | 1.45 ± 0.02 |
| Sc | 1.0 × 10⁻⁵ | 3.0 × 10⁻⁴ | <1.0 × 10⁻⁵ | <5.0 × 10⁻⁵ |
| Ti | 1.0 × 10⁻⁵ | 5.0 × 10⁻⁴ | (3.28 ± 0.03) × 10−2 | (3.37 ± 0.07) × 10−2 |
| Cr | 3.6 × 10⁻⁴ | 2.0 × 10⁻⁴ | (2.65 ± 0.04) ∙10−2 | (2.63 ± 0.05) × 10−2 |
| Mn | 1.0 × 10⁻⁵ | 1.0 × 10⁻⁴ | (5.15 ± 0.07) × 10−2 | (5.09 ± 0.10) × 10−2 |
| Fe | 8.0 × 10⁻⁴ | 4.0 × 10⁻⁴ | (2.35 ± 0.04) × 10−1 | (2.29 ± 0.05) × 10−1 |
| Co | ND | ND | ND | 58.1 ± 0.9 |
| Ni | 6.0 × 10⁻⁶ | 5.0 × 10⁻⁴ | (8.61 ± 0.12) × 10−2 | (8.63 ± 0.18) × 10−2 |
| Cu | 2.0 × 10⁻⁵ | 1.0 × 10⁻³ | (2.11 ± 0.05) × 10−2 | (1.99 ± 0.08) × 10−2 |
| Y | 3.0 × 10⁻⁶ | 1.0 × 10⁻⁴ | (2.14 ± 0.04) × 10−3 | (2.18 ± 0.07) × 10−3 |
| Zr | 6.0 × 10⁻⁶ | 1.0 × 10⁻⁴ | (1.21 ± 0.01) × 10−3 | (1.19 ± 0.02) × 10−3 |
| Nb | 1.0 × 10⁻⁴ | 5.0 × 10⁻⁴ | ND | 1.95 ± 0.03 |
| Mo | 1.0 × 10⁻⁴ | 1.0 × 10⁻³ | ND | 4.60 ± 0.08 |
| La | 2.0 × 10⁻⁶ | 5.0 × 10⁻⁴ | (1.06 ± 0.13) × 10−3 | (9.86 ± 0.53) × 10−4 |
| Ce | 2.0 × 10⁻⁶ | 5.0 × 10⁻⁴ | (1.32 ± 0.02) × 10−2 | (1.36 ± 0.02) × 10−2 |
| Pr | 4.0 × 10⁻⁶ | 1.0 × 10⁻³ | (7.41 ± 0.15) × 10−4 | (8.05 ± 0.75) × 10−4 |
| Nd | 5.0 × 10⁻⁶ | 6.0 × 10⁻⁴ | (1.78 ± 0.05) × 10−2 | (1.61 ± 0.15) × 10−2 |
| Sm | ND | ND | ND | 33.8 ± 0.5 |
| Eu | 6.0 × 10⁻⁶ | 3.0 × 10⁻⁴ | (3.53 ± 0.05) × 10−3 | (2.85 ± 0.28) × 10−3 |
| Gd | 1.0 × 10⁻⁵ | 3.0 × 10⁻⁴ | (6.82 ± 0.13) × 10−3 | (6.58 ± 0.22) × 10−3 |
| Tb | 1.0 × 10⁻⁵ | 5.0 × 10⁻⁴ | (1.55 ± 0.04) × 10−3 | (1.64 ± 0.05) × 10−3 |
| Dy | 2.0 × 10⁻⁴ | 5.0 × 10⁻⁴ | (6.95 ± 0.13) × 10−3 | (7.28 ± 0.23) × 10−3 |
| Ho | 5.0 × 10⁻⁴ | 1.0 × 10⁻³ | (3.35 ± 0.09) × 10−3 | (3.12 ± 0.11) × 10−3 |
| Er | 4.0 × 10⁻⁴ | 1.0 × 10⁻³ | (4.52 ± 0.11) × 10−3 | (5.16 ± 0.25) × 10−3 |
| Tm | 2.0 × 10⁻⁴ | 3.0 × 10⁻⁴ | (2.76 ± 0.09) × 10−3 | (3.06 ± 0.21) × 10−3 |
| Yb | 5.0 × 10⁻⁶ | 1.0 × 10⁻⁴ | (1.23 ± 0.12) × 10−3 | (9.98 ± 0.39) × 10−4 |
| Lu | 3.0 × 10⁻⁶ | 5.0 × 10⁻⁴ | (7.20 ± 0.07) × 10−5 | <2.0 × 10⁻⁴ |
| Hf | 1.0 × 10⁻⁵ | 4.0 × 10⁻⁴ | (1.21 ± 0.05) × 10−4 | <2.0 × 10⁻⁴ |
Publisher’s Note: MDPI stays neutral with regard to jurisdictional claims in published maps and institutional affiliations. |
© 2022 by the authors. Licensee MDPI, Basel, Switzerland. This article is an open access article distributed under the terms and conditions of the Creative Commons Attribution (CC BY) license (https://creativecommons.org/licenses/by/4.0/).
Share and Cite
Korotkova, N.A.; Baranovskaya, V.B.; Petrova, K.V. Microwave Digestion and ICP-MS Determination of Major and Trace Elements in Waste Sm-Co Magnets. Metals 2022, 12, 1308. https://doi.org/10.3390/met12081308
Korotkova NA, Baranovskaya VB, Petrova KV. Microwave Digestion and ICP-MS Determination of Major and Trace Elements in Waste Sm-Co Magnets. Metals. 2022; 12(8):1308. https://doi.org/10.3390/met12081308
Chicago/Turabian StyleKorotkova, Natalia A., Vasilisa B. Baranovskaya, and Kseniya V. Petrova. 2022. "Microwave Digestion and ICP-MS Determination of Major and Trace Elements in Waste Sm-Co Magnets" Metals 12, no. 8: 1308. https://doi.org/10.3390/met12081308
APA StyleKorotkova, N. A., Baranovskaya, V. B., & Petrova, K. V. (2022). Microwave Digestion and ICP-MS Determination of Major and Trace Elements in Waste Sm-Co Magnets. Metals, 12(8), 1308. https://doi.org/10.3390/met12081308