
The Influence of Water Flow Characteristics on the Physical and Mechanical Qualities of Underwater Wet Welded A36 Marine Steel Plate

 ,
,  and
and
Abstract
:1. Introduction
2. Materials
2.1. Low Carbon Steel A36
2.2. E7018 Electrode
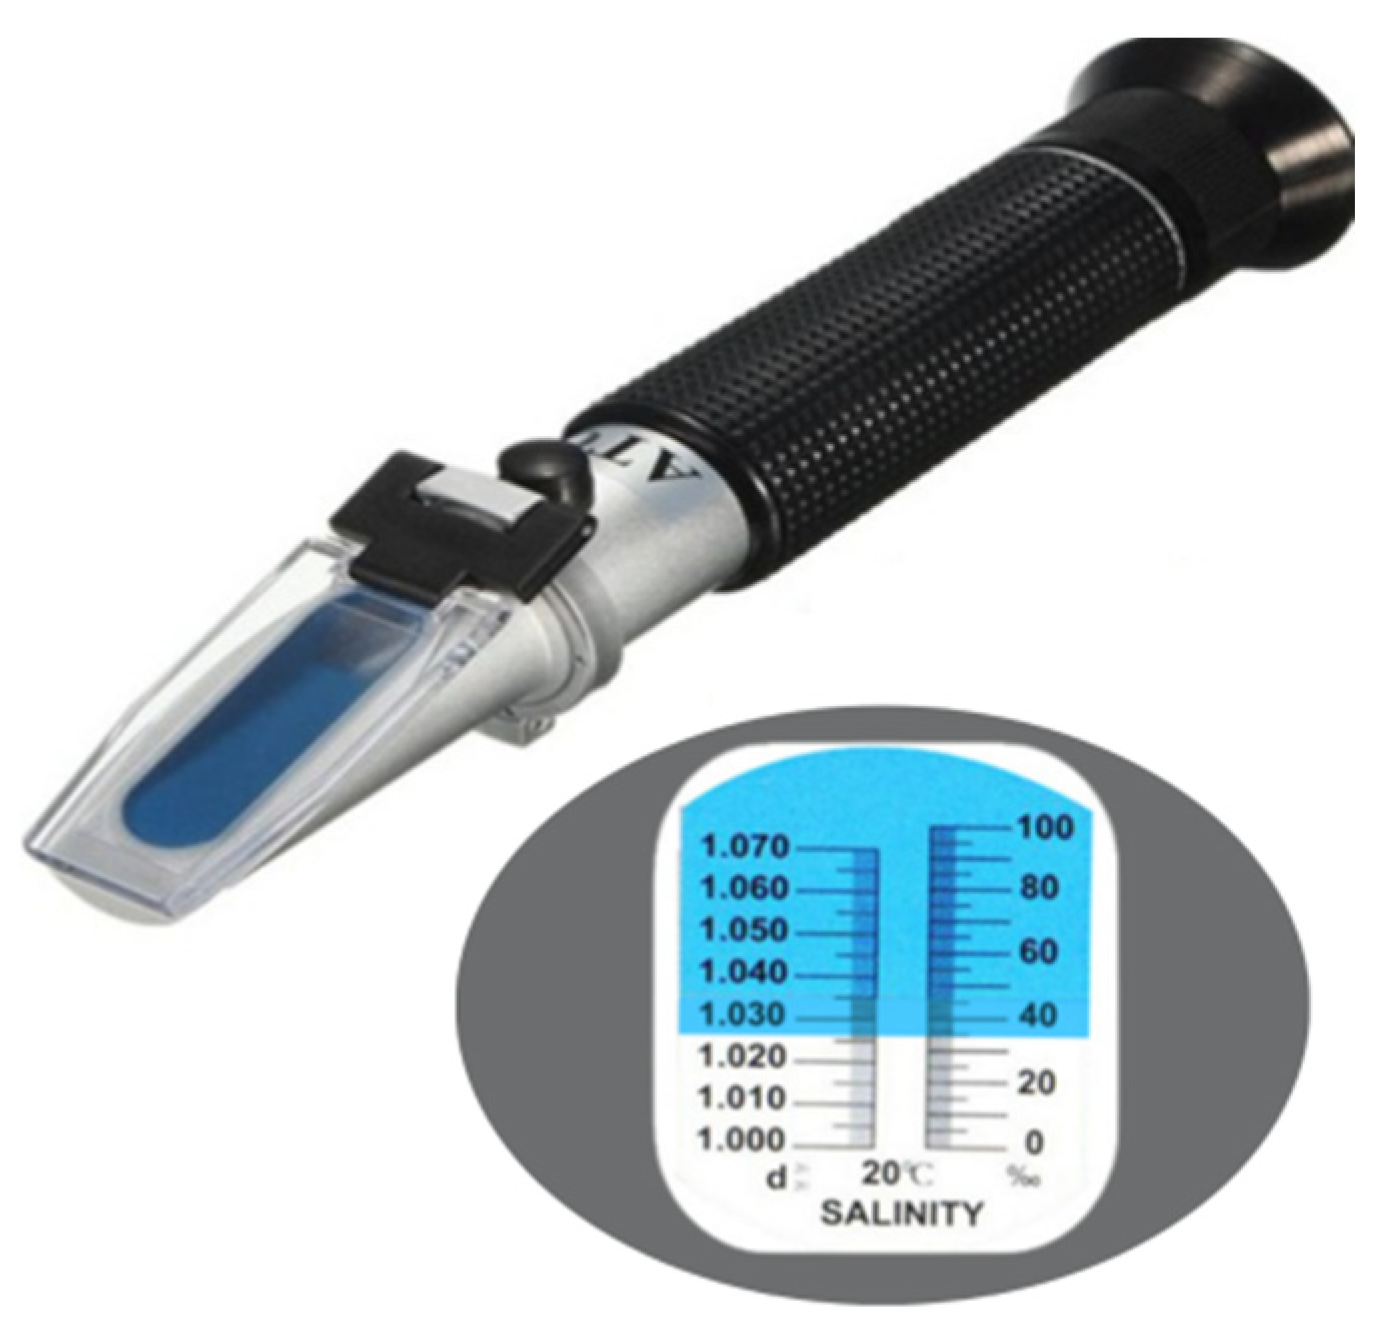
2.3. Salt Water Environment
3. Methods: Welding Apparatus and Testing Procedures
3.1. Welding Equipment
3.2. Variables and Procedures
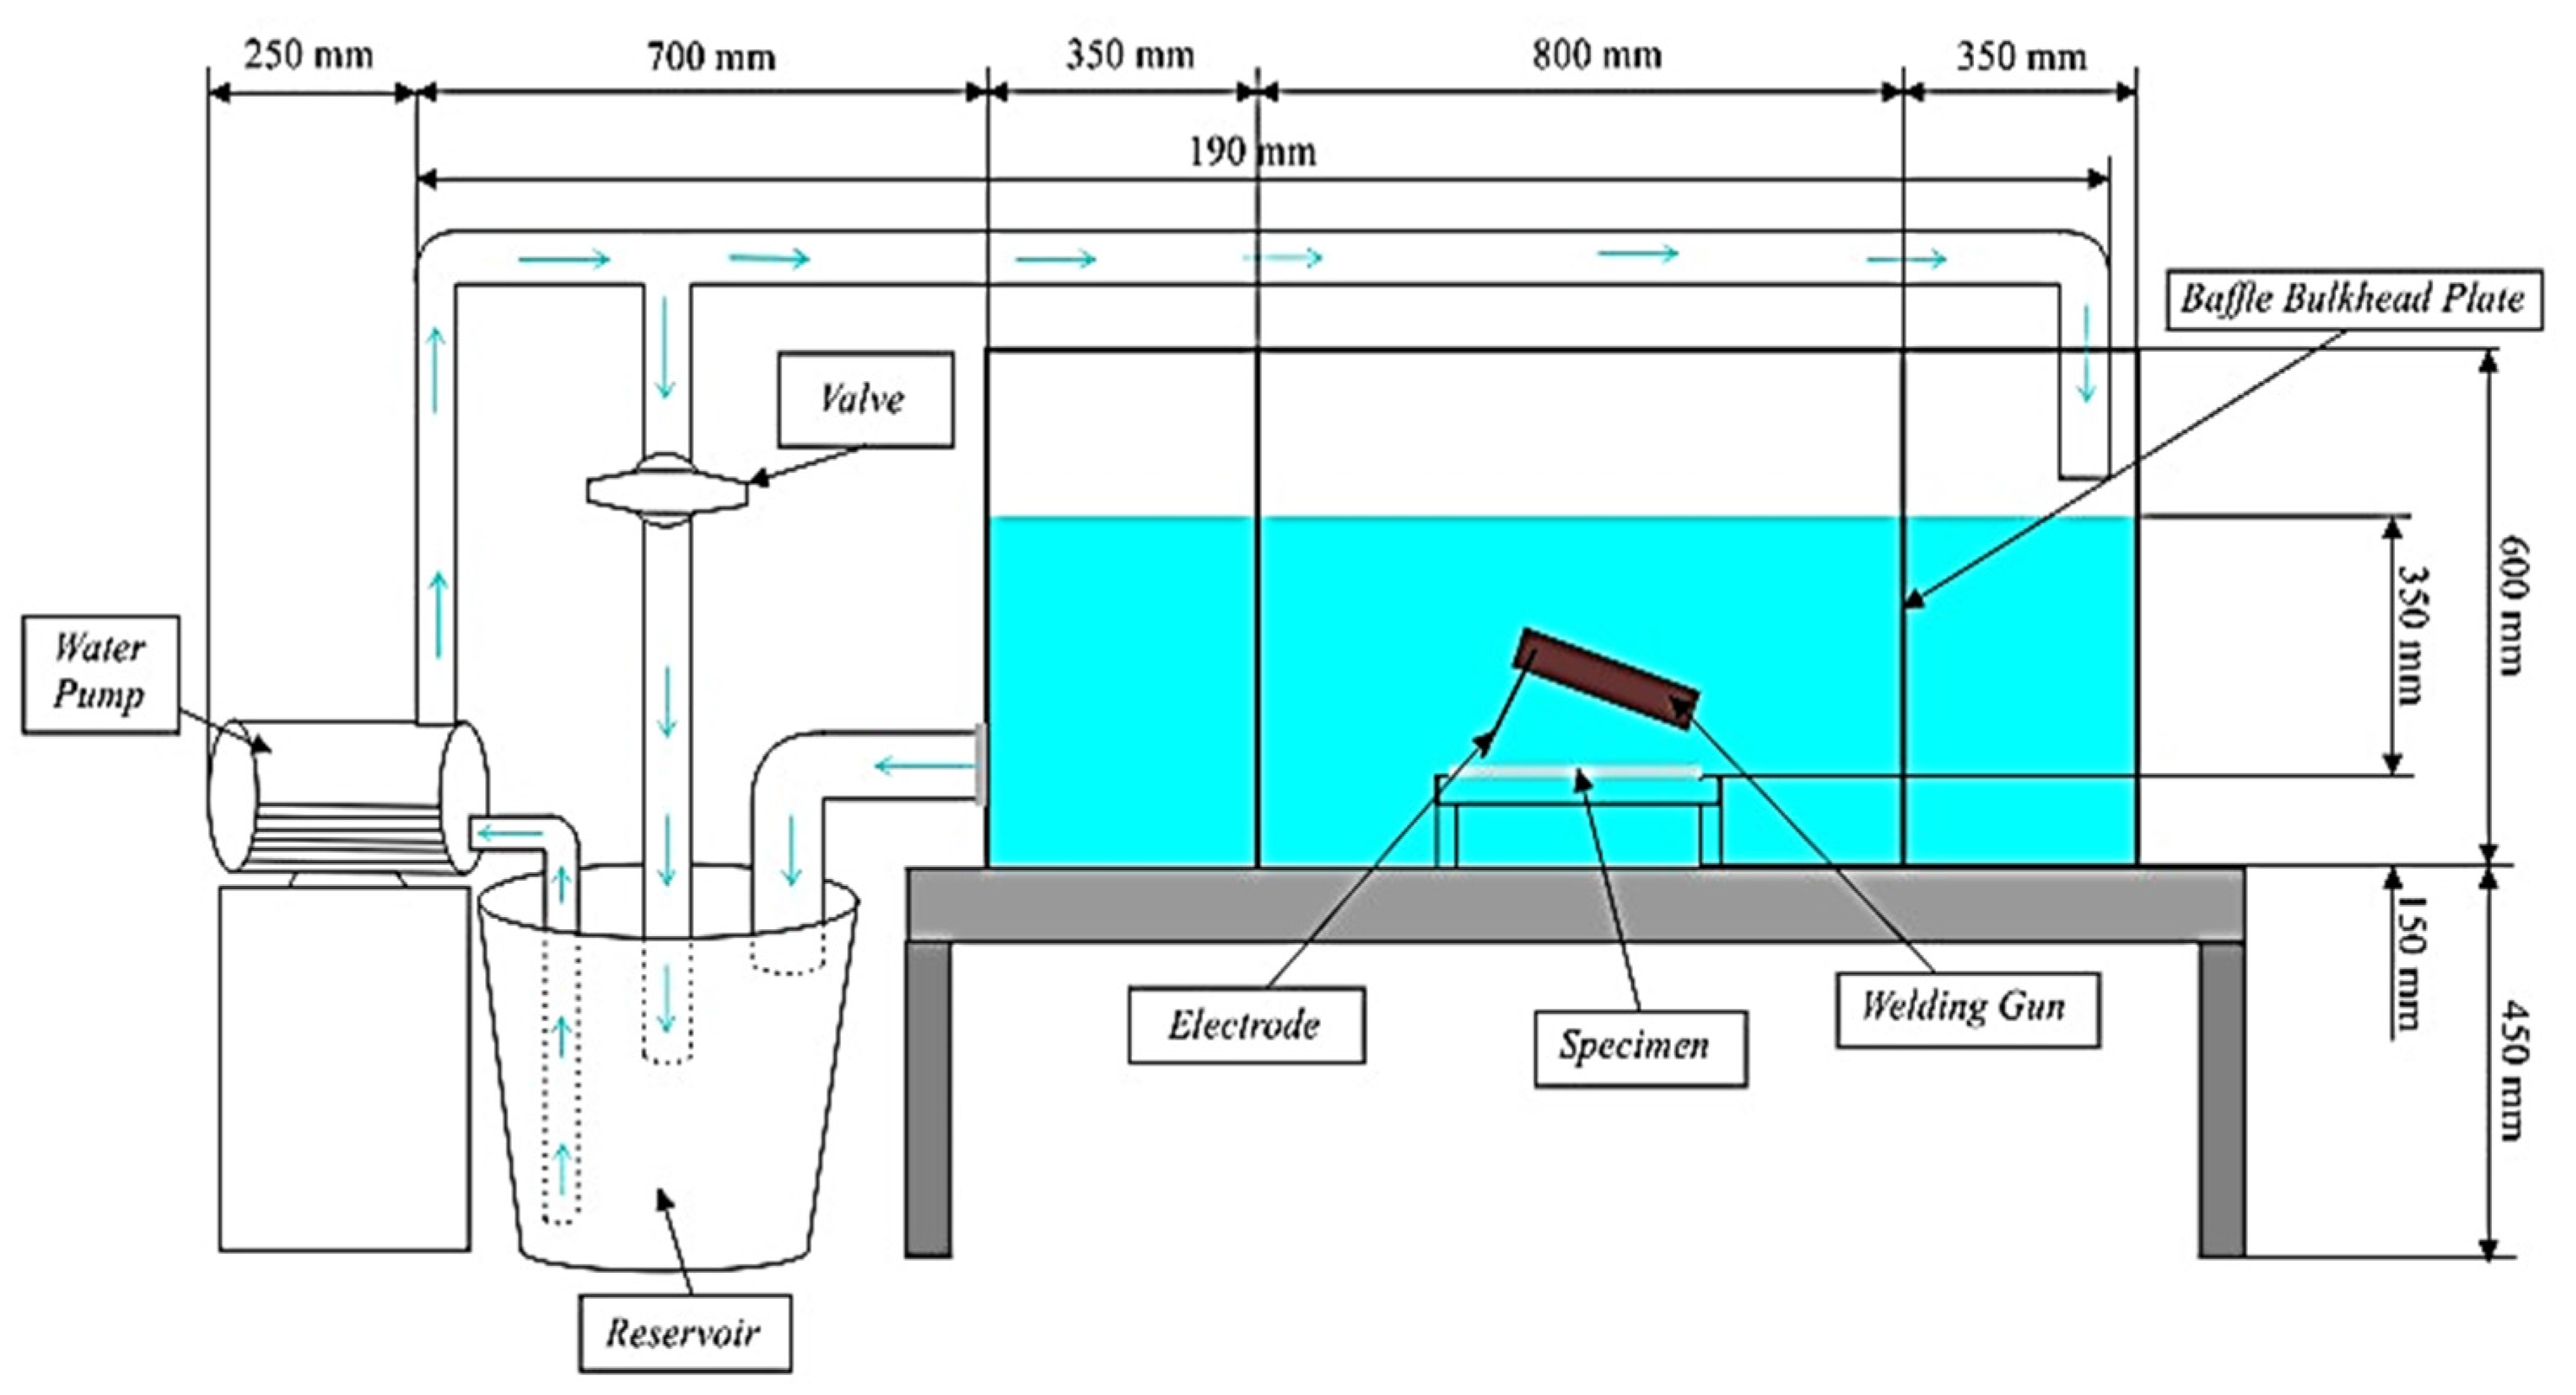
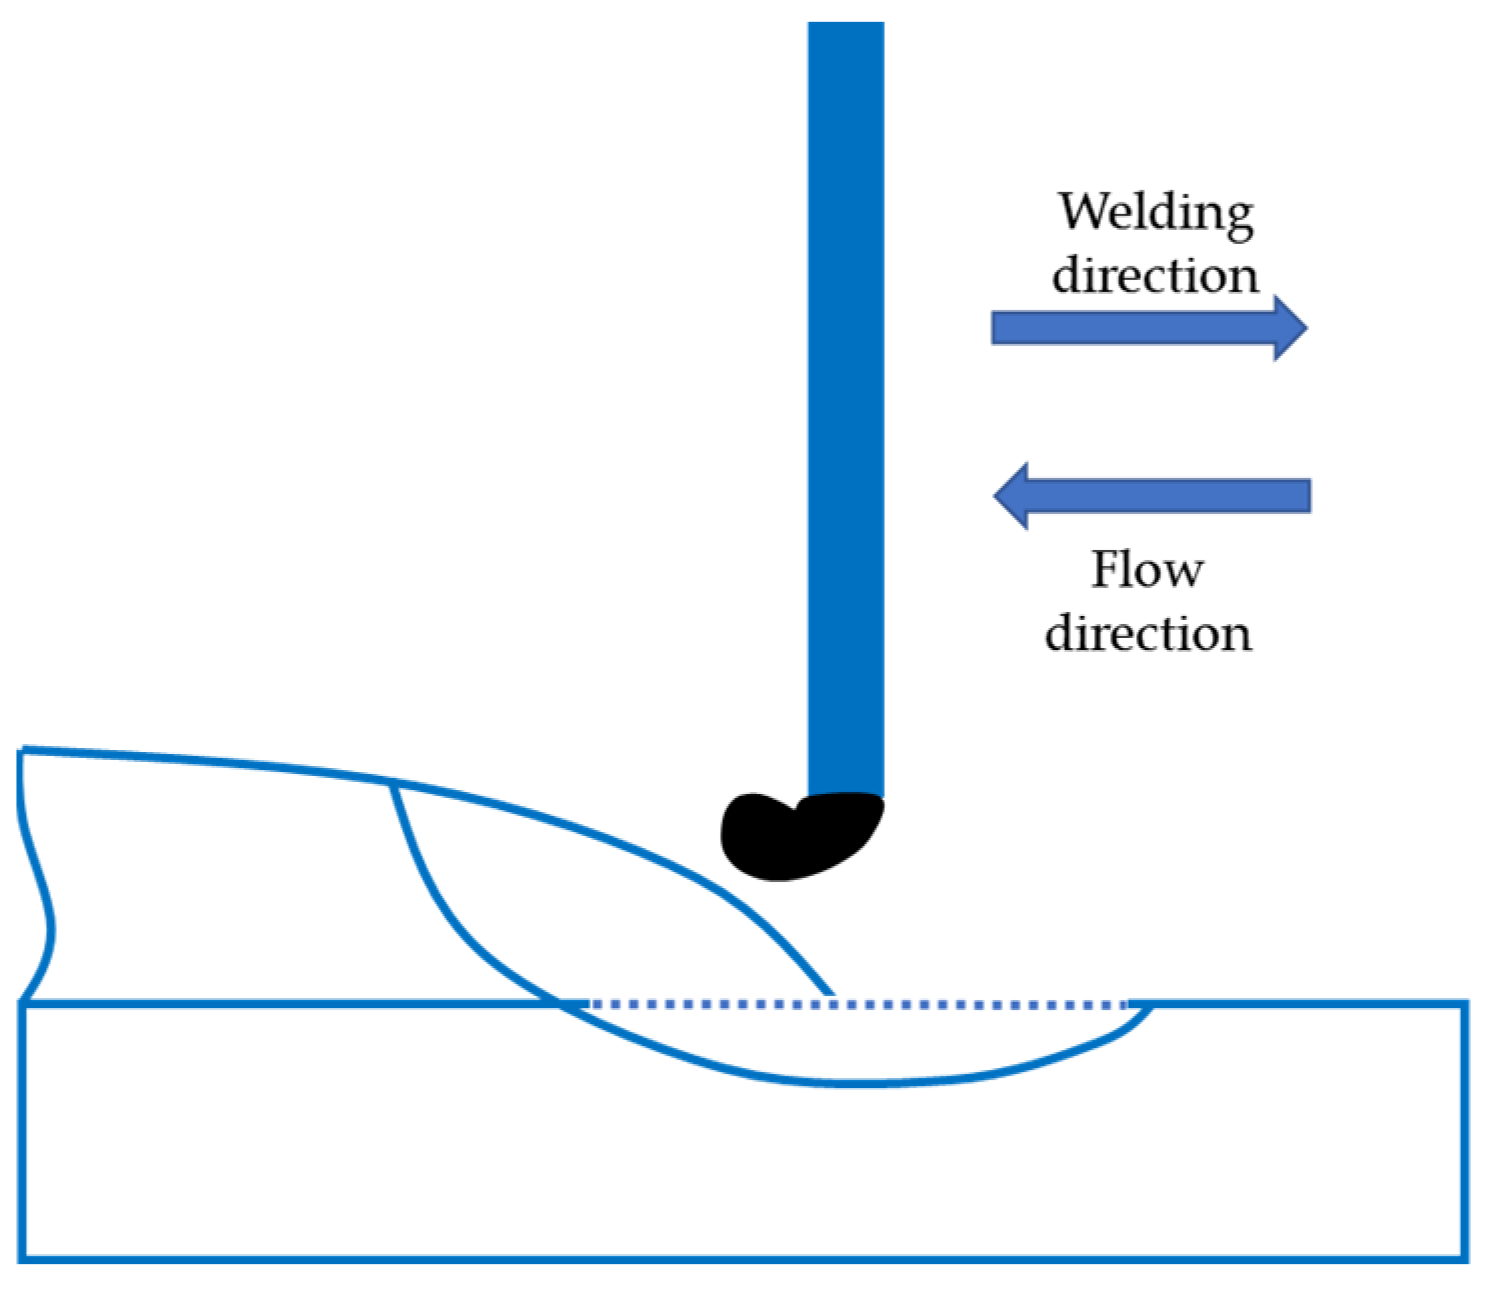
3.3. Welding Process and Water Flow Set-Up
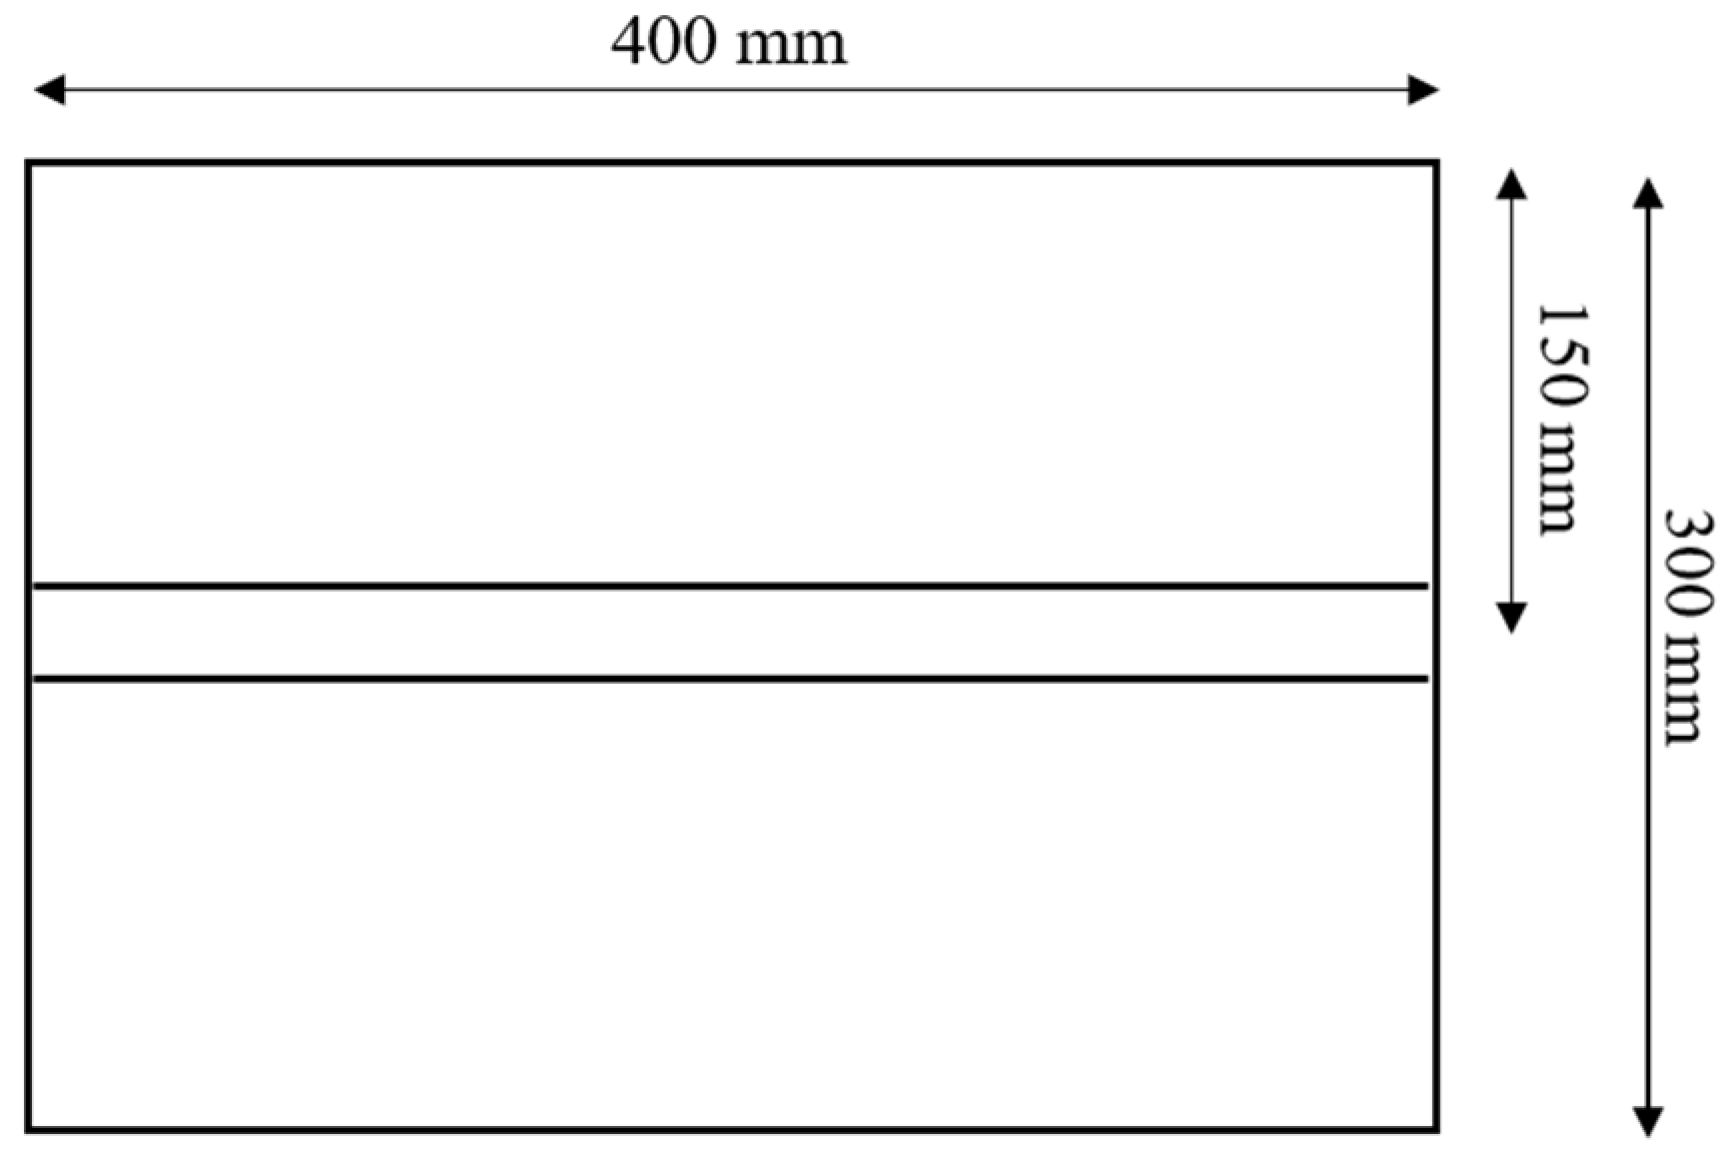
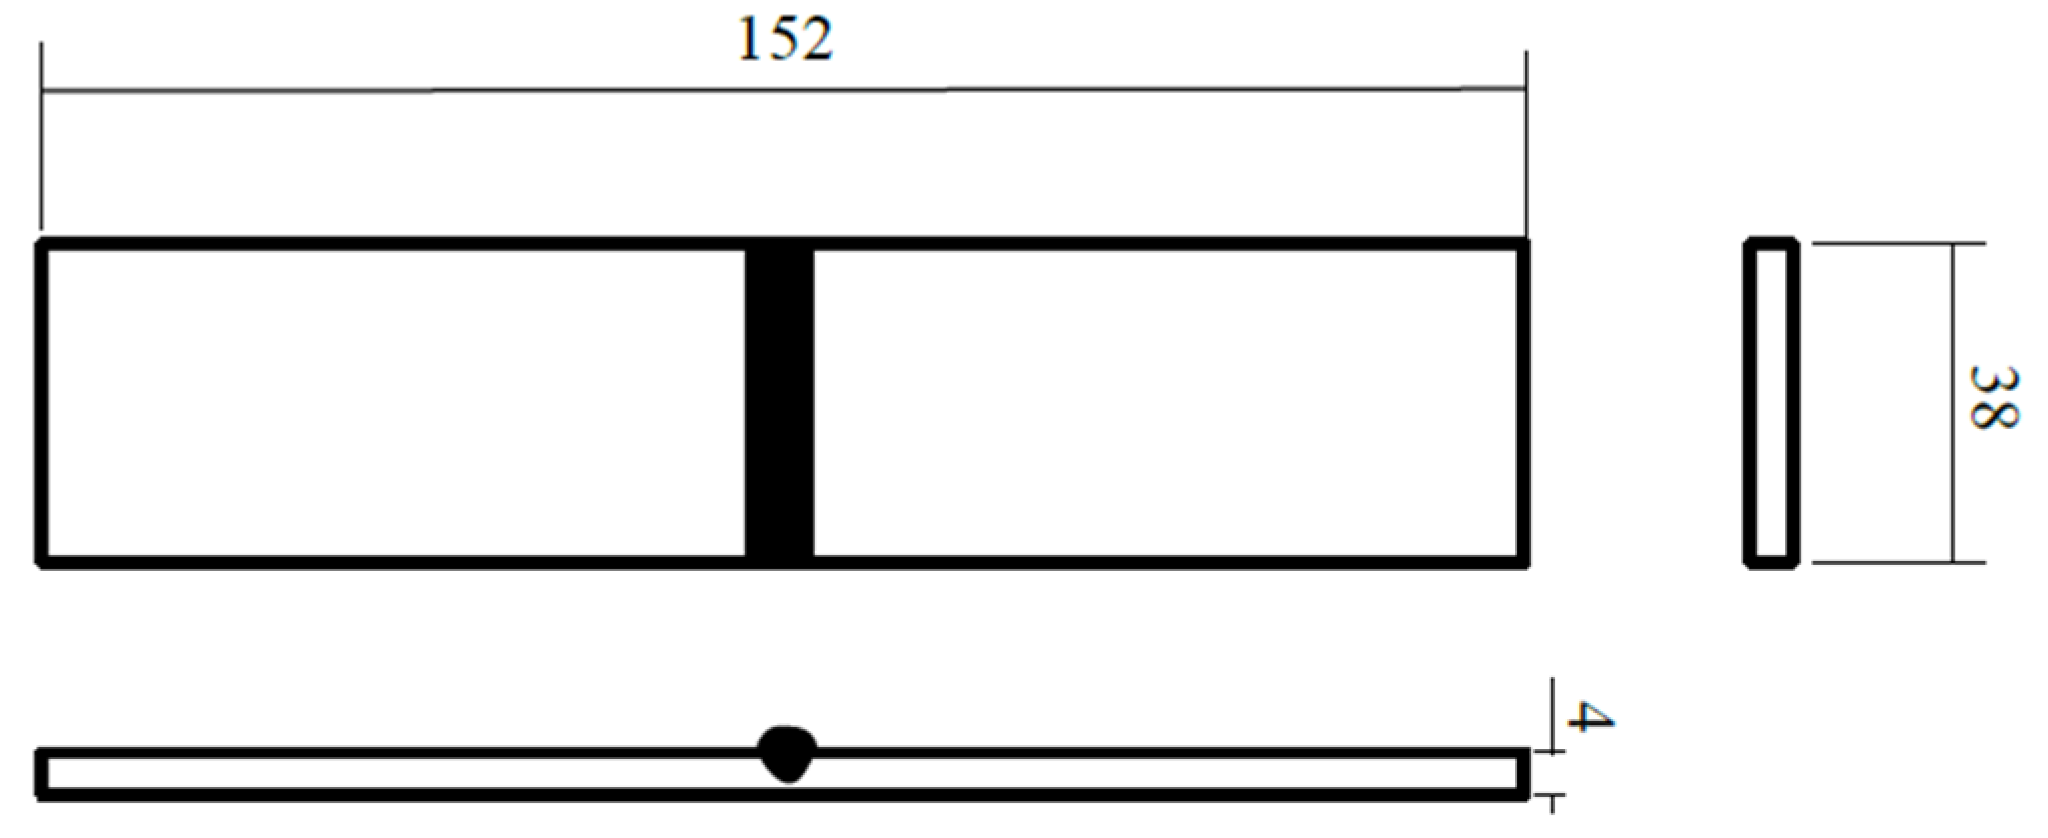
3.4. Specimen Manufacturing and Testing Procedures
4. Results and Discussion
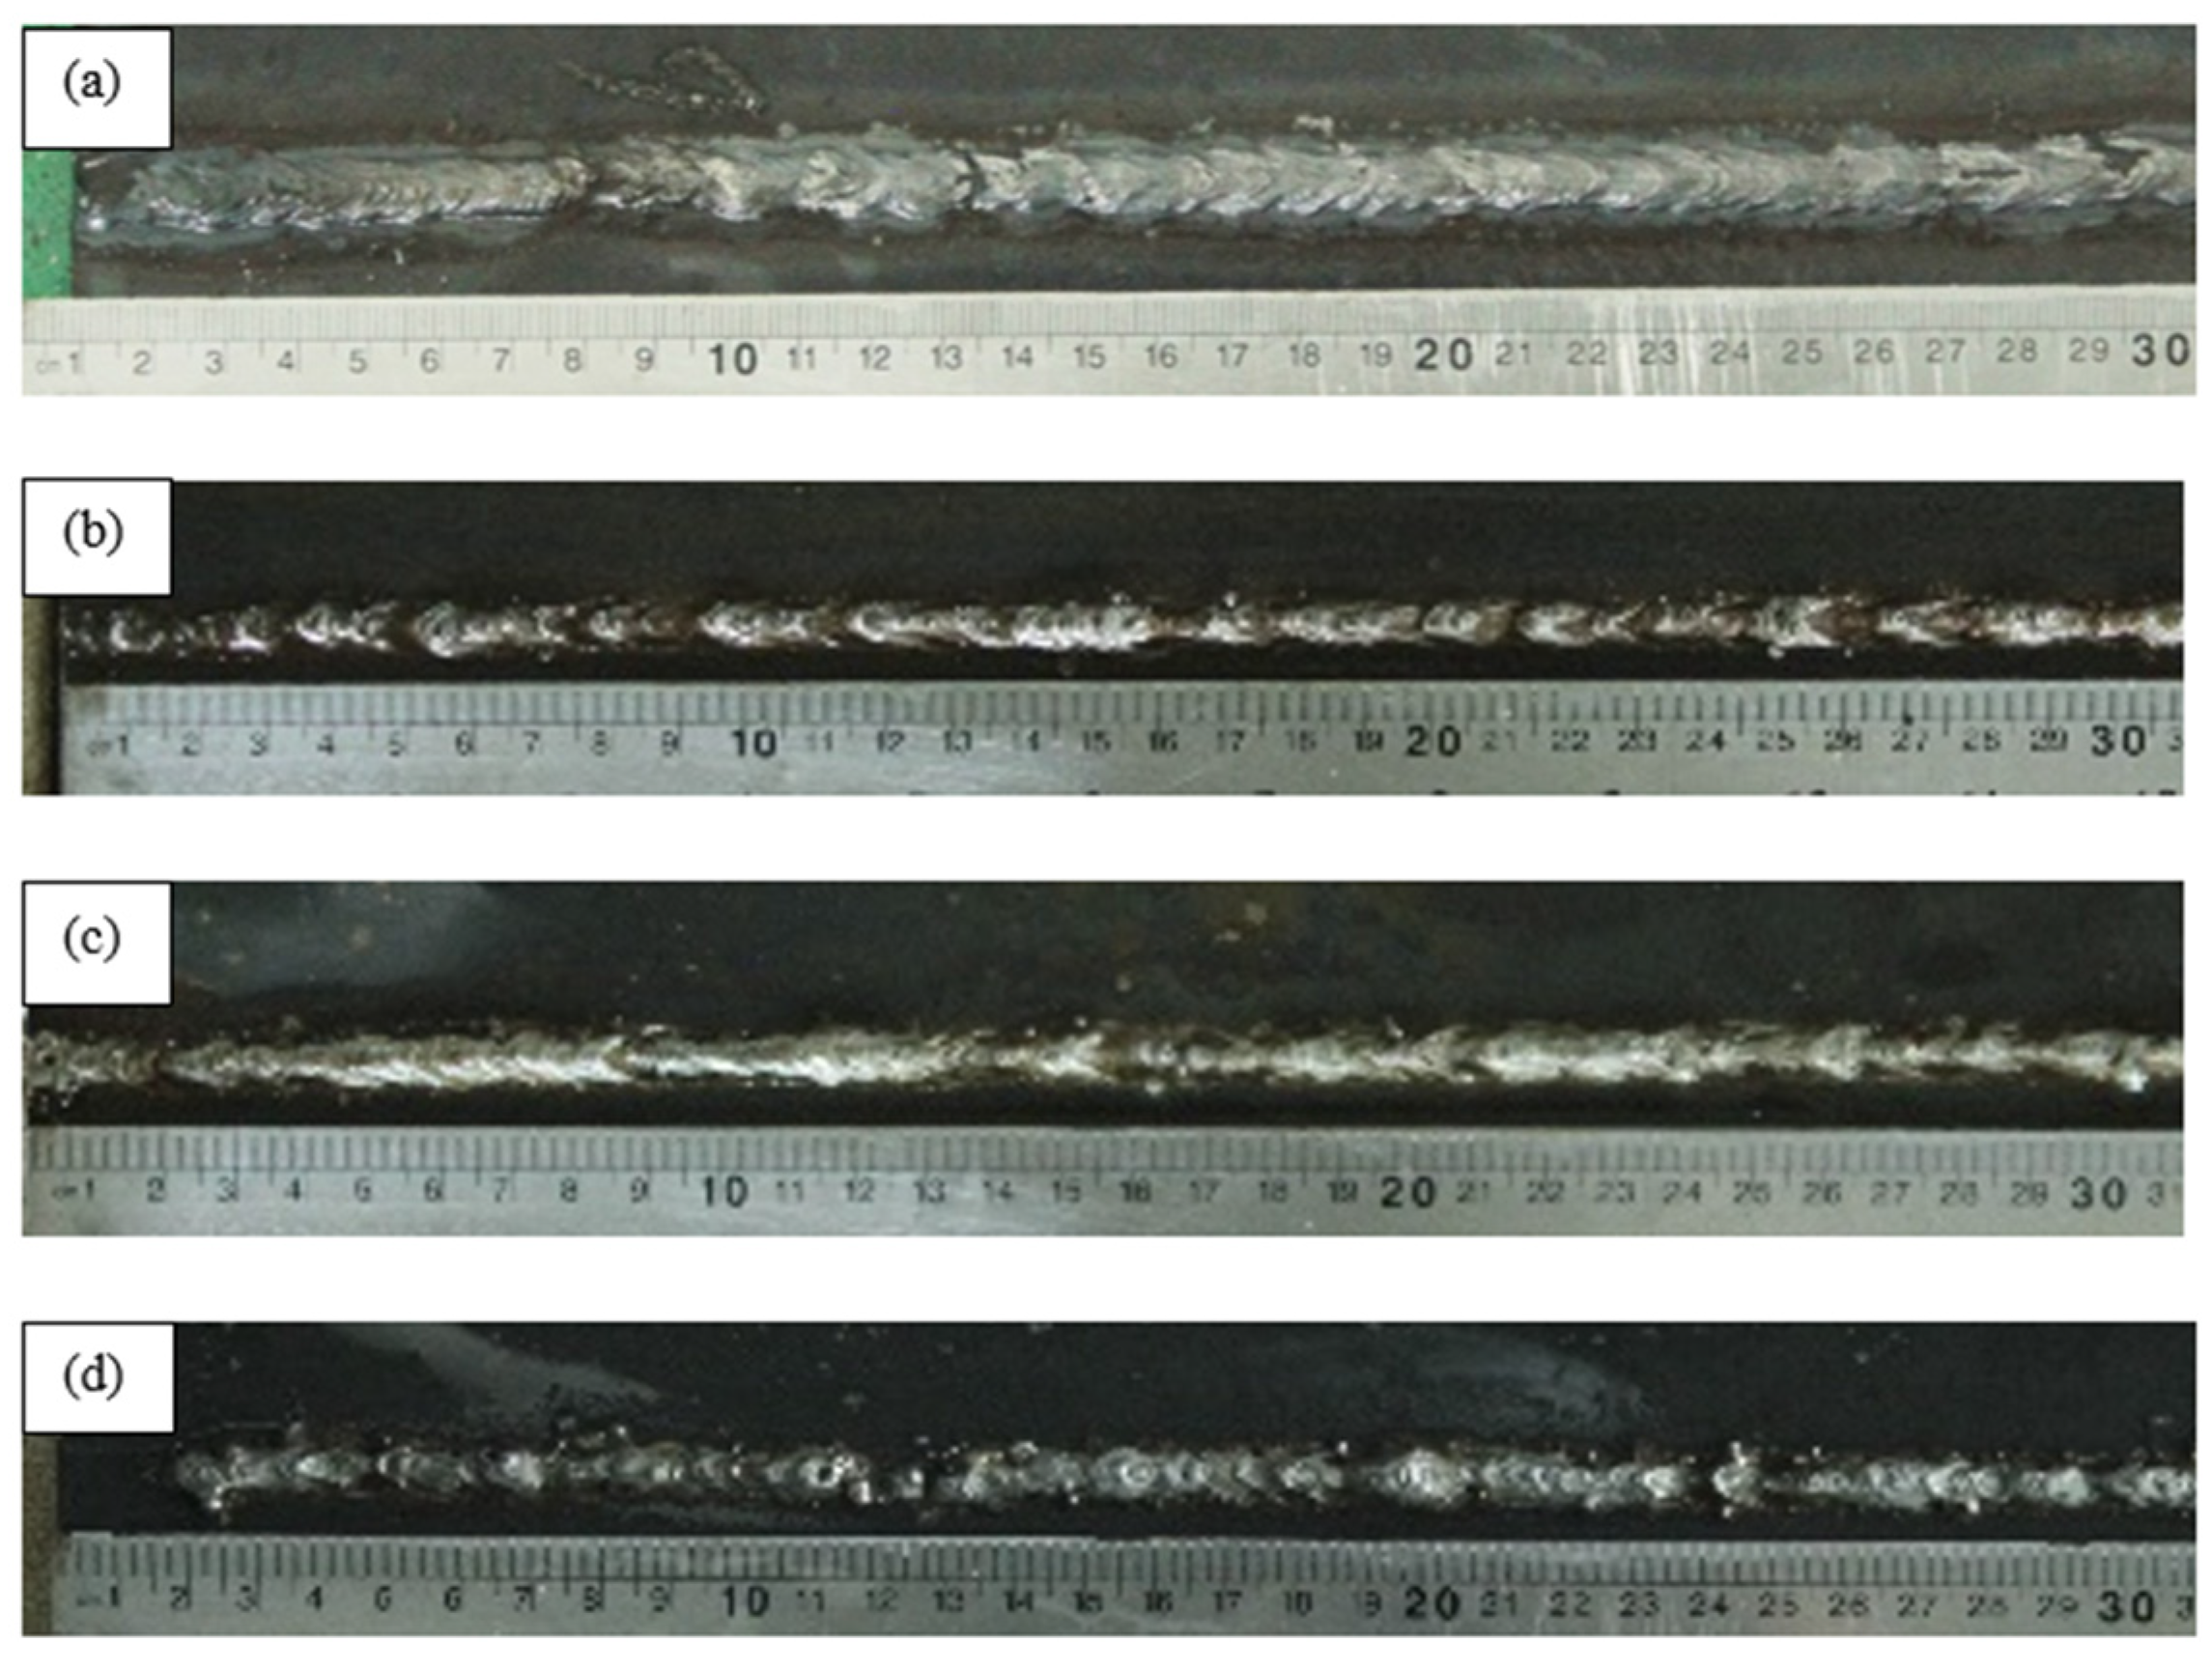
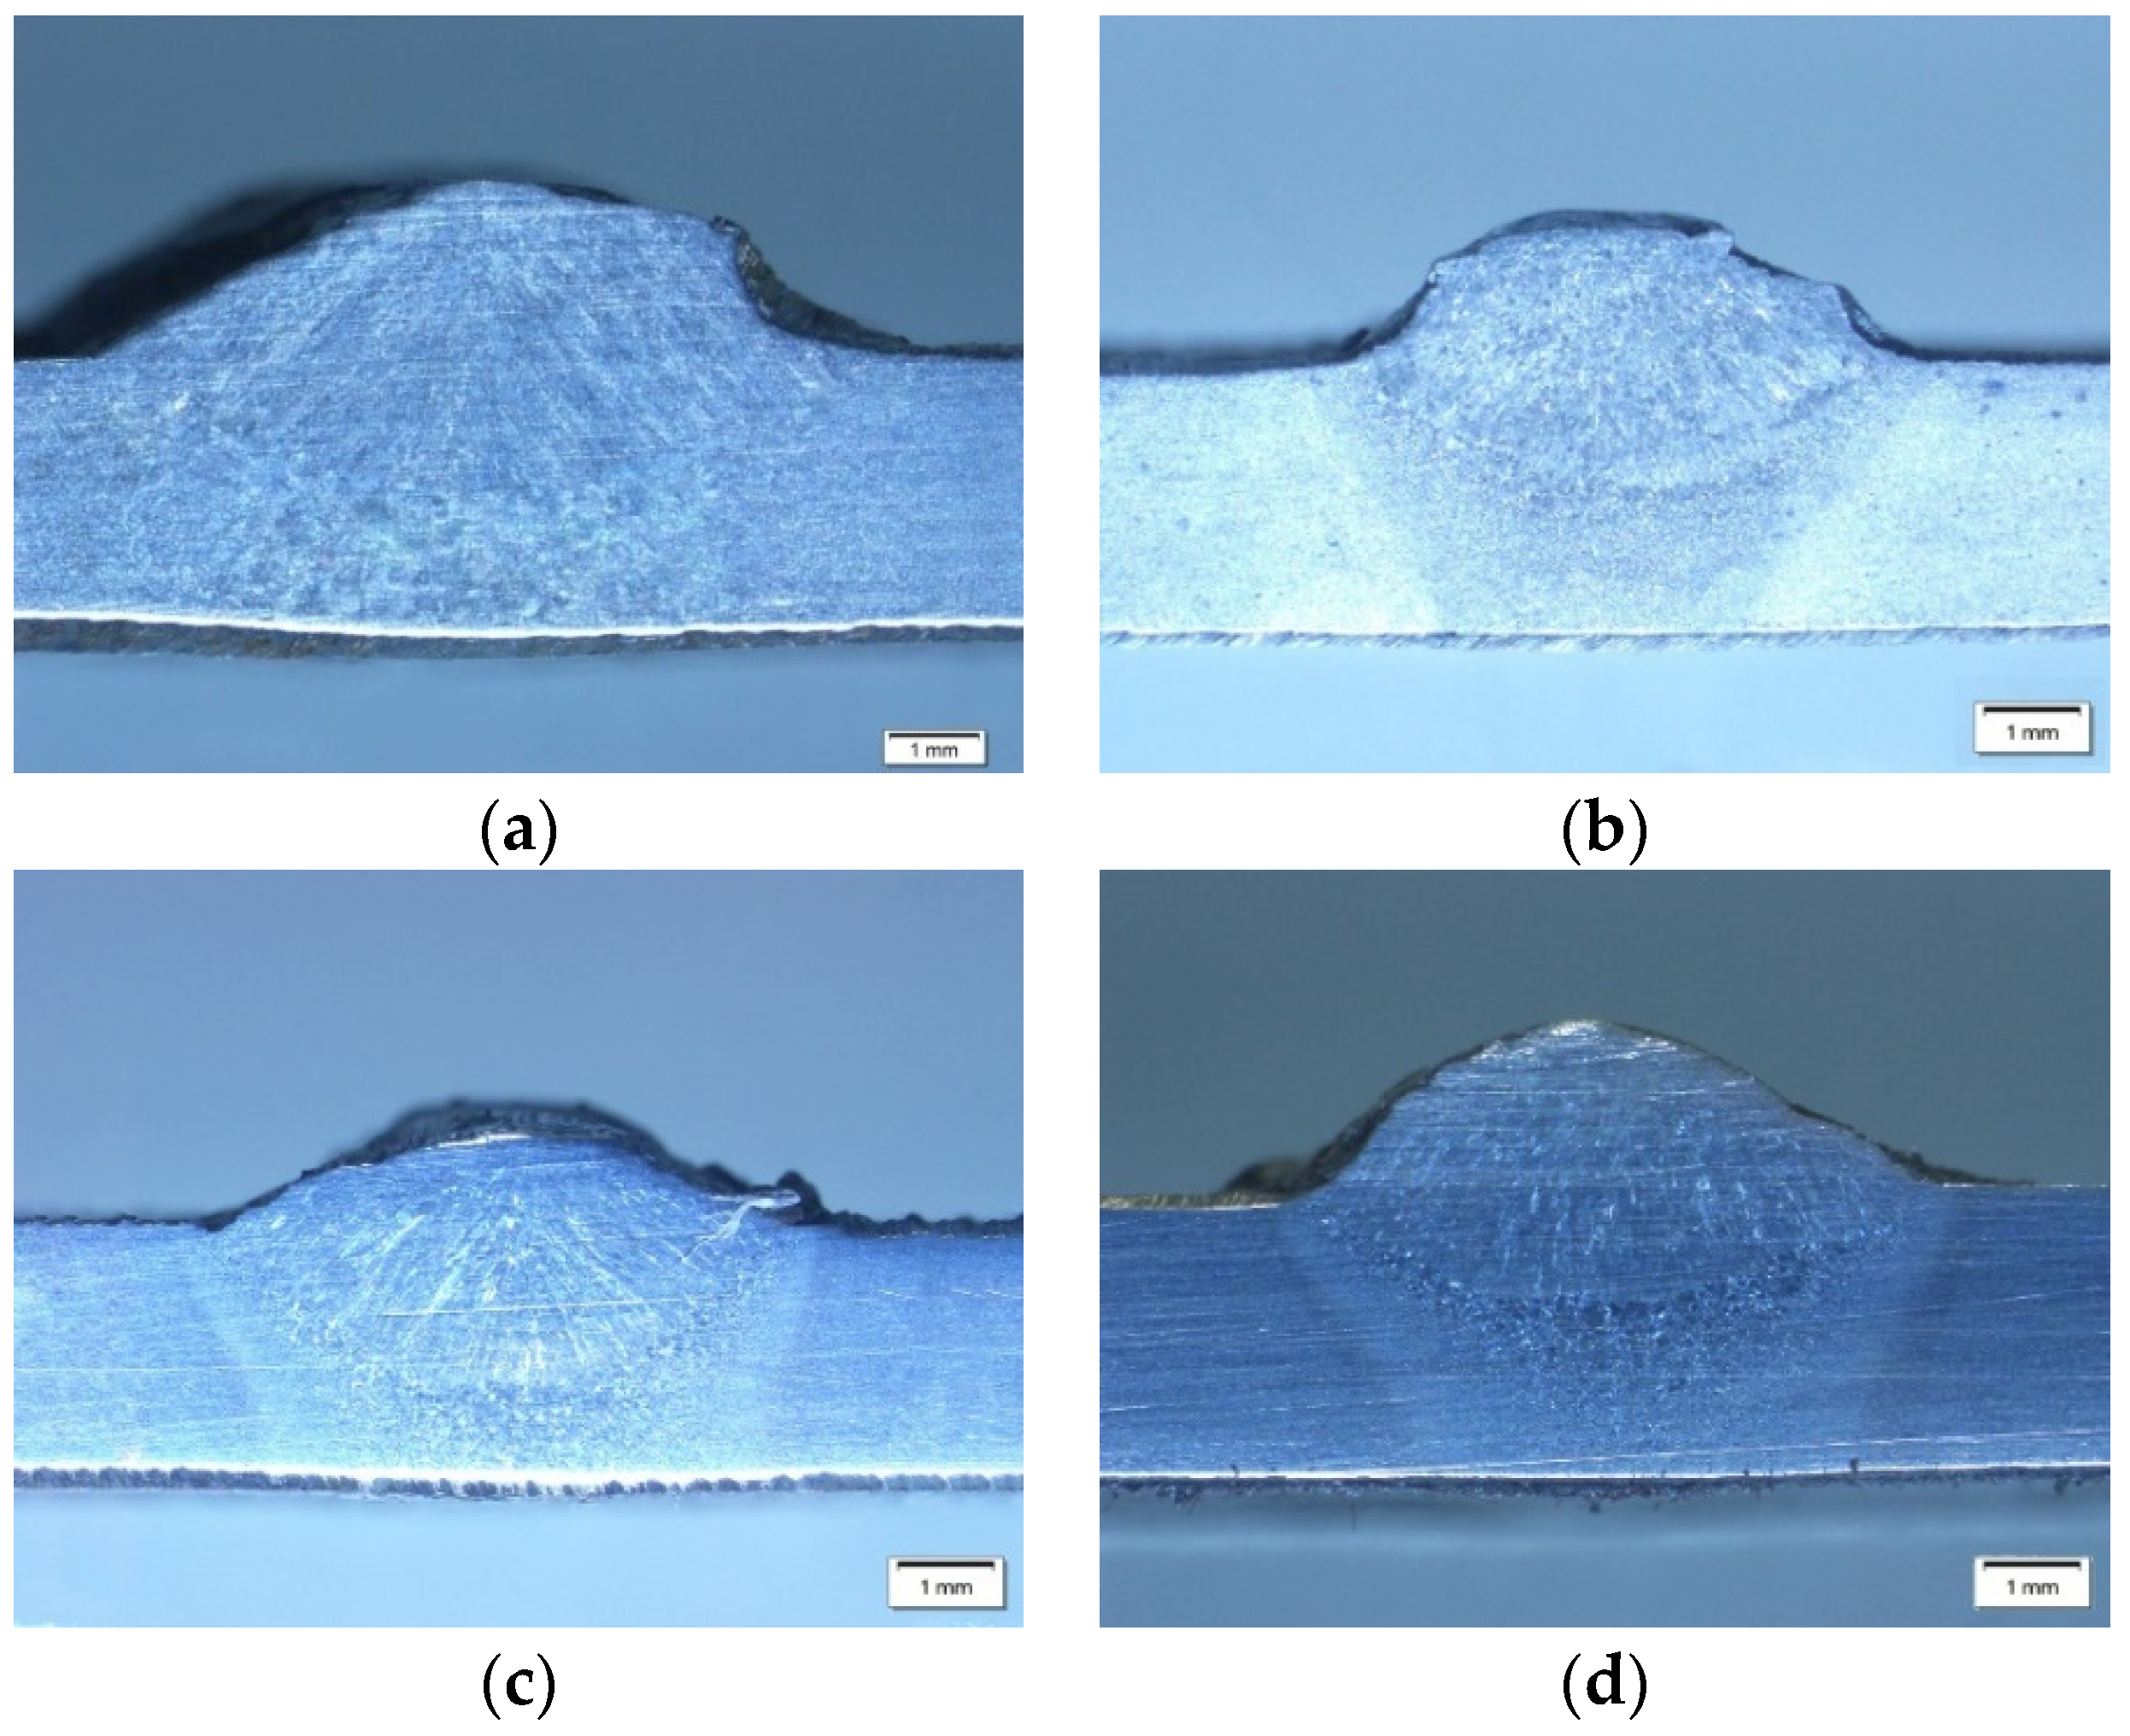
4.1. Observation of the Welding Defect
4.1.1. Defect Identification
4.1.2. Data Observation of Macrography
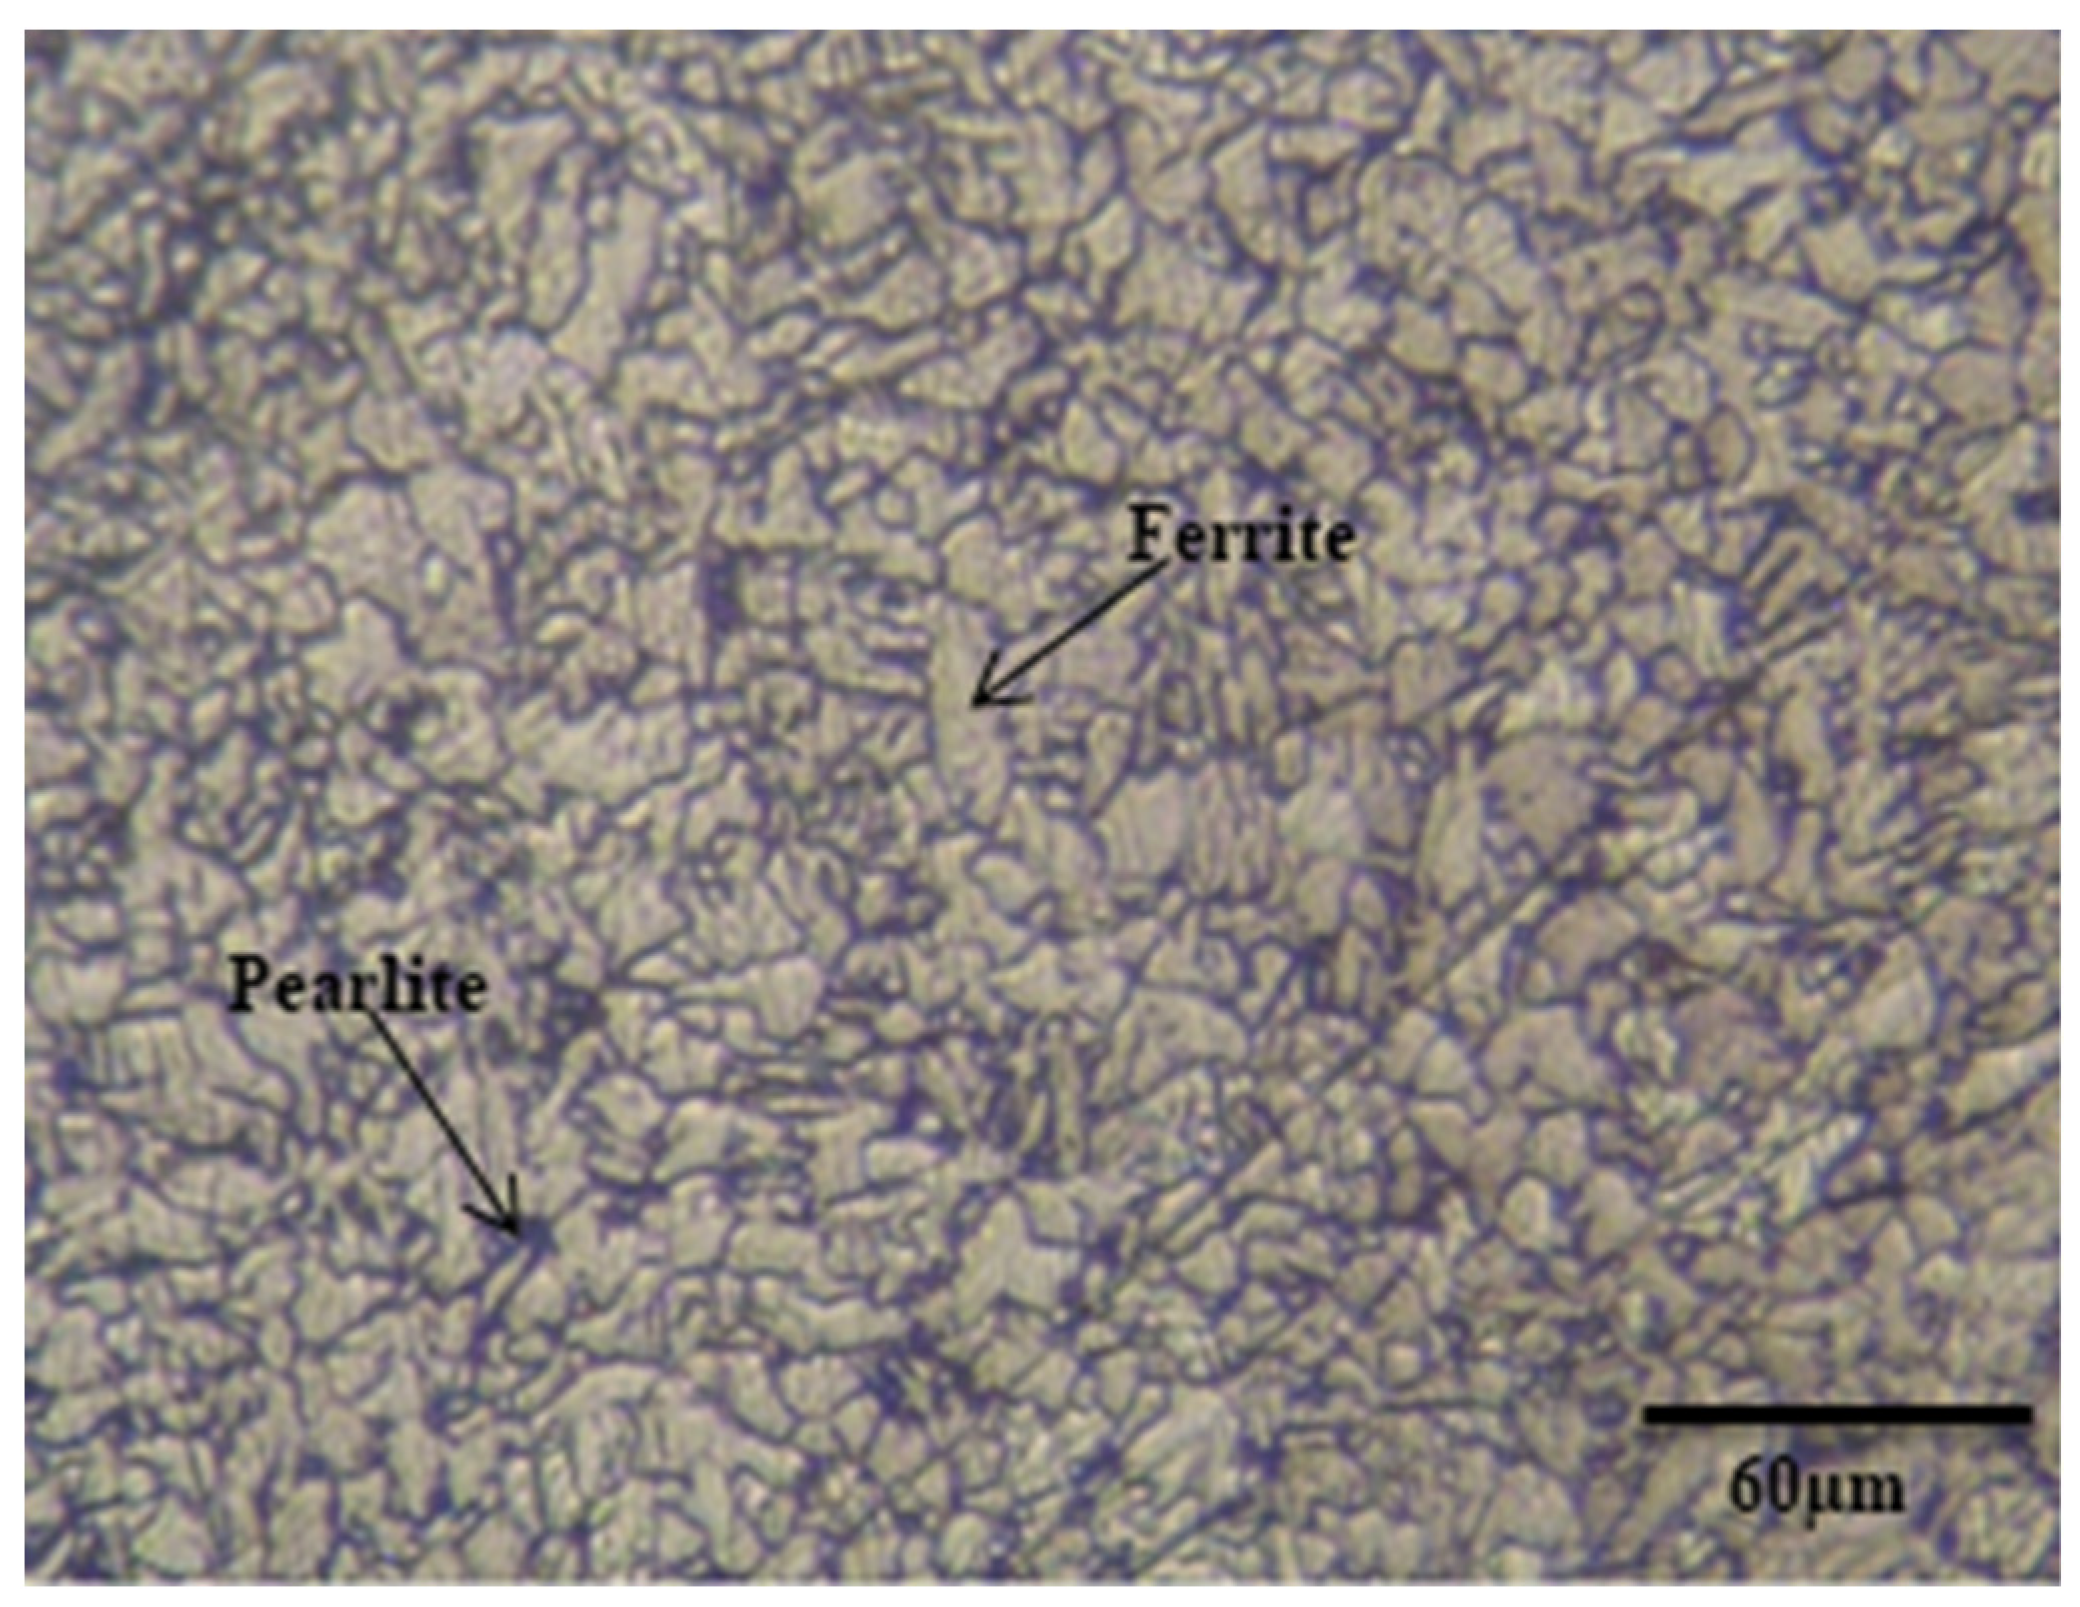
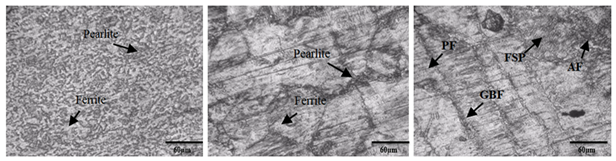
4.1.3. Data Observation of Micrography
4.2. Mechanical Properties
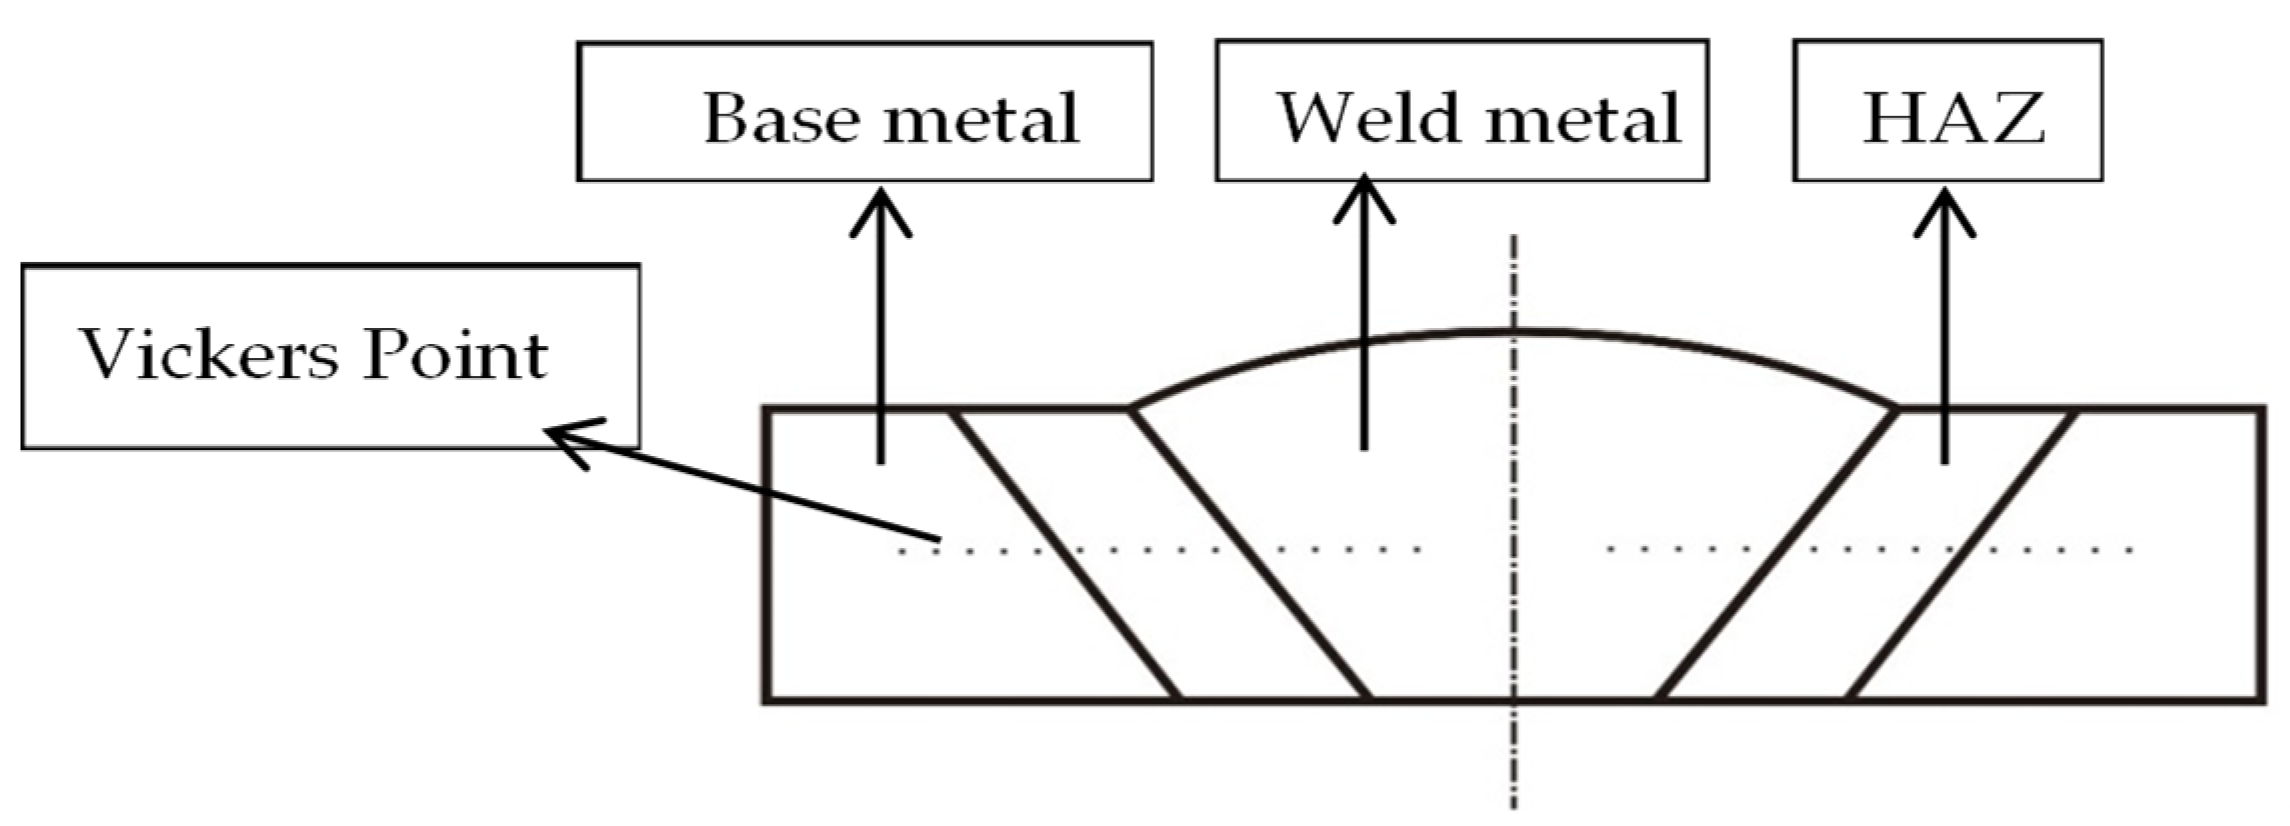
4.2.1. Hardness Testing
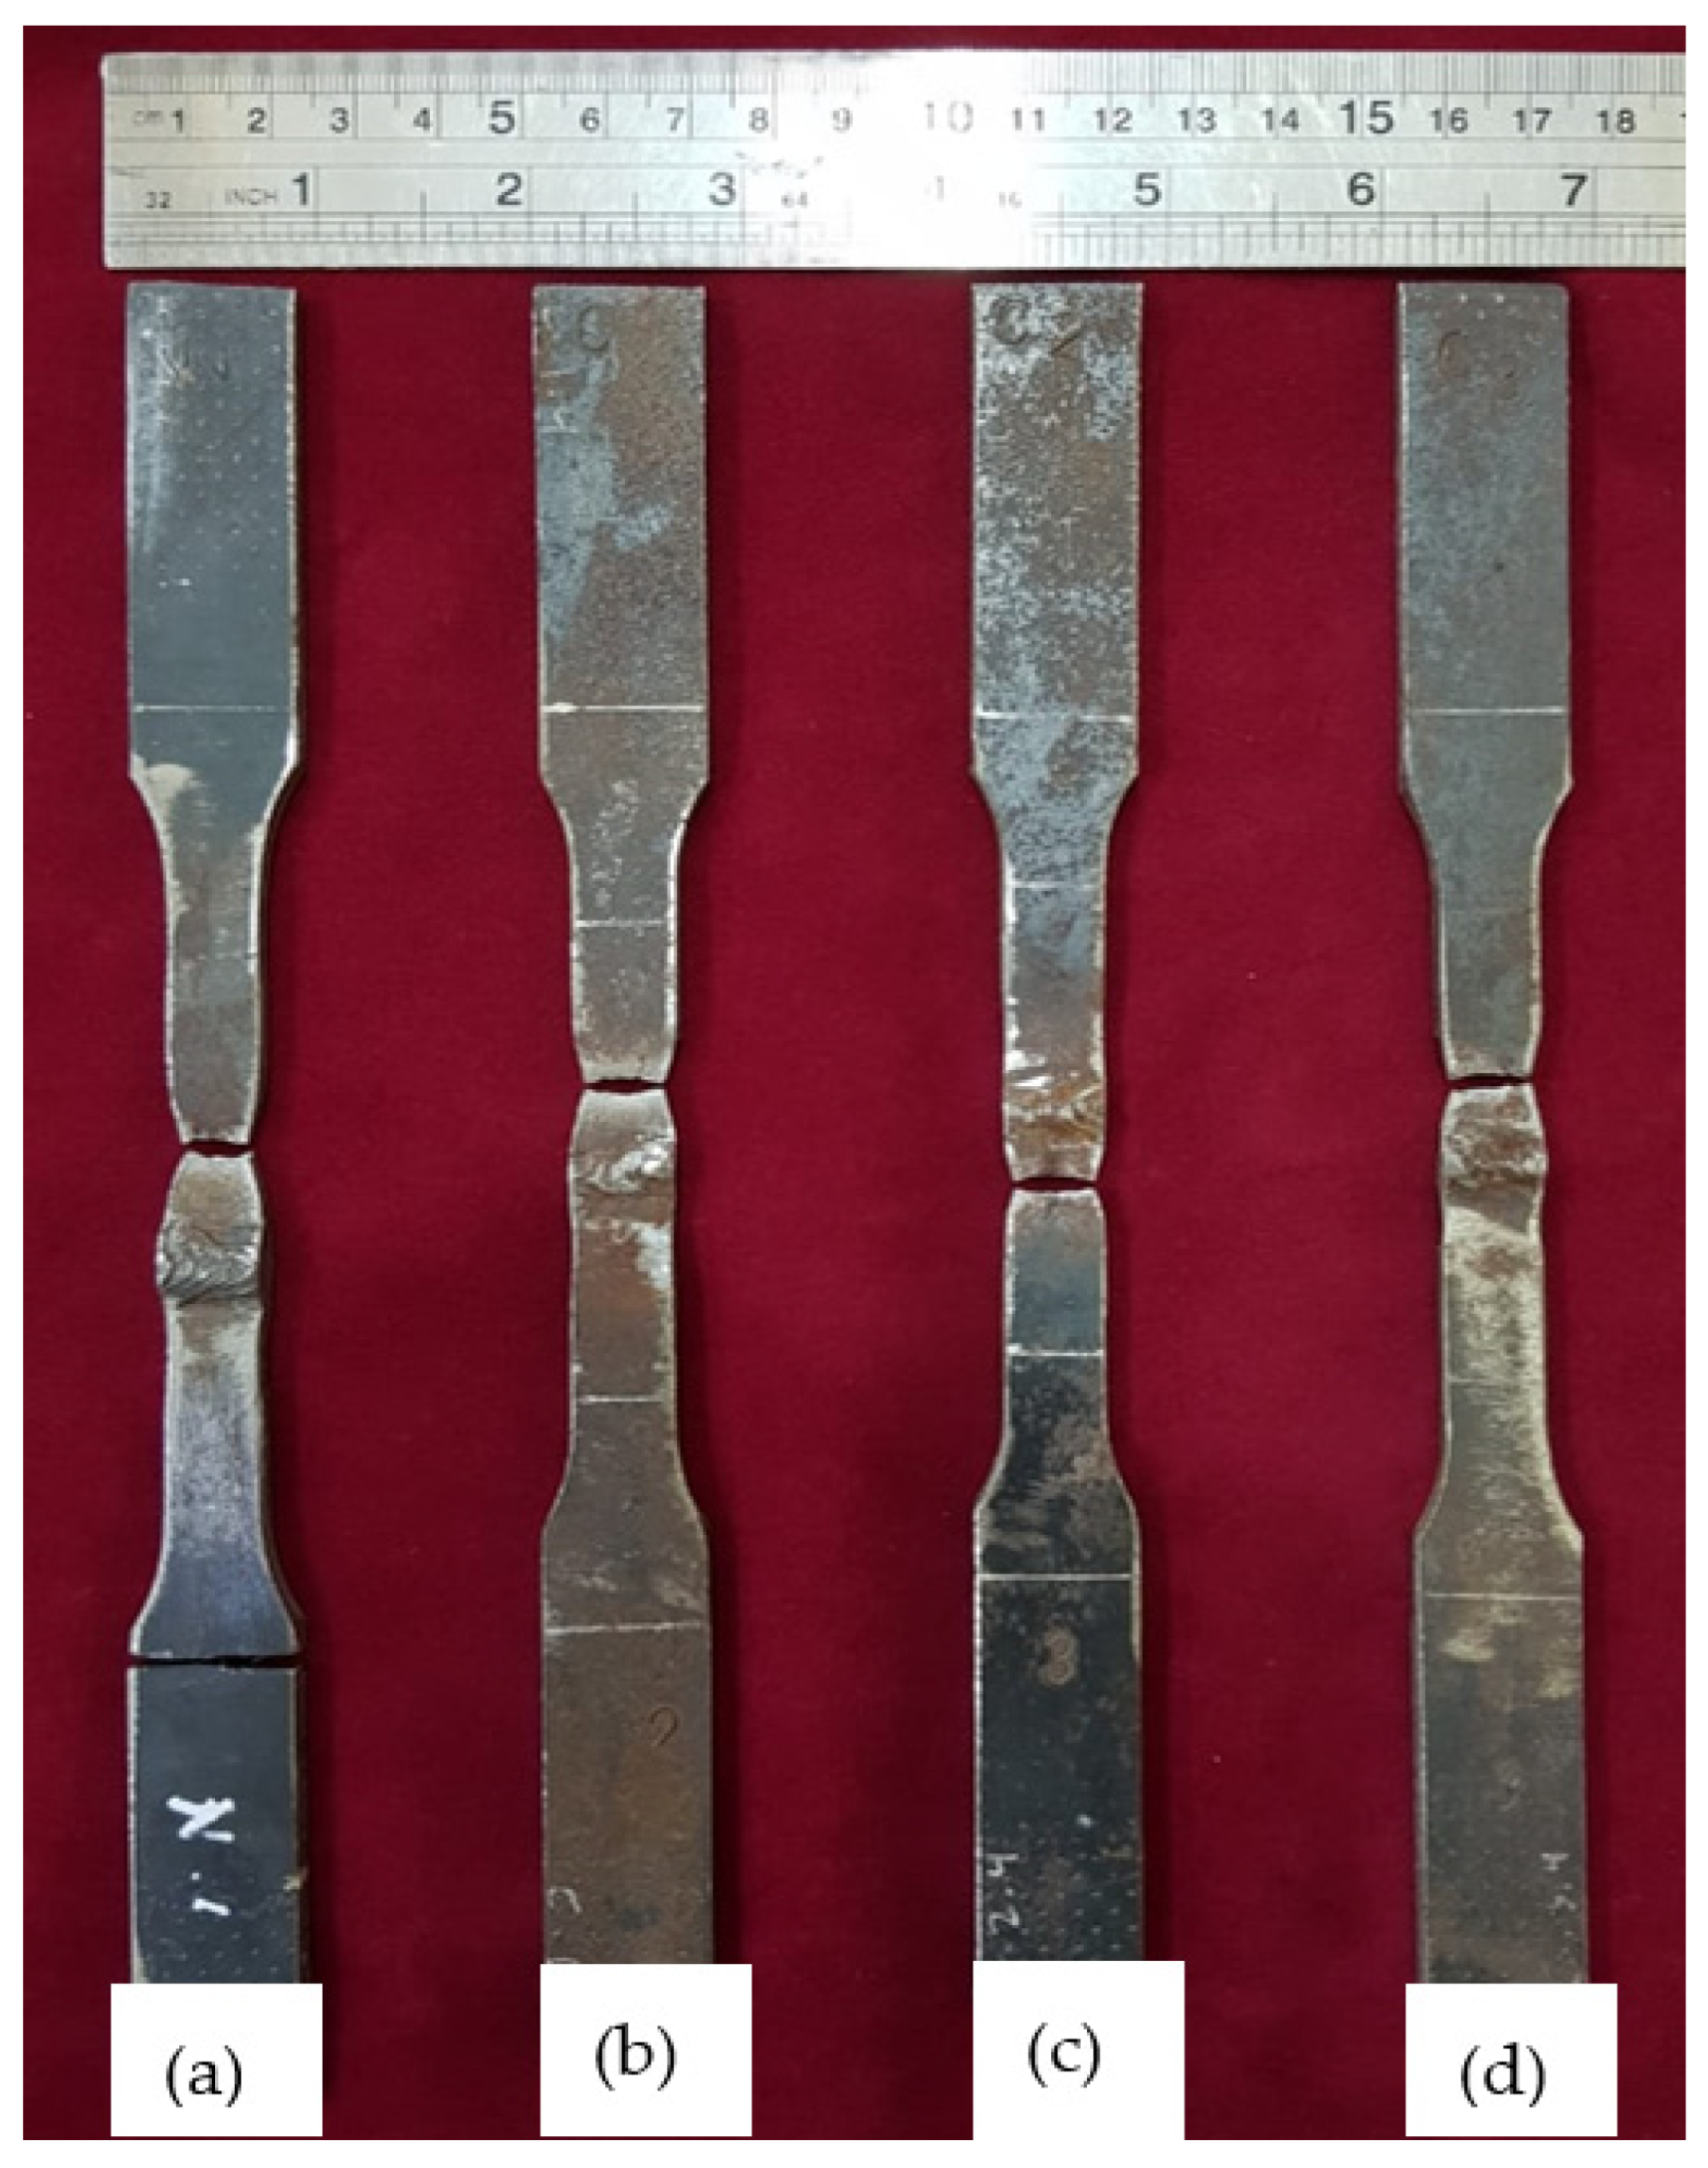
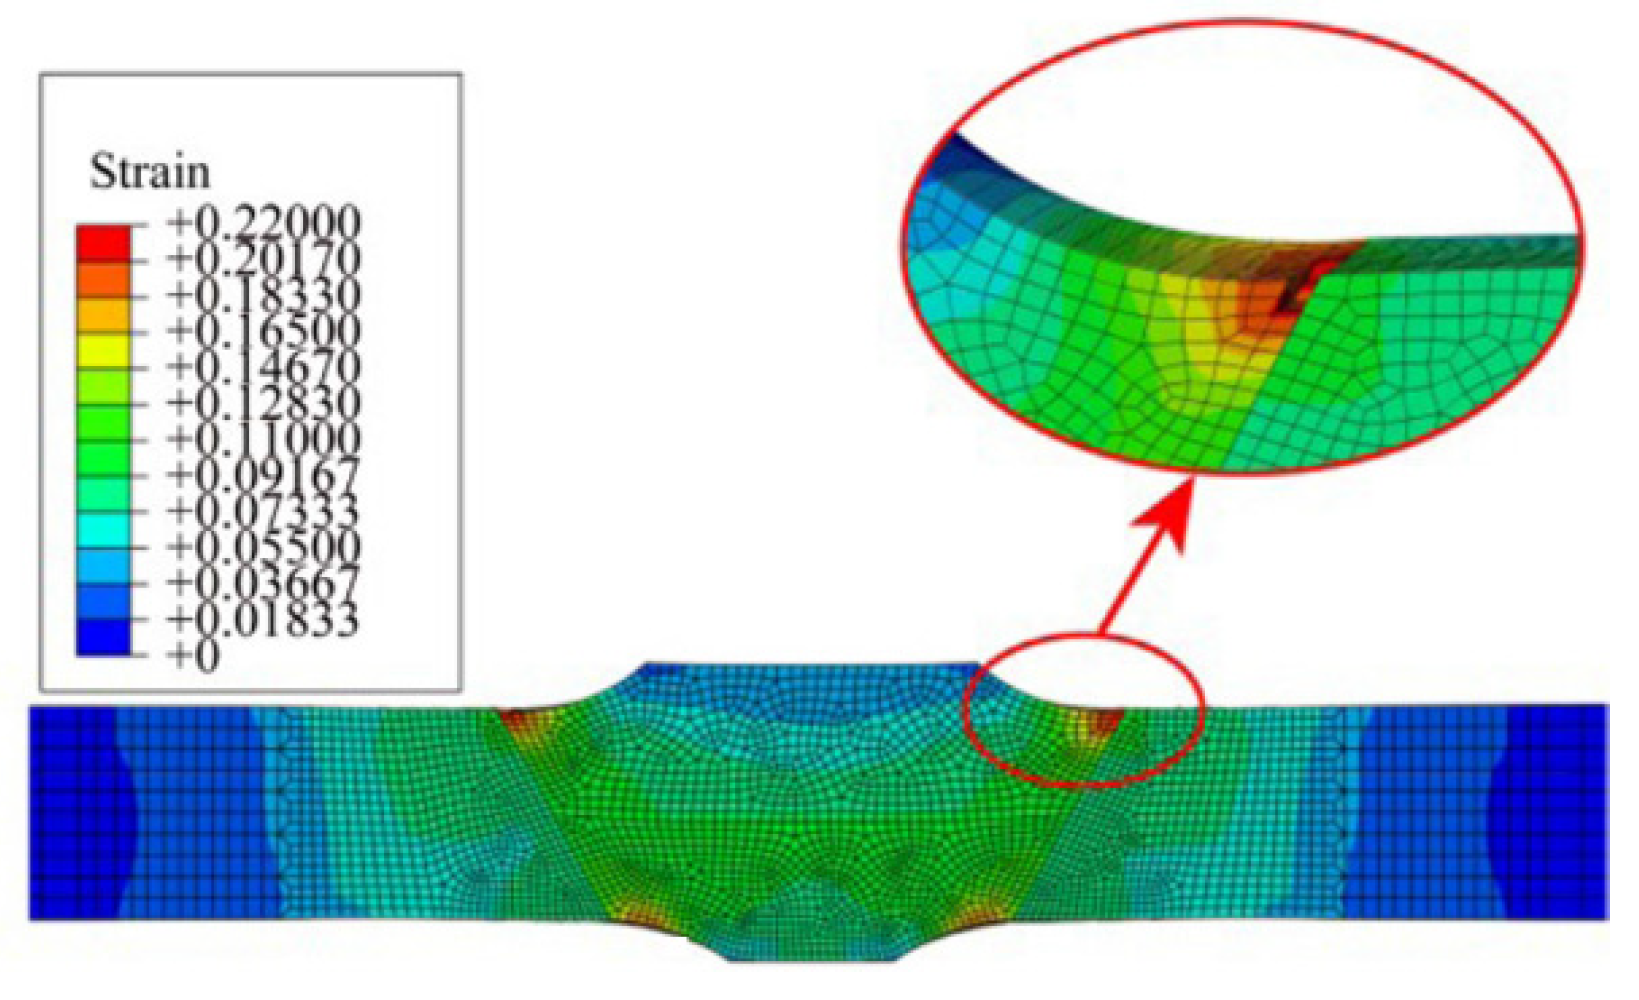
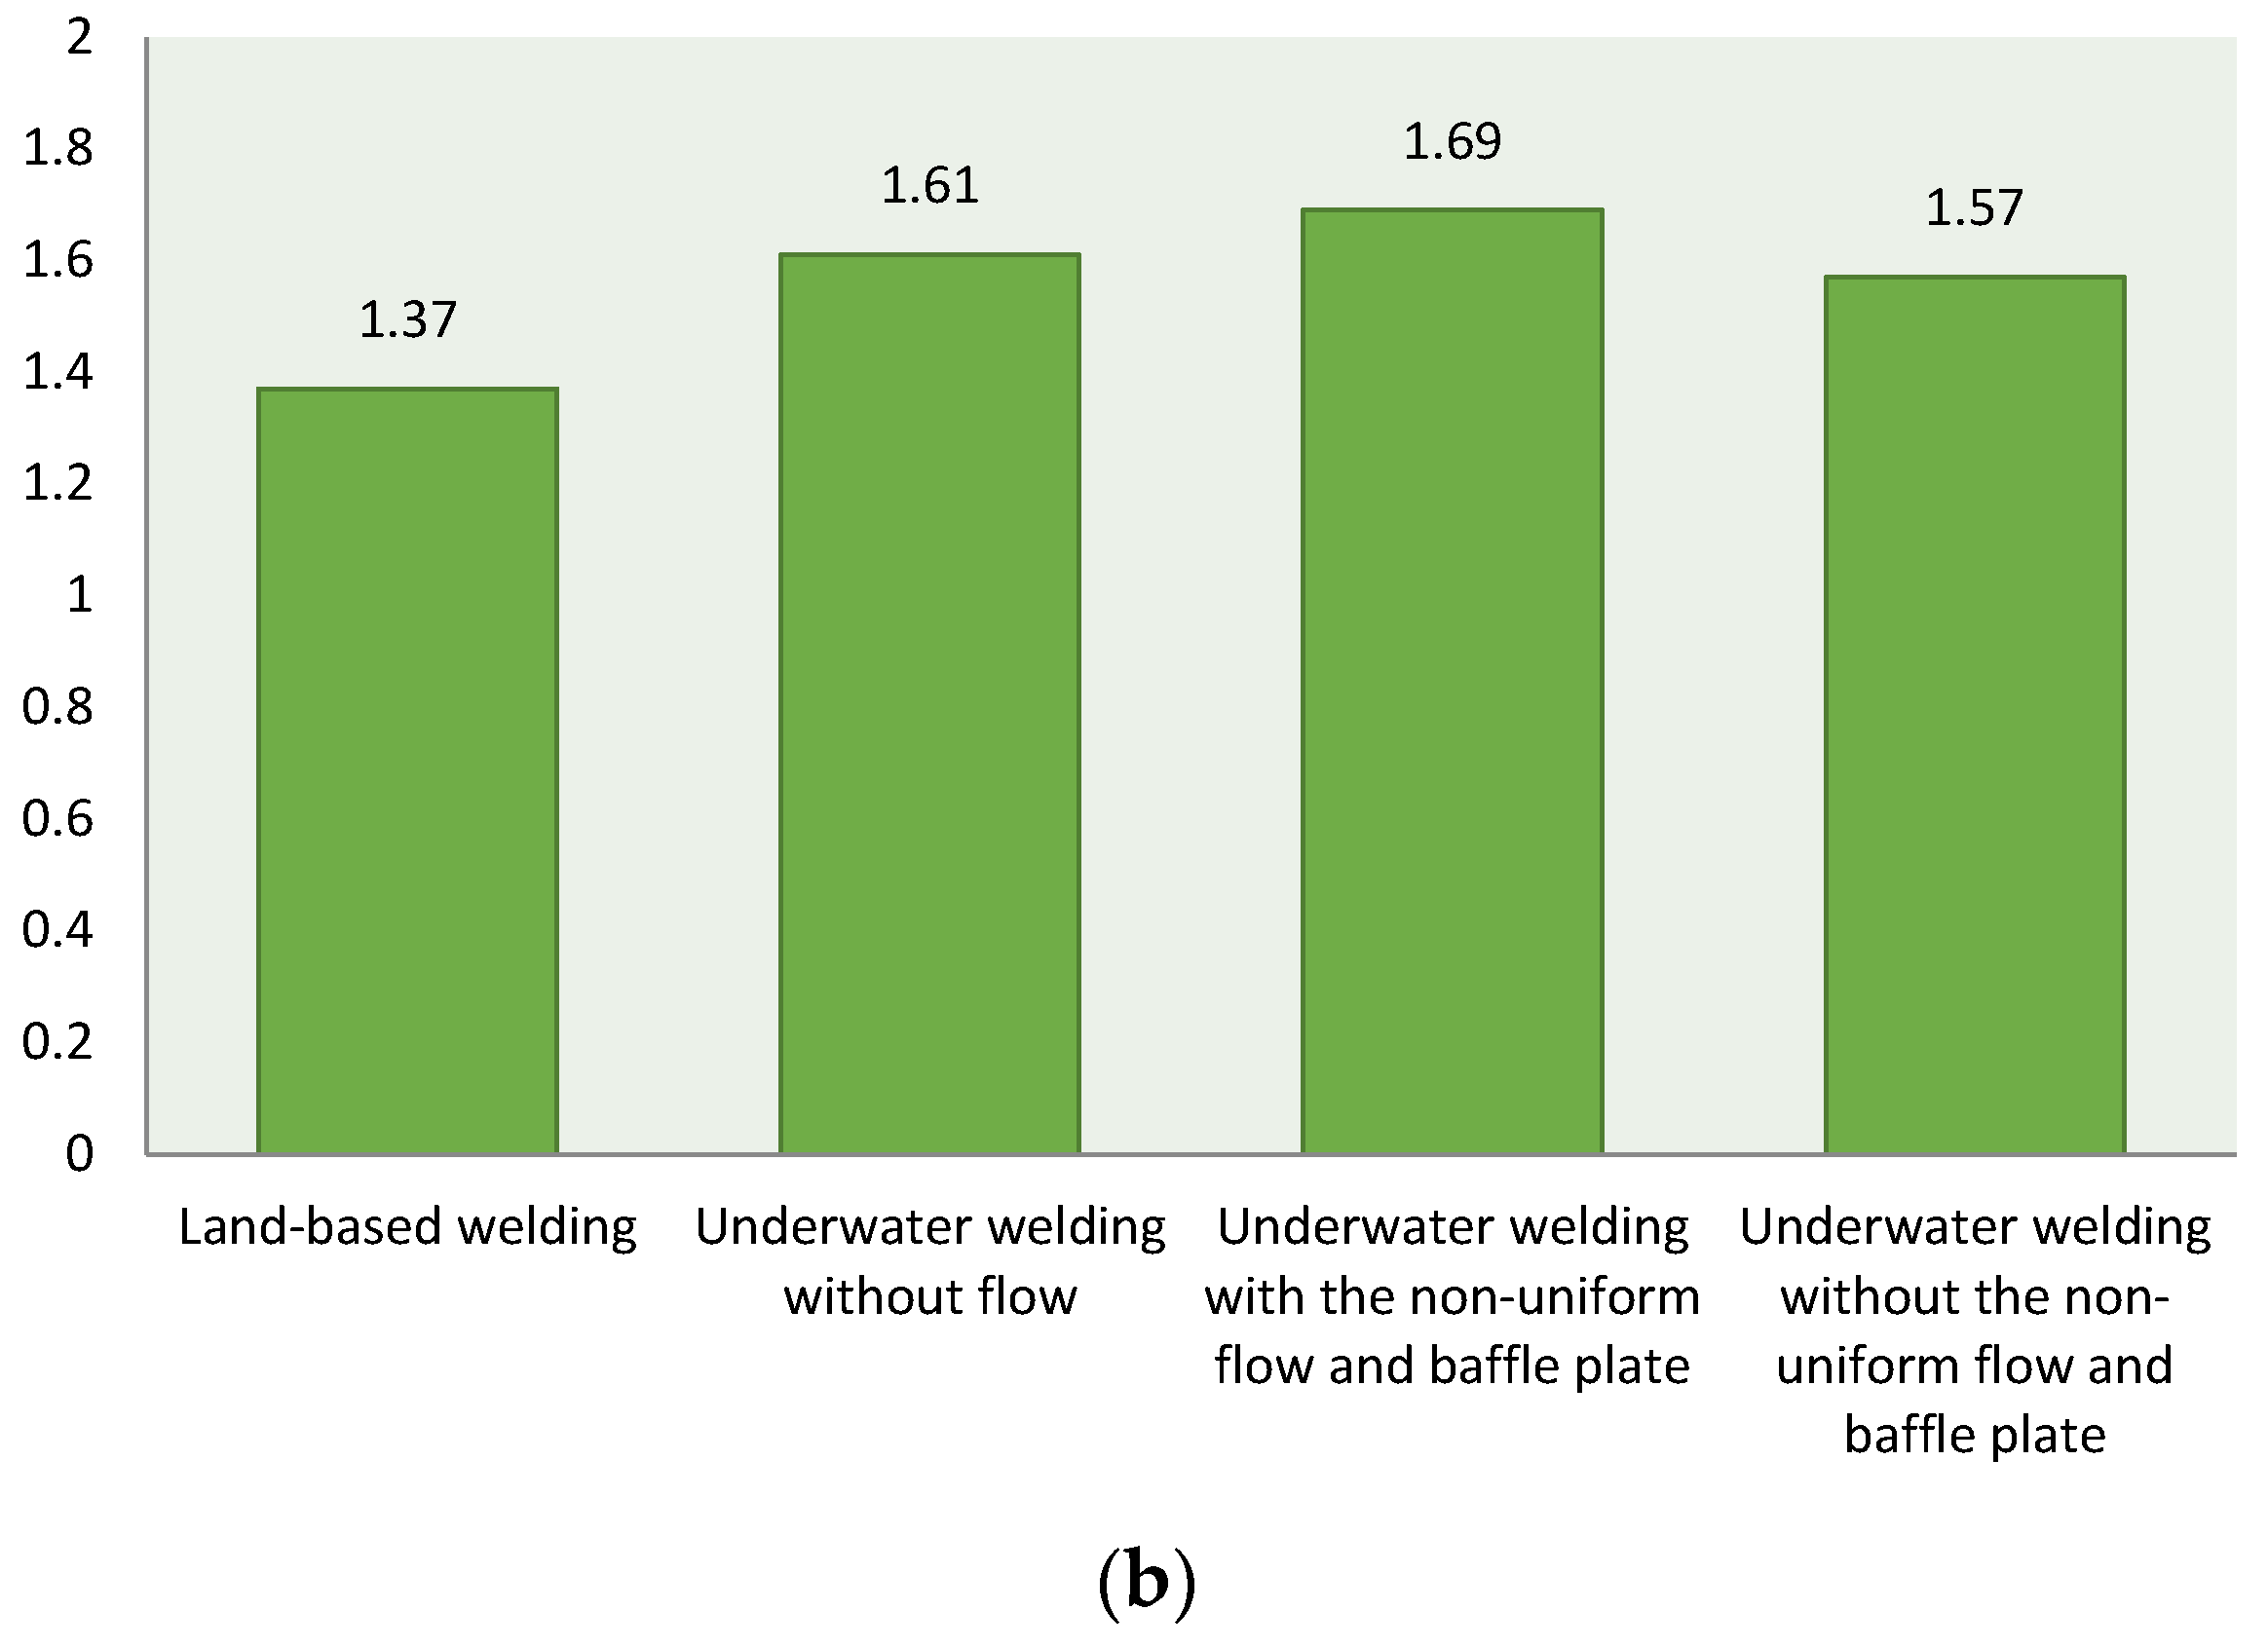
4.2.2. Tensile Testing
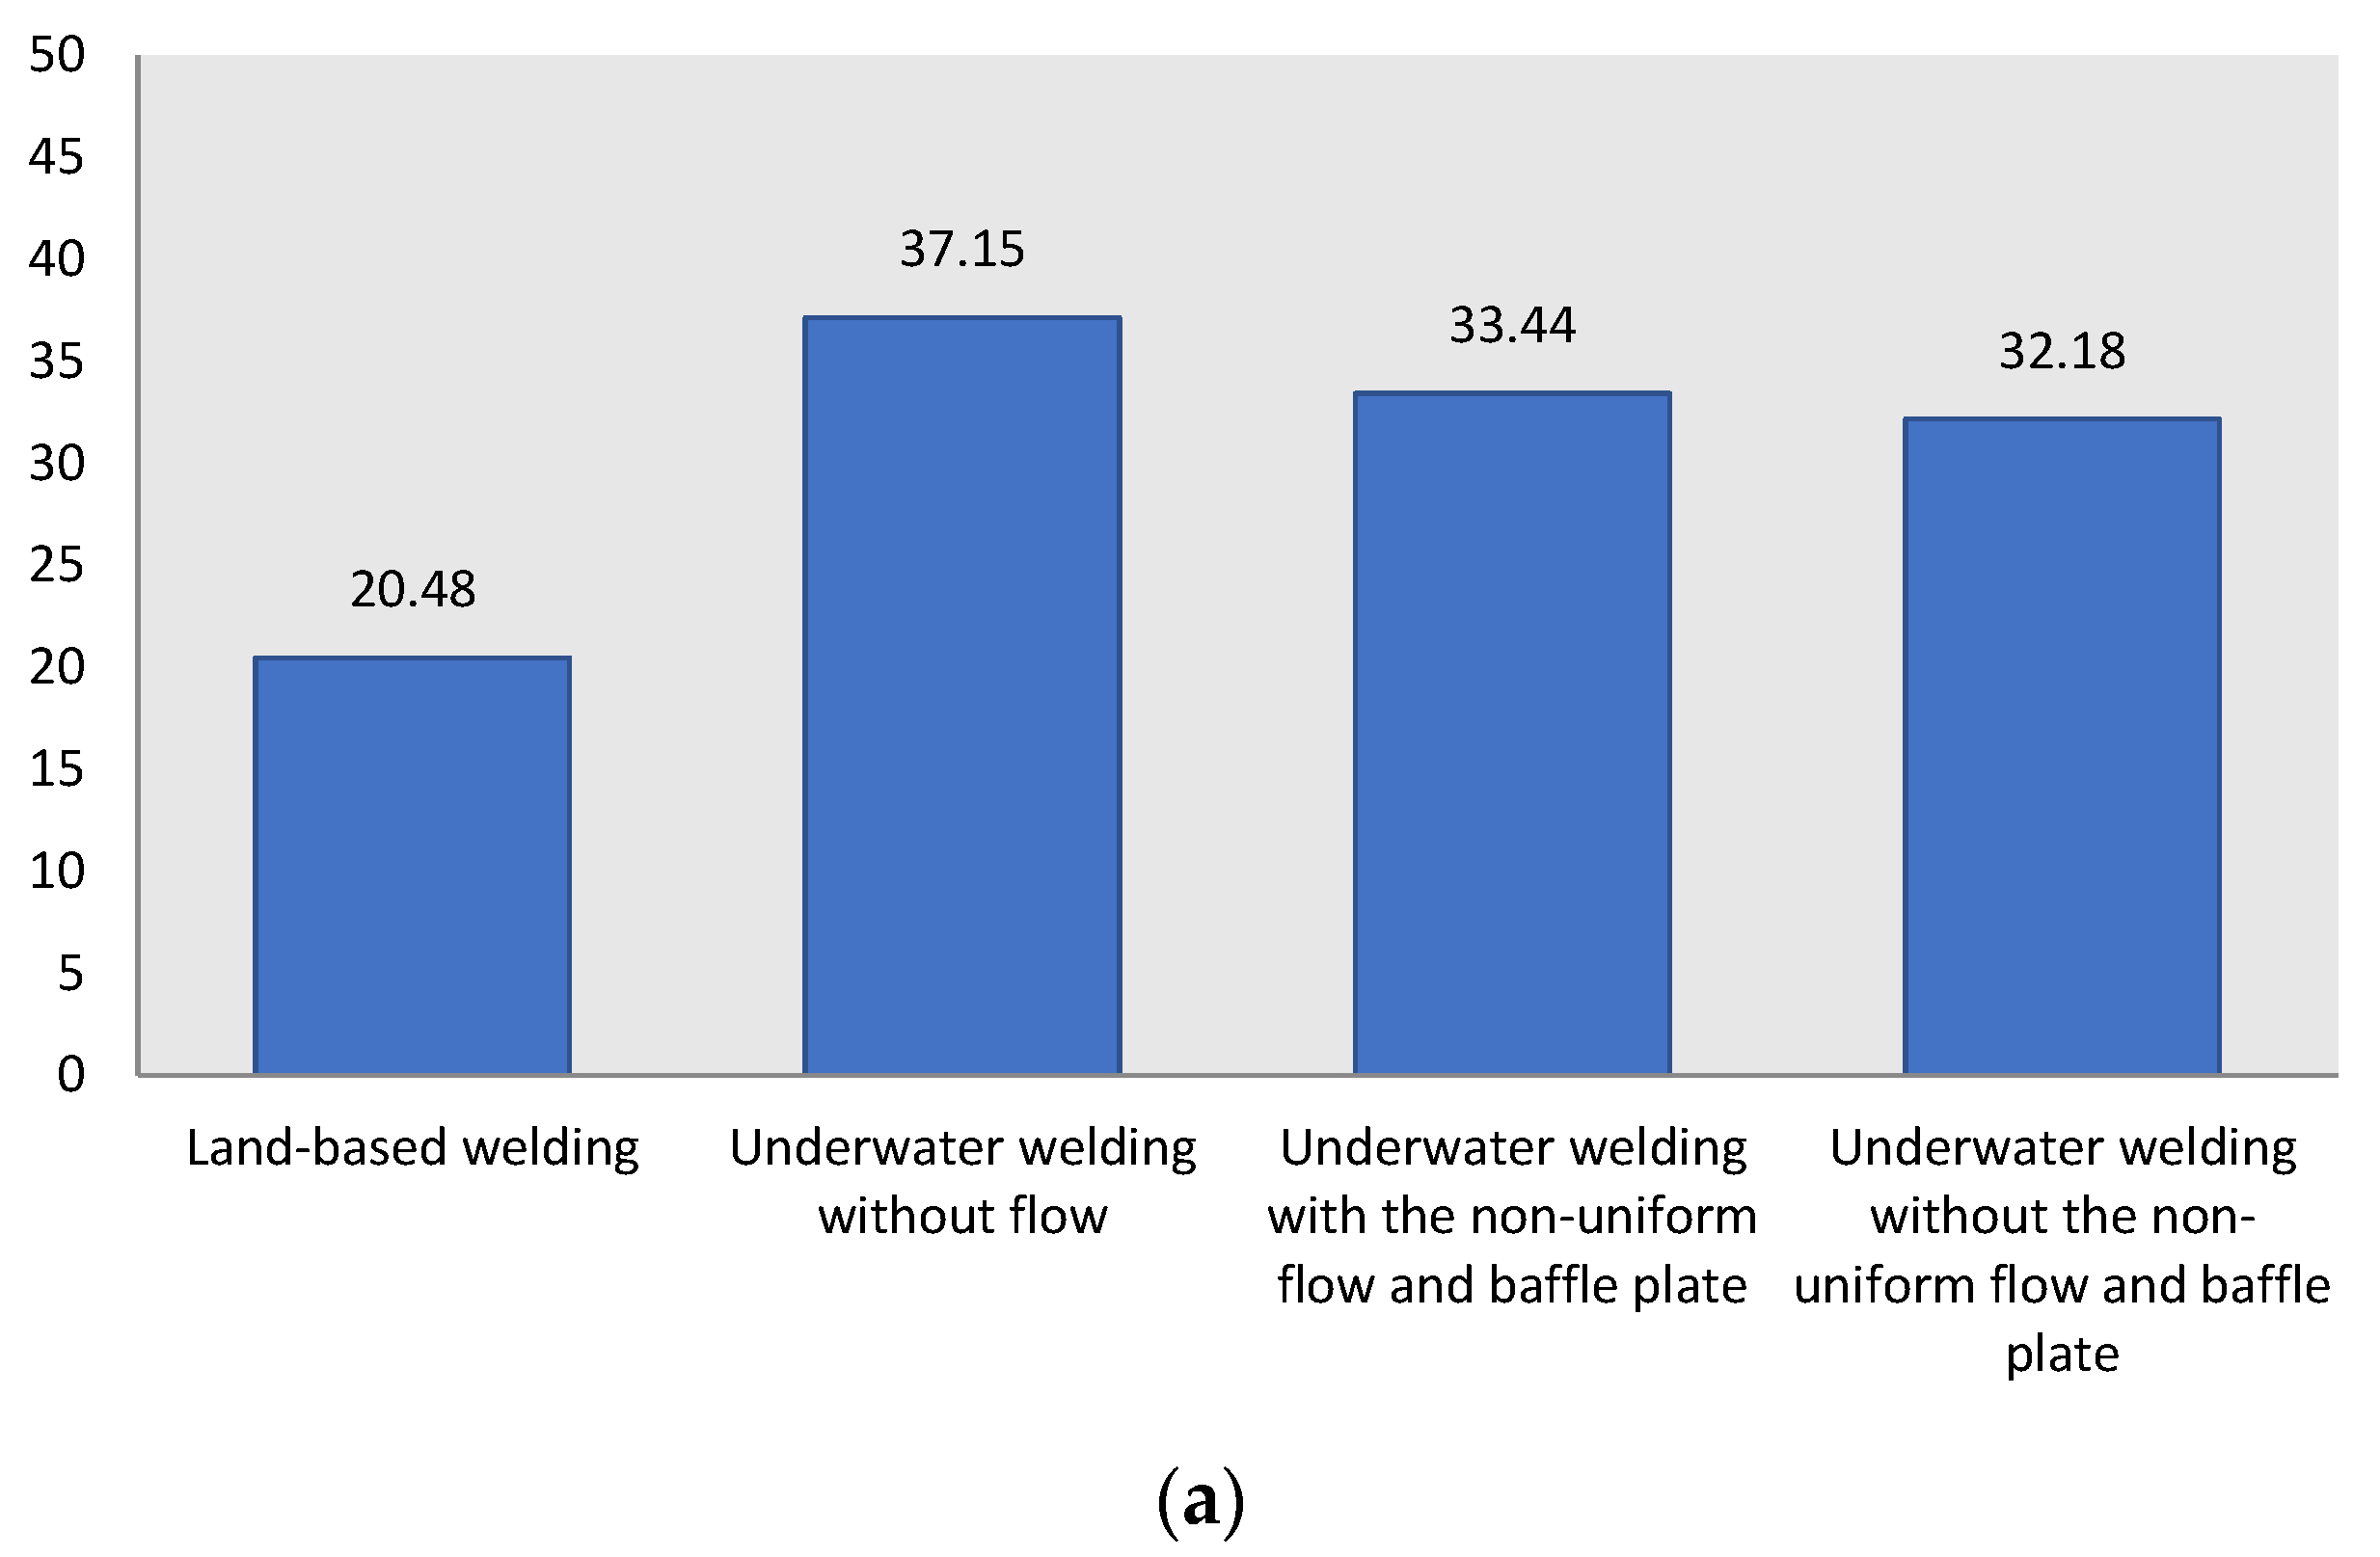
4.2.3. Impact Testing
4.2.4. Bending Testing
5. Conclusions
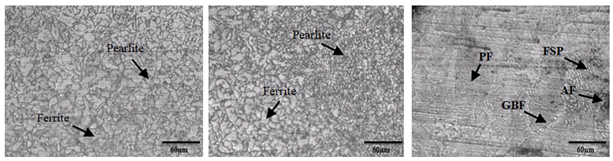
- The presence of flow and an increase in the flow rate in wet-salt underwater welding causes larger and more porosity defects to arise. Most porosity and irregular surface defects were found in wet-salt underwater welding with non-uniform flow variations without a baffle plate. The microstructure in the weld metal, such as acicular ferrite (AF) and ferrite with the second phase (FSP), increases with the non-uniformity of water flow and cooling rate. AF and FSP are most commonly found in non-uniform, non-uniform flow wet-salt underwater welding without a baffle plate. The heat affected zone has a smaller grain size with increasing flow and cooling rates.
- The type of water flow during the welding process, namely without flow, non-uniform flow and a baffle plate, and non-uniform flow and a baffle plate can affect the results of underwater welding. Based on the results of mechanical testing (micro-Vickers and tensile test), non-uniform flow with a baffle plate has a higher hardness and tensile strength than other types of flow. In the Vickers test, the hardness value increased by 1.7% compared to on land. In the tensile test, the UTS value increased by 1.5% compared to on land. The impact test increased by 1.6% compared to on land. However, the impact test on underwater welded specimens with non-uniform flow and a baffle plate decreased compared to other types of flow. This shows that the correlation between the value of hardness is inversely proportional to the value of toughness
Author Contributions
Funding
Institutional Review Board Statement
Informed Consent Statement
Data Availability Statement
Acknowledgments
Conflicts of Interest
References
- Prabowo, A.R.; Tuswan, T.; Ridwan, R. Advanced development of sensors’ roles in maritime-based industry and research: From field monitoring to high-risk phenomenon measurement. Appl. Sci. 2021, 11, 3954. [Google Scholar] [CrossRef]
- Joshi, A.M. Underwater Welding; Indian Institute of Technology: Bombay, India, 2012. [Google Scholar]
- Wang, J.; Sun, Q.; Zhang, S.; Chengjin, W.; Laijun, W.; Feng, J. Characterization of the underwater welding arc bubble through a visual sensing method. J. Mater. Process. Technol. 2018, 251, 95–108. [Google Scholar] [CrossRef]
- Rowe, M.; Liu, S. Recent developments in underwater wet welding. Sci. Technol. Weld. Join. 2014, 6, 387–396. [Google Scholar] [CrossRef]
- Tsai, C.L.; Masubuchi, K. Mechanisms of rapid cooling in underwater welding. Appl. Ocean Res. 1979, 1, 99–110. [Google Scholar] [CrossRef]
- Gyasi, E.A. Welding processes of metals for offshore environment: Underwater welding. Mater. Sci. 2019. [Google Scholar]
- Version, I.; Omajene, J.E.; Martikainen, J.; Kah, P.; Pirinen, M. Fundamental Difficulties Associated With Underwater Wet Welding. Int. J. Eng. Res. Appl. 2014, 4, 26–31. [Google Scholar]
- Chen, H.; Guo, N.; Shi, X.; Du, Y.; Feng, J.; Wang, G. Effect of water flow on the arc stability and metal transfer in underwater flux-cored wet welding. J. Manuf. Process. 2018, 31, 103–115. [Google Scholar] [CrossRef]
- Guo, N.; Xu, C.; Du, Y.; Wang, M.; Feng, J.; Deng, Z.; Tang, D. Effect of boric acid concentration on the arc stability in underwater wet welding. J. Mater. Process. Technol. 2015, 229, 244–252. [Google Scholar] [CrossRef]
- Świerczyńska, A.; Fydrych, D.; Rogalski, G. Diffusible hydrogen management in underwater wet self-shielded flux cored arc welding. Int. J. Hydrogen Energy 2017, 42, 24532–24540. [Google Scholar] [CrossRef]
- Prospero, J.M. Mineral and Sea Salt Aerosol Concentrations in Various Ocean Regions. JGR: Oceans 1979, 84, 725–731. [Google Scholar] [CrossRef]
- Pessoa, E.C.P.; Bracarense, A.Q.; Zica, E.M.; Liu, S.; Perez-Guerrero, F. Porosity variation along multipass underwater wet welds and its influence on mechanical properties. J. Mater. Process. Technol. 2006, 179, 239–243. [Google Scholar] [CrossRef]
- Çolak, Z.; Ayan, Y.; Kahraman, N. Weld morphology and mechanical performance of marine structural steel welded underwater in a real marine environment. Int. J. Adv. Manuf. Technol. 2020, 109, 1–11. [Google Scholar] [CrossRef]
- Di, X.; Ji, S.; Cheng, F.; Wang, D.; Cao, J. Effect of cooling rate on microstructure, inclusions and mechanical properties of weld metal in simulated local dry underwater welding. Mater. Des. 2015, 88, 505–513. [Google Scholar] [CrossRef]
- Omajene, J.E.; Martikainen, J.; Kah, P. Effect of Welding Parameters on Weld Bead Shape for Welds Done Underwater. Int. J. Mech. Eng. Appl. 2014, 2, 128–134. [Google Scholar]
- Surojo, E.; Aji, R.P.; Triyono, T.; Budiana, E.P.; Prabowo, A.R. Mechanical and Microstructural Properties of A36 Marine Steel Subjected to Underwater Wet Welding. Metals 2021, 11, 999. [Google Scholar] [CrossRef]
- Surojo, E.; Anindito, J.; Paundra, F.; Prabowo, A.R.; Budiana, E.P.; Muhayat, N.; Badaruddin, M. Effect of water flow and depth on fatigue crack growth rate of underwater wet welded low carbon steel SS400. Open Eng. 2021, 11, 329–338. [Google Scholar] [CrossRef]
- Surojo, E.; Gumilang, A.H.; Triyono, T.; Prabowo, A.R.; Budiana, E.P.; Muhayat, N. Effect of water flow on underwater wet welded A36 Steel. Metals 2021, 11, 682. [Google Scholar] [CrossRef]
- Putri, E.D.W.S.; Surojo, E.; Budiana, E.P.; Triyono. Current Research and Recommended Development on Fatigue Behavior of Underwater Welded Steel. Procedia Struct. Int. 2020, 27, 54–61. [Google Scholar] [CrossRef]
- Vaz, C.T.; Bracarense, A.Q.; Felizardo, I.; Pessoa, E.C.P. Impermeable low hydrogen covered electrodes. J. Mater. Res. Technol. 2012, 1, 64–70. [Google Scholar] [CrossRef] [Green Version]
- Standard, J.I. Test Pieces for Tensile Test for Metallic Materials; Japanese Standards Association: Tokyo, Japan, 1998; pp. 1–15. [Google Scholar]
- Guo, J.F.N.; Xu, C.; Guo, W.; Du, Y. Characterization of spatter in underwater wet welding by X-ray transmission method. Mater. Des. 2015, 85, 156–161. [Google Scholar] [CrossRef]
- Zhao, Y.; Chung, H. Numerical simulation of the transition of metal transfer from globular to spray mode in gas metal arc welding using phase field method. J. Mater. Process. Technol. 2018, 251, 251–261. [Google Scholar] [CrossRef]
- Chen, H.; Guo, N.; Huang, L.; Zhang, X.; Feng, J.; Wang, G. Effects of arc bubble behaviors and characteristics on droplet transfer in underwater wet welding using in-situ imaging method. Mater. Des. 2019, 170, 107696. [Google Scholar] [CrossRef]
- Wang, J.; Sun, Q.; Ma, J.; Teng, J.; Jin, P.; Feng, J. Investigation of acoustic radiator affecting bubble-acoustic interaction in ultrasonic wave-assisted UWW at shallow water. J. Manuf. Process 2019, 37, 563–577. [Google Scholar] [CrossRef]
- Wang, J.; Sun, Q.; Wu, L.; Liu, Y.; Teng, J.; Feng, J. Effect of ultrasonic vibration on microstructural evolution and mechanical properties of underwater wet welding joint. J. Mater. Process. Technol. 2017, 246, 185–197. [Google Scholar] [CrossRef]
- Liu, F.C.; Nelson, T.W. A Grain Structure Evolution, Grain Boundary Sliding and Material Flow Resistance in Friction Welding of Alloy 718. Mater. Sci. Eng. A 2018, 710, 280–288. [Google Scholar] [CrossRef]
- Gao, W.; Wang, D.; Cheng, F.; Di, X.; Deng, C.; Xu, W. Microstructural and mechanical performance of underwater wet welded S355 steel. J. Mater. Process. Technol. 2016, 238, 333–340. [Google Scholar] [CrossRef]
- Muhayat, N.; Matien, Y.A.; Sukanto, H.; Saputro, Y.C.N. Fatigue life of underwater wet welded low carbon steel SS400. Helliyon 2020, 6, e03366. [Google Scholar] [CrossRef]
- Lamet, W.R.J.; Bruno, L.; Alia, A.R.C. Hand Book of Welding, Brazing, Soldering; ASM International: Princes Hwy, Australia, 1993; Volume 6. [Google Scholar]
- Nixondg, J.; Billingham, J. A survey of underwater welding techniques. Endeavour 1987, 11, 143–148. [Google Scholar] [CrossRef]
- Zhang, Y.; Jia, C.; Zhao, B.; Hu, J.; Wu, C. Heat input and metal transfer influences on the weld geometry and microstructure during underwater wet FCAW. J. Mater. Process. Technol. 2016, 238, 373–382. [Google Scholar] [CrossRef]
- Callister, W.D. Fundamentals of Materials Science and Engineering; John Wiley & Sons, Inc.: New York, NY, USA, 2001. [Google Scholar]
- Guo, N.; Du, Y.; Feng, J.; Guo, W.; Deng, Z. Study of underwater wet welding stability using an X-ray transmission method. J. Mater. Process. Technol. 2015, 225, 133–138. [Google Scholar] [CrossRef]
- Kumar, R.; Chattopadhyaya, S.; Kumar, S. Influence of Welding Current on Bead Shape, Mechanical and Structural Property of Tungsten Inert Gas Welded Stainless Steel. Mater. Today Proc. 2015, 4–5, 3342–3349. [Google Scholar] [CrossRef]
- Laurito, D.F.; Baptista, C.A.R.P.; Torres, M.A.S.; Abdalla, A.J. Microstructural effects on fatigue crack growth behavior of a microalloyed steel. Procedia Eng. 2010, 2, 1915–1925. [Google Scholar] [CrossRef] [Green Version]
- Wang, G.-Q.; Li, Q.; Li, Y.-J.; Wu, A.-P.; Ma, N.-X.; Yan, D.-Y.; Wu, H.-Q. Effects of weld reinforcement on tensile behavior and mechanical properties of 2219-T87 aluminum alloy TIG welded joints. Trans. Nonferr. Metal. Soc. 2017, 27, 10–16. [Google Scholar] [CrossRef]
- Berto, F.; Sandnes, L.; Abbatinali, F.; Grong, Ø.; Ferro, P. Produced using the hybrid metal extrusion & bonding (HYB) process- Part I: Bend test results. Procedia Manuf. 2018, 34, 147–153. [Google Scholar]


| wt % | ASTM Steel A36 |
|---|---|
| Carbon (C) | 0.190 |
| Silicon (Si) | 0.128 |
| Manganese (Mn) | 0.472 |
| Phosphorus (P) | 0.044 |
| Sulfur (S) | 0.053 |
| Chromium (Cr) | 0.025 |
| Nickel (Ni) | 0.014 |
| Copper (Cu) | 0.015 |
| Niobium (Nb) | 0.0082 |
| wt % | Electrode E7018 |
|---|---|
| Carbon (C) | 0.15 |
| Silicon (Si) | 0.75 |
| Manganese (Mn) | 1.6 |
| Phosphorus (P) | 0.035 |
| Sulfur (S) | 0.035 |
| Chromium (Cr) | 0.2 |
| Nickel (Ni) | 0.3 |
| Molybdenum (Mo) | 0.3 |
| Vanadium (V) | 0.08 |
| No. | Variation | Flow Type |
|---|---|---|
| 1 | A | Land-based welding |
| 2 | B | Non-flow |
| 3 | C | Non-uniform flow with a baffle plate |
| 4 | D | Non-uniform flow without a baffle plate |
| No. | Specimen | Water Type | Type of Flow | Defect | Total |
|---|---|---|---|---|---|
| 1. | A | Land-based | - | Porosity (P) | 0 |
| Spatter (S) | 79 | ||||
| Irregular Surface (I) | 3 | ||||
| 2. | B | Saltwater | Non Flow | Porosity (P) | 14 |
| Spatter (S) | 48 | ||||
| Irregular Surface (I) | 11 | ||||
| 3. | C | Saltwater | Non-uniform flow with a baffle plate | Porosity (P) | 38 |
| Spatter (S) | 43 | ||||
| Irregular Surface (I) | 8 | ||||
| 4. | D | Saltwater | Non-uniform flow without a baffle plate | Porosity (P) | 62 |
| Spatter (S) | 86 | ||||
| Irregular Surface (I) | 12 |
| Specimen Variation | Base Metal | HAZ | Weld Metal |
|---|---|---|---|
| Land-based welding |  | ||
 | |||
| Underwater welding without flow | 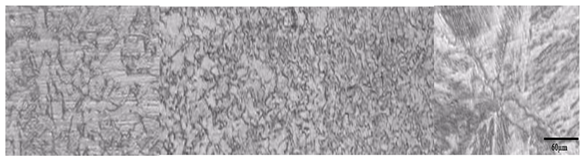 | ||
 | |||
| Underwater welding with the non-uniform flow and baffle plate |  | ||
 | |||
| Underwater welding with the non-uniform flow and baffle plate without a baffle plate |  | ||
 | |||
| H (J/mm) | I (A) | U (V) | v (mm/s) | Rc (°C/s) | ∆t8/5 (s) |
|---|---|---|---|---|---|
| 7500 | 120 | 25 | 0.4 | 2.74 | 0.00042 |
| No. | Variation | Identification | Mandrel Diameter | Test Results Long Crack | Results |
|---|---|---|---|---|---|
| 1 | C0 | Face bend 1 | 32 | - | Accepted |
| 2 | C1 | Face bend 2 | 32 | - | Accepted |
| 3 | C2 | Face bend 3 | 32 | - | Accepted |
| 4 | C3 | Face bend 4 | 32 | - | Accepted |
Publisher’s Note: MDPI stays neutral with regard to jurisdictional claims in published maps and institutional affiliations. |
© 2022 by the authors. Licensee MDPI, Basel, Switzerland. This article is an open access article distributed under the terms and conditions of the Creative Commons Attribution (CC BY) license (https://creativecommons.org/licenses/by/4.0/).
Share and Cite
Surojo, E.; Muhayat, N.; Budiana, E.P.; Aridharma, A.P.; Saputro, Y.C.N.N.; Tuswan, T.; Putri, E.D.W.S.; Prabowo, A.R.; Triyono, T. The Influence of Water Flow Characteristics on the Physical and Mechanical Qualities of Underwater Wet Welded A36 Marine Steel Plate. Metals 2022, 12, 1295. https://doi.org/10.3390/met12081295
Surojo E, Muhayat N, Budiana EP, Aridharma AP, Saputro YCNN, Tuswan T, Putri EDWS, Prabowo AR, Triyono T. The Influence of Water Flow Characteristics on the Physical and Mechanical Qualities of Underwater Wet Welded A36 Marine Steel Plate. Metals. 2022; 12(8):1295. https://doi.org/10.3390/met12081295
Chicago/Turabian StyleSurojo, Eko, Nurul Muhayat, Eko Prasetya Budiana, Airlangga Putra Aridharma, Yudit C. N. Nyoto Saputro, Tuswan Tuswan, Ericha Dwi Wahyu Syah Putri, Aditya Rio Prabowo, and Triyono Triyono. 2022. "The Influence of Water Flow Characteristics on the Physical and Mechanical Qualities of Underwater Wet Welded A36 Marine Steel Plate" Metals 12, no. 8: 1295. https://doi.org/10.3390/met12081295
APA StyleSurojo, E., Muhayat, N., Budiana, E. P., Aridharma, A. P., Saputro, Y. C. N. N., Tuswan, T., Putri, E. D. W. S., Prabowo, A. R., & Triyono, T. (2022). The Influence of Water Flow Characteristics on the Physical and Mechanical Qualities of Underwater Wet Welded A36 Marine Steel Plate. Metals, 12(8), 1295. https://doi.org/10.3390/met12081295