
Modelling of Strain-Controlled Thermomechanical Fatigue Testing of Cast AlSi7Cu3.5Mg0.15 (Mn, Zr, V) Alloy for Different Aging Conditions

 , , and
Abstract
1. Introduction
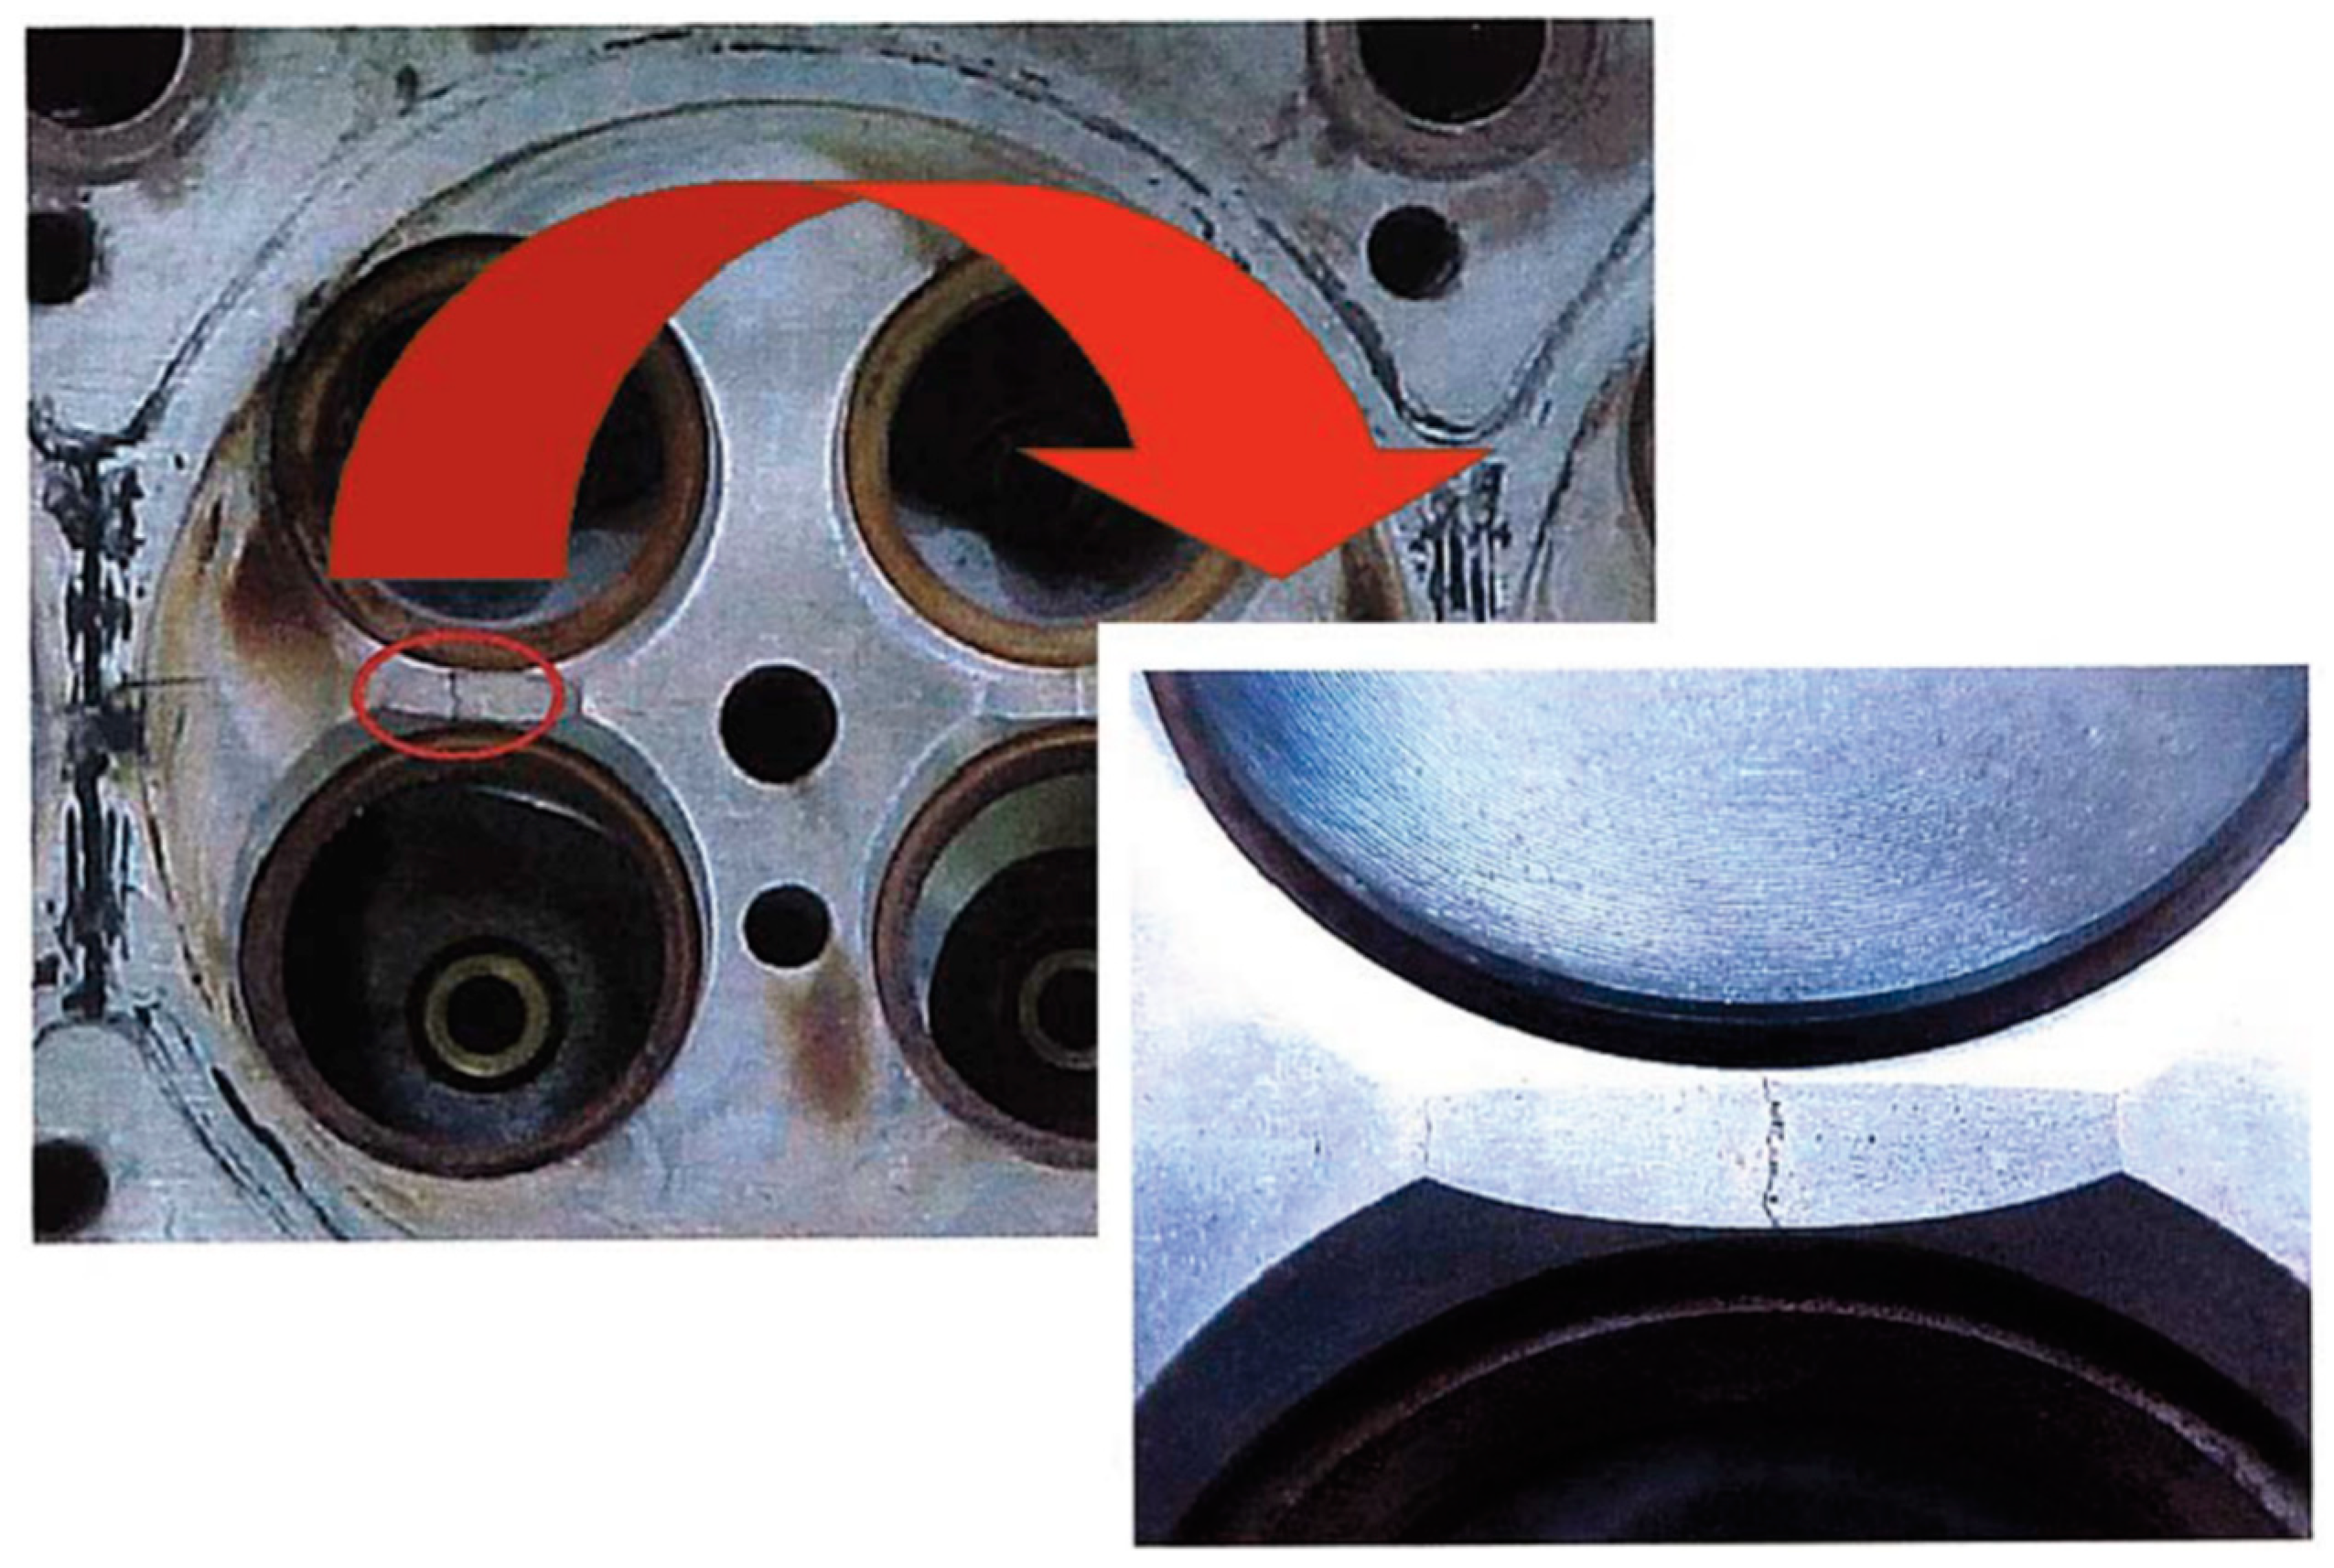
1.1. Generalities on Thermomechanical Fatigue of Automotive Cylinder Head
1.2. Thermomechanical Fatigue of Cast Aluminium Alloys
1.3. Thermoelectric Modelling of Joule Heating
2. Experimental
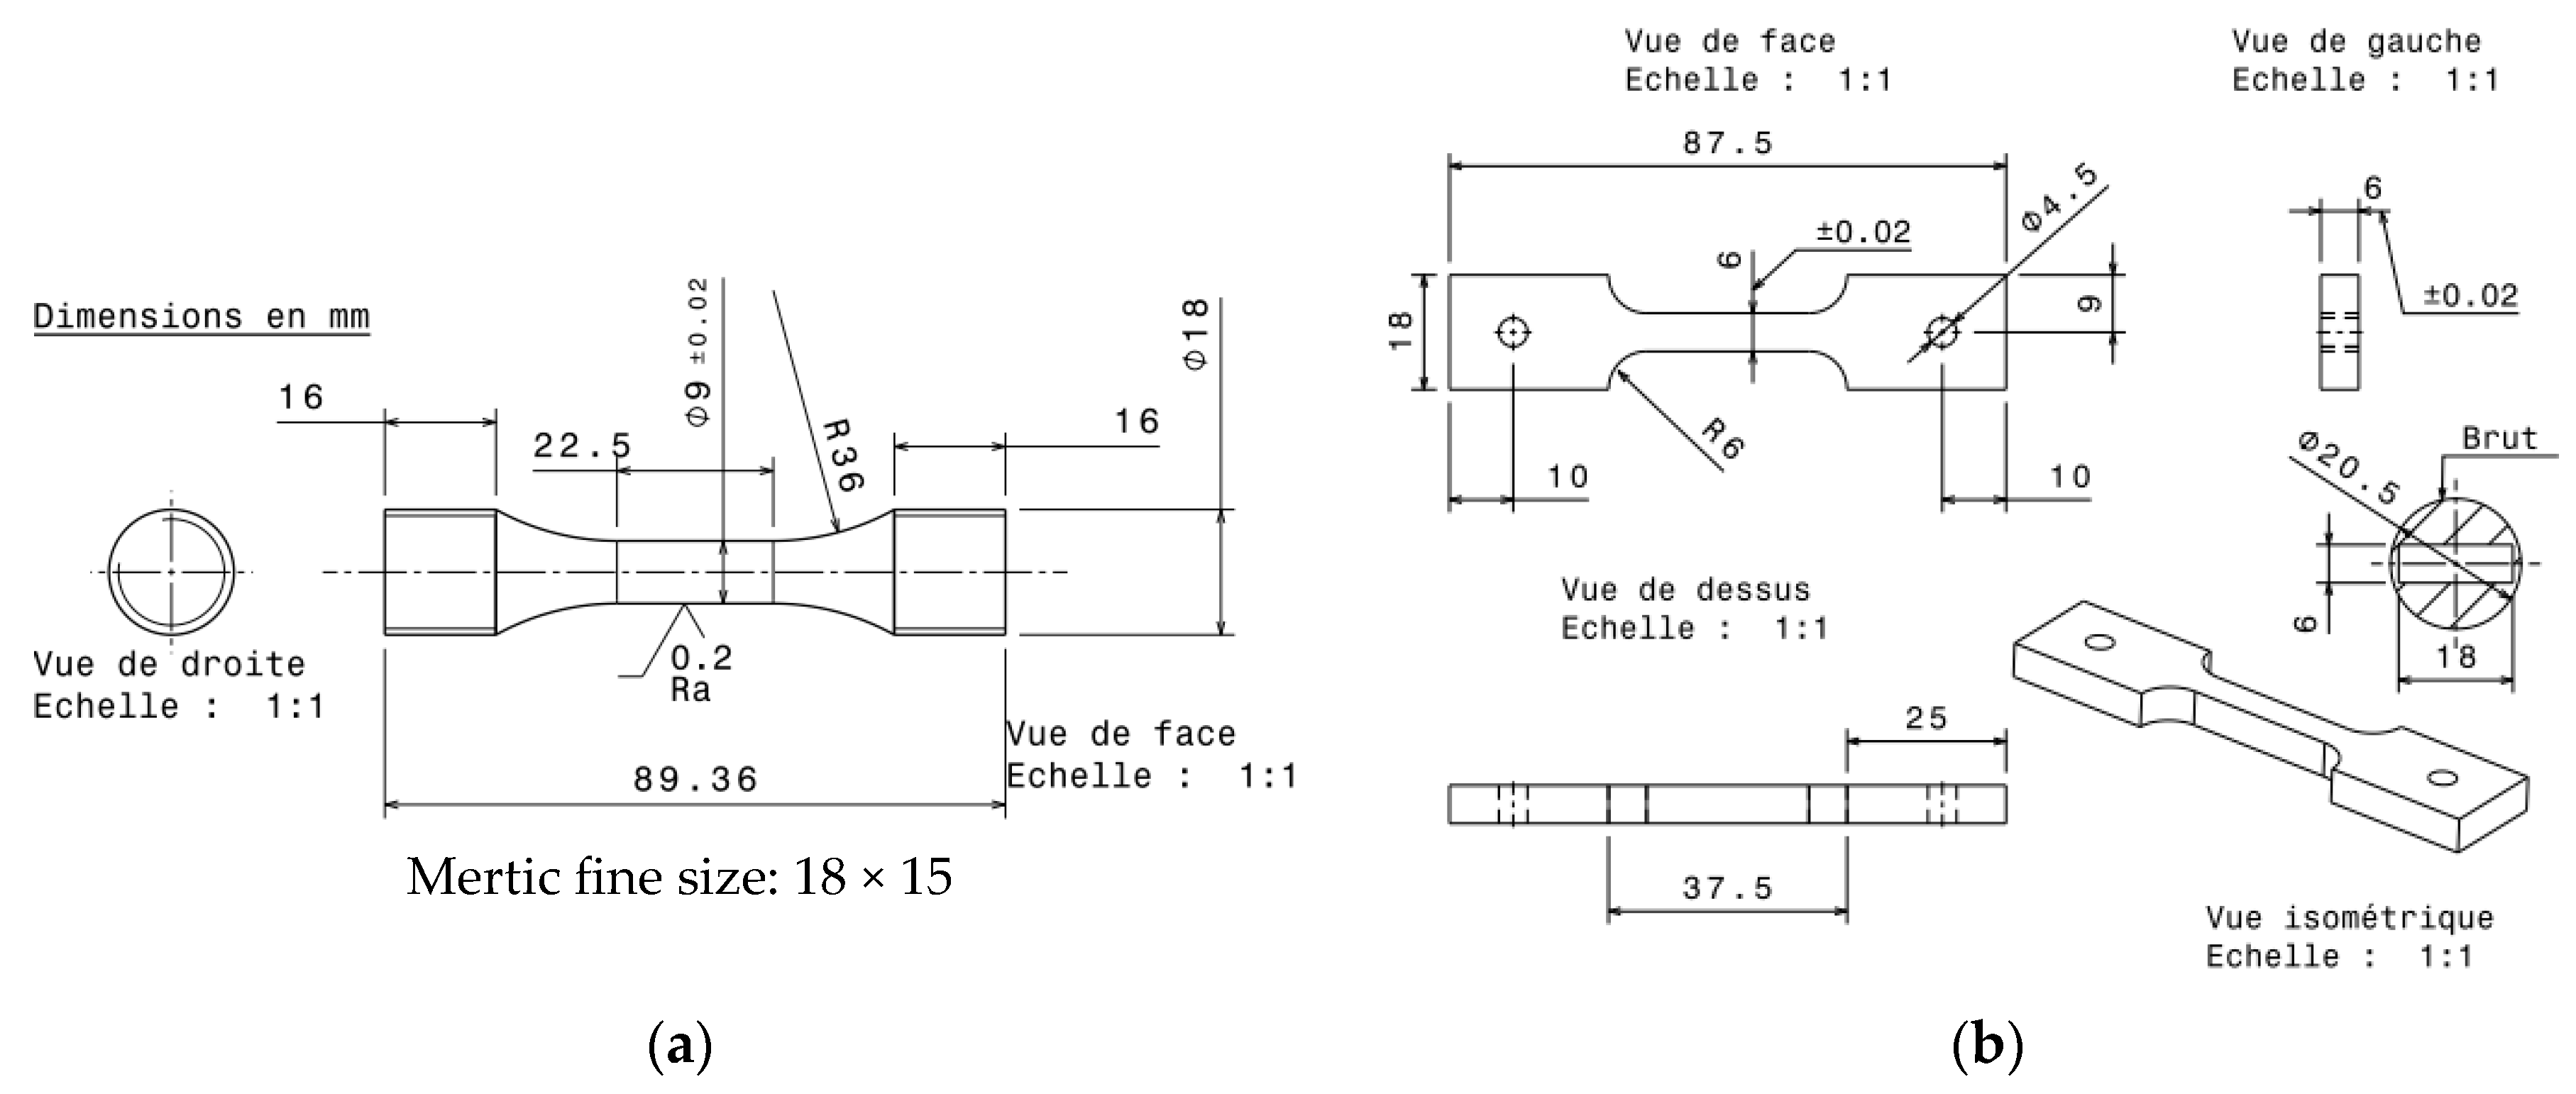
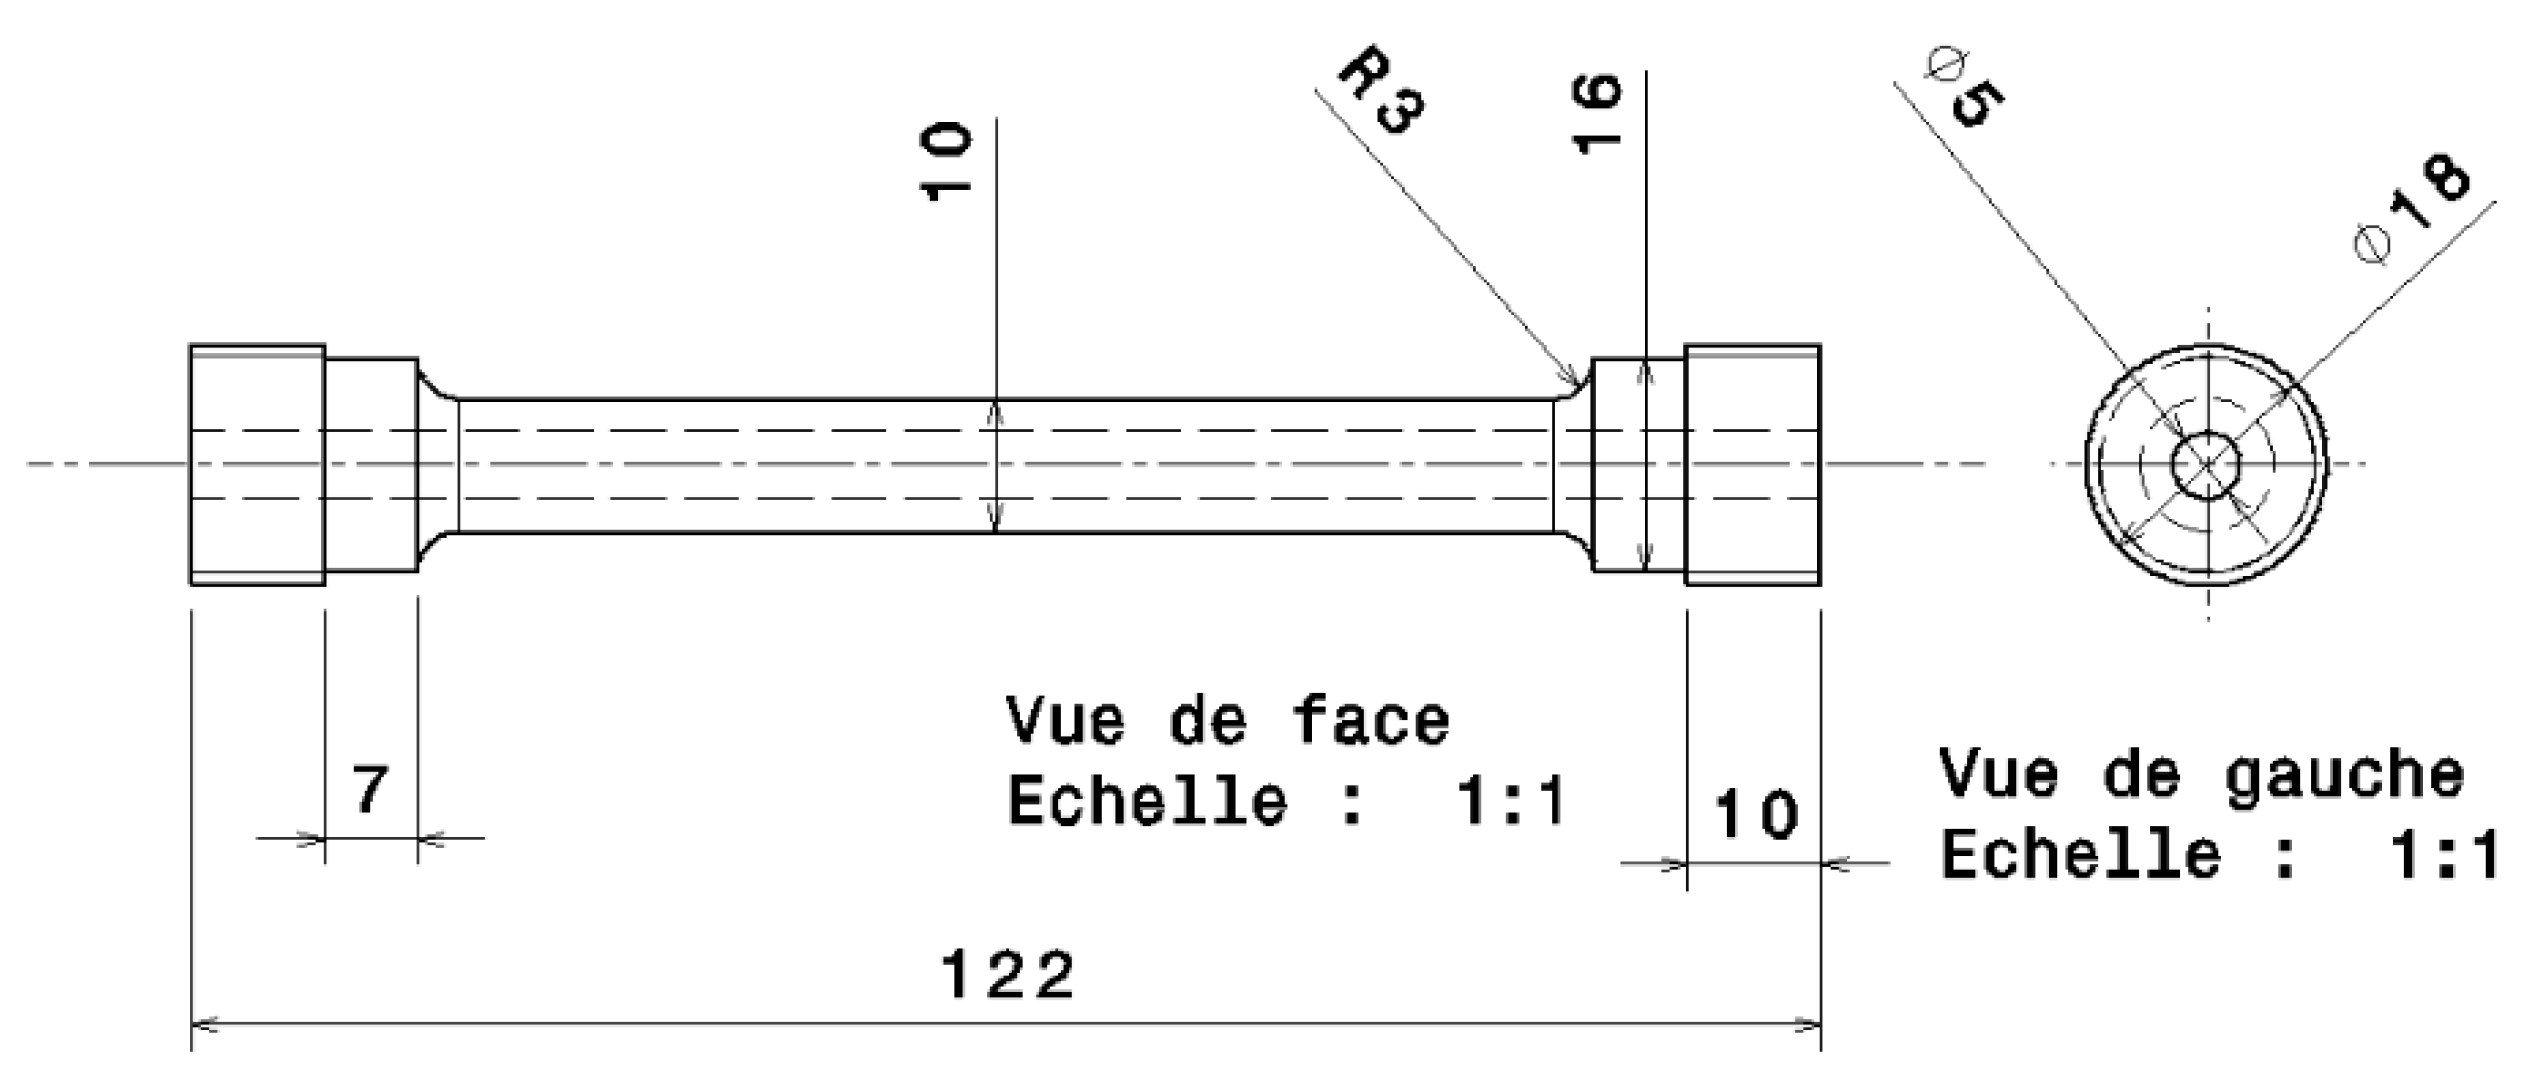
2.1. Samples Preparation
2.2. Characterization Methods
2.2.1. AlSi7Cu3.5Mg0.15 (Mn, Zr, V) As-Cast and As-Quenched Characterization
2.2.2. Isothermal Low Cycle Fatigue (LCF) and Creep Tests
2.2.3. Thermomechanical Fatigue Tests
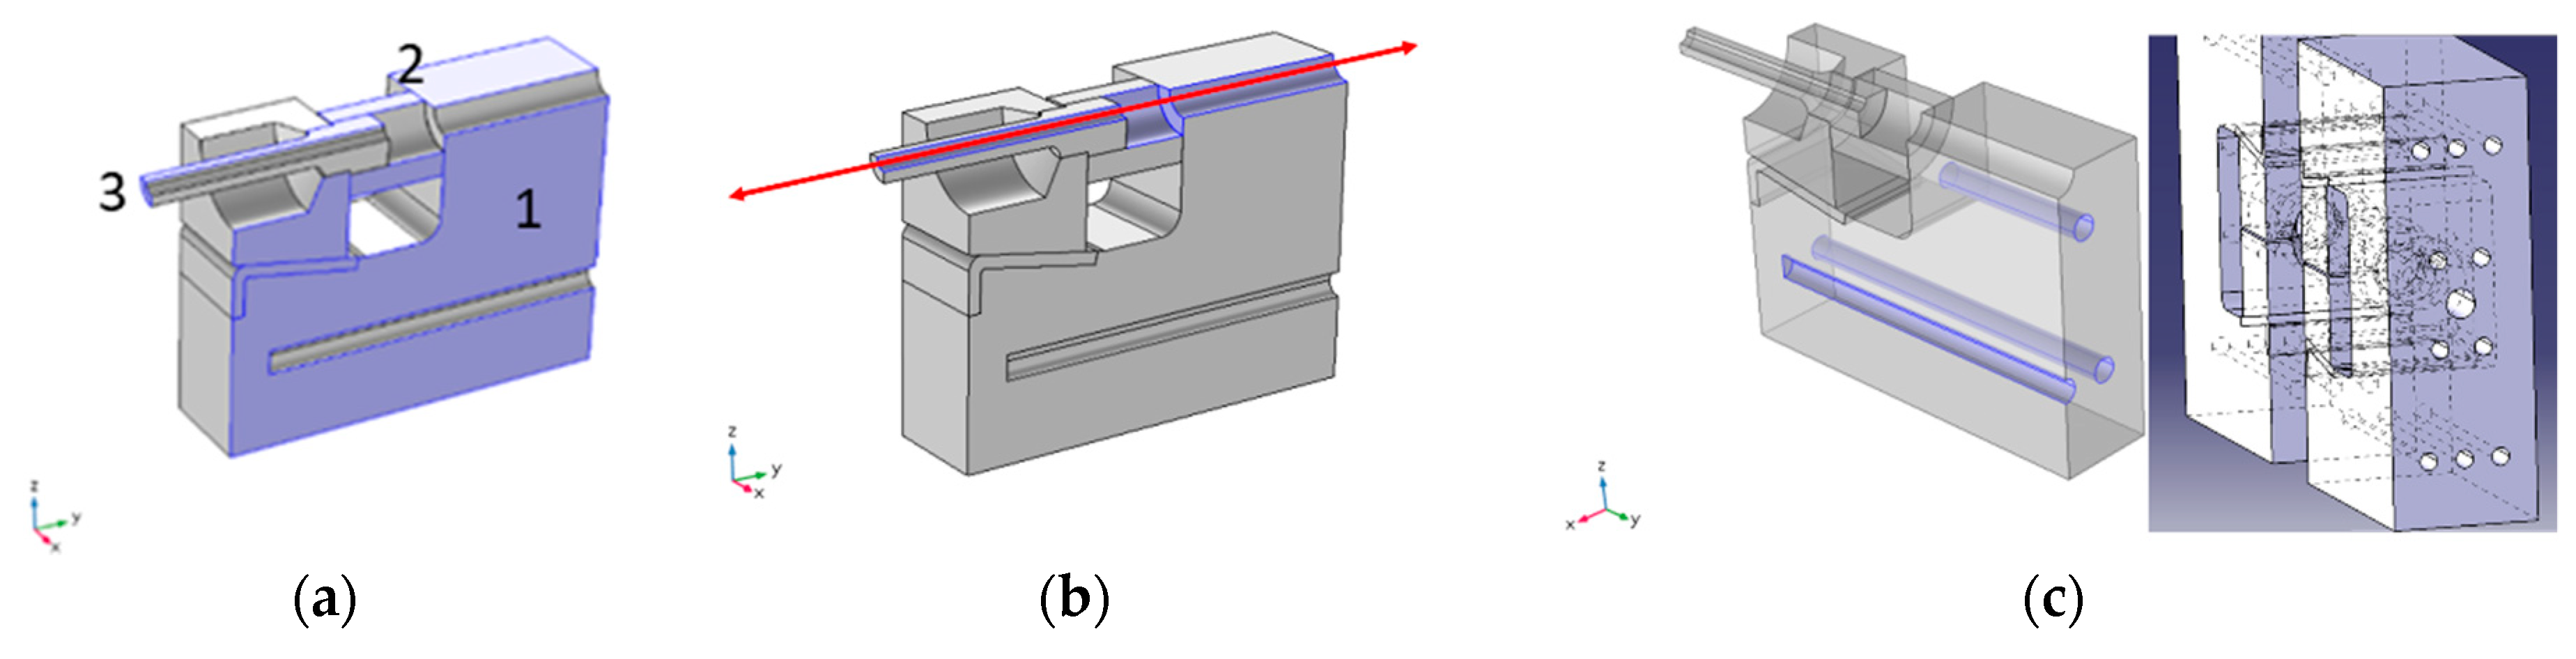
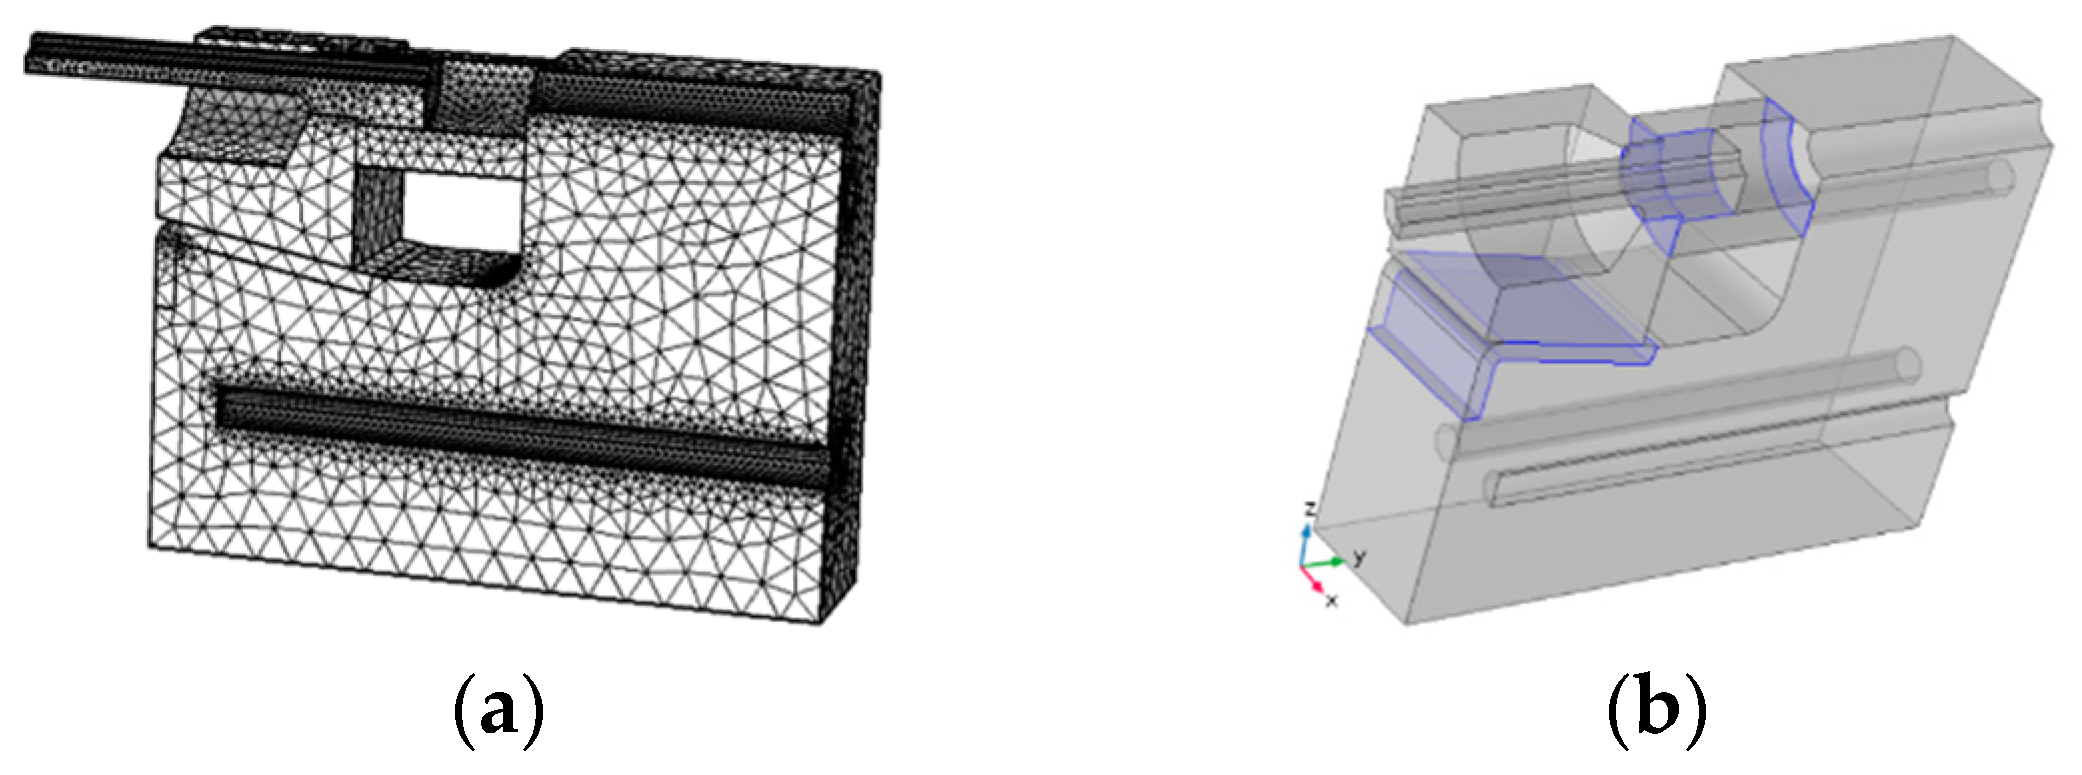
2.2.4. Comsol Thermoelectric Modelling
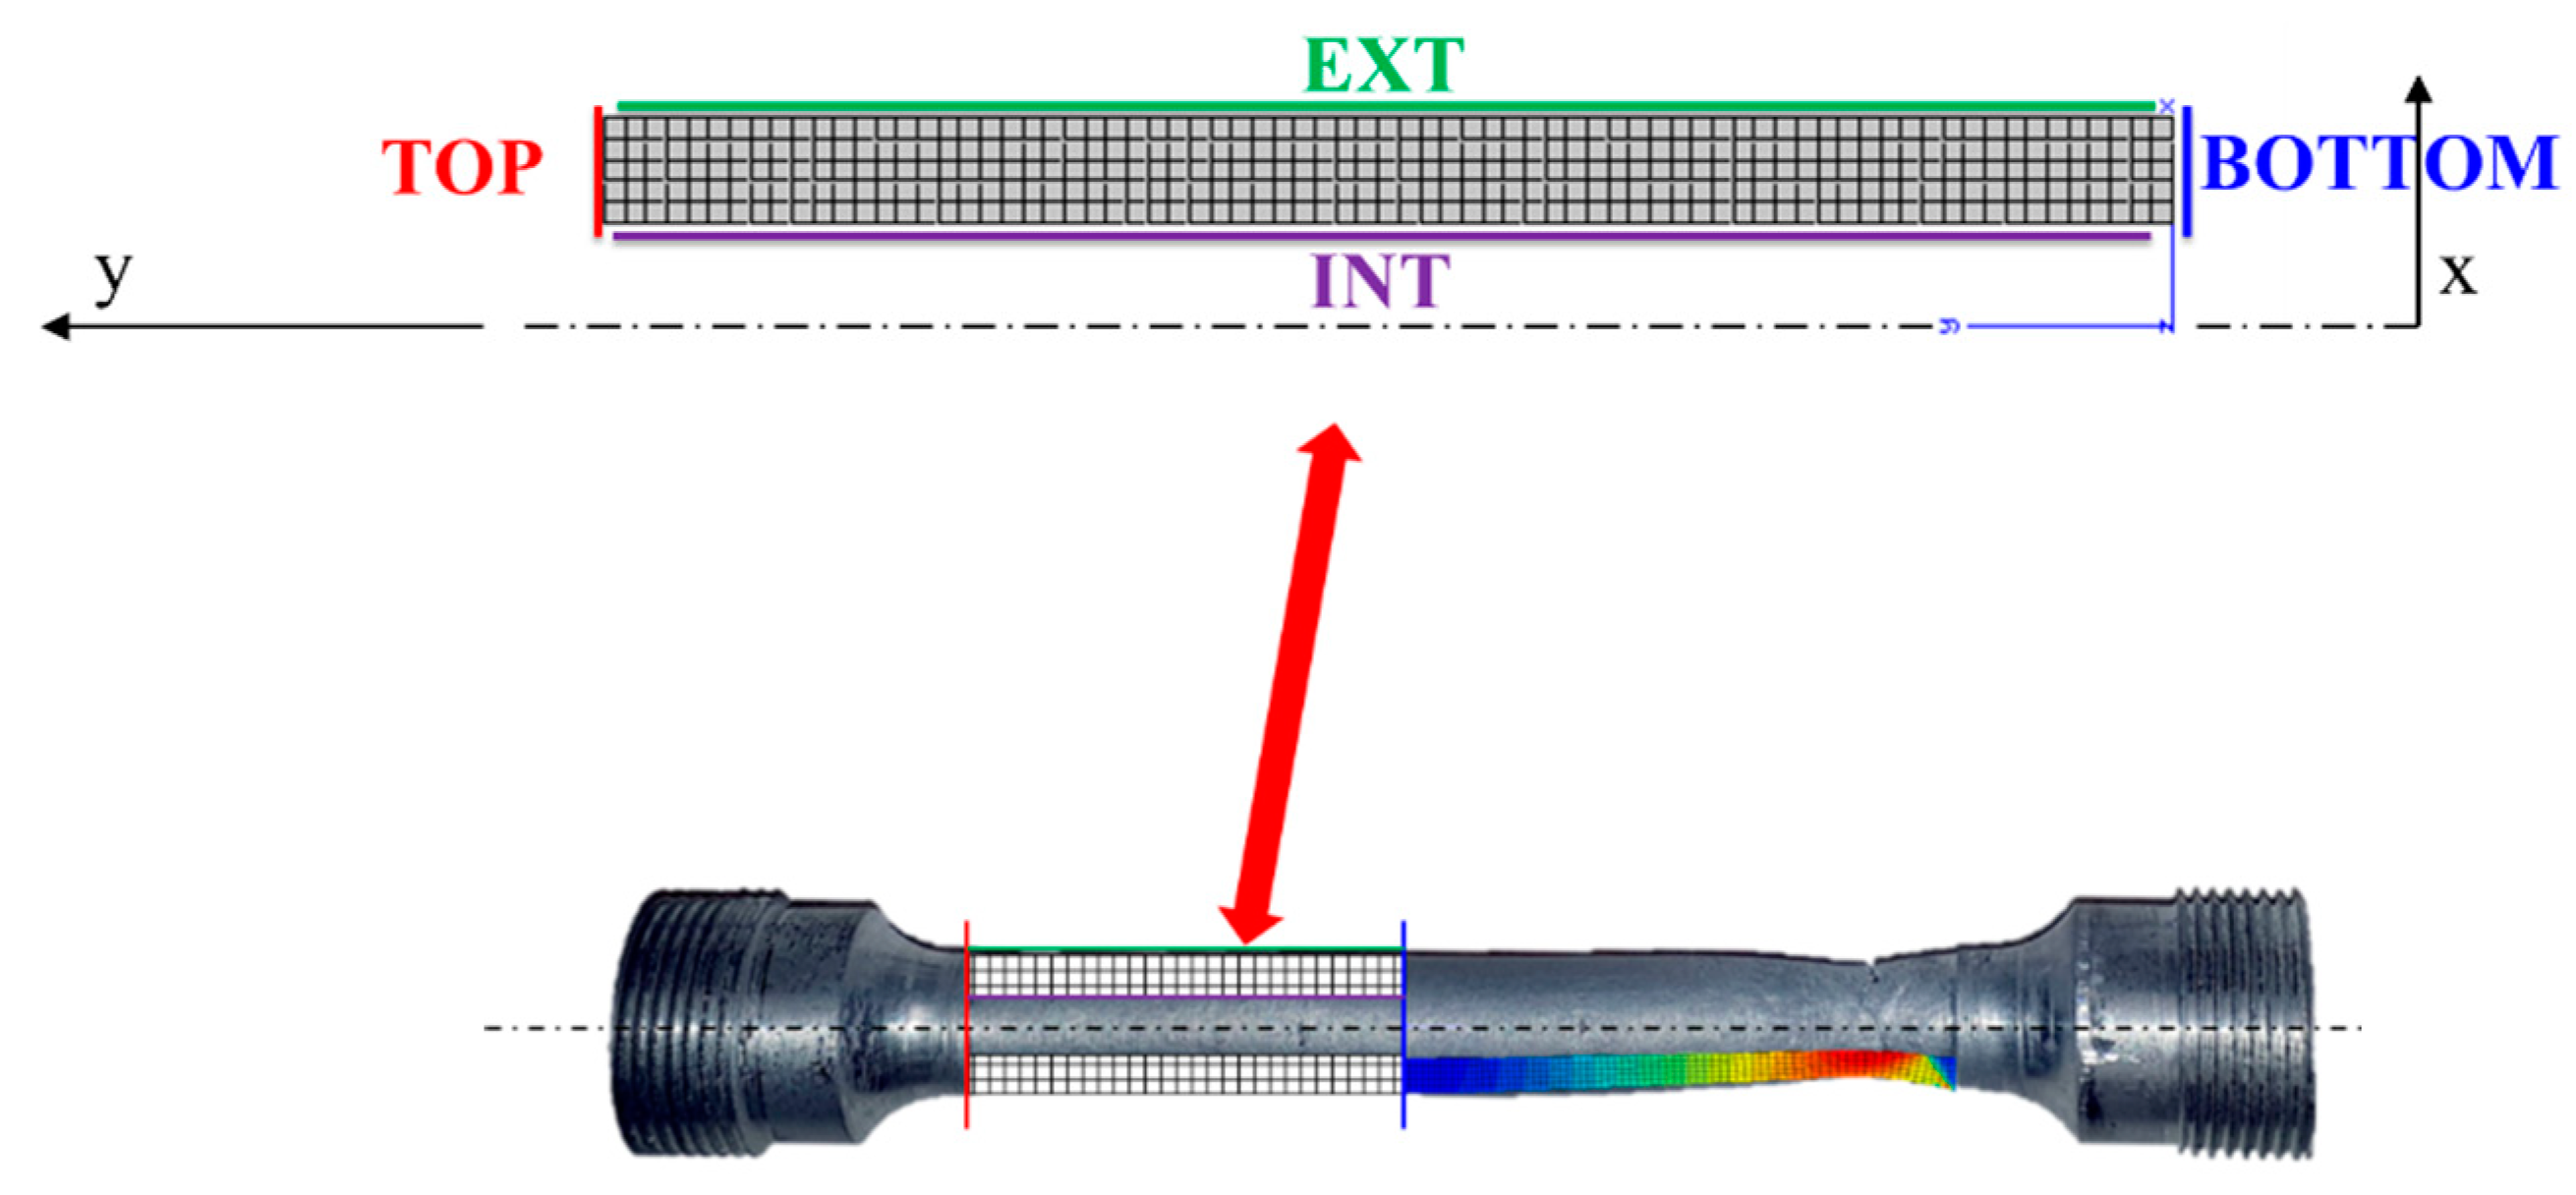
2.2.5. Z-Set Thermomechanical Modelling
3. Results
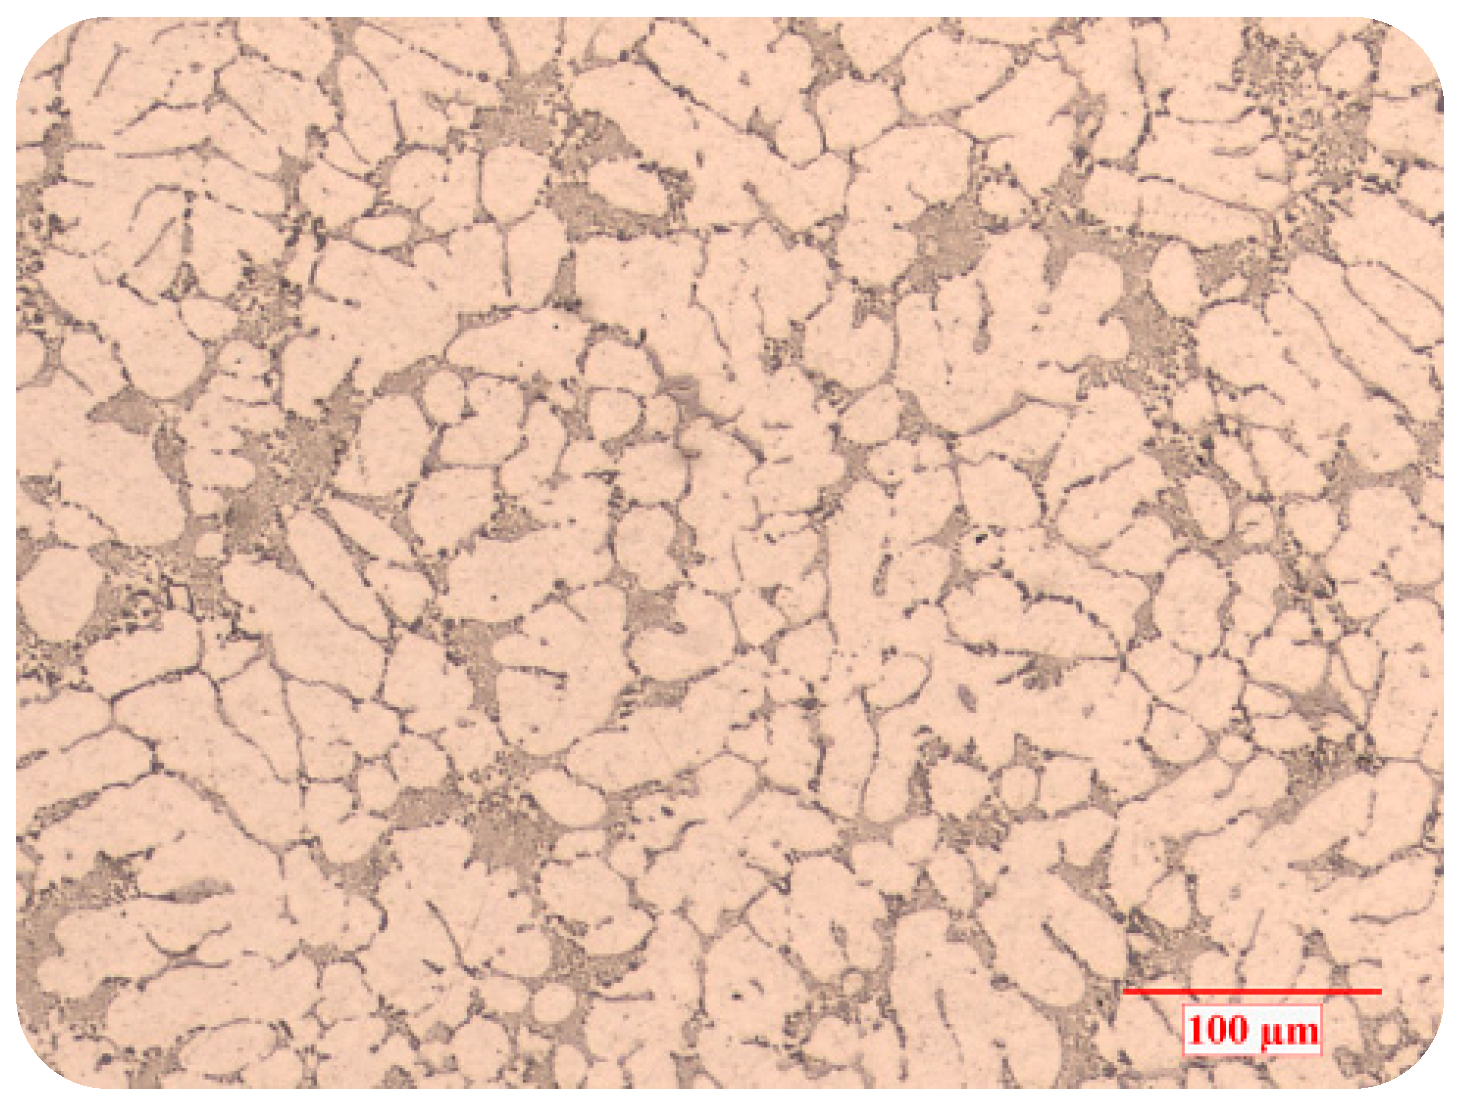
3.1. Metallurgical Characterization
3.2. LM&C Behavior Law from Isothermal LCF and Creep Testing
3.3. Thermoelectric Model
3.4. Thermomechanical Model
4. Discussion
5. Conclusions
Author Contributions
Funding
Institutional Review Board Statement
Informed Consent Statement
Data Availability Statement
Acknowledgments
Conflicts of Interest
Appendix A. Comsol Simulation
Appendix A1. Generalities


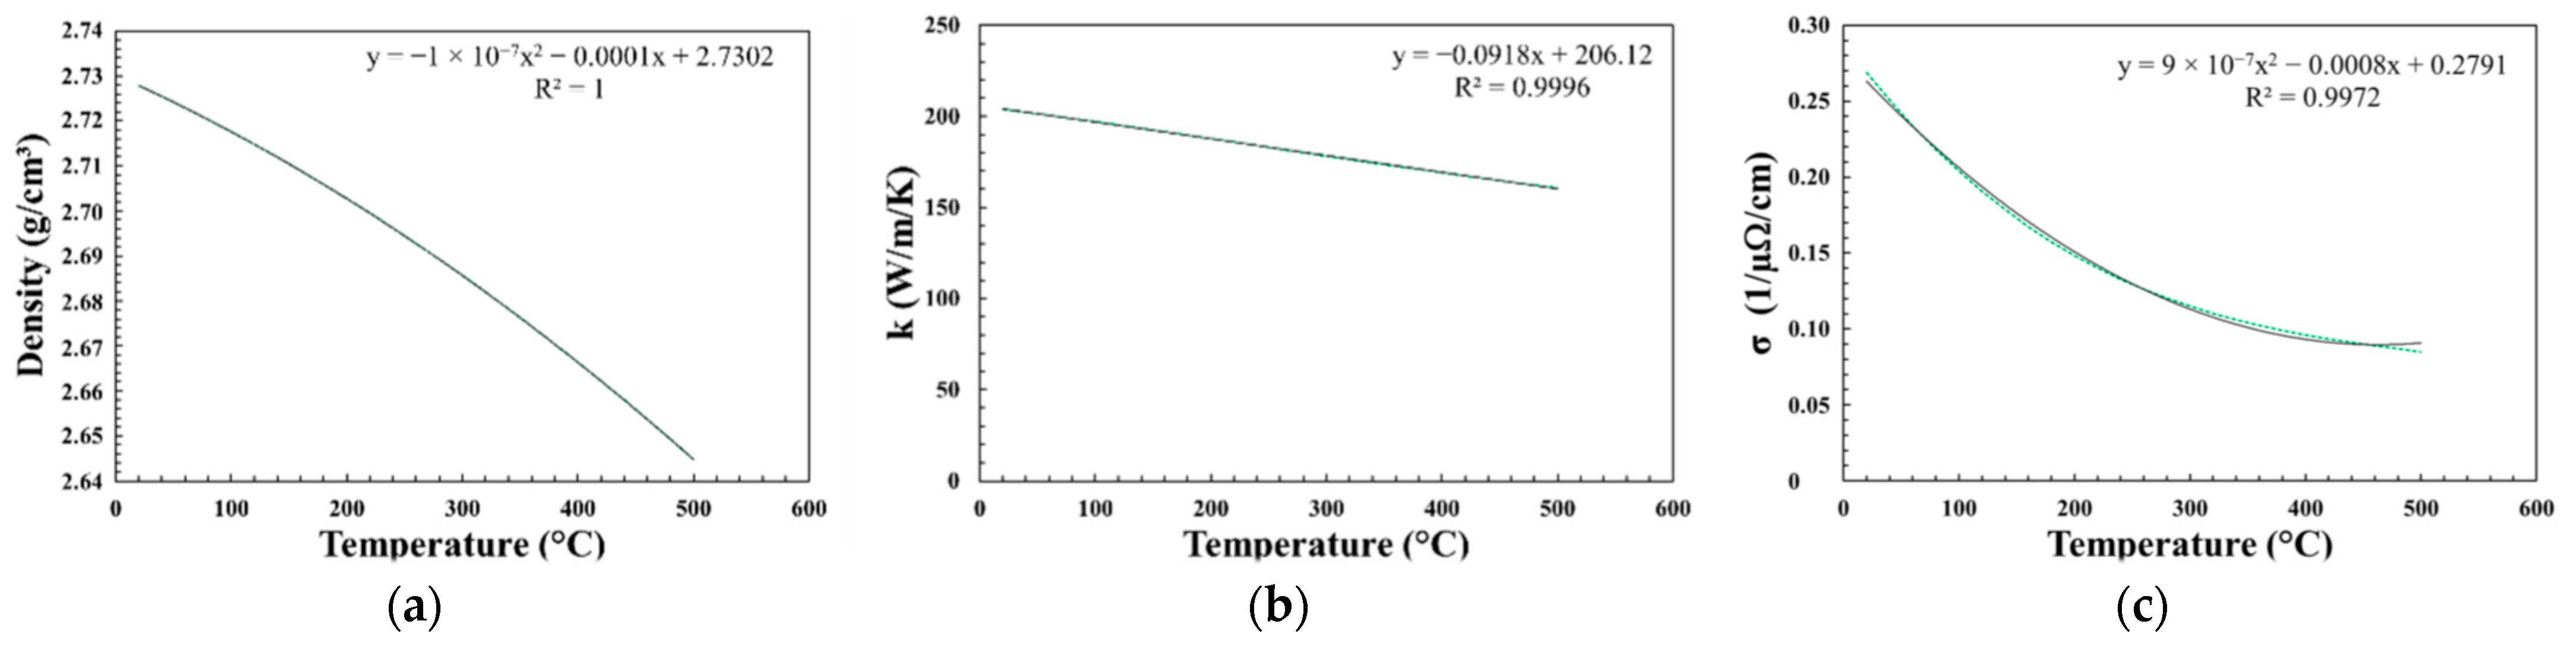
Appendix A2. Material Parameters


| Material | Density | k | σ | Cp | Emissivity |
|---|---|---|---|---|---|
| Copper clip | 8960 kg/m3 | 400 W/m/K | 5.998 × 10⁷ S/m | 385 J/kg/K | - |
| Steel jaws | 7850 kg/m3 | 44.5 W/m/K | 4.032 × 10⁶ S/m | 475 J/kg/K | - |
| Air | - | - | - | - | 0.2 |
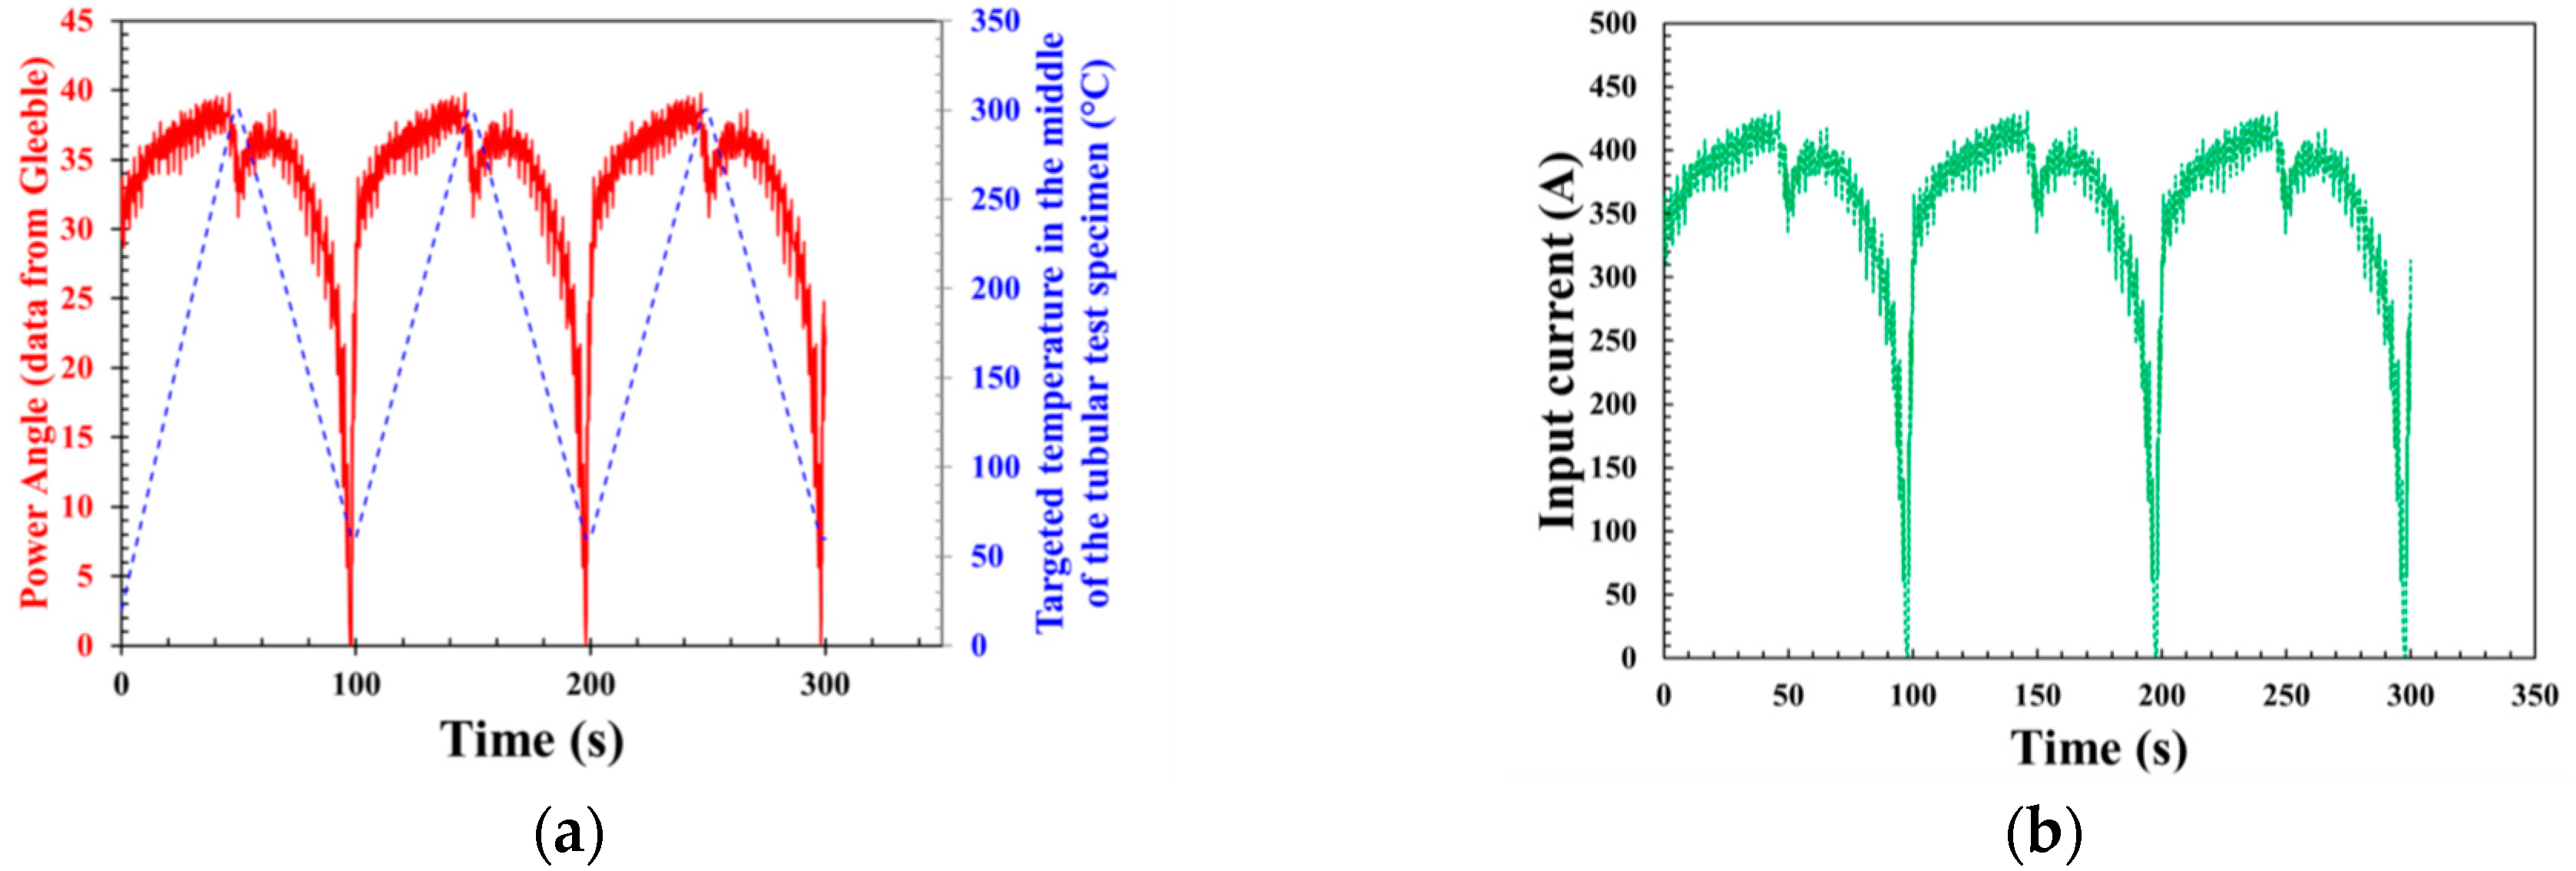
Appendix A3. Electrical Parameters


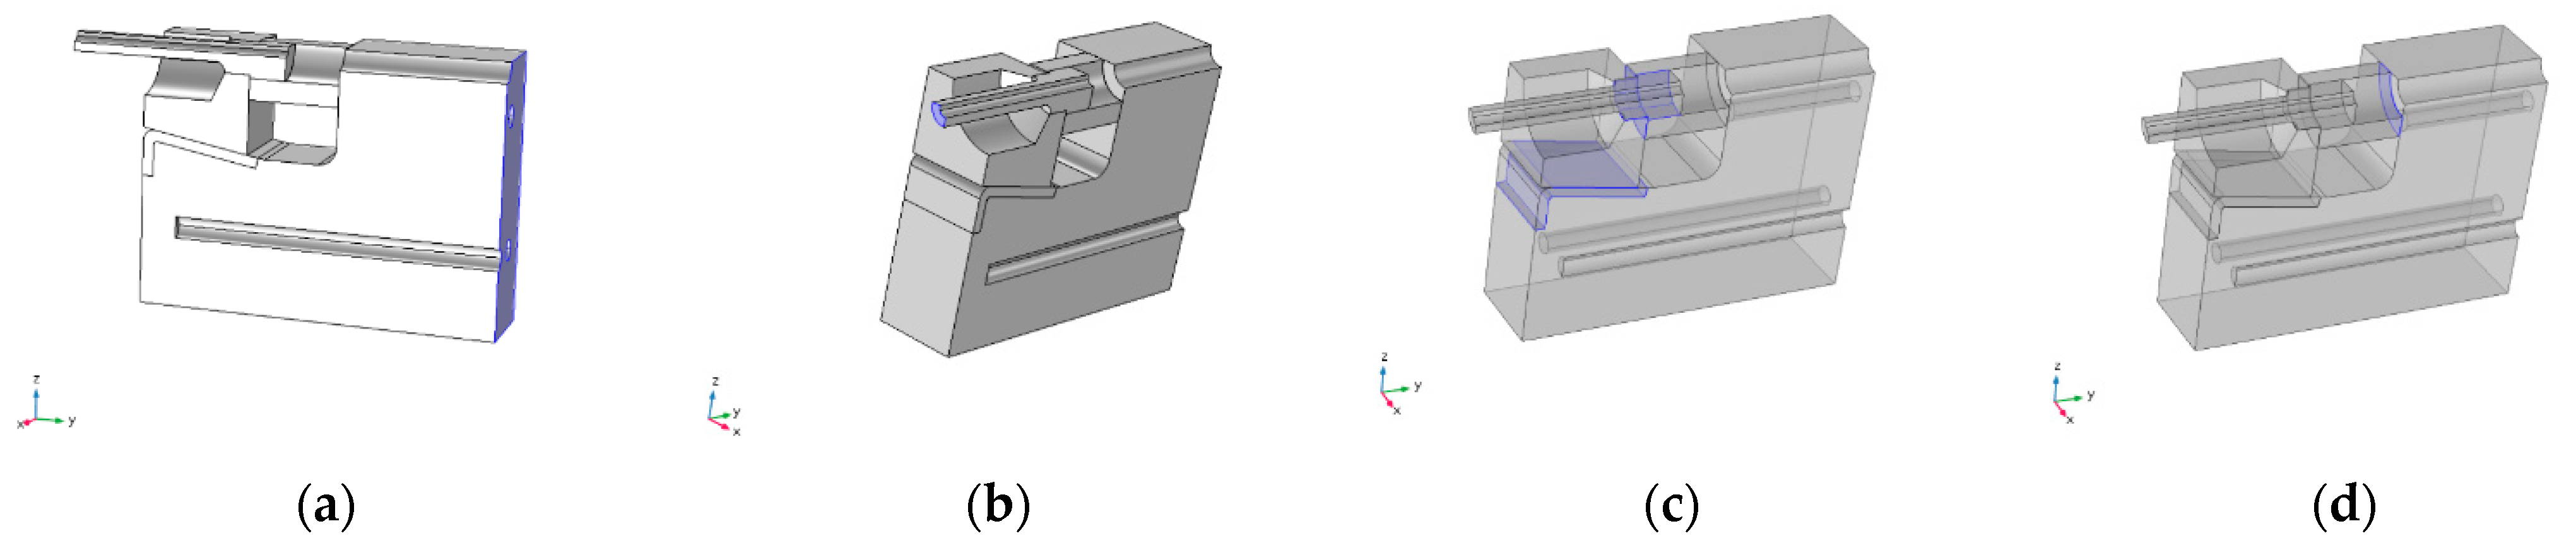
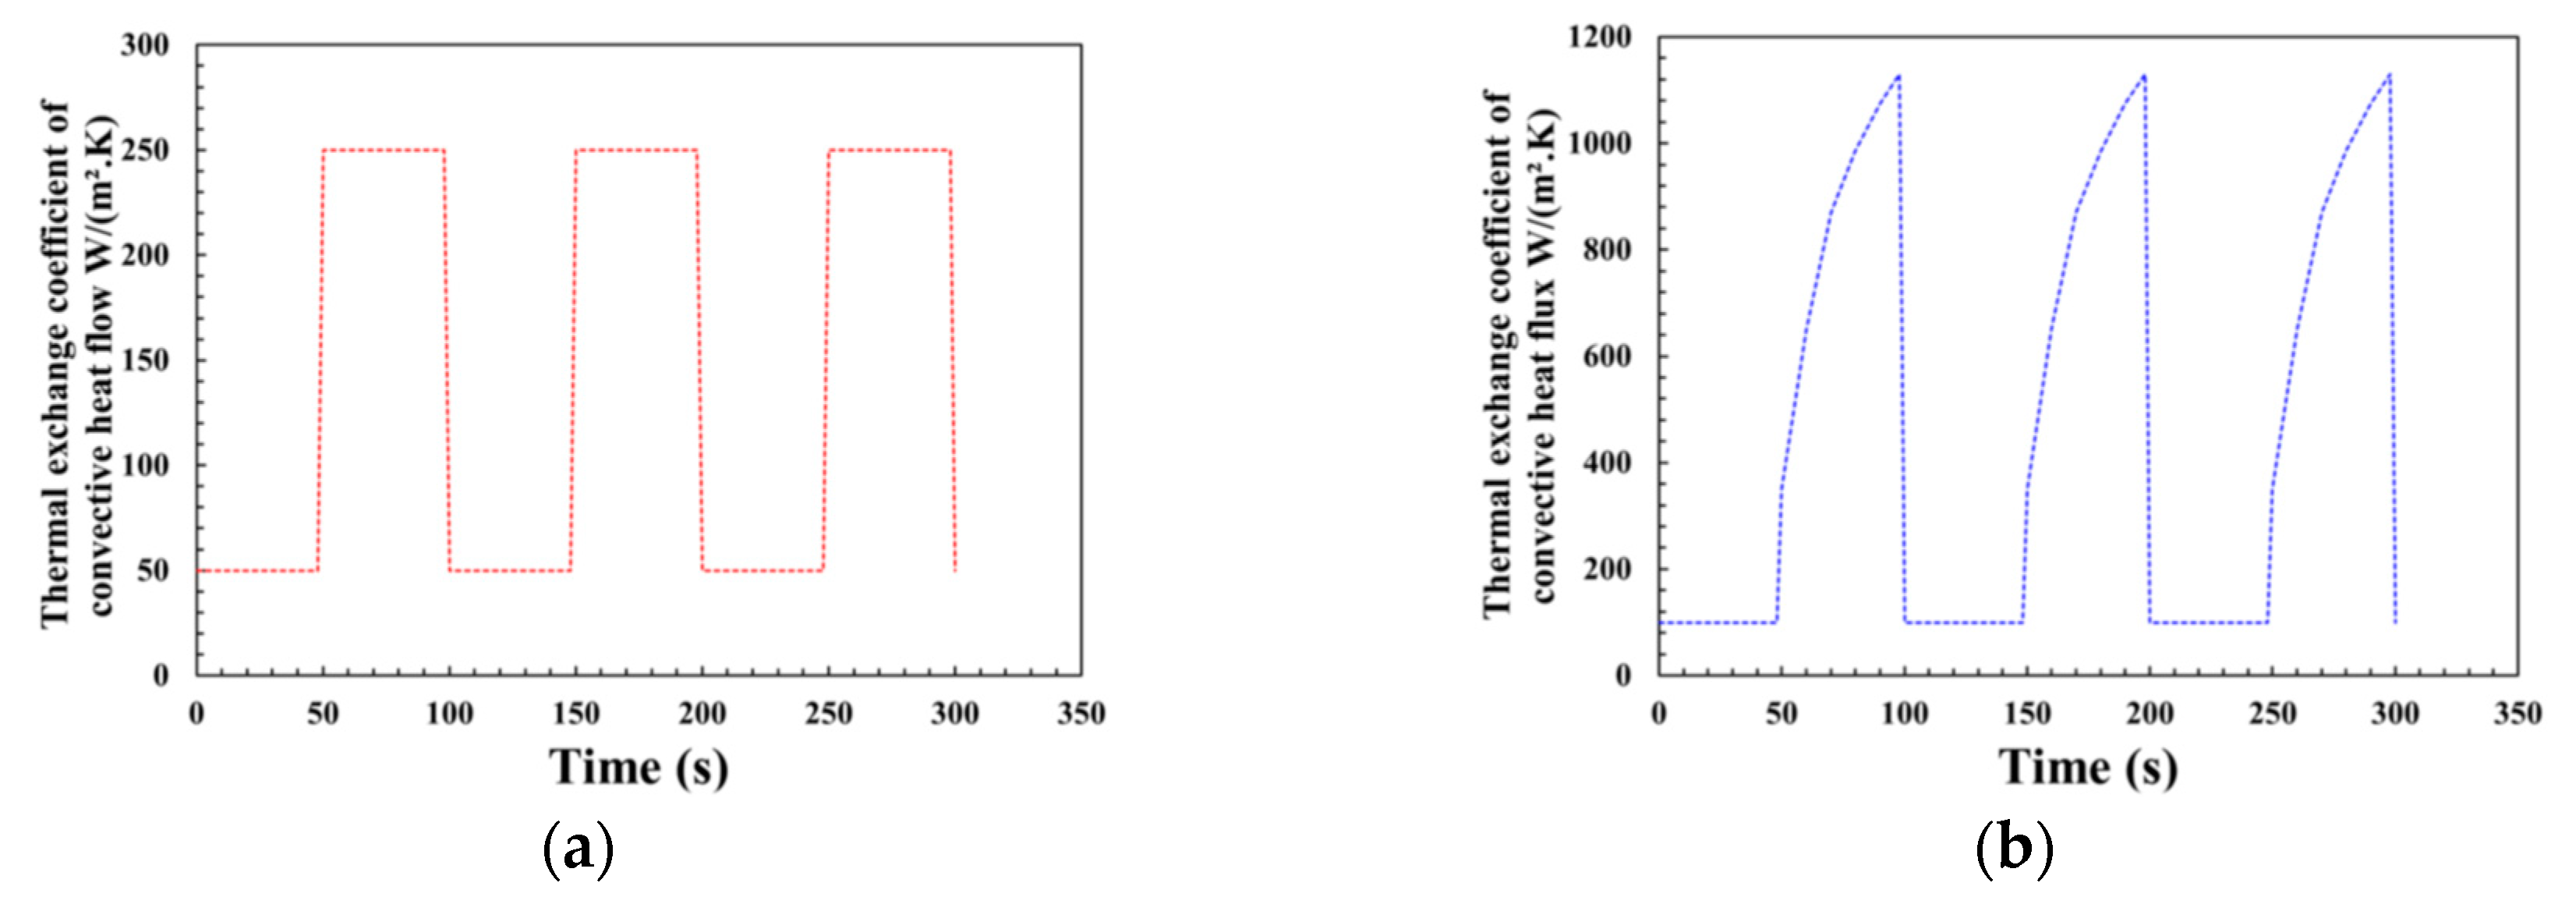
Appendix A4. Thermal Parameters
| Convective Heat Flow | Thermal Exchange Coefficient | Surface |
|---|---|---|
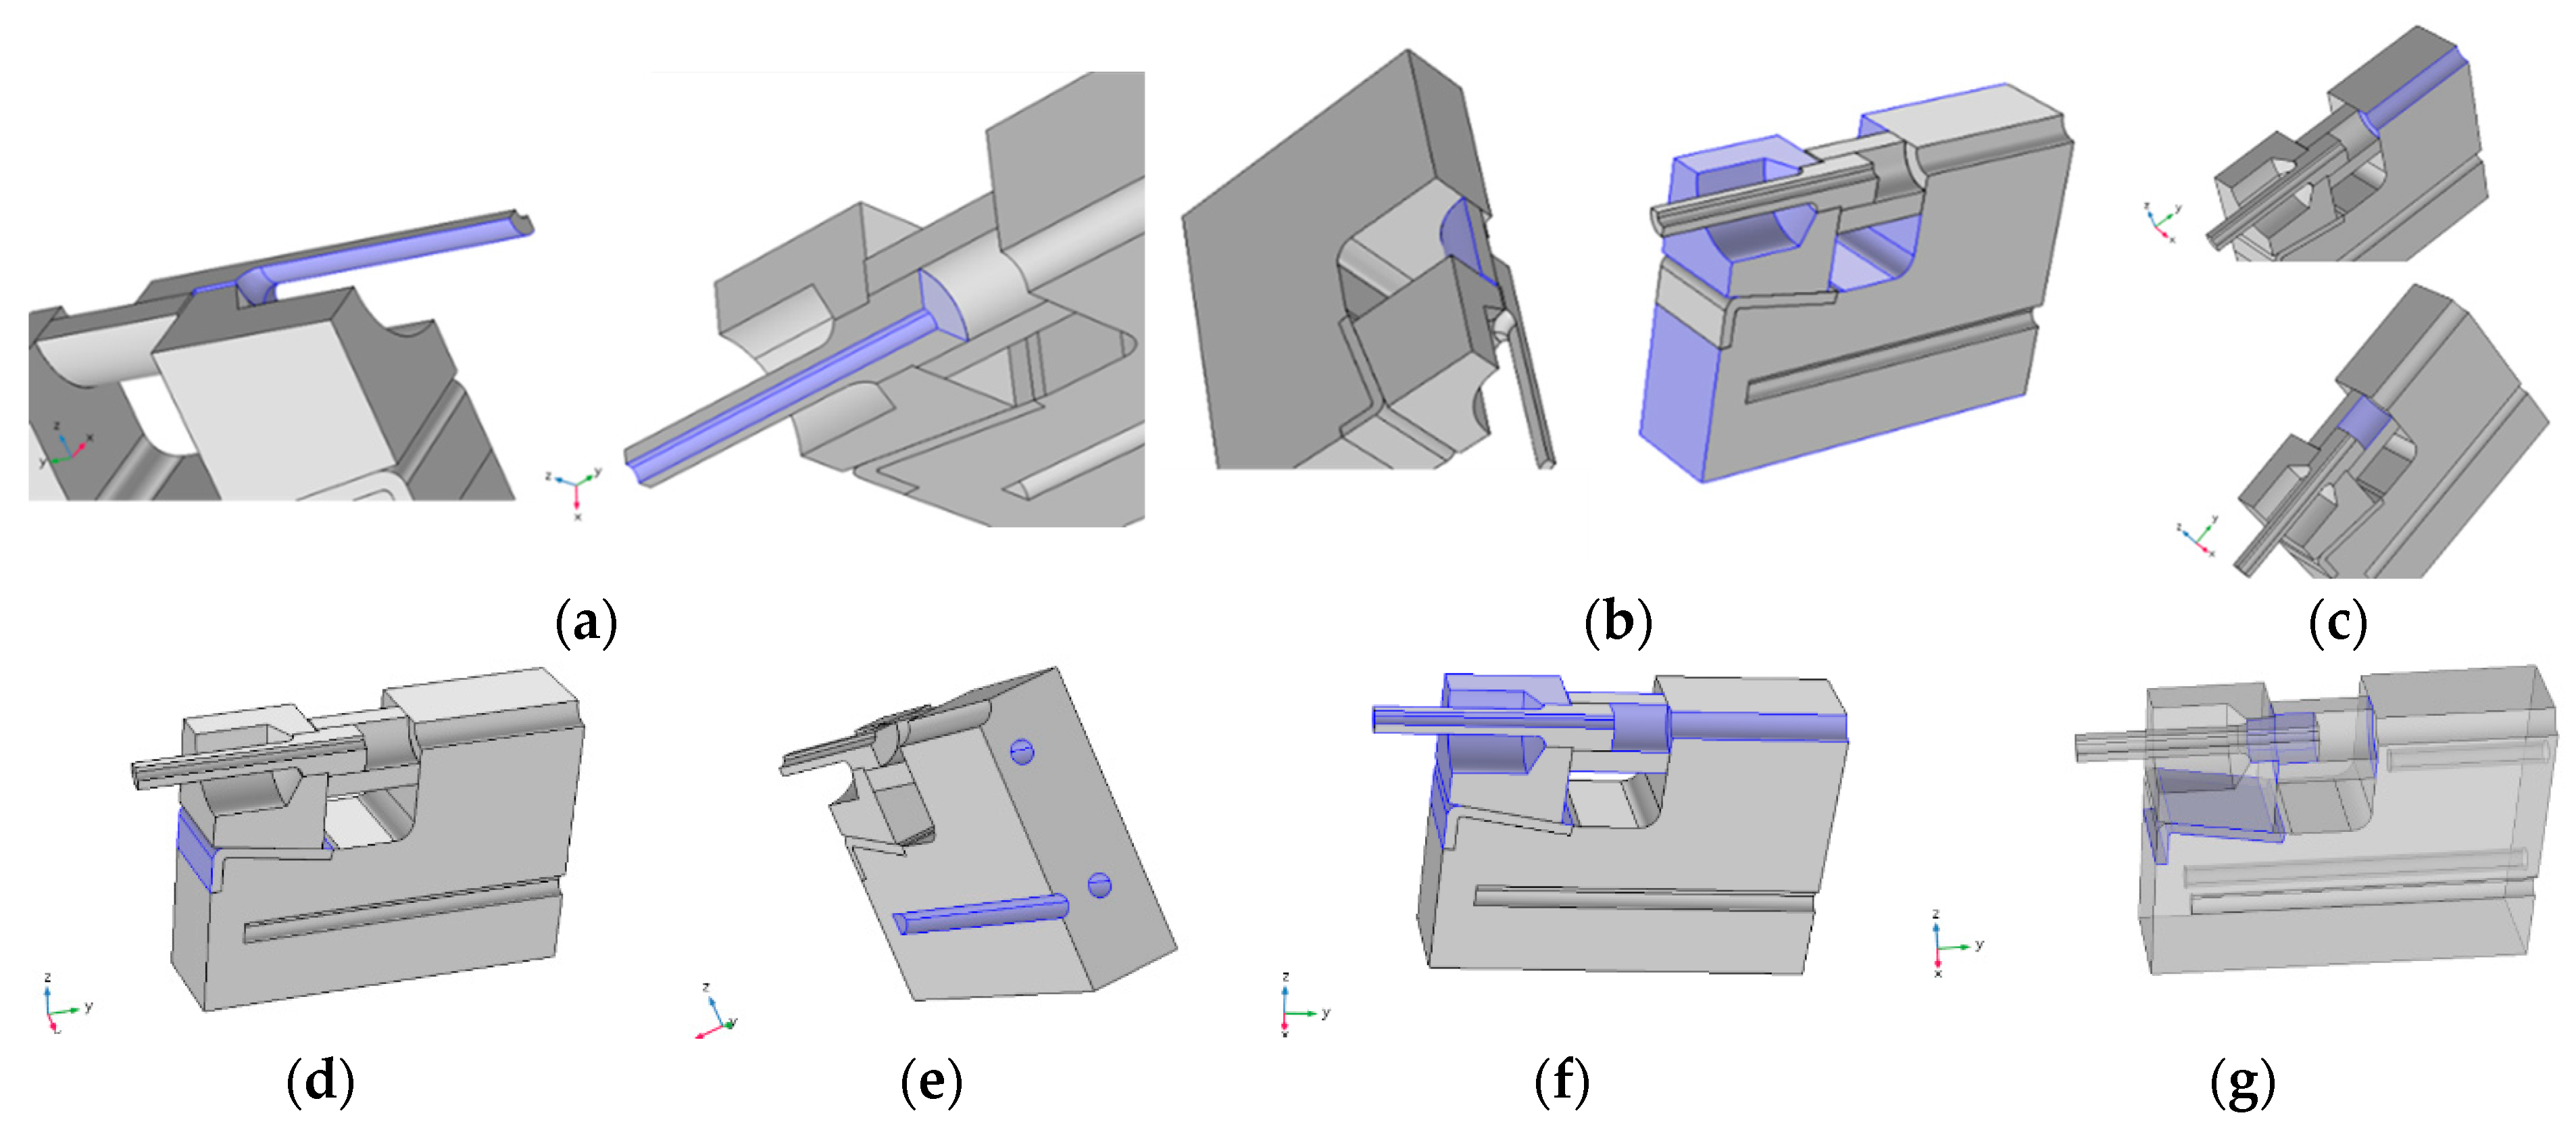
| External surface of the specimen | 100 W/(m2.K) | Figure A6a |
| External surface of clamp and nut | 50 W/(m2.K) | Figure A6b |
| External surface of copper clip | 125 W/(m2.K) | Figure A6d |


Appendix B. Z-Set Simulation

References
- Huter, P.; Oberfrank, S.; Grün, F.; Stauder, B. Thermo-mechanical fatigue influence of copper and silicon on hypo-eutectic Al–Si–Cu and Al–Si–Mg cast alloys used in cylinder heads. Int. J. Fatigue 2016, 88, 142–155. [Google Scholar] [CrossRef]
- Huter, P.; Renhart, P.; Oberfrank, S.; Schwab, M.; Grün, F.; Stauder, B. High- and low-cycle fatigue influence of silicon, copper, strontium and iron on hypo-eutectic Al–Si–Cu and Al–Si–Mg cast alloys used in cylinder heads. Int. J. Fatigue 2016, 82, 588–601. [Google Scholar] [CrossRef]
- Firouzdor, V.; Rajabi, M.; Nejati, E.; Khomamizadeh, F. Effect of microstructural constituents on the thermal fatigue life of A319 aluminum alloy. Mater. Sci. Eng. A 2007, 454–455, 528–535. [Google Scholar] [CrossRef]
- Garat, M.; Laslaz, G. Improved Aluminium Alloys for Common Rail Diesel Cylinder Heads. AFS Trans. Am. Foundry Soc. 2007, 21, 1–8. [Google Scholar]
- Grieb, M.B.; Christ, H.J.; Plege, B. Thermomechanical fatigue of cast aluminium alloys for cylinder head applications—Experimental characterization and life prediction. Procedia Eng. 2010, 2, 1767–1776. [Google Scholar] [CrossRef]
- Tabibian, S.; Charkaluk, E.; Constantinescu, A.; Szmytka, F.; Oudin, A. TMF-LCF life assessment of a Lost Foam Casting 319 aluminum alloy. Int. J. Fatigue 2013, 53, 75–81. [Google Scholar] [CrossRef]
- Qin, J.; Racine, D.; Liu, K.; Chen, X.-G. Strain-controlled thermo-mechanical fatigue testing of aluminum alloys using the Gleeble® 3800 system. In Proceedings of the 16th International Conference on Aluminum Alloys ICAA16, Montreal, QC, Canada, 17 June 2018. [Google Scholar]
- Smith, T.J.; Maier, H.J.; Sehitoglu, H.; Fleury, E.; Allison, J. Modeling High-Temperature Stress-Strain Behavior of Cast Aluminum Alloys. Metall. Mater. Trans. A 1999, 30A, 133–146. [Google Scholar] [CrossRef]
- Toyoda, M.; Toda, H.; Ikuno, H.; Kobayashi, T.; Kobayashi, M.; Matsuda, K. Preferential orientation of precipitates during thermomechanical cyclic loading in an aluminum alloy. Scr. Mater. 2007, 56, 377–380. [Google Scholar] [CrossRef]
- Zhu, A.W.; Starke, E.A. Stress aging of Al-xCu alloys: Eperiments. Acta Mater. 2001, 49, 2285–2295. [Google Scholar] [CrossRef]
- Lin, Y.C.; Xia, Y.-C.; Jiang, Y.-Q.; Zhou, H.-M.; Li, L.-T. Precipitation hardening of 2024-T3 aluminum alloy during creep aging. Mater. Sci. Eng. A 2013, 565, 420–429. [Google Scholar] [CrossRef]
- Beck, T.; Henne, I.; Löhe, D. Lifetime of cast AlSi6Cu4 under superimposed thermal-mechanical fatigue and high-cycle fatigue loading. Mater. Sci. Eng. A 2008, 483, 382–386. [Google Scholar] [CrossRef]
- Beck, T. Damage mechanism of cast Al-Si-Mg alloys under superimposed thermal-mechanical fatigue and high-cycle fatigue loading. Mater. Sci. Eng. A 2007, 468, 184–192. [Google Scholar] [CrossRef]
- Luft, J.; Beck, T.; Löhe, D. Thermal-Mechanical Fatigue Behaviour of the cast Aluminum alloy AlSi7Mg. In Proceedings of the 5th International Conference on Low Cycle Fatigue, Berlin, Germany, 9–11 September 2003; pp. 219–225. [Google Scholar]
- Azadi, M.; Shirazabad, M.M. Heat treatment effect on thermo-mechanical fatigue and low cycle fatigue behaviors of A356.0 aluminum alloy. Mater. Des. 2013, 45, 279–285. [Google Scholar] [CrossRef]
- Delprete, C.; Sesana, R.; Vercelli, A. Multiaxial damage assessment and life estimation: Application to an automotive exhaust manifold. Procedia Eng. 2010, 2, 725–734. [Google Scholar] [CrossRef][Green Version]
- Toda, H.; Katano, J.; Kobayashi, T.; Akahori, T.; Niinomi, M. Assessment of Thermo-Mechanical Fatigue Behaviors of Cast Al-Si Alloys by Experiments and Multi-Step Numerical Simulation. Mater. Trans. 2005, 46, 111–117. [Google Scholar] [CrossRef][Green Version]
- Merhy, E.; Rémy, L.; Maitournam, H.; Augustins, L. Crack growth characterisation of A356-T7 aluminum alloy under thermo-mechanical fatigue loading. Eng. Fract. Mech. 2013, 110, 99–112. [Google Scholar] [CrossRef]
- Tsuyoshi, T.; Sasaki, K. Low cycle thermal fatigue of aluminum alloy cylinder head in consideration of changing metrology microstructure. Procedia Eng. 2010, 2, 767–776. [Google Scholar] [CrossRef]
- Wang, M.; Pang, J.C.; Zhang, M.X.; Liu, H.Q.; Li, S.X.; Zhang, Z.F. Thermo-mechanical fatigue behavior and life prediction of the Al-Si piston alloy. Mater. Sci. Eng. A 2018, 715, 62–72. [Google Scholar] [CrossRef]
- Kliemt, C. Thermo-Mechanical Fatigue of Cast Aluminium Alloys for Engine Applications under Severe Conditions. Ph.D. Thesis, School of Engineering and Physical Sciences, Heriot-Watt University, Edimbourg, UK, 2012. [Google Scholar]
- Bradaskja, B.; Koruza, J.; Fazarinc, M.; Knap, M.; Turk, R. A laboratory test for simulation of solidification on Gleeble 1500D thermo-mechanical simulator. RMZ Mater. Geoenvironment 2008, 55, 31–40. [Google Scholar]
- Fabregue, D. Microstructure et Fissuration à Chaud lors du Soudage Laser d’alliages d’aluminium 6000. Ph.D. Thesis, Institut National Polytechnique de Grenoble, Grenoble, France, 2004. [Google Scholar]
- Han, Q.; Hassan, M.I.; Viswanathan, S.; Saito, K. The Reheating-Cooling Method: A Technique for Measuring Mechanical Properties in the Nonequilibrium Mushy Zones of Alloys. Metall. Mater. Trans. A 2005, 36A, 2073–2080. [Google Scholar] [CrossRef]
- Phillion, A.B.; Cockcroft, S.L.; Lee, P.D. A new methodology for measurement of semi-solid constitutive behavior and its application to examination of as-cast porosity and hot tearing in aluminum alloys. Mater. Sci. Eng. A 2008, 491, 237–247. [Google Scholar] [CrossRef]
- Zhang, C.; Bellet, M.; Bobadilla, M.; Shen, H.; Liu, B. A Coupled Electrical-Thermal-Mechanical Modeling of Gleeble Tensile Tests for Ultra-High-Strength Steel at a High Temperature. Metall. Mater. Trans. A 2010, 41, 2304–2317. [Google Scholar] [CrossRef]
- Palama Bongo, F. Caractérisation du Comportement Mécanique de l’alliage A356 à l’état Semi-Solide. Ph.D. Thesis, Université de Technologie de Compiègne, Compiègne, France, 2014. [Google Scholar]
- Colley, L.J.; Wells, M.A.; Maijer, D.M. Tensile properties of as-cast aluminum alloy AA5182 close to the solidus temperature. Mater. Sci. Eng. A 2004, 386, 140–148. [Google Scholar] [CrossRef]
- Martinez, R. Modélisation Multi-échelles du Comportement d’un Alliage d’aluminium de Fonderie; Institut de Chimie et des Matériaux Paris EST, Université Paris-Est Créteil: Paris, France, 2012. [Google Scholar]
- Barlas, B. Etude du Comportement et de l’endommagement en Fatigue d’alliages d’aluminium de Fonderie; Sciences et Génie des Matériaux, Ecole Nationale Supérieure des Mines de Paris: Paris, France, 2004. [Google Scholar]
- Lemaître, J.; Chaboche, J.L. Mechanics of Solid Materials; Cambridge University Press: Cambridge, UK, 1990. [Google Scholar]
- Samuel, E.; Samuel, A.M.; Doty, H.W.; Valtierra, S.; Samuel, F.H. Intermetallic phases in Al–Si based cast alloys: New perspective. Int. J. Cast Met. Res. 2013, 27, 107–114. [Google Scholar] [CrossRef]
- Heugue, P.; Larouche, D.; Breton, F.; Massinon, D.; Martinez, R.; Chen, X.-G. Precipitation Kinetics and Evaluation of the Interfacial Mobility of Precipitates in an AlSi7Cu3.5Mg0.15 Cast Alloy with Zr and V Additions. Metals 2017, 9, 777. [Google Scholar] [CrossRef]
- Guillot, I.; Barlas, B.; Cailletaud, G.; Clavel, M.; Massinon, D. Thermomechanical fatigue and aging of cast aluminum alloy: A link between numerical modeling and microstructural approach. In European Structural Integrity Society; Rémy, L., Petit, J., Eds.; Elsevier: Amsterdam, The Netherlands, 2002; pp. 75–84. [Google Scholar]
- Andersson, J.-O.; Helander, T.; Hoglund, L.; Shi, P.; Sundman, B. Thermo-Calc & DICTRA, computational tools for materials science. Calphad 2022, 26, 273–312. [Google Scholar]
- T. Ltd. (Ed.) TTAL7, TT Al-Based Alloys Database; Version 7.0; Surrey Technology Center: Guildford, UK, 2010. [Google Scholar]
- Larouche, D. Computation of solidification paths in multiphase alloys with back-diffusion. Calphad 2007, 31, 490–504. [Google Scholar] [CrossRef]


| AlSi7Cu3.5Mg0.15 (Mn, Zr, V) | Elements | Si | Cu | Mg | Fe | Ti | Mn | Zr | V | Sr | Zn |
| % wt. | 6.86 | 3.41 | 0.14 | 0.12 | 0.11 | 0.15 | 0.12 | 0.11 | 0.013 | 0.014 |
| Metallurgical Condition | Test T °C | Applied Stress (MPa) |
|---|---|---|
| 200 | 138 | |
| T7 | 148 | |
| S 505 °C during 4 h | 158 | |
| Water quench (20 °C) | 300 | 50 |
| Aging 200 °C during 5 h | 55 | |
| 60 | ||
| 200 | 108 | |
| T7S | 118.5 | |
| S 505 °C during 4 h | 138 | |
| Water quench (20 °C) | 300 | 50 |
| Aging 200 °C during 5 h | 55 | |
| Holding at 300 °C during 100 h | 60 |
| Temperature (°C) | Isotropic Elastic | Block 1—EV (σy = 0) | Block 2—EP | |||||||
|---|---|---|---|---|---|---|---|---|---|---|
| (υ = 0.3) E (MPa) | n | K (MPa·s1/n) | C1 (MPa) | D1 | C2 (MPa) | D2 | σy (MPa) | Q | b | |
| 20 | 72,200 | 20.00 | 500.00 | 280,000 | 17,000 | 120,000 | 850 | 130 | −15 | 1.5 |
| 200 | 69,904 | 13.74 | 536.91 | 542,500 | 10,190 | 50,500 | 650 | 107.5 | −80 | 0.5 |
| 300 | 55,000 | 10.26 | 557.42 | 688,333 | 6406 | 11,889 | 567 | 40 | −116 | 0.15 |
| Temperature (°C) | Isotropic Elastic | Block 1—EV (σy = 0) | Block 2—EP | |||||||
|---|---|---|---|---|---|---|---|---|---|---|
| (υ = 0.3) E (MPa) | n | K (MPa·s1/n) | C1 (MPa) | D1 | C2 (MPa) | D2 | σy (MPa) | Q | b | |
| 20 | 72,200 | 20.00 | 500.00 | 420,000 | 9100 | 31,000 | 550 | 33 | 5 | 0.55 |
| 300 | 58,119 | 3.3 | 19,173.83 | 225,000 | 9000 | 4000 | 300 | 22.5 | −12.5 | 0.15 |
Publisher’s Note: MDPI stays neutral with regard to jurisdictional claims in published maps and institutional affiliations. |
© 2022 by the authors. Licensee MDPI, Basel, Switzerland. This article is an open access article distributed under the terms and conditions of the Creative Commons Attribution (CC BY) license (https://creativecommons.org/licenses/by/4.0/).
Share and Cite
Heugue, P.; Larouche, D.; Breton, F.; Martinez, R.; Chen, X.-G.; Massinon, D. Modelling of Strain-Controlled Thermomechanical Fatigue Testing of Cast AlSi7Cu3.5Mg0.15 (Mn, Zr, V) Alloy for Different Aging Conditions. Metals 2022, 12, 1258. https://doi.org/10.3390/met12081258
Heugue P, Larouche D, Breton F, Martinez R, Chen X-G, Massinon D. Modelling of Strain-Controlled Thermomechanical Fatigue Testing of Cast AlSi7Cu3.5Mg0.15 (Mn, Zr, V) Alloy for Different Aging Conditions. Metals. 2022; 12(8):1258. https://doi.org/10.3390/met12081258
Chicago/Turabian StyleHeugue, Pierre, Daniel Larouche, Francis Breton, Rémi Martinez, X.-Grant Chen, and Denis Massinon. 2022. "Modelling of Strain-Controlled Thermomechanical Fatigue Testing of Cast AlSi7Cu3.5Mg0.15 (Mn, Zr, V) Alloy for Different Aging Conditions" Metals 12, no. 8: 1258. https://doi.org/10.3390/met12081258
APA StyleHeugue, P., Larouche, D., Breton, F., Martinez, R., Chen, X.-G., & Massinon, D. (2022). Modelling of Strain-Controlled Thermomechanical Fatigue Testing of Cast AlSi7Cu3.5Mg0.15 (Mn, Zr, V) Alloy for Different Aging Conditions. Metals, 12(8), 1258. https://doi.org/10.3390/met12081258