Article

Influence of Plastic Strain Control on Martensite Evolution and Fatigue Life of Metastable Austenitic Stainless Steel †

Institute of Materials Engineering, Technische Universität Bergakademie Freiberg, D-09599 Freiberg, Germany
*
Author to whom correspondence should be addressed.
Dedicated to Hans-Jürgen Christ, Universität Siegen, Germany, for his valuable contributions to the understanding of fatigue and fracture of metals and alloys.
Metals 2022, 12(7), 1222; https://doi.org/10.3390/met12071222
Submission received: 31 May 2022 / Revised: 8 July 2022 / Accepted: 15 July 2022 / Published: 19 July 2022

Abstract

:
Metastable austenitic stainless steel was investigated during fatigue tests under strain control with either constant total or constant plastic strain amplitude. Two different material conditions with coarse-grained and ultrafine-grained microstructure were in focus. The influence of plastic strain control of the fatigue test on both the martensitic phase transformation as well as on the fatigue lives is discussed. In addition, an approach for calculating the Coffin–Manson–Basquin parameters to estimate fatigue lives based on strain-controlled tests at constant total strain amplitudes is proposed for materials undergoing a strong secondary hardening due to martensitic phase transformation.

1. Introduction

The first investigations on the fatigue failure during cyclic loading of metallic materials carried out by Wöhler in the 19th century revealed that the fatigue life is a function of the applied cyclic stress. However, since that time, a great increase in knowledge on different factors influencing the fatigue life was gained. Thus, the influence of cyclic plastic strain on the crack initiation was intensively studied, resulting in the well-known Coffin–Manson approach [1,2,3], which showed that the fatigue life, particularly in the low-cycle fatigue (LCF) regime, is governed by the cyclic plastic strain. Later on, it was shown by Lukas et al. [4] that this relationship can be extended also to the high-cycle fatigue (HCF) regime.
Nevertheless, the majority of fatigue life investigations are still performed under stress control, or at least under strain control at constant total strain amplitude. However, the performance of stress-controlled or total strain-controlled fatigue tests disregards changes in the cyclic plastic strain caused by cyclic hardening or softening of materials. In particular, for ductile metallic materials in single (copper, e.g., [5,6], nickel [7]) and polycrystalline (AISI 316L [8], nickel [9], copper [6], aluminum [10]) conditions, a broad variety of investigations were performed, demonstrating the influence of cyclic plastic strain on the dislocation arrangement in the microstructure and, therefore, also on the crack initiation and propagation. However, in the case of materials undergoing a strong cyclic hardening, such as metastable austenitic stainless steels, the majority of fatigue life investigations are performed under stress control or under strain control at constant total strain amplitude [11]. This is caused mainly by the fact that these materials yield a significant secondary cyclic hardening caused by the martensitic phase transformation (e.g., [12,13]). This hardening behavior impedes the performance of fatigue tests under strain control at constant plastic strain amplitude since the cyclic stress vs. plastic strain hysteresis loop is changing from cycle to cycle due to the influence of hardening. Moreover, the specimen stiffness as well as the Young’s modulus is changing during cyclic deformation due to the phase change from austenite to α’-martensite, making fatigue tests even more complex.
Furthermore, it is well known that the grain size has a significant influence on fatigue lives, as well. Thus, investigations on the fatigue lives of coarse-grained (CG) and ultrafine-grained (UFG) metallic materials have been the focus of scientific interest for long time [14,15]. It is well known and commonly accepted from total strain vs. fatigue life diagrams, particularly for pure materials such as copper [16,17,18], aluminum [19] or nickel [20], that CG microstructures yield superior fatigue lives in the LCF regime, whereas in the HCF regime, the fatigue lives of UFG microstructures are superior compared to CG material conditions [15]. This behavior is explained by the increased strength and the loss of ductility of UFG microstructures compared to their CG counterparts.
To date, however, only few papers are known [21,22,23,24,25,26,27,28,29,30] to focus on the influence of grain refinement on the fatigue lives of metastable austenitic stainless steels. The results of these investigations can be summarized by the following main findings: (i) the initial stress amplitude during strain-controlled cycling is a function of the grain size leading to significantly higher values for grain-refined material conditions; (ii) the cyclic deformation curves of grain-refined states are characterized by an initial softening, followed subsequently by a cyclic hardening, which is related to the cyclic-strain induced α’-martensitic phase transformation; (iii) the stress amplitude reached at the end of fatigue life is directly related to the volume fraction of α’-martensite. Related to the mechanism of martensitic phase transformation in grain-refined material states, it was suggested by Droste et al. [30] that in UFG materials, the transformation does not occur inside deformation bands as in CG reference states. Instead, the transformation starts at grain boundaries and covers larger areas of the grains with dimensions less than 1 µm.
The aim of the present investigation was to demonstrate the influence of both the grain size as well as the mode of strain control during testing on the fatigue lives of metastable austenitic stainless steel.

2. Materials and Methods

A X2CrMnNi16-7-6 steel with two different grain sizes (62 µm and 0.8 µm) was investigated during cyclic loading under constant total and constant plastic strain at different amplitudes. The evolution of the ferromagnetic phase fraction (i.e., α’-martensite) was recorded in situ during the fatigue experiments. The fatigue lives of the total strain and plastic strain-controlled tests were compared. In addition, Coffin–Manson plots were calculated from strain-controlled tests at constant total strain amplitudes using stress amplitudes at different fractions of fatigue life Nf and compared to fatigue lives obtained from plastic strain-controlled fatigue tests. The investigations were corroborated by microstructural investigations using scanning electron microscopy (SEM) showing the grain size and orientation as well as the morphology and distribution of α’-martensite.

2.1. Material Conditions

The material under investigation was a metastable austenitic stainless steel based on low interstitial contents of carbon and nitrogen and high concentrations of alloying elements such as chromium (16 wt %), manganese (6 wt %) and nickel (6 wt %). The material was studied in two different microstructural conditions: (i) coarse-grained (CG) microstructure and (ii) ultrafine-grained (UFG) microstructure.
The CG material was achieved via the powder metallurgical production route. The steel with the chemical composition given in Table 1 was atomized under nitrogen atmosphere, resulting in a steel powder with a particle size d50 = 26 µm. Subsequently, the steel powder was pressed into a green body with an applied stress of 60 MPa under laboratory atmosphere at room temperature. This was followed by a hot-pressing process under vacuum at 1250 °C and 30 MPa for 30 min. The heating and cooling rates during the process were 10 K/min and 5 K/min, respectively. The hot-pressed material was manufactured at the Fraunhofer Institute for Ceramic Technologies and Systems (IKTS, Dresden, Germany). The microstructure is characterized by an average grain size of D = 62 µm ± 39 µm containing high volume fraction of annealing twins (see Figure 1a) characterized by a misorientation angle of 60° around 111 axis (see Figure 1e).
The UFG material was obtained by thermomechanically controlled processing (TMCP) [31]. The initial material was an as-cast steel with the chemical composition given in Table 1. A steel rod with a diameter of 50 mm was cold-formed in a 4-jaw rotary swaging machine at Leibniz-Institut für Festkörper- und Werkstoffforschung Dresden (IFW, Dresden, Germany). Cold forming was performed in 11 passes with cross-sectional changes of 19% each. Between the passes, the bars were cooled down to room temperature to enable the formation of a high fraction of deformation-induced α’-martensite (86 vol %) during swaging. Subsequently, a conventional reversion annealing process was performed in a preheated tube furnace under argon atmosphere at 700 °C for 5 min, followed by water quenching. The microstructure of this material is fully austenitic (Figure 1b,c) and is characterized by an area-weighted average grain size of D = 0.8 µm ± 0.4 µm (see Figure 1d, Table 1). The EBSD measurements showed a pronounced 001 and 111 texture in load axis (Figure 1f). More details on the process are given elsewhere [30].
Based on the chemical composition, the martensite start temperature Ms as well as the stacking fault energy (SFE) were calculated for both UFG and CG material conditions according to [31] and [32], respectively. In both cases, the Ms is well below room temperature, indicating that no thermal martensite has been formed. However, both material conditions exhibit a high ability to show strain-induced martensitic phase transformation under mechanical loading and also a higher dissociation width of Shockley partial dislocations forming stacking faults due to stacking fault energy (SFE) value below 18 mJ/m². Due to the different heat treatments, further influences might impact the mechanical behavior. Thus, the UFG structure was obtained by ageing at 700 °C, whereas the CG state was set at 1250 °C. Therefore, it cannot be excluded that precipitates may have developed at 700 °C. However, we assume that these should have only minor relevance for the cyclic behavior compared to the grain size difference.
The mechanical properties such as yield strength (Rp0.5), ultimate tensile strength (UTS) and elongation at fracture (A) under tensile loading at RT of both material states are included in Table 1, together with the achieved martensite content in the gauge length of specimens after tensile testing.

2.2. Mechanical Testing

Cylindrical specimens were manufactured for both CG and UFG material conditions with a gauge length of 14 mm and a diameter of 6 mm and 5 mm, respectively. The specimen geometries are shown in Figure 2. Different sample geometries were necessary because after completion of the tests on the CG material (specimen in Figure 2a), it was realized that the UFG material was only available in smaller dimensions and the geometry in Figure 2b had to be chosen. The fatigue tests were carried out using two servo-hydraulic testing machines: MTS Landmark 250 with max. load capacity of 250 kN for CG specimens and MTS Landmark 100 for UFG specimens (both MTS Systems Corporation, Eden Prairie, MN, USA). The tests were performed using a clip-on extensometer with a gauge length of 12 mm and a measuring range of ±9%. The fatigue tests were performed for CG and UFG material conditions, both under total strain control in a range of 0.3% ≤ ∆εt/2 ≤ 1.2%, as well as under plastic strain control in a range of 0.14% ≤ ∆εpl/2 ≤ 1.0%. In all tests, a triangular waveform command signal was applied and the total strain rate was set to ε ˙ = 4 × 10 3 s−1. Plastic strain was evaluated according to procedure described by Sommer et al. [33] regarding the stress dependence of Young’s modulus in high strength materials. Sommer et al. suggested an approach for the relationship between stress and elastic strain that accounts for this stress dependence using a quadratic complement to Hooke’s law according to Equation (1):
σ = E 0   ·   ε e l + z   ·   ε e l 2
where z is constant with z < 0, which should be evaluated using partial unloading during the first loading cycle under total strain control.
The fatigue experiments were corroborated by ferromagnetic phase fraction measurements. Thus, Fischerscope® MMS® PC or Feritscope® FMP30 (both Helmut Fischer GmbH, Sindelfingen, Germany) were used to measure the ferromagnetic phase fraction in situ during the fatigue tests at a frequency of 5 Hz using a ferrite probe of type FGAB1.3-Fe. The detection depth decreases with increasing ferromagnetic phase content and is 3–3.5 mm at 7% ferrite. The ferrite probes were calibrated with the same calibration set based on four ferrite standards. Since this calibration refers to the δ-ferrite content of a sample, the measured values must be multiplied by a correction factor of 1.7 according to Talonen et al. [34] to obtain the content of α’-martensite. This correction factor is valid up to measured values of maximum 55 Fe-%. Since this value is exceeded in some cases of the present work, the uncorrected ferrite probe signal is given in Fe-% throughout the paper. More-over, a roundness correction due to the cylindrical samples or an edge distance correction in the case of the flat samples is omitted. Instead, the measured lengths of the samples were scanned with the ferrite probe after the end of the test in order to calculate a mean α’-martensite content. Subsequently, the test data were corrected to this mean value.
Microstructural investigations were performed using scanning electron microscopy (SEM) on the initial material conditions as well as for selected fatigue experiments under total strain control. Thus, electron-backscattered diffraction (EBSD) measurements were conducted using a field-emission SEM (Mira3, Tescan, Brno, Czech Republic) operated between 20 kV and 25 kV acceleration voltage equipped with an EBSD detector and OIM acquisition/analysis software (both EDAX, TSL, Mahwah, NJ, USA).

3. Results

3.1. Cyclic Deformation Curves

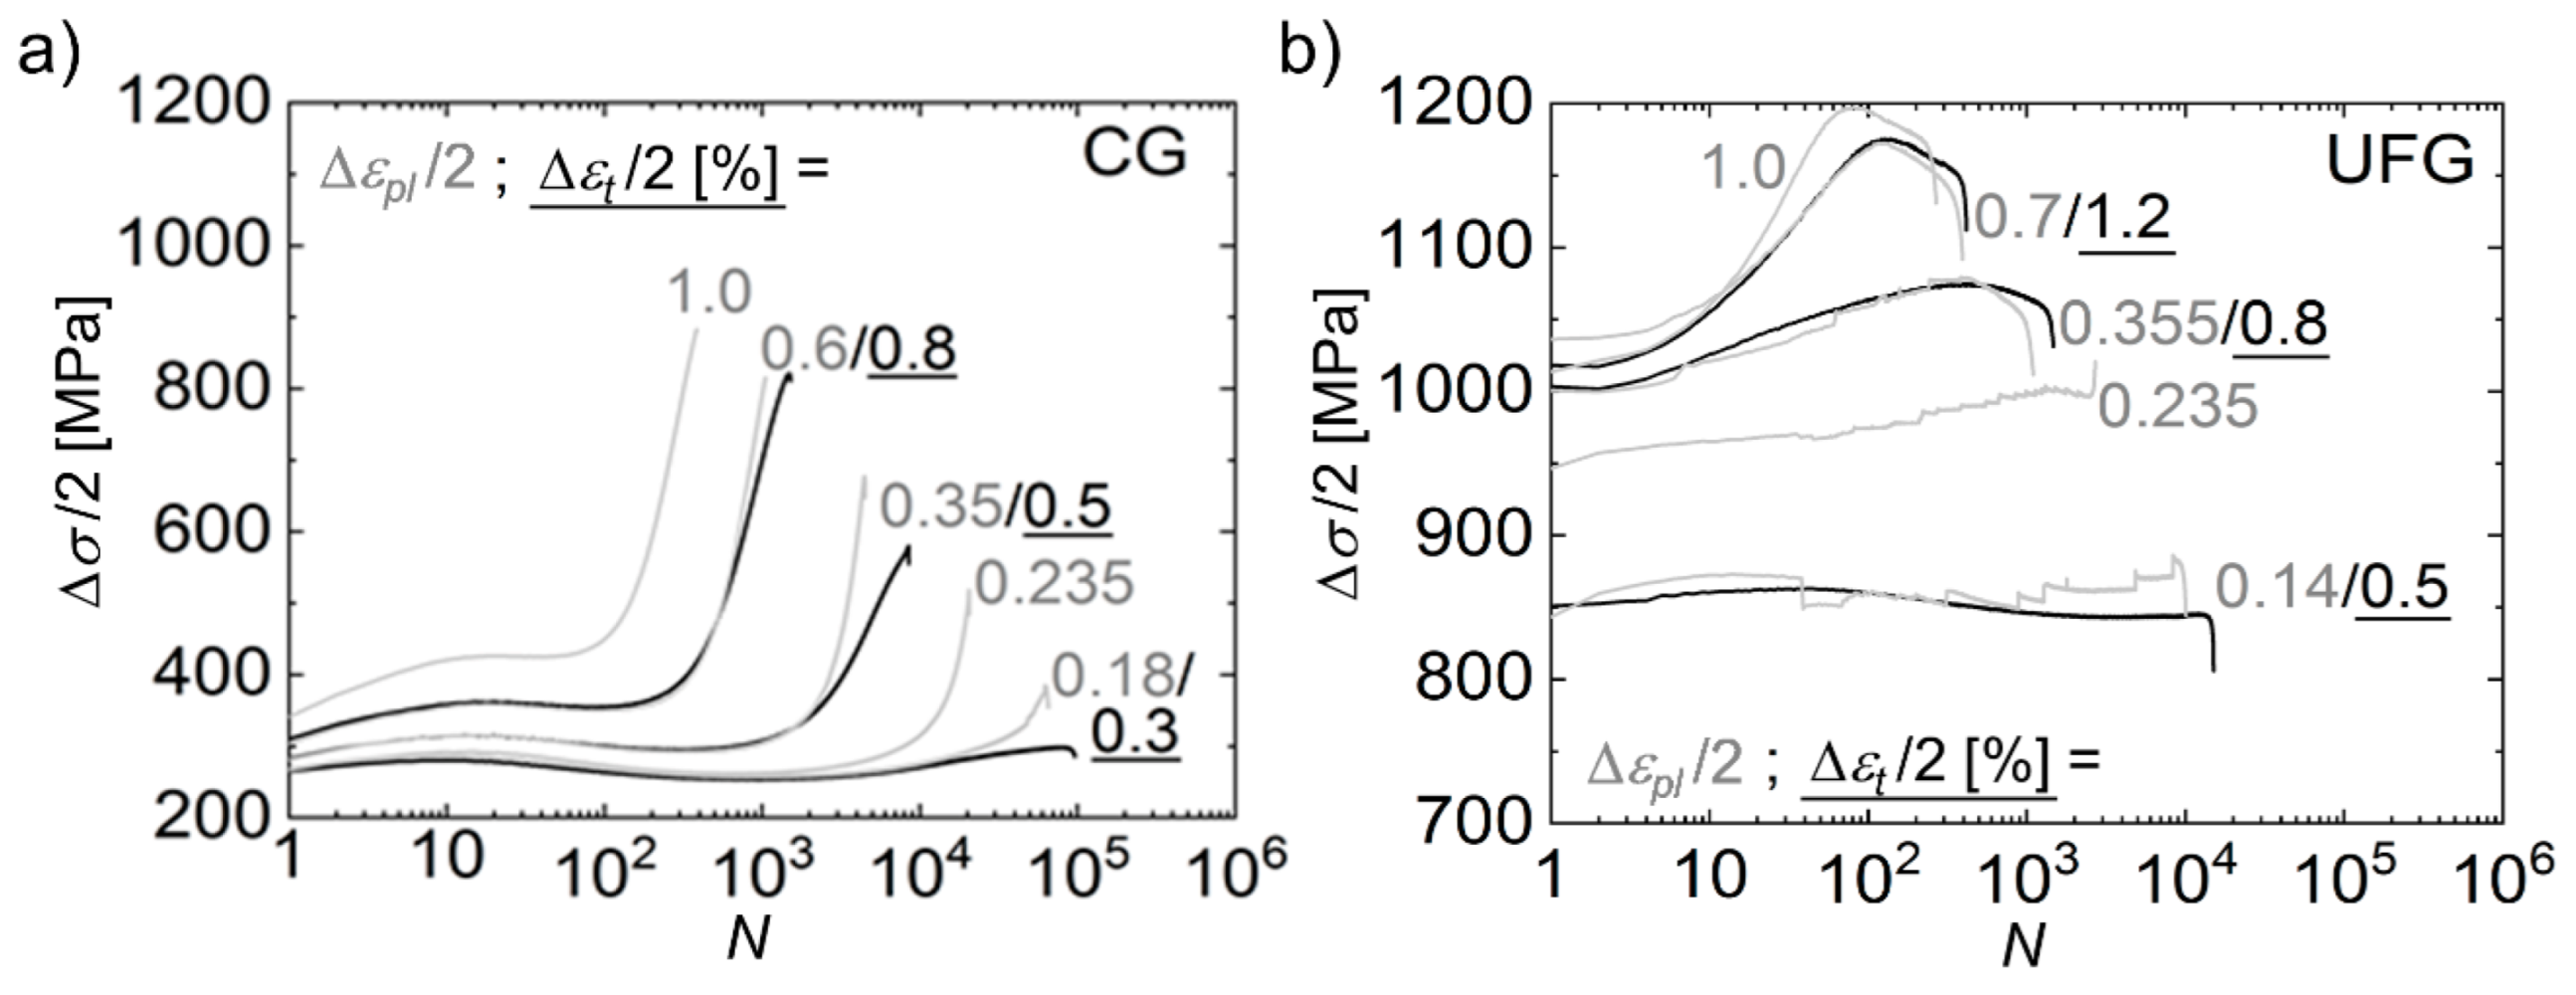
The results of the fatigue tests under total and plastic strain control in terms of cyclic deformation curves are summarized in Figure 3 for CG (Figure 3a) and UFG material (Figure 3b). The plastic strain amplitudes were set according to the initial plastic strain amplitudes obtained in the respective total strain-controlled tests. Thus, pairs of tests resulted, which had initially the same plastic strain amplitudes. It must be noted that the plastic strain amplitudes of the total strain-controlled tests decreased during the tests in the case of pronounced cyclic hardening and increased for cyclic softening, respectively. Furthermore, the results of two further tests at lower (0.235%) and higher (1.0%) plastic strain amplitudes were included. First, significant differences between CG and UFG material become apparent, as expected already from the quasi-static mechanical properties (Table 1). The initial stress amplitudes for the UFG material state are significantly higher due to the small grain size (<1 µm). Moreover, the fatigue life of the UFG state is identical or slightly enhanced compared to the CG condition for tests at high or small strain amplitudes, respectively. No significant differences were observed in the cyclic stress–strain responses obtained under plastic strain control or total strain control. The small discontinuities in cyclic hardening/softening curves obtained under plastic strain control are related to adjustments of the stress vs. plastic strain hysteresis loops caused by the hardening behavior of the material under cyclic loading. Overall, a pronounced secondary hardening is observed in both material conditions at higher strain amplitudes, which is related to the formation of α’-martensite. For further analysis of the cyclic deformation behavior of the investigated steel under total strain control, the reader is referred to our recent papers [27,30,35].

3.2. Evolution of α’-Martensite Volume Fraction

The evolution of ferromagnetic phase fractions during fatigue tests under total and plastic strain control is shown for both CG and UFG material states in Figure 4. It can be seen that for both materials and at all strain amplitudes, an incubation period is needed for the onset of the formation of cyclic deformation-induced α’-martensite. Furthermore, it is visible that the incubation period is always significantly shorter for the UFG material compared to CG condition, in particular at high total strain amplitudes (Figure 4a,b). The α’-martensite fractions at the end of fatigue life are more or less comparable at high total strain amplitudes, whereas at small total strain amplitudes, the CG condition exhibits higher martensitic phase fractions. The plastic strain-controlled tests in Figure 4c,d clearly support the statement of significantly shorter incubation periods for the UFG material. Thus, at the highest strain amplitude of ∆εt/2 = 1.2%, the incubation period is in the range of a few cycles for the UFG material, whereas for the CG material, it is around 100 cycles (compare Figure 4a,b). The phase fractions at the end of fatigue life, on the other hand, do not differ that much between the conditions, with a trend for the UFG material to exhibit a slightly higher volume fraction of α’-martensite. In addition, at small strain amplitudes ∆εt/2 < 0.4%, the formation of α’-martensite is negligible in both CG and UFG material. However, it must be mentioned that some problems occurred regarding the ferrite probe measurements in the case of the CG material cyclically deformed under total strain control (Figure 4a). For ∆εt/2 ≤ 0.3%, the measurement was not sensitive enough at small α’-martensite fractions. There was some α’-martensite detected along the gauge lengths after the tests. This is why some α’-martensite fractions are only indicated by a cross in the diagram representing the values at the end of fatigue life.
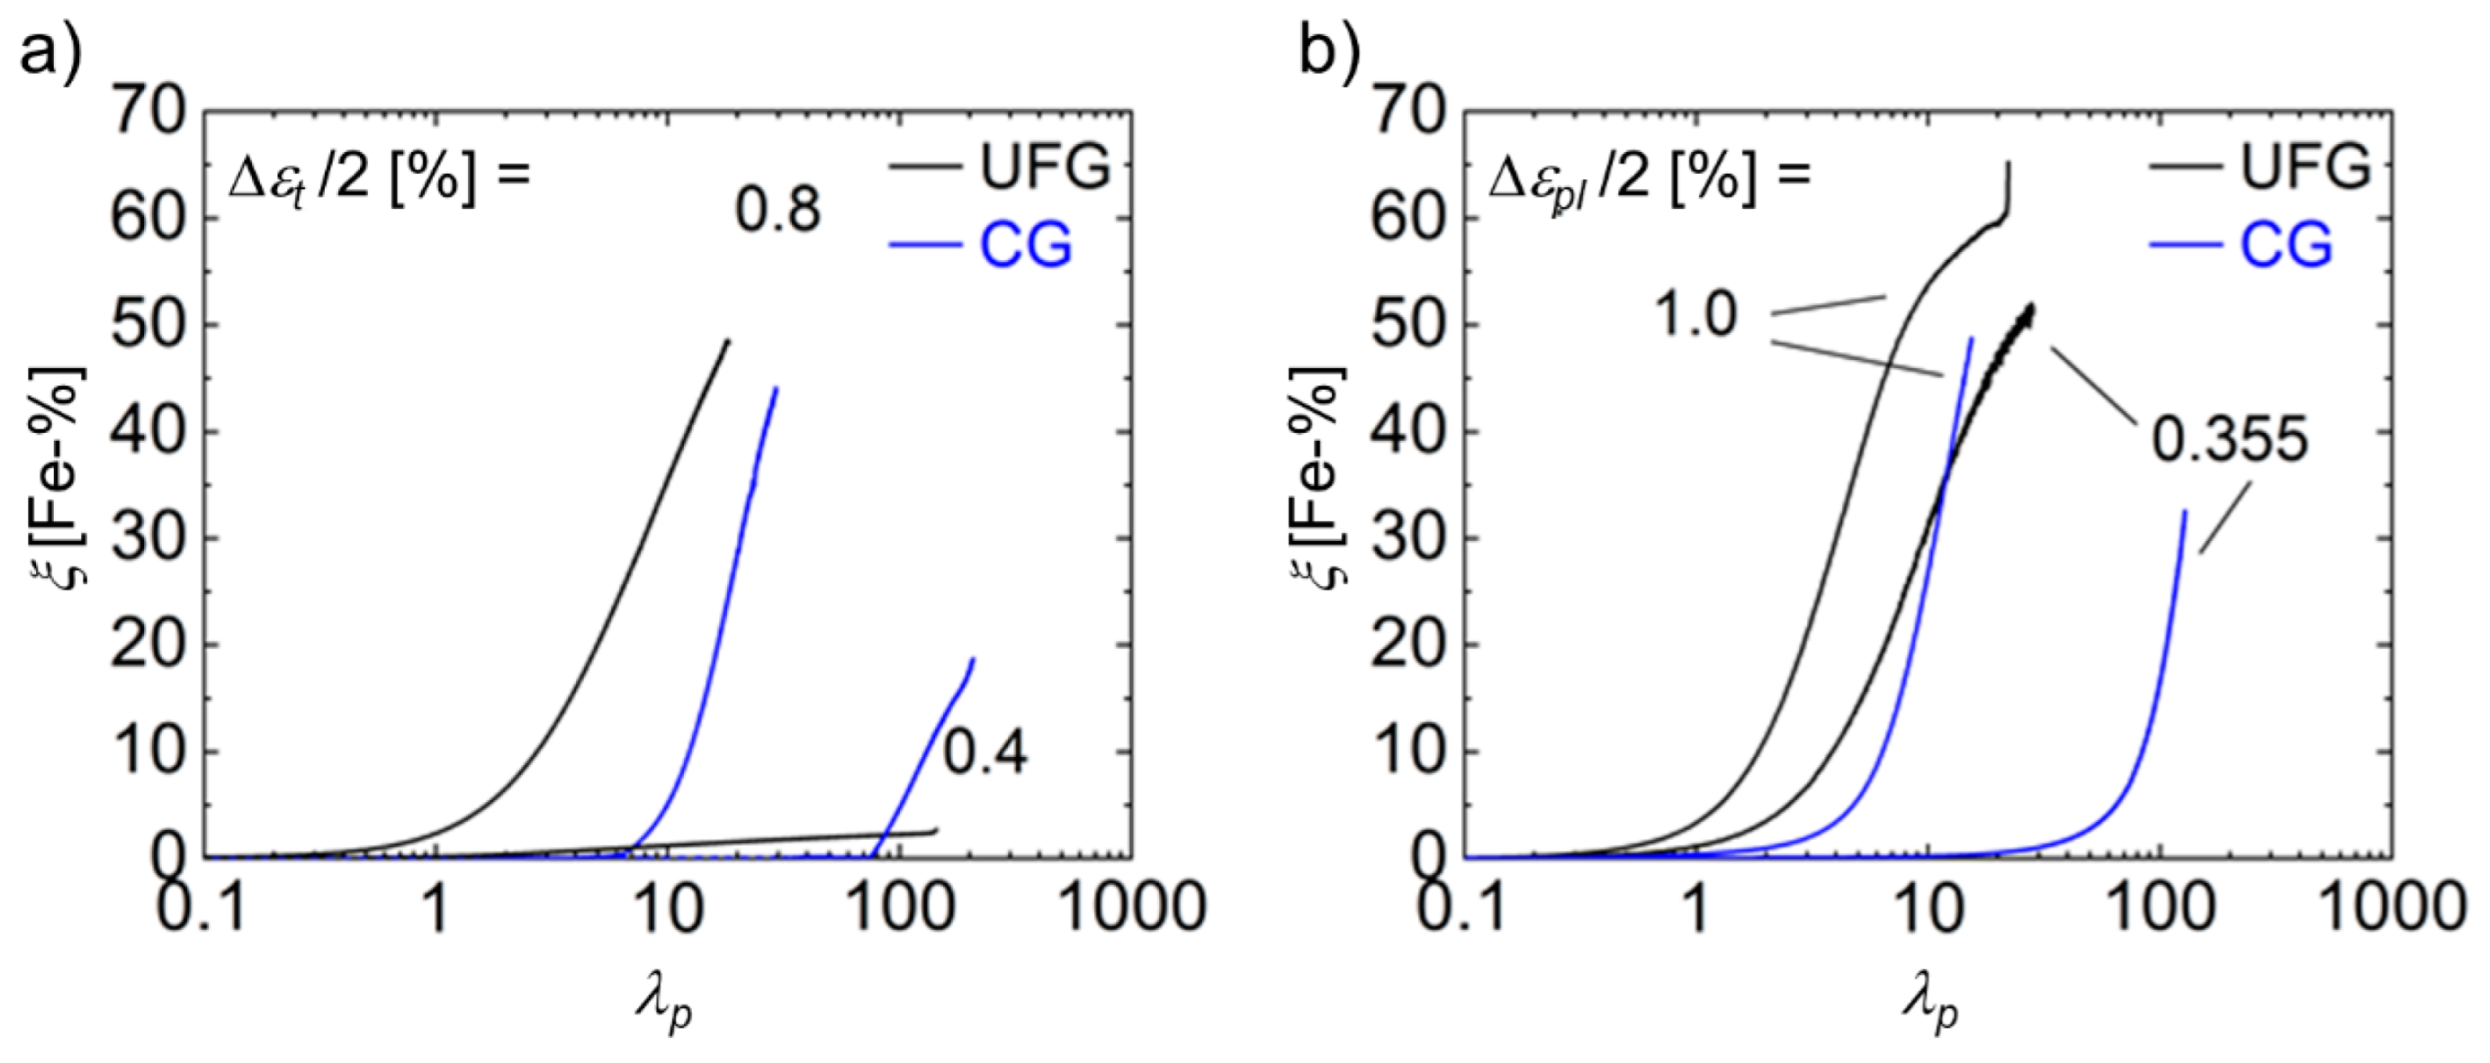
Furthermore, it turned out that the formation of cyclic deformation-induced α’-martensite is more intense and the incubation period is even shortened under plastic strain control (Figure 4c,d). This can be explained in terms of the control mode and the threshold value of the cumulative plastic strain λ p , t h [35], which is calculated by Equation (2):
λ p , t h = 4   i = 1 N f Δ ε p l / 2 .
The evolution of the ferromagnetic phase fraction as a function of λ p , t h is shown in Figure 5 for two selected strain amplitudes of both total strain (Figure 5a) and plastic strain-controlled (Figure 5b) fatigue tests. In general, the cumulated plastic strain needed for the onset of martensitic phase transformation is significantly lower for the UFG condition as well as for the plastic strain-controlled tests. Thus, the formation of α’-martensite starts earlier. Moreover, it is noticeable that at the end of the fatigue life, the α’-martensite content of the UFG material is always higher than for the CG material for the corresponding plastic strain amplitude. Only for small total strain amplitudes was the martensitic transformation of the UFG material significantly lower compared to CG material (compare Figure 5a,b).
These results allow the conclusion that the UFG condition, despite its small grain size, has a higher tendency to form α’-martensite than the CG counterpart. This contradicts experimental findings on the destabilization of metastable austenitic steels during monotonic loading, in which decreasing grain size typically inhibits and retards α’-martensite formation [36,37,38,39,40]. Dissenting observations have mostly been attributed to the reduction of austenite stability due to the binding of carbon and nitrogen in precipitates [24,25] or to deformed microstructure components left over from fabrication [41]. In contrast, the UFG condition of the present study exhibits a completely recrystallized, homogeneous microstructure and a low proportion of interstitial elements due to the alloy design. In addition to the high stress amplitudes as a result of the small grain size, the strong texture with 001 and 111 lattice directions parallel to the loading axis (compare Figure 1f) contributes decisively to a pronounced phase transformation. These crystallographic orientations are preferred for large dissociation width of Shockley partial dislocations—grains with 111 orientation under tensile load and grains with 001 orientation under compressive loads facilitate the formation of α’-martensite [42,43]. Moreover, the chemical driving force for martensitic phase transformation expressed by martensite start temperature Ms (compare Table 1) is slightly increased for the UFG condition compared to coarse-grained counterpart. Finally, the SFE of UFG condition is lower compared to the CG material (see Table 1) due to the lower N content resulting in a higher tendency of the formation of extended stacking faults, which are a pre-cursor for α’-martensite formation.

3.3. Microstructure

In addition to the in situ ferromagnetic measurements, microstructural investigations were conducted for a selected total strain amplitude on CG and UFG material conditions. Figure 6 shows the results of EBSD measurements unraveling the martensitic phase transformation in CG und UFG material states at different total strain amplitudes. Figure 6a shows the phase map of CG material cyclically deformed at ∆εt/2 = 0.3%. Figure 6b,c are related to UFG material cycled at ∆εt/2 = 0.4% and ∆εt/2 = 0.5%, respectively.
As expected for CG material condition, the formation of deformation bands along different activated slip systems is clearly visible. Some of these bands are transferred to ε-martensite (yellow) due to the high density of stacking faults and, in addition, α’-martensite grains (blue in Figure 6a) with different crystallographic orientations (compare Figure 6d) are formed in some bands. Figure 6b,c,e,f shows the microstructure of the UFG condition after fatigue tests at ∆εt/2 = 0.4% (b,e) and ∆εt/2 = 0.5% (c,f). The different martensitic phase transformation of metastable UFG steel becomes apparent. Due to the small grain size (<1 µm), the formation of deformation bands is impeded. Instead of formation of α’-martensite within deformation bands, the small grains transform successively either to ε-martensite or to α’-martensite (see [30]). The volume fraction of α’-martensite increases significantly with the increase in strain amplitude (compare Figure 6b,c), which is in agreement with measurements of ferromagnetic phase fraction.

4. Discussion

The fatigue life with respect to the applied total strain amplitude was analyzed for both CG and UFG material conditions according to the relationship of Basquin and Coffin–Manson in Equation (3):
Δ ε t / 2 = σ f E · ( 2 N f ) b + ε f ·   ( 2 N f ) c ,
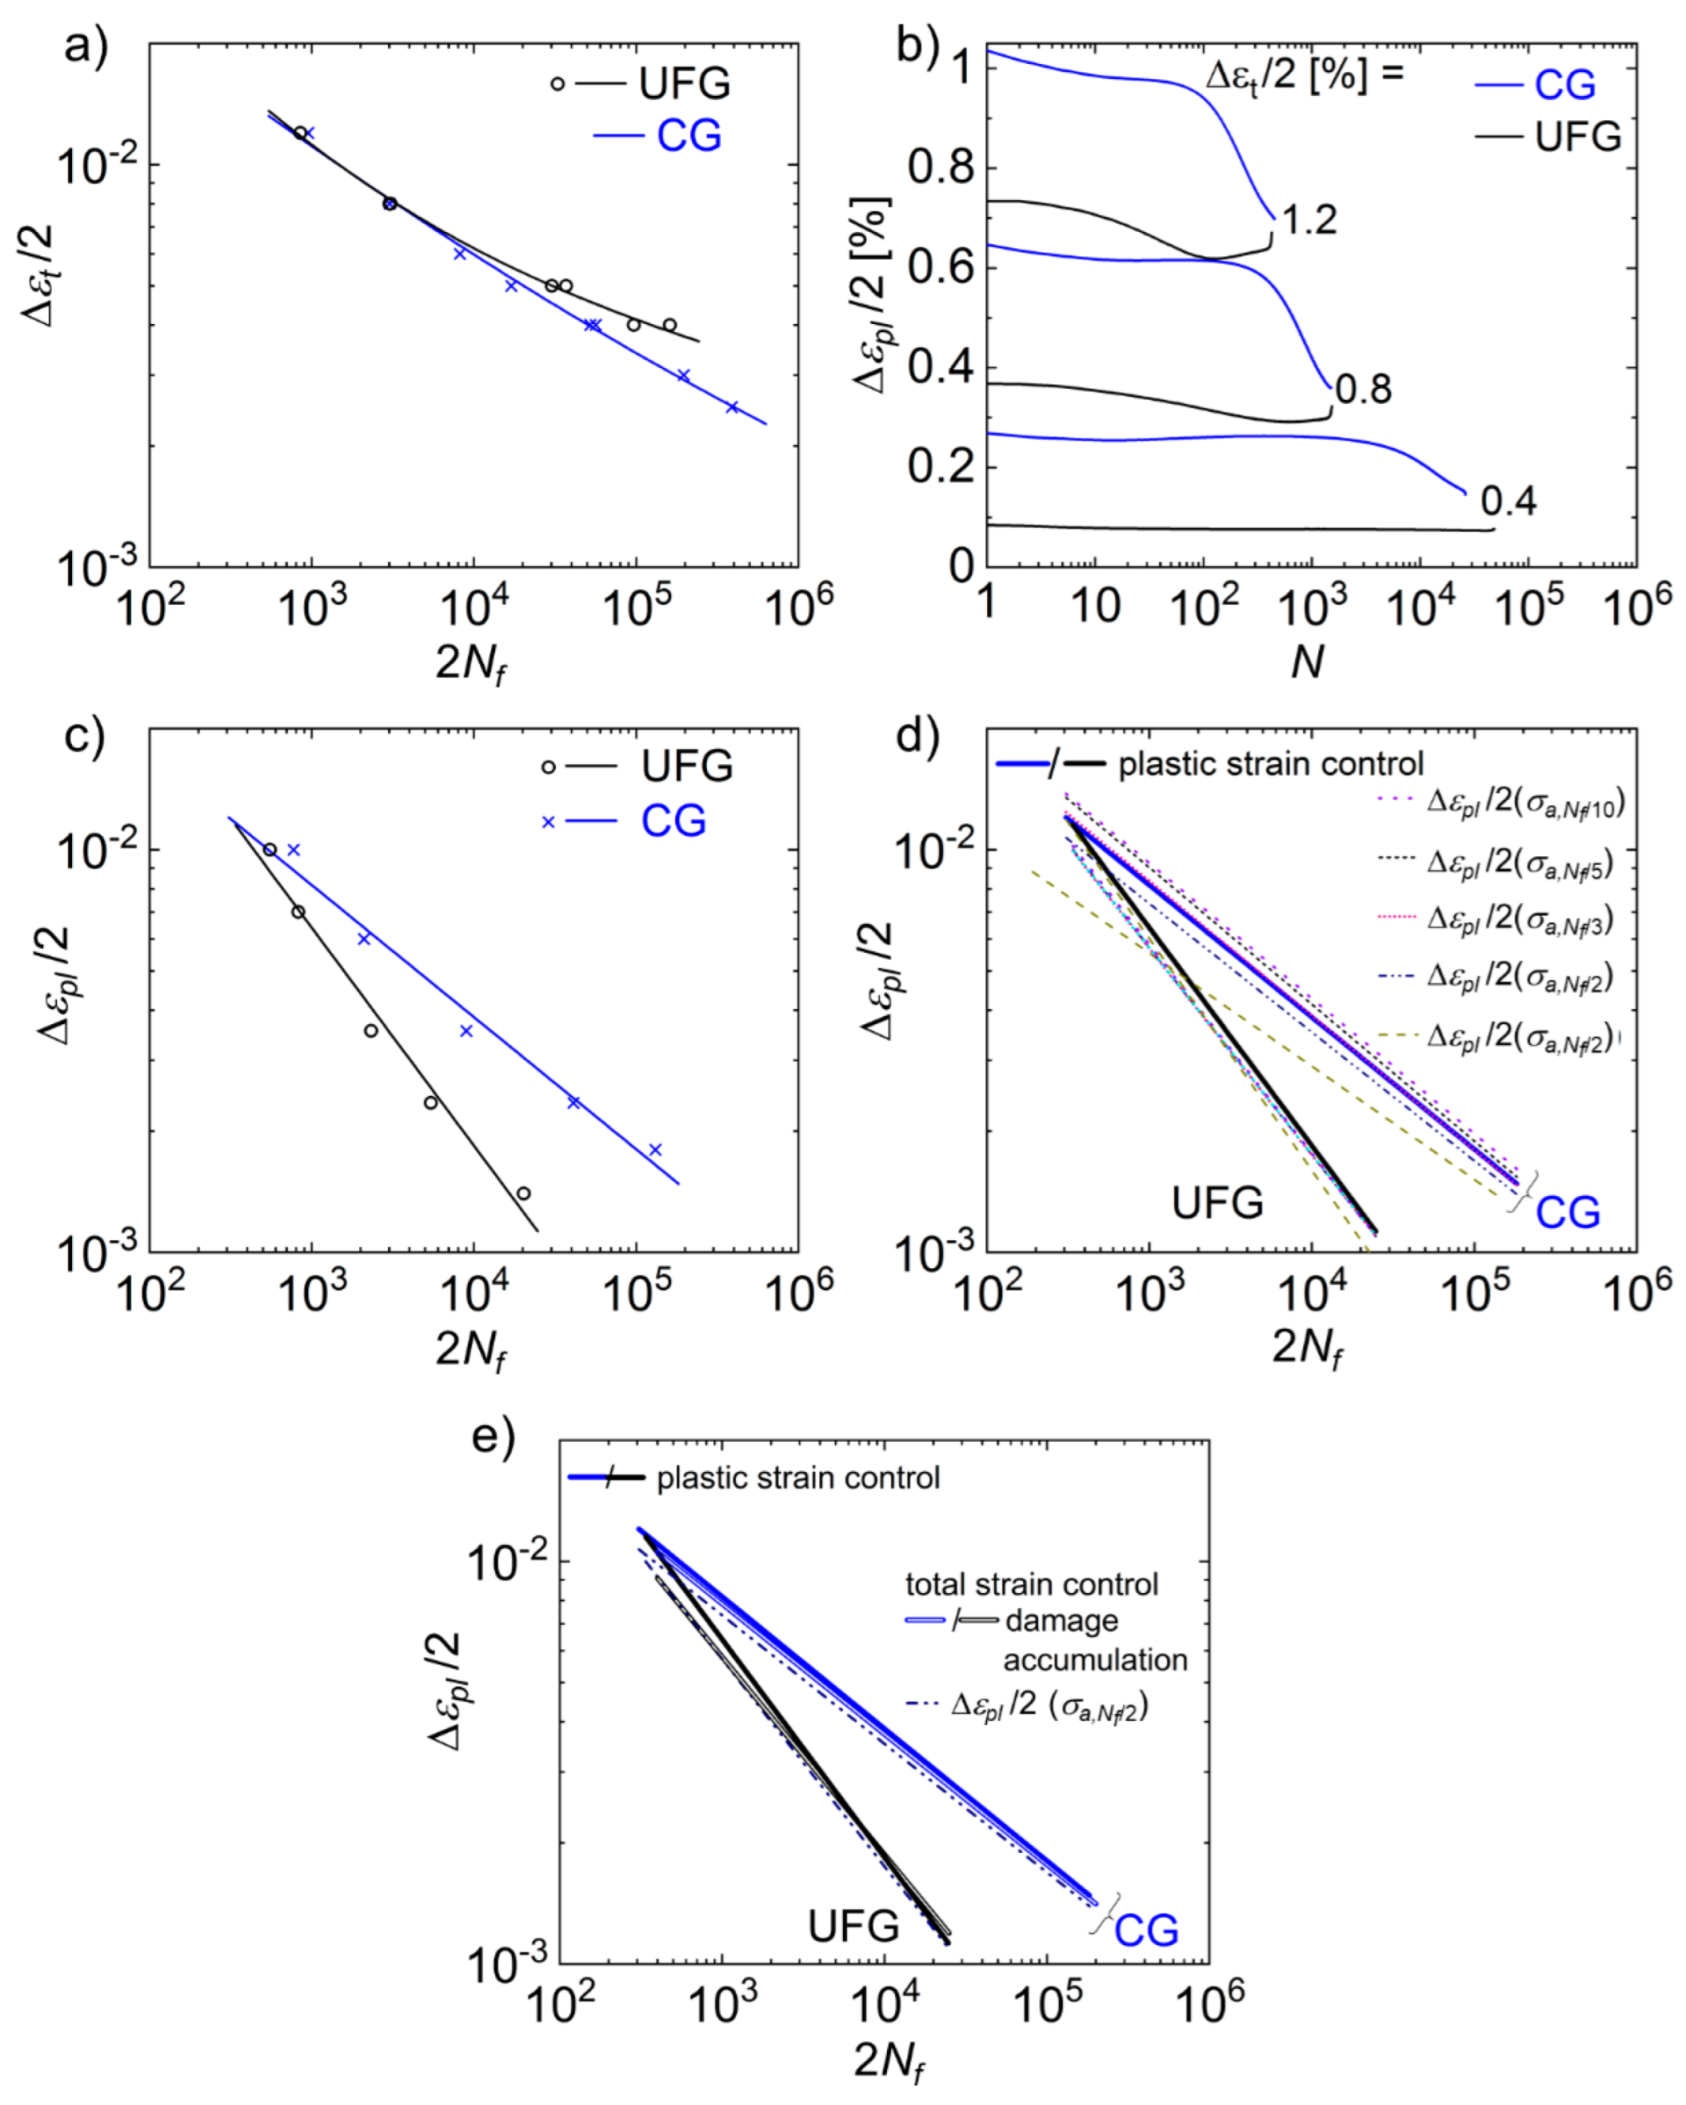
where σ f represents the fatigue strength coefficient, E is the Young’s modulus, b is the fatigue strength exponent,   ε f is the fatigue ductility coefficient and c is the fatigue ductility exponent. The resulting fatigue life curves for the CG and UFG material states are shown in Figure 7a. The plots unravel two main aspects: (i) identical fatigue lives of UFG and CG material states in the LCF regime, and (ii) superior fatigue lives of UFG state compared to CG counterpart in the HCF regime. In principle, the latter fact of higher durability in the HCF range is typical for UFG materials tested under total strain control [14,15]. The higher fatigue lives at lower total strain amplitudes are caused by the superior strength due to the small grain size compared to the CG condition, which is accompanied by significantly lower plastic strain amplitudes (compare Figure 7b).
In addition, the UFG state has good ductility (compare Table 1) due to its fully recrystallized microstructure and can tolerate a correspondingly high degree of plasticity. In contrast, lower lifetimes of UFG material states compared to their CG counterparts are expected at high strain amplitudes, i.e., in the LCF regime [14,15]. However, in the present case, the fatigue lives of UFG and CG conditions are identical in the LCF regime under total strain-controlled tests, as seen from Figure 7a.
The fatigue lives of the plastic strain-controlled tests on for UFG and CG material conditions are plotted in Figure 7c. The diagram reveals that the fatigue lives at the highest plastic strain amplitude of 1% are nearly identical for both material conditions. However, the fatigue lives of the CG condition are significantly higher at small plastic strain amplitudes compared to the UFG material. At Δ ε p l / 2 = 0.15%, the difference is approximately one decade. This illustrates the influence of the control mode of the fatigue tests on the lifetime.
During the total strain-controlled tests, the opposite was observed: a higher fatigue life of the UFG condition at low strain amplitudes (compare Figure 7a). The strength of the material was life-determining [2,3]. For the stronger UFG material, the elastic portion of the strain amplitude was larger and the plastic proportion was smaller.
The fatigue life curves of total strain-controlled tests are calculated according to Equation (1), which is based on the sum of the elastic (Basquin) and plastic (Coffin–Manson) strain contributions. In general, the saturated stress amplitude usually taken at half fatigue life is used to determine the elastic and plastic components and the Basquin/Coffin–Manson parameters (see Equation (1)). However, it is obvious from the cyclic stress–strain response shown in Figure 3 that no saturation plateau is reached for the investigated metastable austenitic steels due to their pronounced secondary cyclic hardening caused by the martensitic phase transformation. Thus, there is no universal rule on which stage of fatigue life should be used for parameter calculation. To prove different approaches, various stress amplitudes such as σ a at N f / 10 , N f / 5 or N f / 3 were used. The results in terms of the Coffin–Manson plots calculated based on the total strain-controlled tests are shown in Figure 7d (thin lines) together with the results from plastic strain-controlled tests, which represent the experimentally revealed Coffin–Manson plots (bold lines). Depending on the calculation approach, different progressions for the Coffin–Manson plots arise. Since both total and plastic strain-controlled tests were performed in this work, different approaches can be compared and their accuracy evaluated. It turned out that for the CG condition, the calculation of parameters ε f and c strongly depend on the chosen approach. Thus, markedly different courses for the Coffin–Manson plots arise for different approaches. For example, calculations based on the maximum stress amplitude result in a particularly high elastic fraction of the total strain (Basquin), which in turn causes a particularly low plastic fraction. Consequently, the latter is underestimated and the Coffin–Manson plot predicts a too low fatigue life. The opposite is provided by calculating ε f and c using the stress amplitude at N f / 10 . This is still within the incubation period. Thus, the martensitic phase transformation has not yet set in and the stress amplitudes are comparatively low. Therefore, this approach results in too low elastic and too high plastic fraction. If stress amplitudes from later phases of the cyclic deformation are used, the plastic fraction is reduced as a consequence of the cyclic hardening, and the Coffin–Manson plots are shifted downward. The best agreement of the Coffin–Manson curve with that of the plastic strain-controlled tests was obtained using the stress amplitude at N f / 3 in our case. The most common approach to determine the Coffin–Manson parameters based on the stress amplitude at half-fatigue life results in an underestimation of the plastic part due to the strong cyclic hardening of the CG state (compare Figure 7d).
As in the total strain-controlled tests, the plastic strain amplitude changes during the test in each cycle with the cyclic hardening or softening. We suggest in this work an additional approach with a regression calculation based on the linear damage accumulation hypothesis similar to Palmgreen and Miner. In this approach, the damage sum S over all cycles is determined for each test (t) based on a Coffin–Manson approach:
S ( t ) = N = 1 N f 2 ( Δ ε p l ( N ) ε f ) 1 c
A sum U of the error squares of the deviations of the damage sums of all cycles from 1 each is formed:
U = t = 1 t m a x ( S ( t ) 1 ) 2
The coefficients of this Coffin–Manson equation are then determined with a linear regression calculation in which the sum U is minimized.
Figure 7e shows that the Coffin–Manson curves obtained from the total strain-controlled tests agree better with the measurements at plastic strain control than those determined from plastic strains at half-life. The authors consider this method useful when predicting Coffin–Manson parameters under plastic strain control from total strain-controlled tests, in particular for materials with severe cyclic hardening or softening.
In the case of the UFG condition, the scatter of the Coffin–Manson curves calculated according to different approaches is much smaller than for the CG condition, as seen from Figure 7d. This is caused by the less pronounced cyclic hardening/softening (compare Figure 3b). The comparatively small differences in the stress amplitudes lead to similar Coffin–Manson plots, which agree well with the reference curve from the plastic strain-controlled tests shown in Figure 7d.

5. Summary

The influence of cyclic plastic strain control on the evolution of α’martensite and, hence, on the fatigue life was studied for a metastable austenitic stainless steel with two different grain sizes: (i) coarse-grained (62 µm) and ultrafine-grained (0.8 µm) material. The main results can be summarized as follows:
  • The initial stress amplitude is significantly higher for the ultrafine-grained material condition during both total and plastic strain-controlled fatigue tests.
  • In both material conditions, a pronounced secondary hardening is observed, which is attributed to the martensitic phase transformation.
  • During plastic strain-controlled tests, the cumulated plastic strain needed for the onset of martensitic phase transformation is significantly lower compared to total strain control.
  • The UFG condition shows the higher ability for martensitic phase transformation, which is caused by the pronounced texture.
  • Based on strain-controlled tests at constant total strain, an approach for the calculation of Coffin–Manson parameters was proposed for materials undergoing a strong secondary hardening due to martensitic phase transformation. The best agreement of the Coffin–Manson curve with that of the plastic strain-controlled test was obtained when calculations were based on the stress amplitude at Nf⁄3.
  • A linear damage accumulation approach can be used to estimate Coffin–Manson parameters close to those obtained from plastic strain-controlled tests without an arbitrary comparison point.

Author Contributions

Conceptualization, mechanical testing, data analysis, M.D.; methodology, validation, writing, data analysis, S.H.; supervision, project administration, funding acquisition, H.B.; validation, writing—original draft preparation, A.W. All authors have read and agreed to the published version of the manuscript.

Funding

Financial support for this research from Deutsche Forschungsgemeinschaft (DFG, German Research Foundation) for the Collaborative Research Centre “TRIP-Matrix-Composite” (SFB 799, project B3) under Project-ID 54473466 is gratefully acknowledged. The APC was funded by Publication Fund of the TU Bergakademie Freiberg.

Data Availability Statement

Not applicable.

Acknowledgments

The authors wish to thank R. Prang and K. Becker for preparation of the specimens for SEM investigations, Furthermore, J. Freudenberger and D. Seifert (both IFW Dresden) are gratefully acknowledged for conducting the hot forming and rotary swaging. Open Access Funding by the Publication Fund of the TU Bergakademie Freiberg.

Conflicts of Interest

The authors declare no conflict of interest. The funders had no role in the design of the study; in the collection, analyses, or interpretation of data; in the writing of the manuscript, or in the decision to publish the results.

References

  1. Coffin, L.F., Jr. Low Cycle Fatigue—A Review. Appl. Mater. Res. 1962, 1, 129. [Google Scholar]
  2. Manson, S.S.; Halford, G.R. Inst. Metals Monograph and Rept. Set., No 32, 1967, p. 154, cited in: C.E. Feltner and R.W. Landgraf. J. Basic Eng. 1971, 93, 444. [Google Scholar]
  3. Feltner, C.E.; Landgraf, R.W. Selecting materials to resist low cycle fatigue. J. Basic Eng. 1971, 93, 444–452. [Google Scholar] [CrossRef]
  4. Lukas, P.; Klesnil, M.; Polak, J. High cycle fatigue life of metals. Mater. Sci. Eng. 1974, 15, 239–245. [Google Scholar] [CrossRef]
  5. Cheng, A.S.; Laird, C. The high cycle fatigue life of copper single crystals tested under plastic-strain-controlled conditions. Mater. Sci. Eng. 1981, 51, 55–60. [Google Scholar] [CrossRef]
  6. Wang, R.; Mughrabi, H. Secondary cyclic hardening in fatigued copper monocrystals and polycrystals. Mater. Sci. Eng. 1984, 63, 147–163. [Google Scholar] [CrossRef]
  7. Blochwitz, C.; Kahle, E. A method for the determination of the cyclic stress-strain curve of persistent slip bands in fatigued single crystals. Krist. Tech. 1980, 16, 977–986. [Google Scholar] [CrossRef]
  8. Li, Y.; Laird, C. Cyclic response and dislocation structures of AISI 316L stainless steel. Part 2: Polycrystals fatigued at intermediate strain amplitude. Mater. Sci. Eng. A 1994, 186, 87–103. [Google Scholar] [CrossRef]
  9. Buque, C.; Bretschneider, J.; Schwab, A.; Holste, C. Effect of grain size and deformation temperature on the dislocation structure in cyclically deformed polycrystalline nickel. Mater. Sci. Eng. A 2001, 319–321, 631–636. [Google Scholar] [CrossRef]
  10. Videm, M.; Ryum, N. Cyclic deformation and fracture of pure aluminium polycrystals. Mater. Sci. Eng. A 1996, 219, 11–20. [Google Scholar] [CrossRef]
  11. Polak, J. Plastic strain-controlled short crack growth and fatigue life. Int. J. Fatigue 2005, 27, 1192–1201. [Google Scholar] [CrossRef]
  12. Smaga, M.; Boemke, A.; Daniel, T.; Skorupski, R.; Sorich, A.; Beck, T. Fatigue Behavior of Metastable Austenitic Stainless Steels in LCF, HCF and VHCF Regimes at Ambient and Elevated Temperatures. Metals 2019, 9, 704. [Google Scholar] [CrossRef] [Green Version]
  13. Lei, Y.; Xu, J.; Wang, Z. Controllable Martensite Transformation and Strain-Controlled Fatigue Behavior of a Gradient Nanostructured Austenite Stainless Steel. Nanomaterials 2021, 11, 1870. [Google Scholar] [CrossRef] [PubMed]
  14. Mughrabi, H.; Höppel, H.W.; Kautz, M. Fatigue and microstructure of ultrafine grained metals produced by severe plastic deformation. Scr. Mater. 2004, 51, 807–812. [Google Scholar] [CrossRef]
  15. Mughrabi, H.; Höppel, H.W. Cyclic deformation and fatigue properties of very fine-grained metals and alloys. Int. J. Fatigue 2010, 32, 1413–1427. [Google Scholar] [CrossRef]
  16. Kunz, L.; Lukáš, P.; Svoboda, M. Fatigue strength, microstructural stability and strain localization in ultrafine-grained copper. Mater. Sci. Eng. A 2006, 424, 97–104. [Google Scholar] [CrossRef]
  17. Höppel, H.W.; Zhou, Z.M.; Kautz, M.; Mughrabi, H.; Valiev, R.Z. Cyclic deformation behaviour of ultrafine-grained copper produced by equal channel angular pressing. In Proceedings of the Fatigue 2002; Blom, A.F., Ed.; Engineering Advisory Services: West Midlands, UK, 2002; Volume 3, pp. 1617–1622. [Google Scholar]
  18. Agnew, S.R.; Weertman, J.R. Cyclic softening of ultrafine grained copper. Mater. Sci. Eng. A 1998, 244, 145–152. [Google Scholar] [CrossRef]
  19. Patlan, V.; Vinogradov, A.; Higashi, K.; Kitagawa, K. Overview of fatigue properties of fine grain 5056 Al–Mg alloy processed by equal-channel angular pressing. Mater. Sci. Eng. A 2001, 300, 171–182. [Google Scholar] [CrossRef]
  20. Holste, C. Cyclic plasticity of nickel, from single crystal to submicrocrystalline polycrystals. Philos. Mag. 2004, 84, 299–315. [Google Scholar] [CrossRef]
  21. Stolarz, J.; Baffie, N.; Magnin, T. Fatigue short crack behaviour in metastable austenitic stainless steels with different grain sizes. Mater. Sci. Eng. A 2001, 319–321, 521–526. [Google Scholar] [CrossRef]
  22. Vogt, J.B.; Poulon, A.; Brochet, S.; Glez, J.C.; Mithieux, J.D. LCF behaviour of fine grained austenitic stainless steels. In Proceedings of the 6th International Conference on Low Cycle Fatigue (LCF 6), Berlin, Germany, 8–12 September 2008; pp. 97–102. [Google Scholar]
  23. Chlupová, A.; Man, J.; Kuběna, I.; Polák, J.; Karjalainen, L.P. LCF behaviour of ultrafine grained 301LN stainless steel. Procedia Eng. 2014, 74, 147–150. [Google Scholar] [CrossRef] [Green Version]
  24. Järvenpää, A.; Jaskari, M.; Man, J.; Karjalainen, L.P. Stability of grain-refined re-versed structures in a 301LN austenitic stainless steel under cyclic loading. Mater. Sci. Eng. A 2017, 703, 280–292. [Google Scholar] [CrossRef]
  25. Järvenpää, A.; Jaskari, M.; Man, J.; Karjalainen, L.P. Austenite stability in reversion-treated structures of a 301LN steel under tensile loading. Mater. Charact. 2017, 127, 12–26. [Google Scholar] [CrossRef]
  26. Man, J.; Järvenpää, A.; Jaskari, M.; Kuběna, I.; Fintová, S.; Chlupová, A.; Karjalai-nen, L.P.; Polák, J.; Hénaff, G. Cyclic deformation behaviour and stability of grain-re-fined 301LN austenitic stainless structure. MATEC Web Conf. 2018, 165, 6005. [Google Scholar] [CrossRef]
  27. Droste, M.; Ullrich, C.; Motylenko, M.; Weidner, A.; Fleischer, M.; Freudenberger, J.; Rafaja, D.; Biermann, H. Fatigue behaviour of an ultrafine-grained metastable CrMnNi-steel tested under total strain control. Int. J. Fatigue 2018, 106, 143–152. [Google Scholar] [CrossRef]
  28. Järvenpää, A.; Jaskari, M.; Kisko, A.; Karjalainen, P. Processing and properties of re-version-treated austenitic stainless steels. Metals 2020, 10, 281. [Google Scholar] [CrossRef] [Green Version]
  29. Zhang, Z.; Li, A.; Wang, Y.; Lin, Q.; Chen, X. Low-cycle fatigue behavior and life prediction of fine-grained 316LN austenitic stainless steel. J. Mater. Res. 2020, 35, 3180–3191. [Google Scholar] [CrossRef]
  30. Droste, M.; Järvenpää, A.; Jaskari, M.; Motylenko, M.; Weidner, A.; Karjalainen, P.; Biermann, H. The role of grain size in static and cyclic deformation behavior of a laser reversion annealed metastable austenitic steel. Fatigue Fract. Eng. Mater. Struct. 2021, 44, 43–62. [Google Scholar] [CrossRef]
  31. Jahn, A.; Kovalev, A.; Weiß, A.; Scheller, P.R. Influence of manganese and nickel on the α´ martensite transformation temperatures of high alloyed Cr-Mn-Ni steels. Steel Res. Int. 2011, 82, 1108–1112. [Google Scholar] [CrossRef]
  32. Ojima, M.; Adachi, Y.; Tomota, Y.; Katada, Y.; Kaneko, Y.; Kuroda, K.; Saka, H. Weak beam TEM study on stacking fault energy of high nitrogen steels. Steel Res. Int. 2009, 80, 477–481. [Google Scholar] [CrossRef]
  33. Sommer, C.; Christ, H.-J.; Mughrabi, H. Non-linear elastic behaviour of the roller bearing steel SAE 52100 during cyclic loading. Acta Metall. Mater. 1991, 39, 1177–1187. [Google Scholar] [CrossRef]
  34. Talonen, J.; Aspegren, P.; Hänninen, H. Comparison of different methods for measuring strain induced α’-martensite content in austenitic steels. Mater. Sci. Technol. 2004, 20, 1506–1512. [Google Scholar] [CrossRef]
  35. Biermann, H.; Glage, A.; Droste, M. Influence of temperature on fatigue-induced martensitic phase transformation in a metastable CrMnNi-steel. Metall. Mater. Trans. A 2016, 47, 84–94. [Google Scholar] [CrossRef]
  36. Misra, R.D.K.; Challa, V.S.A.; Venkatsurya, P.K.C.; Shen, Y.F.; Somani, M.C.; Karjalainen, L.P. Interplay between grain structure, deformation mechanisms and austenite stability in phase-reversion-induced nanograined/ultrafine-grained austenitic ferrous alloy. Acta Mater. 2015, 84, 339–348. [Google Scholar] [CrossRef]
  37. Challa, V.; Wan, X.L.; Somani, M.C.; Karjalainen, L.P.; Misra, R.D.K. Strain hardening behavior of phase reversion-induced nanograined/ultrafine-grained (NG/UFG) austenitic stainless steel and relationship with grain size and deformation mechanism. Mater. Sci. Eng. A 2014, 613, 60–70. [Google Scholar] [CrossRef]
  38. Challa, V.; Wan, X.L.; Somani, M.C.; Karjalainen, L.P.; Misra, R.D.K. Significance of interplay between austenite stability and deformation mechanisms in governing three-stage work hardening behavior of phase-reversion induced nanograined/ultrafine-grained (NG/UFG) stainless steels with high strength-high ductility combination. Scr. Mater. 2014, 86, 60–63. [Google Scholar] [CrossRef]
  39. Shen, Y.F.; Jia, N.; Wang, Y.D.; Sun, X.; Zuo, L.; Raabe, D. Suppression of twinning and phase transformation in an ultrafine grained 2 GPa strong metastable austenitic steel: Experiment and simulation. Acta Mater. 2015, 97, 305–315. [Google Scholar] [CrossRef]
  40. Jin, J.E.; Jung, Y.S.; Lee, Y.K. Effect of grain size on the uniform ductility of a bulk ultrafine-grained alloy. Mater. Sci. Eng. A 2007, 449–451, 786–789. [Google Scholar] [CrossRef]
  41. Kisko, A.; Hamada, A.S.; Talonen, J.; Porter, D.; Karjalainen, L.P. Effects of reversion and recrystallization on microstructure and mechanical properties of Nb-alloyed low-Ni high-Mn austenitic stainless steels. Mater. Sci. Eng. A 2016, 657, 359–370. [Google Scholar] [CrossRef]
  42. Yang, P.; Xie, Q.; Meng, L.; Ding, H.; Tang, Z. Dependence of deformation twinning on grain orientation in a high manganese steel. Scr. Mater. 2006, 55, 629–631. [Google Scholar] [CrossRef]
  43. Ullrich, C.; Eckner, R.; Krüger, L.; Martin, S.; Klemm, V.; Rafaja, D. Interplay of microstructure defects in austenitic steel with medium stacking fault energy. Mater. Sci. Eng. A 2016, 649, 390–399. [Google Scholar] [CrossRef]
Figure 1. Initial microstructures of CG and UFG materials conditions obtained from EBSD investigations. (ac) Crystallographic orientation maps of CG (a) and UFG (b,c) conditions. (d) Grain size distributions. (e) Misorientation distributions. (f) Texture of UFG material. ND—normal direction, TD transverse direction, LA—loading axis.
Metals 12 01222 g001
Figure 2. Specimen geometry for fatigue tests of CG (a) and UFG (b) material conditions. All dimensions are in mm.
Metals 12 01222 g002
Figure 3. Cyclic hardening/softening curves for (a) CG and (b) UFG material states. Comparison of total strain-controlled (∆εt/2) (black curves) and plastic strain-controlled (εpl/2) (gray curves) fatigue tests.
Metals 12 01222 g003
Figure 4. Evolution of ferromagnetic phase fraction in CG (a,c) and UFG material (b,d) conditions during cyclic loading under (a,b) total strain control and (c,d) plastic strain control with different amplitudes.
Metals 12 01222 g004
Figure 5. Evolution of ferromagnetic phase fraction as a function of cumulative plastic strain for UFG and CG material conditions during total strain (a) and plastic strain (b) controlled fatigue tests.
Metals 12 01222 g005
Figure 6. Results of EBSD measurements on CG (a,d) and UFG (b,c,e,f) material conditions at different total strain amplitudes of ∆εt/2 = 0.3% (a,d), ∆εt/2 = 0.4% (b,e) and ∆εt/2 = 0.5% (c,f). Color code of phase maps (ac): gray—austenite, yellow—ε-martensite, blue—α’-martensite. Crystallographic orientation maps of α’-martensite (df) are shown by inverse pole figure color code of the normal direction.
Metals 12 01222 g006
Figure 7. Fatigue life curves of total strain amplitude vs. reversals to failure of UFG and CG conditions (a) and evolution of plastic strain amplitude vs. number of cycles (b) obtained during total strain-controlled fatigue tests. (c) Fatigue lives obtained under plastic strain control for UFG and CG conditions. (d) Coffin–Manson plots calculated from total strain-controlled tests using stress amplitudes at different fractions of fatigue life Nf compared to fatigue lives obtained from plastic strain-controlled fatigue tests. (e) Coffin–Manson plots calculated from total strain-controlled tests using linear damage accumulation fit compared to fatigue lives obtained from plastic strain-controlled fatigue tests and the normally used comparison point at Nf/2.
Metals 12 01222 g007
Table 1. Chemical composition and mechanical properties of CG and UFG material conditions (Fe balance). In addition, Ms, SFE, area-weighted average grain size D and martensite content after tensile testing are provided.
SteelCNCrMnNiSiSFE
(mJ/m²)
Ms
(°C)
D
(µm)
Rp0.5
(MPa)
UTS
(MPa)
A
(%)
Vol % α’
(%)
CG0.020.0616.47.16.30.117.9−28622676976918
UFG0.030.0215.67.16.10.911.9−210.7892310633520
Publisher’s Note: MDPI stays neutral with regard to jurisdictional claims in published maps and institutional affiliations.