Article

Effect of Cold Deformation on Microstructure and Mechanical Behavior of Commercially Pure Grade 4 Titanium Strip

1
School of Mechanical Engineering and Automation, Beihang University, Beijing 100191, China
2
State Key Laboratory of Special Rare Metal Materials, Northwest Rare Metal Materials Research Institute Ningxia Co., Ltd., Shizuishan 753000, China
3
Ningxia Horizontal Titanium Industry Co., Ltd., Shizuishan 753000, China
4
School of Materials Science and Engineering, Northwestern Polytechnical University, Xi’an 710072, China
*
Authors to whom correspondence should be addressed.
Metals 2022, 12(7), 1166; https://doi.org/10.3390/met12071166
Submission received: 3 June 2022 / Revised: 25 June 2022 / Accepted: 5 July 2022 / Published: 8 July 2022
(This article belongs to the Special Issue Light Alloy and Its Application)

Abstract

:
The microstructure and mechanical behavior of commercially pure grade 4 (Gr.4) titanium strips with different deformations were studied by optical microscope (OM), scanning electron microscopy (SEM), transmission electron microscopy (TEM), uniaxial tensile test, and hardness test. The work-hardening characteristics of a Gr.4 strip were analyzed with a true-stress–strain curve. The results show that cold deformation can significantly improve the strength and hardness of a commercially pure titanium Gr.4 strip, which has significant work hardening characteristics. With the increase in deformation amount, the grain is stretched into a fibrous shape along the longitudinal direction, while the strength and hardness increase and the plasticity decreases. Moreover, there is a significant linear relationship between the tensile strength and hardness. The true-stress–true-strain curves of a Gr.4 strip in different states were analyzed by combining three hardening models. It was found that the true-stress–true-strain curve of an annealed Gr.4 strip can be regressed by the Ludwigson, Voce, and Swift models, the Ludwigson model has a higher fitting accuracy, and the fitting results of the tensile true-stress–true-strain curves of Gr.4 strips after cold deformation hardening are not ideal. The cold deformation mechanism of a Gr.4 strip is mainly based on slippage, with an increase in dislocation density and dislocation tanglement leading to work-hardening behavior during cold deformation.

1. Introduction

Industrially pure titanium, also known as commercially pure titanium (CP Ti), has many applications in many industries due to its advantages of being lightweight and having high specific strength, excellent cold and hot working properties, superior corrosion resistance, no magnetism, and excellent biocompatibility [1,2,3,4]. Commercially pure titanium includes four grades (i.e., grade 1, grade 2, grade 3, and grade 4) with strength ranging from 240 to 740 MPa [5], all consisting of single α phase composition, with good microstructure stability and welding properties. For heat treatment, α phases are not sensitive, so commercially pure titanium cannot be enhanced in strength by heat-treatment methods and generally has only moderate strength levels [6]. Among them, grade 4 (Gr.4) has the highest strength and hardness with a minimum yield strength of 480 MPa, and it also has the highest oxygen and iron content [7]. Therefore, to meet the increasing requirements of comfort and being lightweight, for the function of electronic products, grade 4 strips are designed to be the basis materials for making some high-end electronic-product precision components, which not only require the strips to have high-precision surface quality but also have excellent mechanical properties [8].
The cold-working performance of grade 4 is much poorer than that of grade 1 (Gr.1), grade 2 (Gr.2), and grade 3 (Gr.3), so there is very little in the literature about the applications of and research on grade 4. Claudio et al. [5] conducted a study on the thermomechanical process of Gr.4 sheets and found that the microstructure evolution of the alloys could be modified by adding a small amount of iron. Mertov á K et al. [7], comparatively, studied rotary-swaged (cold swaging) of industrially pure titanium Gr.2 and Gr.4 at room and low temperature, and a high strength was obtained for both materials though minor surface defects appeared. Islamgaliev et al. [9] investigated the microstructure and mechanical properties of Gr.4 prepared by high pressure torsion (HPT) and found that the tensile strength of Gr.4 after HPT processing achieves 1600 MPa, and the grain size was also significantly refined. Li et al. [10] also substantially improved the mechanical properties of Gr.4 by encapsulation-aided equal-channel angular pressing, with yield and tensile strengths reaching the level of conventional Ti6Al4V alloys. Dyakonov et al. [11] studied the static annealing behavior and the evolution of the microstructure–strength relationship of severely deformed commercially pure titanium grade 4 over the temperature range of 50 to 850 °C. The results showed that the annealing behavior of severely deformed grade 4 titanium at 450 to 500 °C was not satisfactory. The results of the rapid growth of the strain-free grains occurred, which eliminated the severely deformed microstructure at 450–500 °C. A further increase in annealing temperature to 600 °C led to a normal grain growth. From a consideration of the microstructure–strength relationship, it was suggested that the deformation behavior of the fully annealed material is markedly influenced by mechanical twinning. Dissolution of component iron-rich grains was observed at 600 °C and higher temperatures. After water quenching at 850 °C, the material results into a β→α’ martensitic-phase transformation. Masikane et al. [12] compared the properties of commercially pure titanium (CP-Ti) grade 4 prepared by spark plasma sintering (SPS), cold isostatic pressing (CIP), and sinter and casting. They found that the microstructural features were homogeneous and mainly consisted of a plate-like α-Ti phase for all three technologies. Choi et al. [13] studied the strengthening of grade-4 CP Ti by cryogenic-temperature rolling (CTR), which enables deformation twinning in grade 4 CP Ti to achieve twinning-induced grain refinement. CTR with an area reduction of only 30% significantly increased the yield strength to 946 MPa, which is not achievable through typical processes performed at or above room temperature. Chausov et al. [14] used the complete stress–strain diagram method to evaluate the relative change of the fracture toughness of statically loaded titanium alloys, which is very useful, but this crack-evaluation technique is not suitable for plastic thin plates. Su et al. [8] conducted a study on the microstructure and mechanical properties of industrially pure titanium Gr.4 strips and analyzed the relationship between the microstructure and mechanical properties, but there is no related study on the true-stress–true-strain curve and hardening behavior of Gr.4 strip cold deformation.
In this paper, the effect of different cold deformation amounts on the microstructure and mechanical behavior of Gr.4 strips is analyzed by cold rolling, the true-stress–true-strain curve of the alloy is described using the Ludwigson, Voce and Swift models, and the work-hardening mechanism of the cold deformation of Gr.4 strips is explored.

2. Materials and Methods

2.1. Materials

An 8 tonne Gr.4 ingot of Φ900 mm (see Table 1 for chemical composition) is used as raw material to prepare a 200-mm-thick hot-rolled slab after several forging and mechanical processing. This is followed by hot rolling, pickling, cold rolling, oil removal, and annealing treatment to a 0.55-mm-thick strip coil. The 0.55-mm-thick strip was then cold-rolled and deformed by a four-roller strip mill, to obtain strip samples with different cold-deformation amounts of 15%, 25%, 35%, and 42%.

2.2. Mechanical Properties and Microstructure Analysis

Samples were cut along the longitudinal direction of the strip. Tensile properties at room temperature were tested on an electronic universal testing machine (5582, Instron, Norwood, MN, America), in accordance with ASTM (American Society for Testing Materials) E8 specifications for dog-bone-shaped specimens, with a parallel section width of 12.5 mm, a length of 75 mm, and a marker distance of 50 mm. The hardness of the specimens was tested using a Shimadzu microhardness tester (HMV-2T, Shimadzu, Tokyo, Japan).
The longitudinal metallographic specimens (parallel to the rolling direction) were prepared in a standard procedure and etched in a solution consisting of HF (5 mL), HNO3 (15 mL), and H2O (35 mL) for about 10 s and observed using an optical microscope (OM GX51, Olympus, Tokyo, Japan) and a field-emission scanning-electron microscope (Sigma HD, Carl Zeiss AG, Oberkochen, Germany). In addition, average-grain-size tests were performed according to ASTM E112 specifications. In order to determine the β-phase and deformation mechanisms, transmission electron microscopy (FEI talos F200X, Thermo Fisher Scientific, Waltham, MA, America) was used to observe and analyze the second-phase grains and deformation dislocations.

3. Results and Discussion

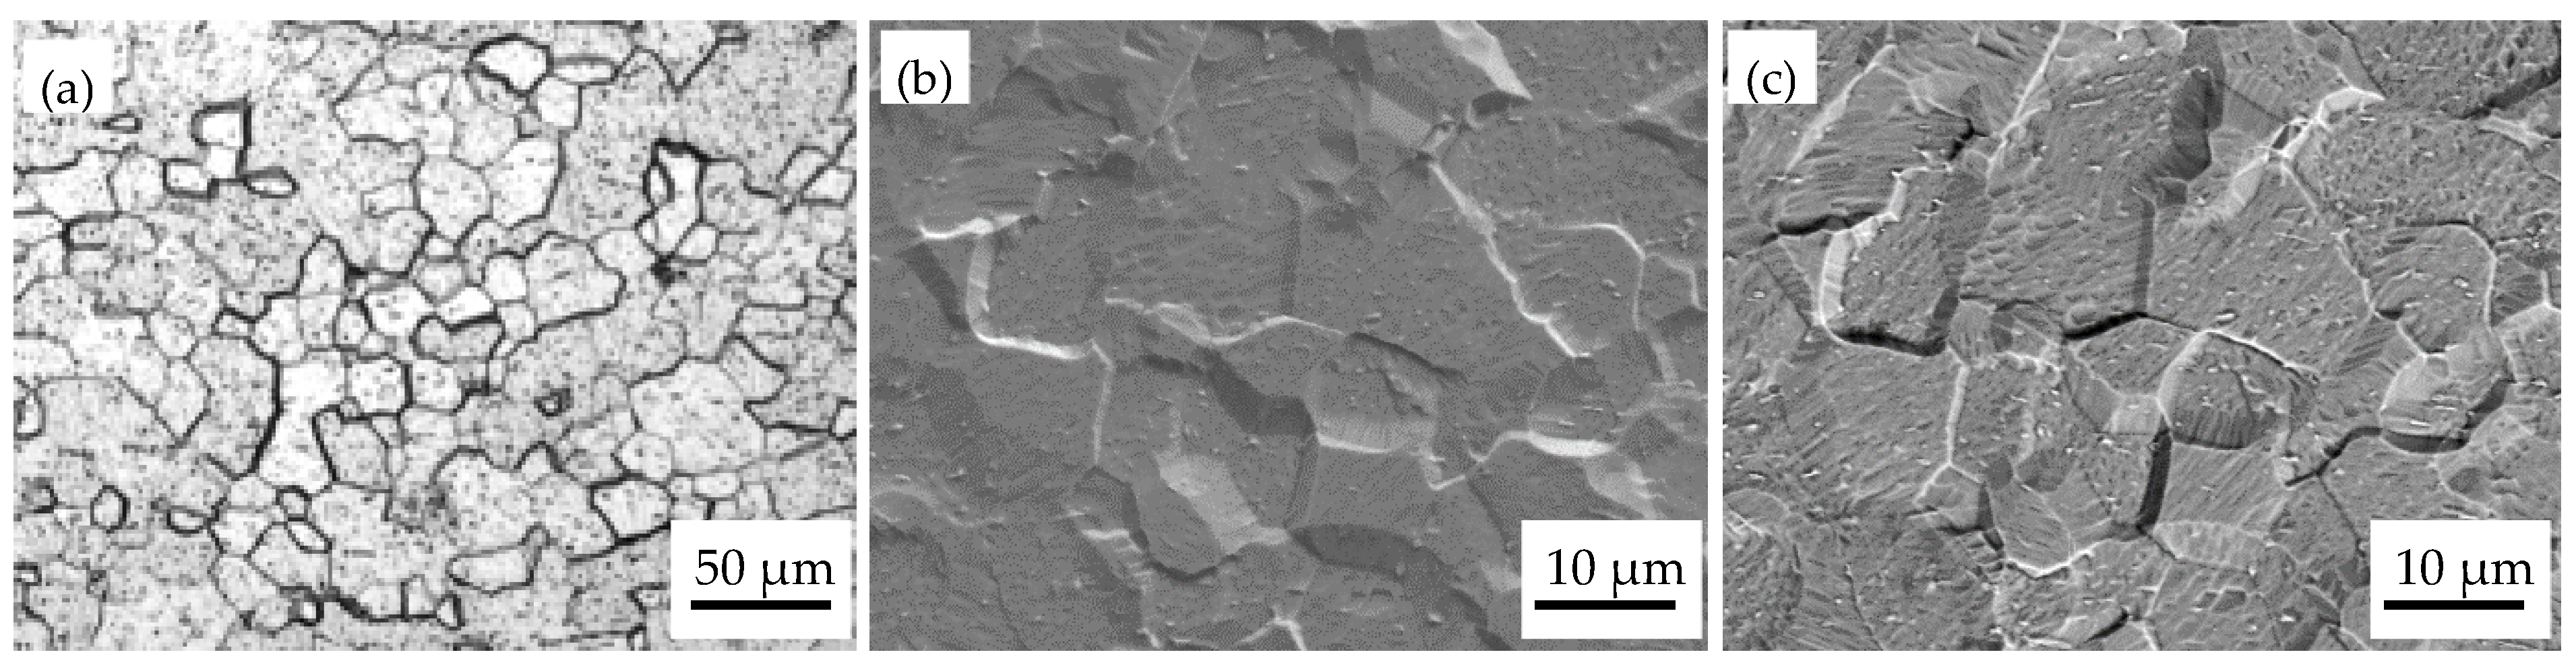
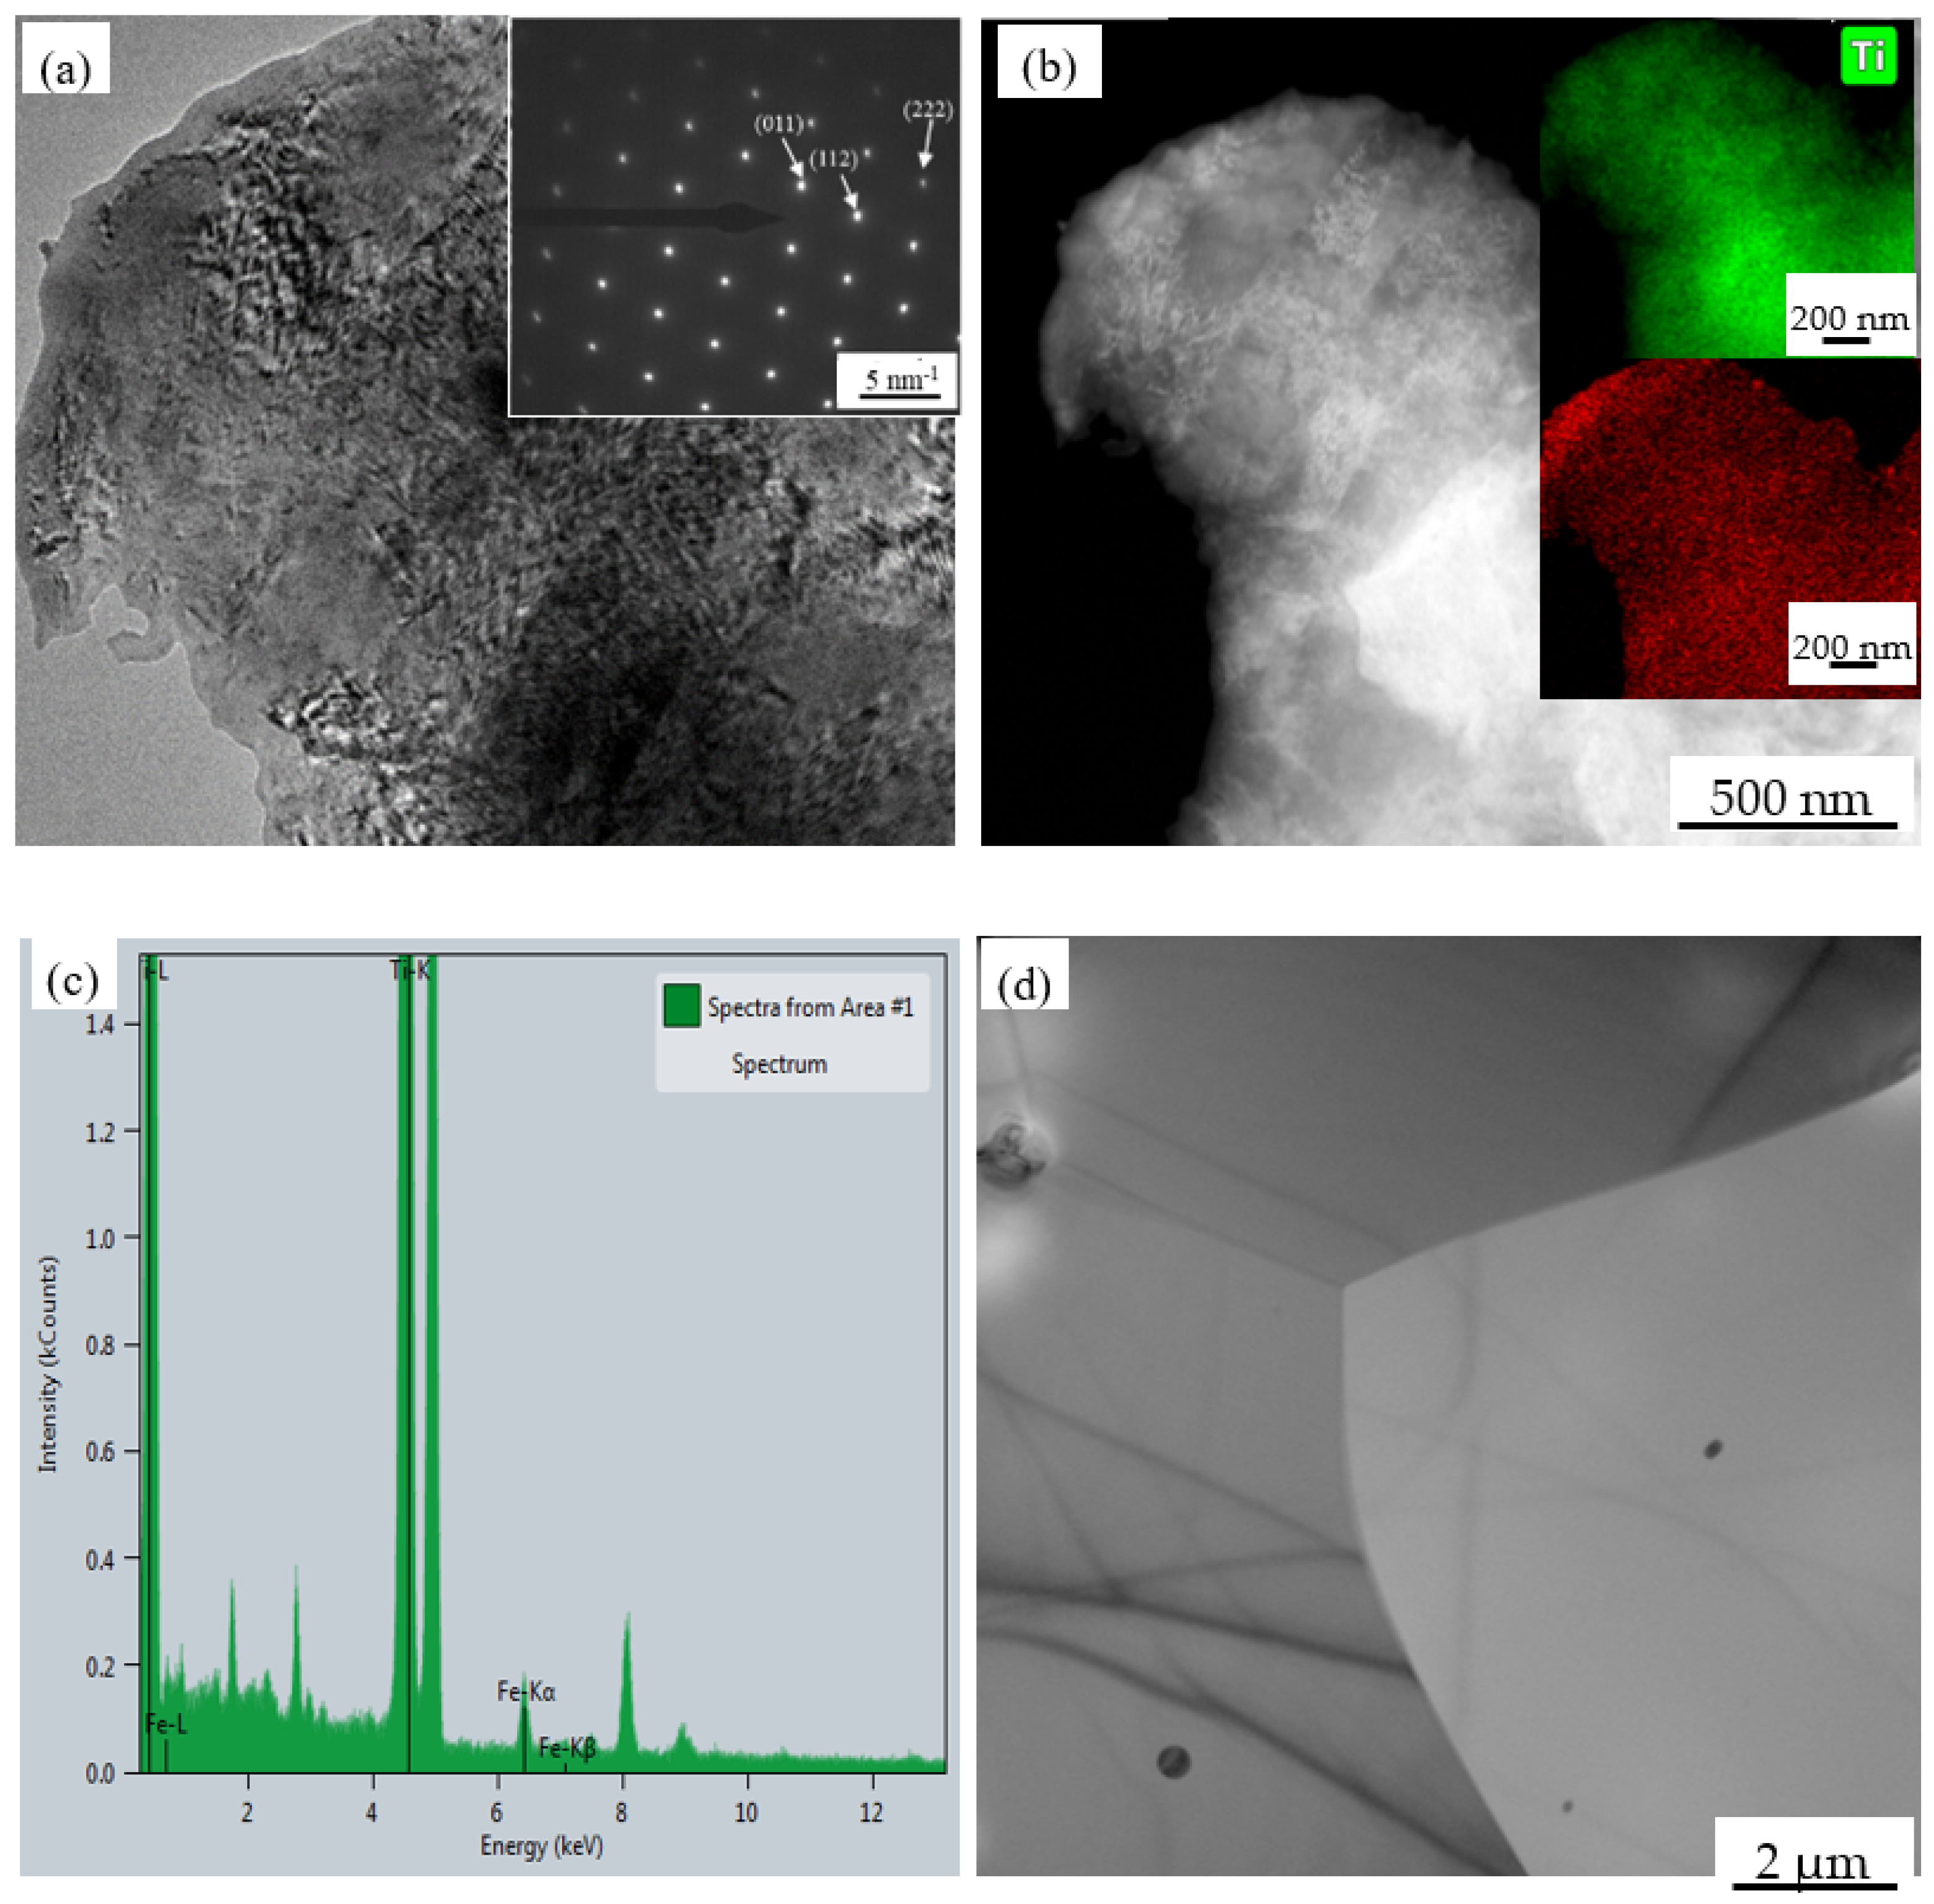
3.1. Characteristics of the Original Microstructure

Figure 1 shows the microstructure of a Gr.4 strip in the fully annealed state. It can be seen that the microstructure is basically in a recrystallized, equiaxed α phase, and the grain size is relatively uniform, with an average grain size of about 26.7 μm (ASTM 7.5 grain size), as shown in Figure 1a. Figure 1b,c are the secondary-electron (SE) image and the backscattered electron (BSE) of scanning-electron microscopy (SEM), respectively. Obviously, no twins were found in the grains in Gr.4, and there were spot-like second-phase particles, but twinning is prevalent in Gr.1 and Gr.2 [15,16]. The possible reason for the absence of twins in Gr.4 is that the microalloyed O and Fe elements inhibit the generation of twins. In addition, due to the relatively high Fe content in Gr.4, the granular second phase in the microstructure is β phase [5]. Through transmission-electron microscopy (TEM) and energy-dispersive-spectrometer (EDS) analysis, it was further confirmed that there is a β phase containing an Fe-containing bcc structure in the Gr.4 pure titanium, as shown in Figure 2.

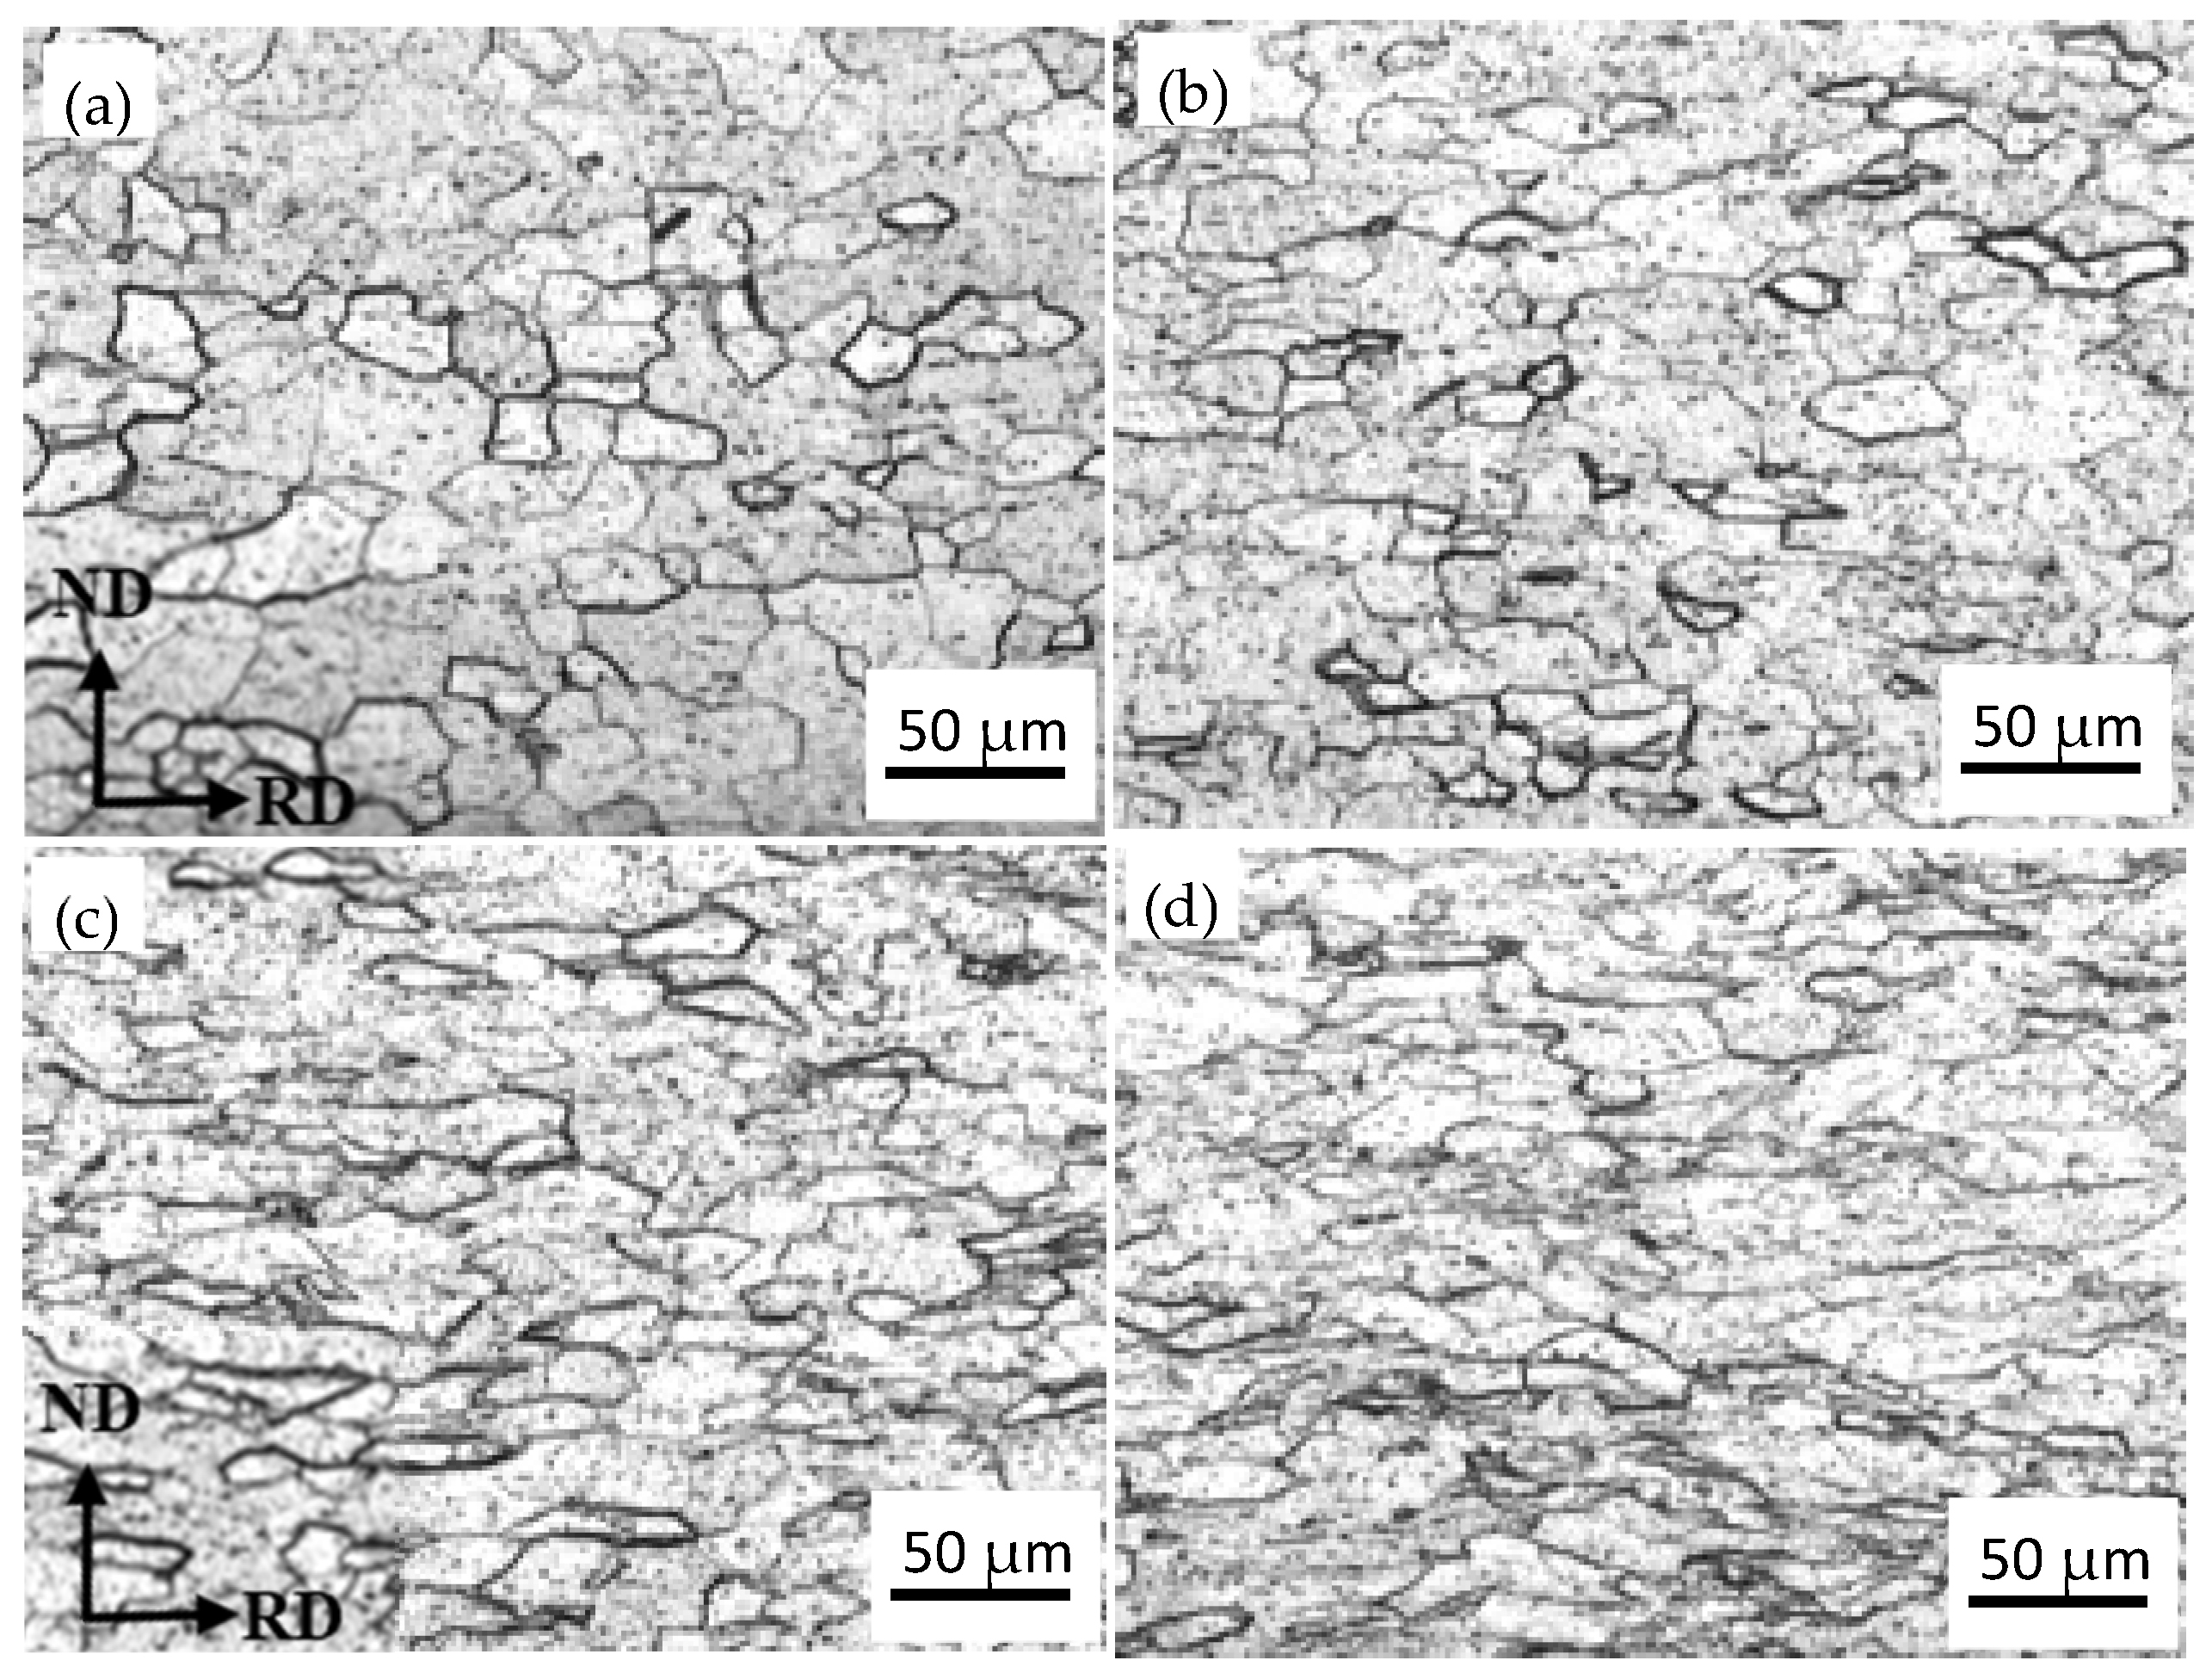
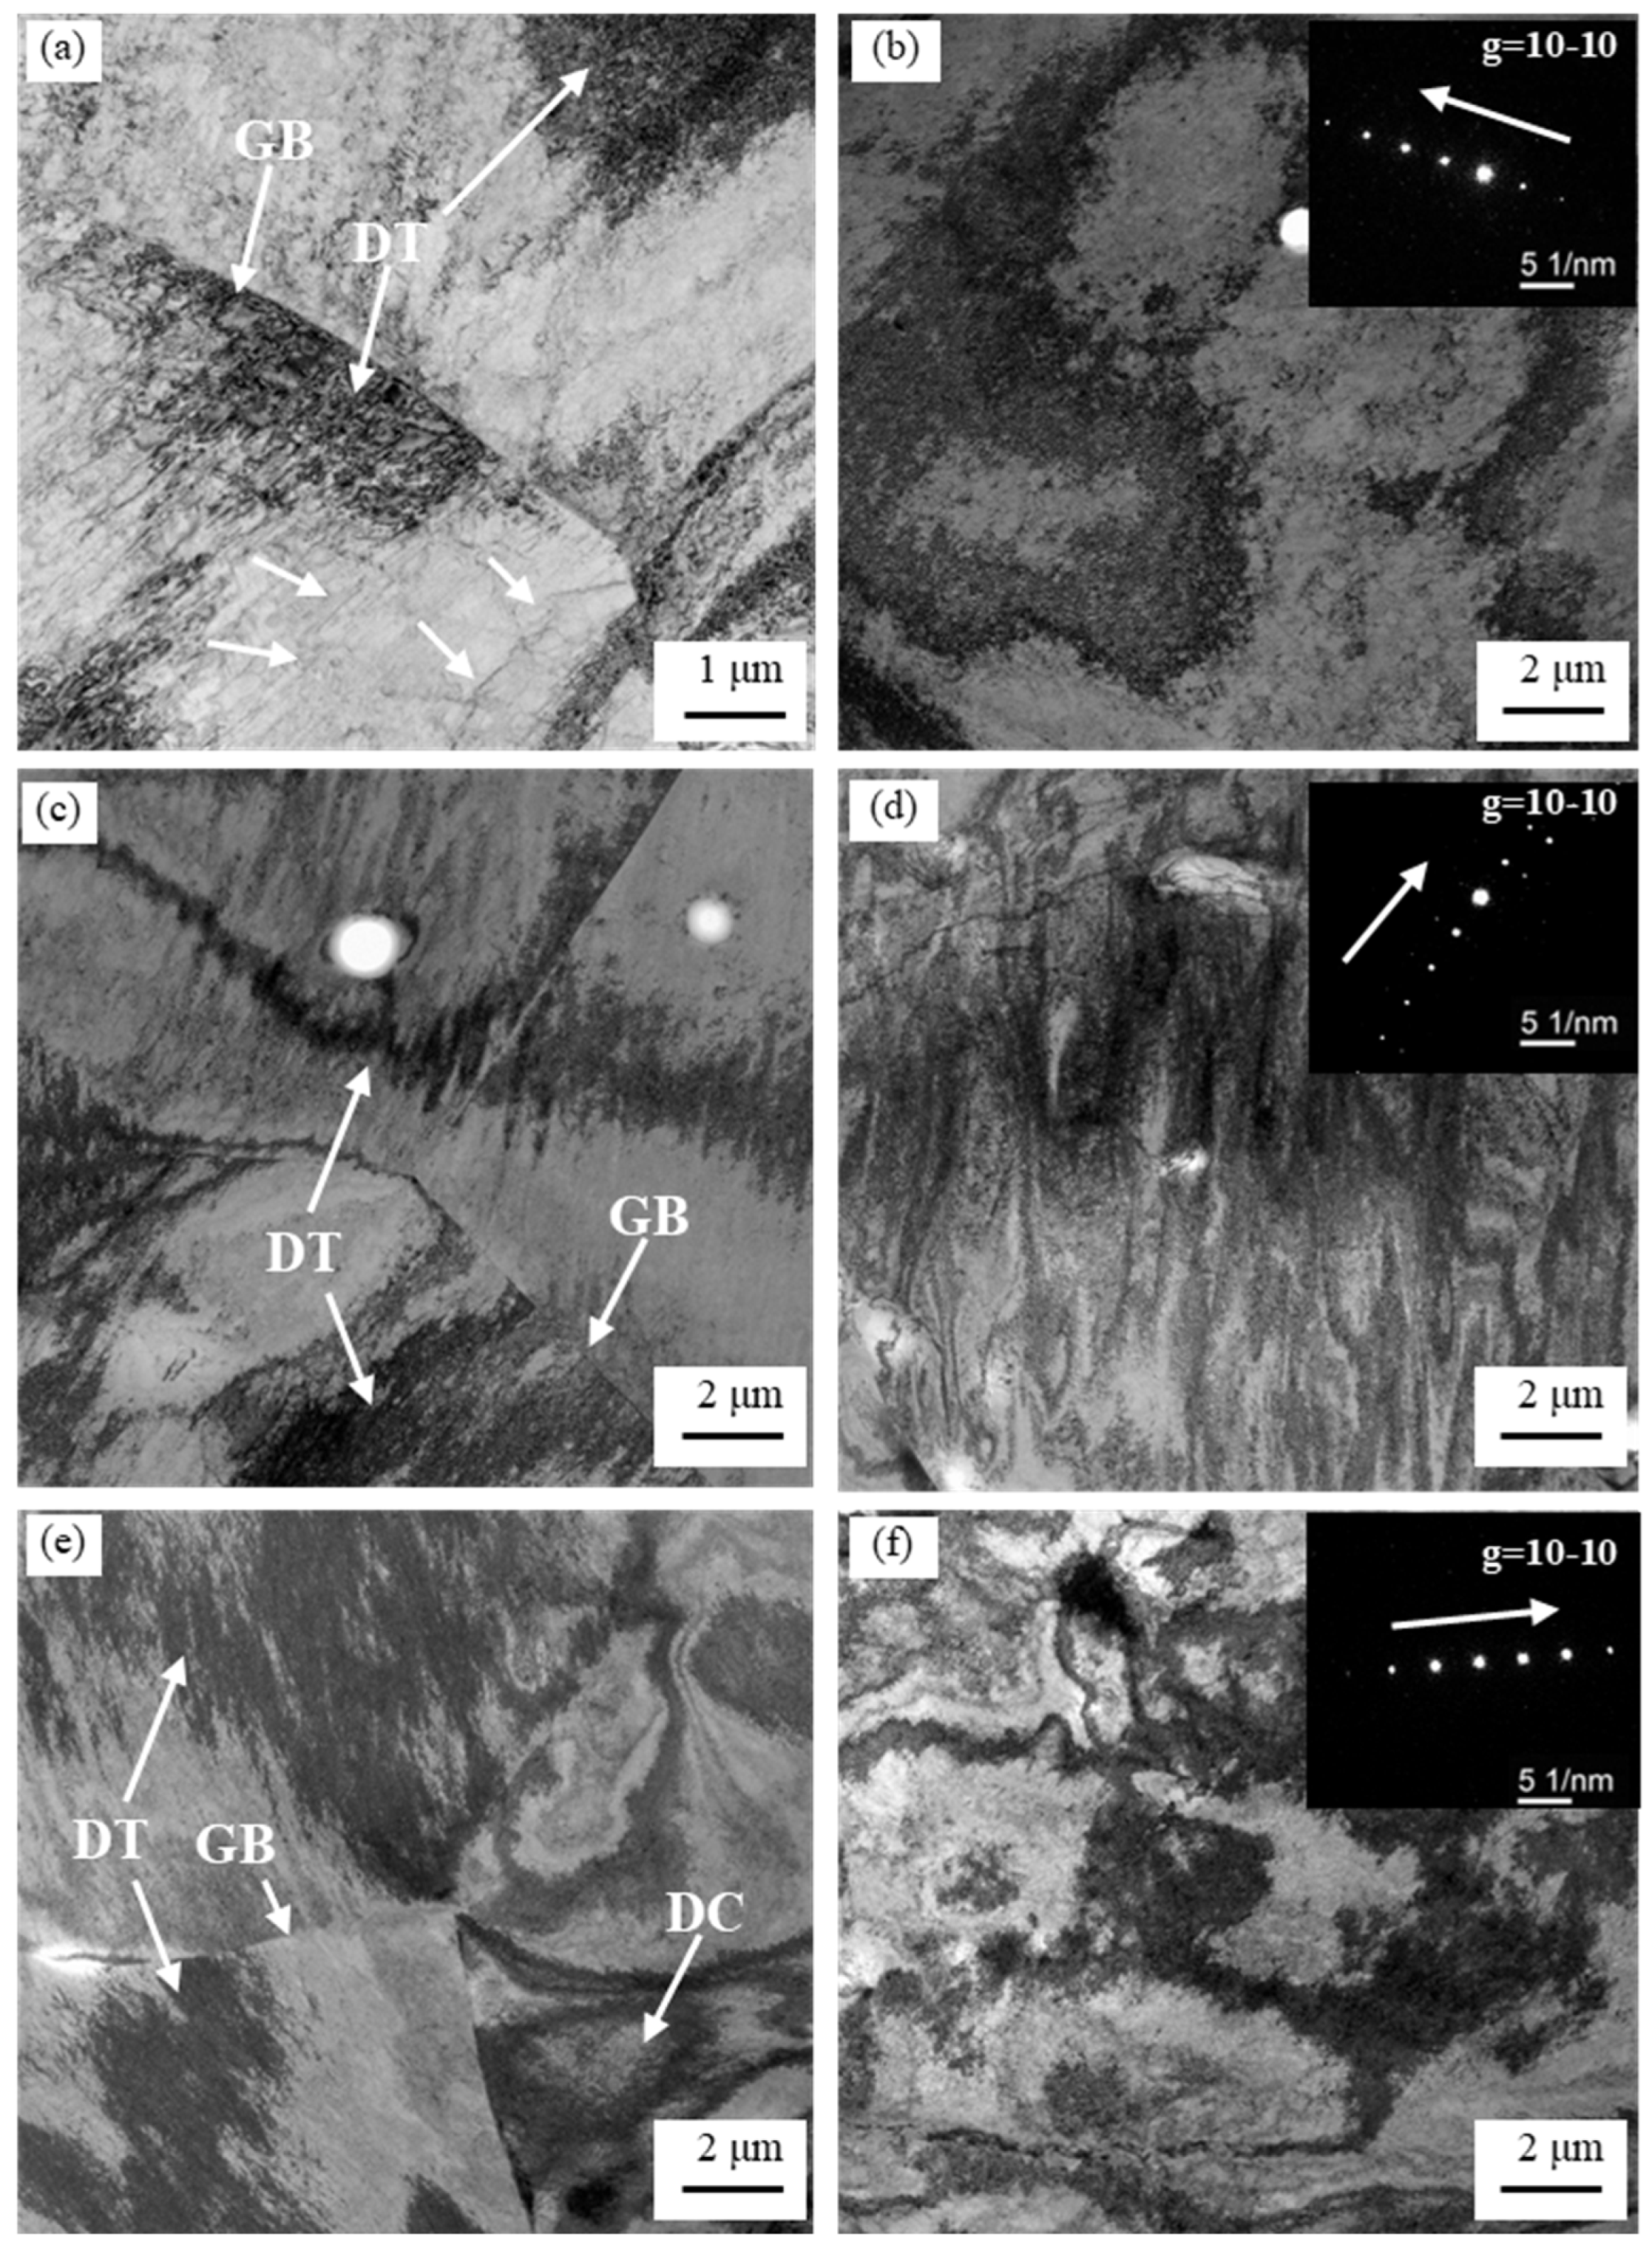
3.2. Microstructure of Cold Deformation

The optical microstructures of Gr.4 strips after different cold-deformation amounts were shown in Figure 3. With the increase in deformation, the equiaxed grain shape is elongated and flattened along the rolling direction (RD) and gradually becomes a fibrous structure. When the amount of deformation is 15%, the elongation deformation of equiaxed grains is not significant (see Figure 3a); when the amount of deformation reaches 35%, the flattening of the grains is very obvious (see Figure 3c). In other words, as the amount of deformation increases, the degree of deformation of the grains elongated in the longitudinal direction and the microstructure defects gradually increase [17], some grain boundaries are distorted and deformed, and the distribution of longitudinal metal streamlines becomes more and more obvious (see Figure 3d). From the grain aspect ratio (the ratio of the long axis and the short axis of the grain), the grain aspect ratio of the fully annealed state is close to 1 (see Figure 1a). However, after cold deformation, the grains gradually flatten along the rolling direction, and the aspect ratio becomes larger and larger. The average grain aspect ratios with different cold deformations correspond to 15%, 25%, 35%, and 42% are 1.6, 2.4, 3.3, and 4.2, respectively.
Figure 4 shows the TEM bright-field (BF) images of Gr.4 strips after different cold deformations. It can be seen from the figure that no twins are found in the grains, so the cold deformation of Gr.4 is mainly based on slip. At 15% deformation, a cross-slip formed by single-slip interactions (shown by arrows) can be observed near the grain boundary (GB). At the same time, the dislocation configuration within the grain presents many non-uniform, localized, high-density regions of dislocations, forming dislocation entanglement (DT, indicated by arrows). With the increase in deformation, the cross-slip disappears and the dislocation density increases. Furthermore, when the deformation is 42%, distinct dislocation walls and dislocation cells (DC, indicated by arrows) can be observed. The type of dislocation can be characterized by g · b = 0 (g is the diffraction vector, that is, the reciprocal vector of a strongly diffracted crystal plane used to obtain the diffraction contrast) invisibility criterion [18]. Under the double-beam condition and g = 10–10 diffraction mode, it can be observed that a large number of movable dislocations are activated in the grain, especially the prismatic <a> dislocations [19], see Figure 4b,d,f.

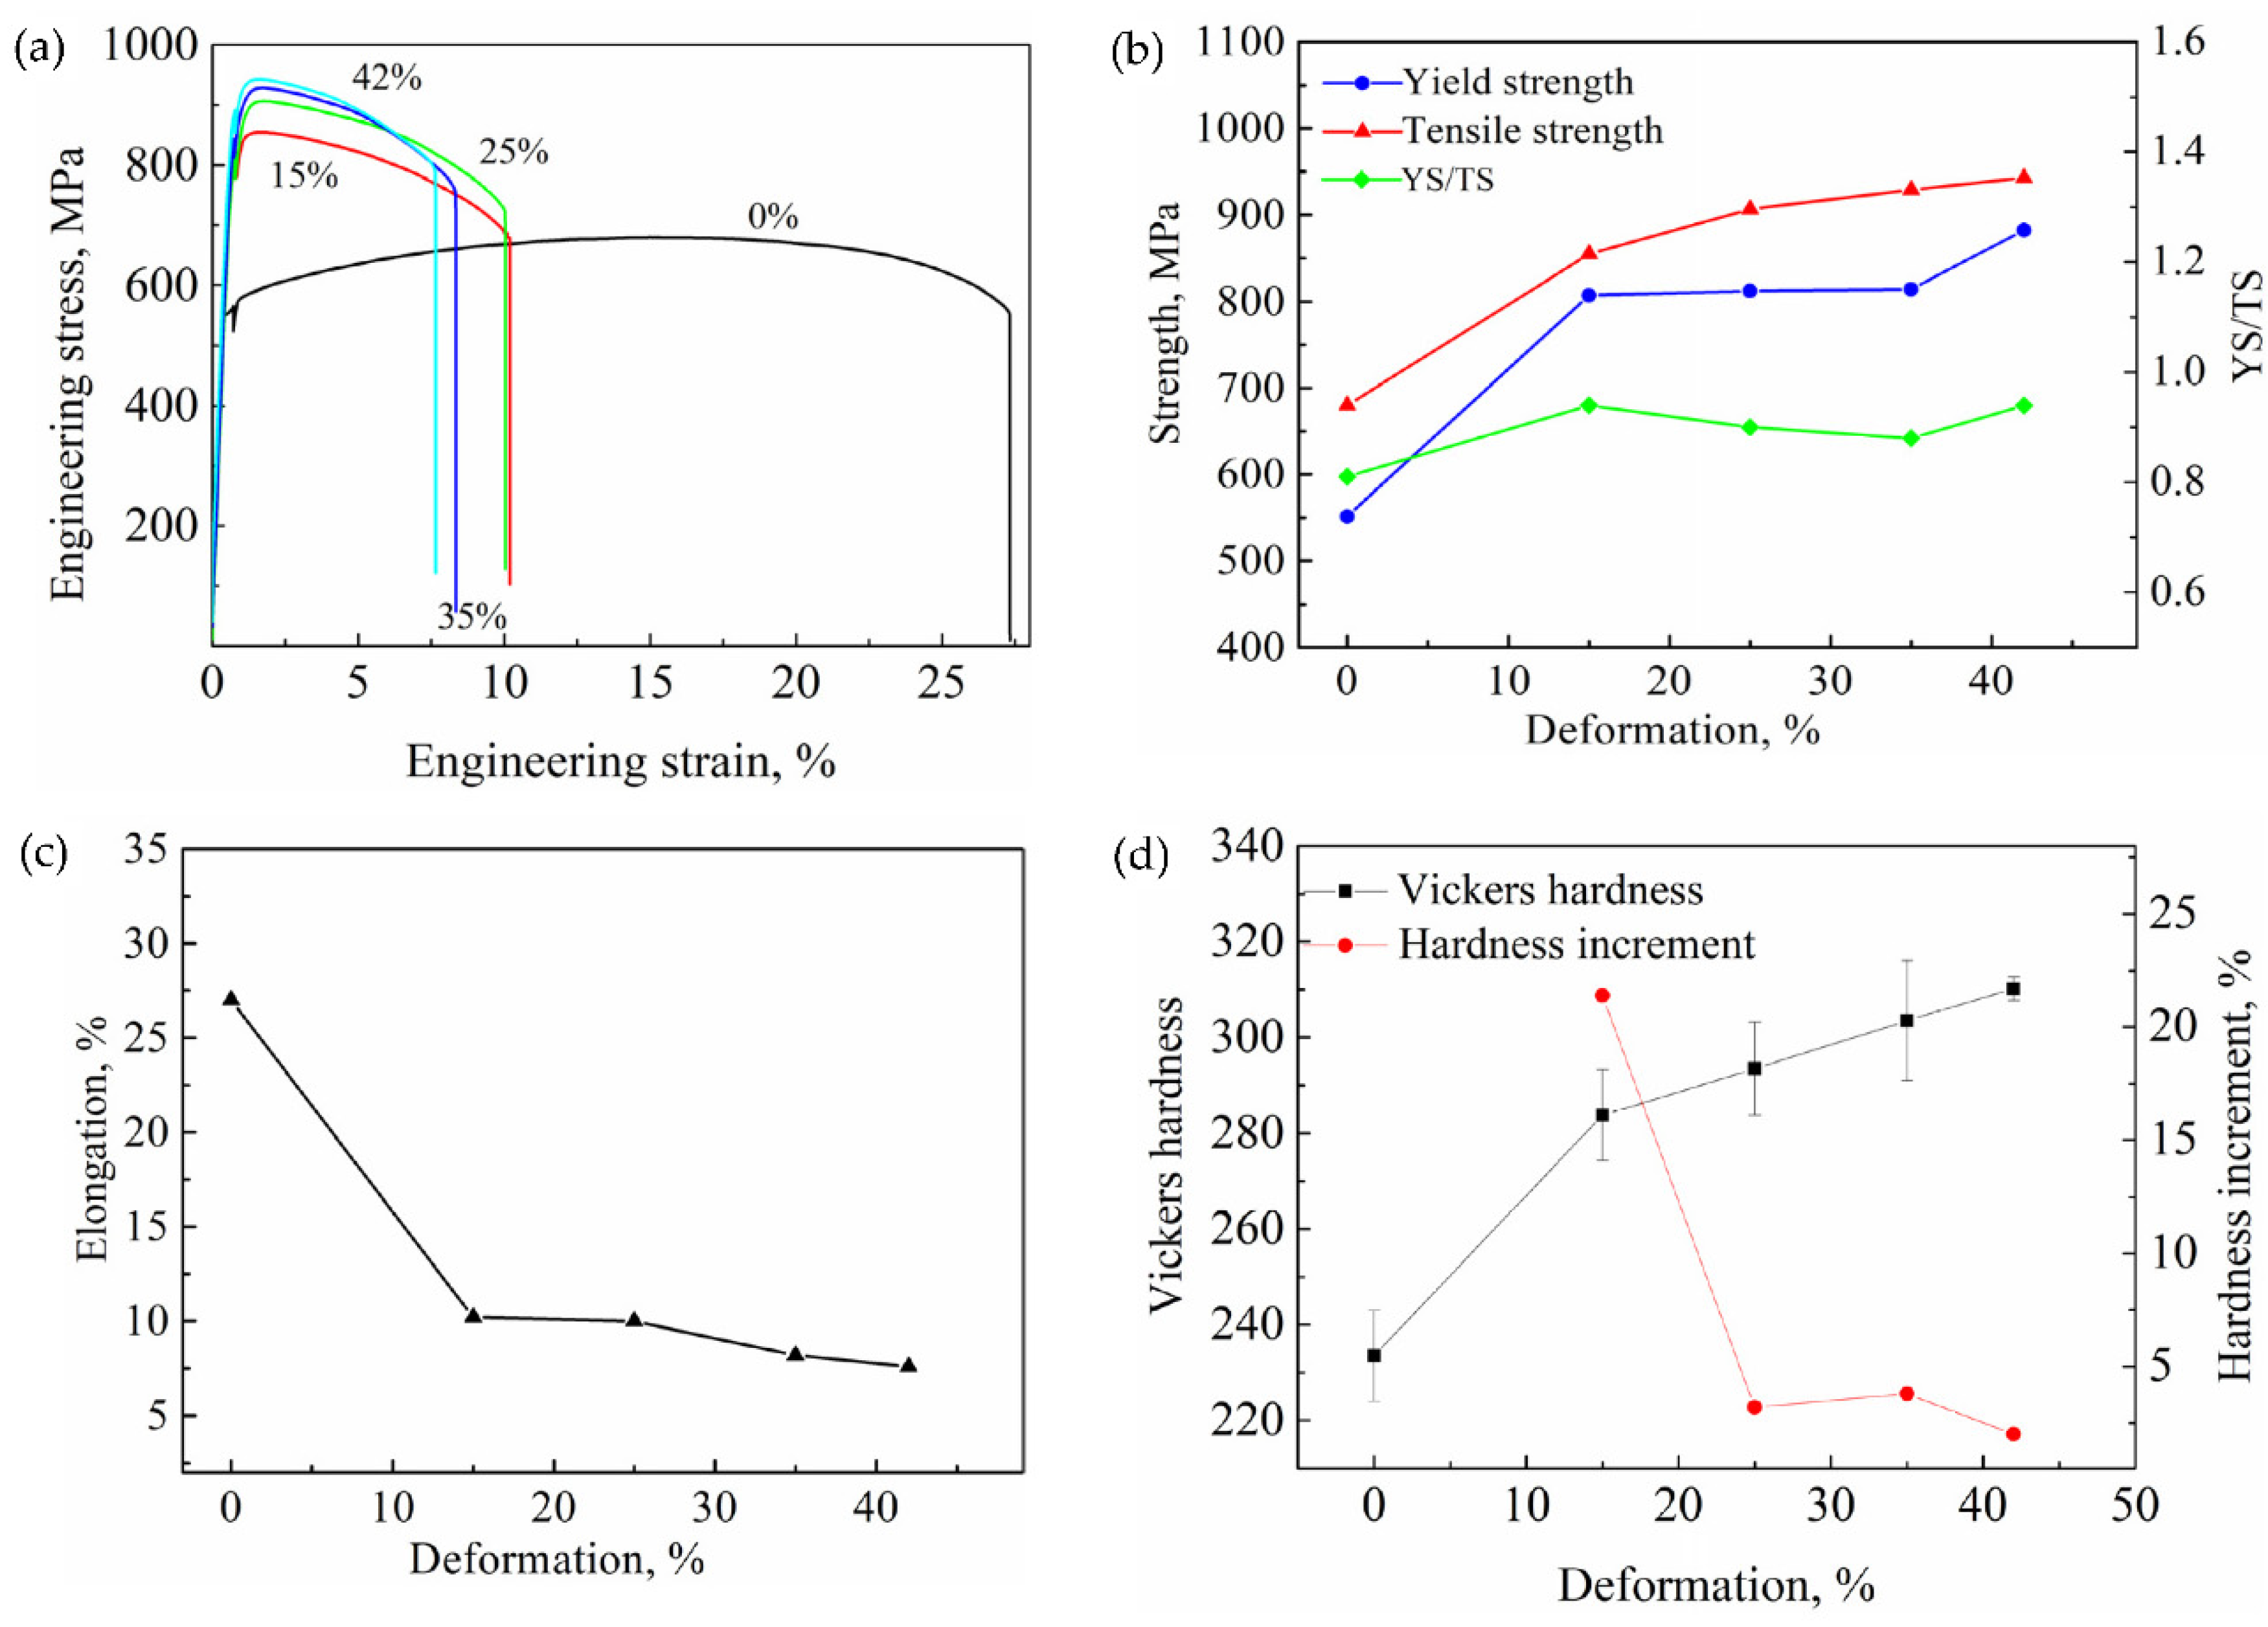
3.3. Mechanical Properties

The room-temperature tensile properties of Gr.4 strips with different deformation amounts were shown in Figure 5. The Figure 5a shows the engineering stress–strain curve at room temperature (note: the peak observed on the tensile curve at the initial stage of deformation is due to the removal of the extensometer during the test). It can be seen from the curve comparison that the strengthening effect of cold deformation on the Gr.4 strip is very significant, especially in the early stage of deformation, and then the strengthening effect gradually weakens with the increase in the deformation amount. When the stress exceeds the tensile strength, it gradually begins to decrease, especially the tensile curve after cold deformation hardening, because the uniform plastic deformation stage is obviously shortened, and the stress decrease after the tensile strength is more obvious with the increase in deformation; Figure 5b,c show that the tensile strength and yield strength increase very significantly with the increase in cold deformation, and the elongation also decreases significantly. The tensile strength and yield strength of the annealed state before cold deformation are 680.1 and 551.6 MPa, respectively, and the elongation was 27%. After 15% cold deformation, the strength increased by 25.7% and 46.3%, respectively, and the plasticity decreased by 62%. When the deformation increase, the increase in strength decreases gradually, and the decrease in plasticity also decreases. At the same time, it can also be seen that the yield–strength ratio of the strip also increases with the increase in the deformation. The yield–strength ratio increases from 0.81 in the annealed state up to 0.94 after 42% cold deformation, while after 15% cold deformation, the increase in yield strength ratio is the largest. It shows that the plasticity of the material decreases gradually with the increase in cold deformation, which is consistent with the change trend of the elongation. In addition, it also shows that with the increase in deformation, the gap between yield strength and tensile strength is getting closer and closer. The reason is that the yield strength of the material is mainly affected by the large-scale slip of dislocations, and the cold deformation causes dislocations inside the material continuously. As the deformation increases, the dislocation density and the interaction between the dislocations also increase. Therefore, cold deformation can significantly increase the yield strength of the material. The tensile strength is mainly affected by the initiation and propagation of micro-cracks in the material, and the influence of dislocation motion is relatively limited. Therefore, the increase in the tensile strength of cold deformation is not as significant as that of yield strength [20].
The hardness variation curve of a Gr.4 strip with different cold-deformation amounts is shown in Figure 5d. The hardness of the annealed state is HV235, and the hardness after 25% deformation increased to HV284; the hardness increase (that is, the relative amount of hardness increase, (HV1-HV0)/HV0 × 100%, where HV0 is the initial hardness value, and HV1 is the changed hardness value) is as high as 21.4%. When the deformation increased to 42%, the hardness of the strip increased to HV310, so the hardness increase is reduced to 2.0%. The variation trends of the hardness and tensile strengths of different cold deformations were relatively close, and there were also the largest hardness increase in the initial deformation, which gradually decreases with the increase in cold deformation, showing an obvious phenomenon of work hardening [21,22,23].
The relationship between the strength and hardness of Gr.4 strip is shown in Figure 6. As shown in Figure 6a, both tensile strength and yield strength increase with the increase in hardness, showing a positive correlation. However, due to the large fluctuation of yield strength, the correlation with hardness is not as good as with tensile strength. Therefore, by fitting the tensile-strength and hardness test values, the results show a good linear relationship (correlation coefficient R2 = 0.9903, see Figure 6b), and the expression for the fitting is written as follows:
R m = 3.54 H V 147.39
where Rm is the tensile strength, and HV is Vickers hardness.

3.4. True-Stress–True-Strain Curve and Mathematical Description
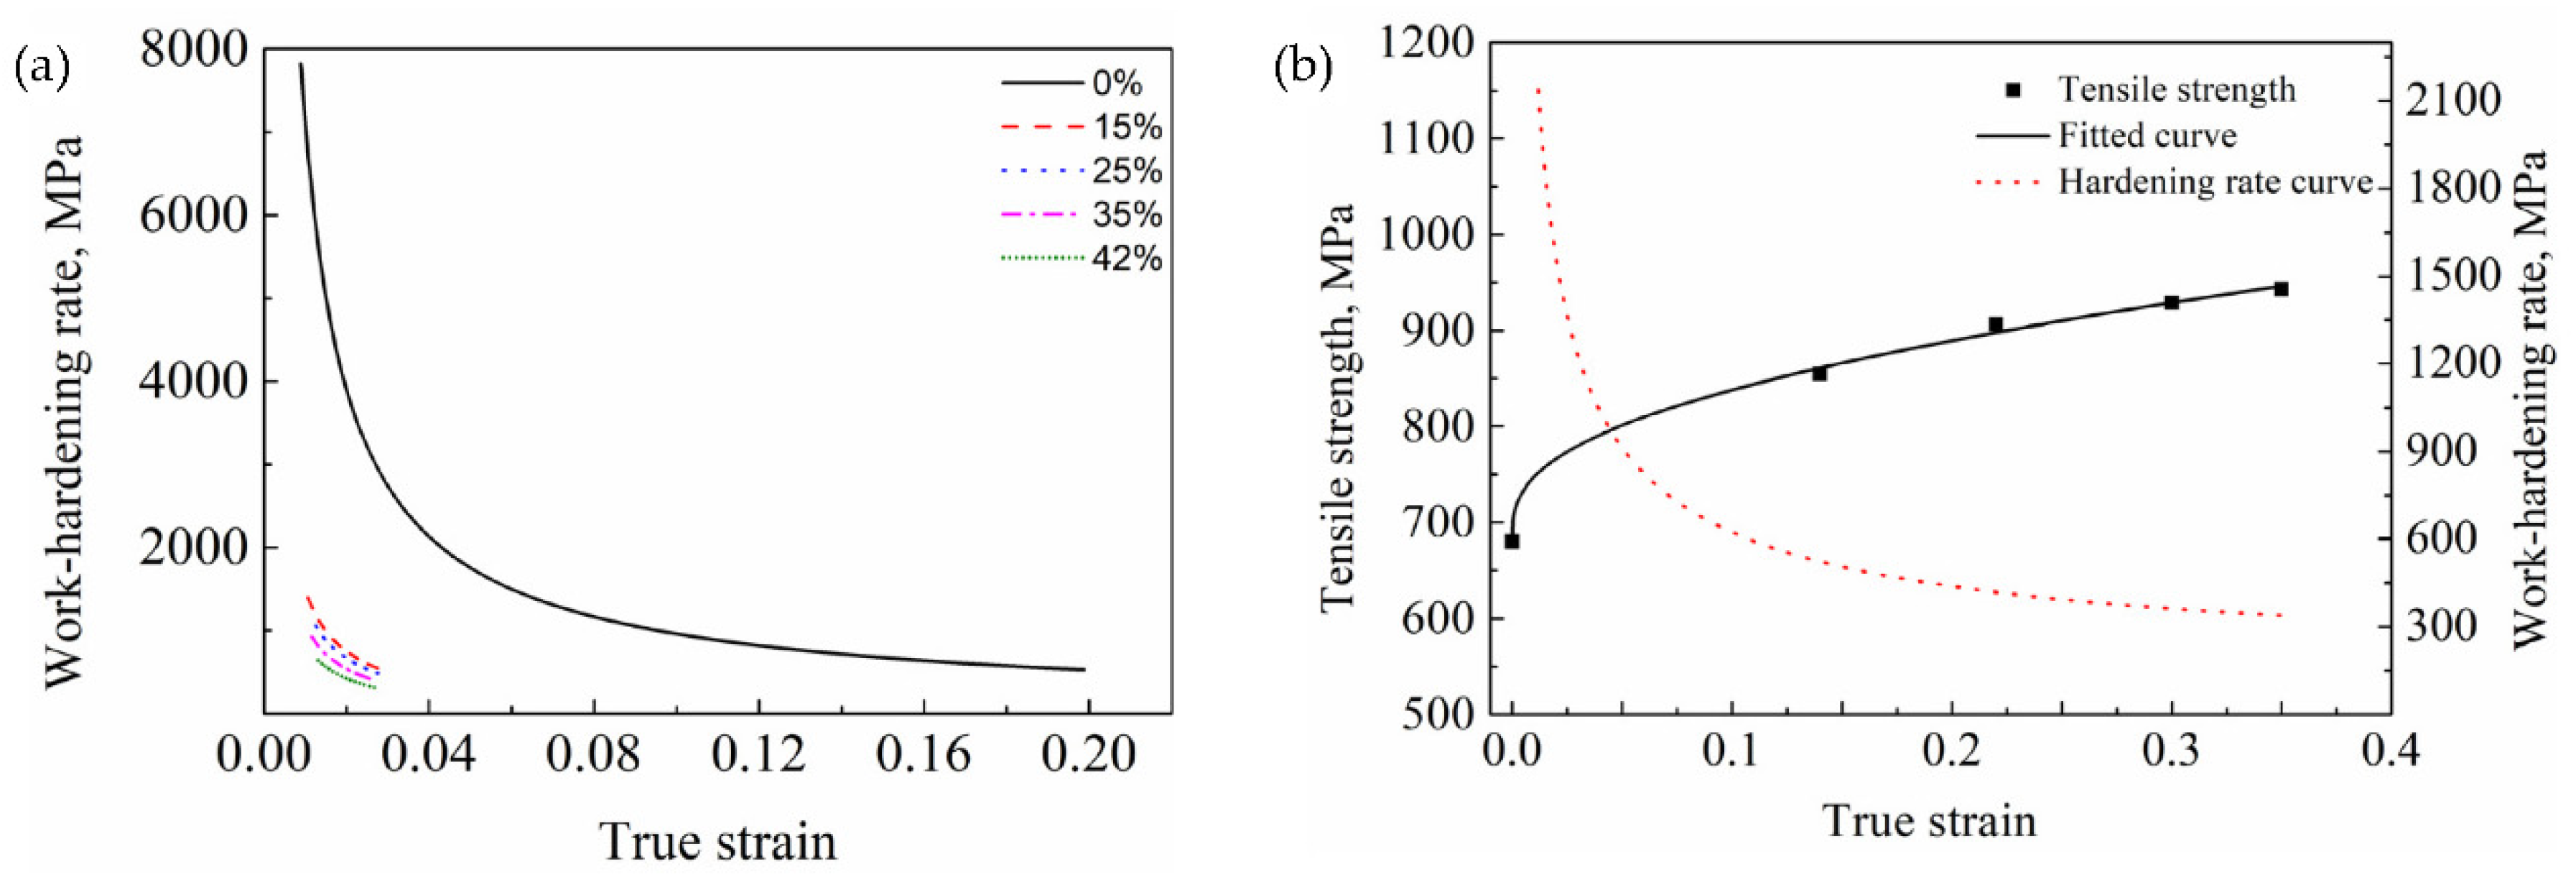
Figure 7a show the true-stress–true-strain curves at room temperature of a Gr.4 strip after cold rolling with various deformation degrees. It was observed that the flow stress in the annealed state (deformation amount of 0%) always increased with the increase in strain after the yield point, but the increase decreased gradually with the increase in strain. With the increase in strain, the flow stress after cold-deformation hardening shows a trend of rapid increase in the initial stage, before it gradually slowed down, and then it tends toward a steady state and begins to gradually decrease after reaching the peak value. The peak stress also increases with the increase in the deformation amount. The reason why the true-stress curve of the cold-deformed specimen decreases with the increase in strain is that after the cold-deformation hardening of the specimen, its hardening ability is obviously reduced, so that the uniform plastic deformation and the local, concentrated plastic-deformation stage after necking are significantly shortened, so that the engineering stress decreases rapidly after necking (see Figure 5a), and the stress also tends to a steady state and begins to decrease. Figure 7b shows the true-stress–true-strain double-logarithmic curve; it was found that the logarithmic true-stress–true-strain curve of the annealed state was a curve with upward concavity, while the logarithmic curves after other deformations were another type of nonlinear curves.
According to the literature [17,20,21], the commonly used Hollomon equation to describe work-hardening behavior is generally suitable for the linear part of the true-stress–true-strain logarithmic curve, but not for the curve with upward concavity. The work-hardening behavior of this type of material can be described by the Ludwigson equation, a modified model of the Hollomon equation, as follows [24]:
σ = K 1 ε n 1 + exp ( K 2 + n 2 ε )
where σ and ε denote the true stress and true strain, respectively, K1 is the deformation strengthening coefficient, n1 is the deformation strengthening index, K2 is the logarithm of the deviation (σ-K1εn1) at the onset of macroscopic plastic strain, and n2 represents the rate at which the ratio of short-range force to long-range force decreases as the plastic strain increases [24].
However, since the Hollomon equation is too simple, it cannot describe the full-range hardening behavior of metallic materials [25]. The same problem exists with the Ludwigson equation. Therefore, Swift [26] proposes another power-law equation:
σ = K s ( ε + ε 0 ) n s
where Ks and ns denote the strength coefficient and strain hardening index, respectively. If the experimental stress–strain curve conforms to the Swift equation, the stress–strain curve of the θ–σ logarithmic plot corresponding to the “Modified C-J Analysis” [27] is linear.
Both the Hollomon and the Swift equations follow a power law, while the exponential relationship proposed by Voce [25] is fundamentally different from the power-law-type model, which is expressed as:
σ = σ 0 - σ 0 Aexp ( β ε )
where σ0 denotes the saturation stress, A is the material parameter, and β is the material parameter. In Equation (4), the flow curve is considered to be the transient form of the flow stress from an initial value to a saturation value, corresponding to an equilibrium structure at a given strain rate and temperature [28]. The Voce model tends to saturated stress under large strain, and the power-law model tends to unsaturated stress under large strain [25].
In order to better describe the true-stress–true-strain curves of Gr.4 strips with different deformations, the above three models were used for fitting analysis, respectively, and the regression-analysis results are shown in Table 2. From the comparison of the correlation coefficients of the fitting results, the Ludwigson, Voce, and Swift models are all suitable for regression analysis of the tensile true-stress–true-strain curve of the annealed Gr.4 strip, and the Ludwigson model has a higher correlation coefficient (correlation coefficient R2 = 0.9971), a curve closer to the experimental data (see Figure 8), and its expression is:
σ = 927.4 ε 0.572 + exp ( 6.215 - 0 . 464 ε )
At the same time, it can be seen from Table 2 that the fitting results of the tensile true-stress–true-strain curve of the Gr.4 strip after cold-deformation hardening using the above model are not ideal. Due to the short hardening stage of this type of curve, its plastic-deformation behavior and annealing state are quite different, so further research is needed in the future.

3.5. Work Hardening

The work-hardening rate θ is the rate at which the flow stress changes with the strain. For the work-hardening rate of a given material under a certain state and deformation conditions, it is usually the derivation of ε on both sides of the mathematical equation describing the work-hardening curve, and the expression can be obtained as follows [17]:
θ = d σ d ε
Figure 9a is the work-hardening-rate curve obtained by the derivation of the tensile true-stress–true-strain curve with different deformation amounts, according to formula (6). It was found that the work-hardening rate of the Gr.4 strip decreased significantly with the increase in the deformation amount. Among them, the maximum decrease in the deformation amount from 0% to 15%, and the decrease is very small as the deformation amount continues to increase, indicating that the hardening capacity also decreases. According to the change law of work-hardening rate and flow stress, the hardening-rate curve of a 0% state can be clearly divided into three stages, namely a strong work-hardening stage, a stable work-hardening stage, and a weak work-hardening stage [17]. In the strong work-hardening stage at the beginning of deformation, the value of the work-hardening rate θ is very large due to the small true strain. However, as the deformation continues, the work-hardening rate begins to decrease rapidly and then it gradually slows down. Since no twins were found in the microstructure, and the deformation was dominated by dislocations, the main mechanism of work hardening was the dislocations in the whole stage. In the initial stage of deformation, the deformation mechanism is single-slip interaction to form a cross-slip, and, at the same time, the dislocations between each slip system are pinned to each other, so the dislocations multiply rapidly and form dense clusters of dislocation-entanglement plugs, which lead to the processing of the initial stage, where the hardening rate is high [21]. With the increase in deformation, the interaction between the dislocations reduces their mobility, increases the flow stress, and increases their density. The strengthening effect of the dislocation cells generated by high-density dislocations is further obvious, so that the work-hardening rate gradually decreases. The combined effect of the two results in a significant decrease in the uniform plasticity of the material [20]. The hardening-rate curve, with the deformation amount of 15% to 42%, is relatively short due to the relatively small strain, but the general trend is similar. Therefore, slip is the dominant deformation mechanism throughout the deformation process, and the increase in dislocation density and dislocation entanglement leads to the work-hardening behavior during cold deformation.
Figure 9b shows the true-strain–tensile-strength scatter plot of the tensile-strength transformation corresponding to different deformations. The nonlinear fitting is performed on it, and then the derivation curve of the fitted curve is obtained, and the corresponding work hardening rate curve is also obtained. The work-hardening-rate curve is also clearly divided into three stages, namely a strong work-hardening stage, a stable work-hardening stage, and a weak work-hardening stage. Although this curve is similar in shape to the 0% tensile work-hardening-rate curve in Figure 9a, the hardening rates at different stages are significantly smaller than the former.

4. Conclusions

(1)
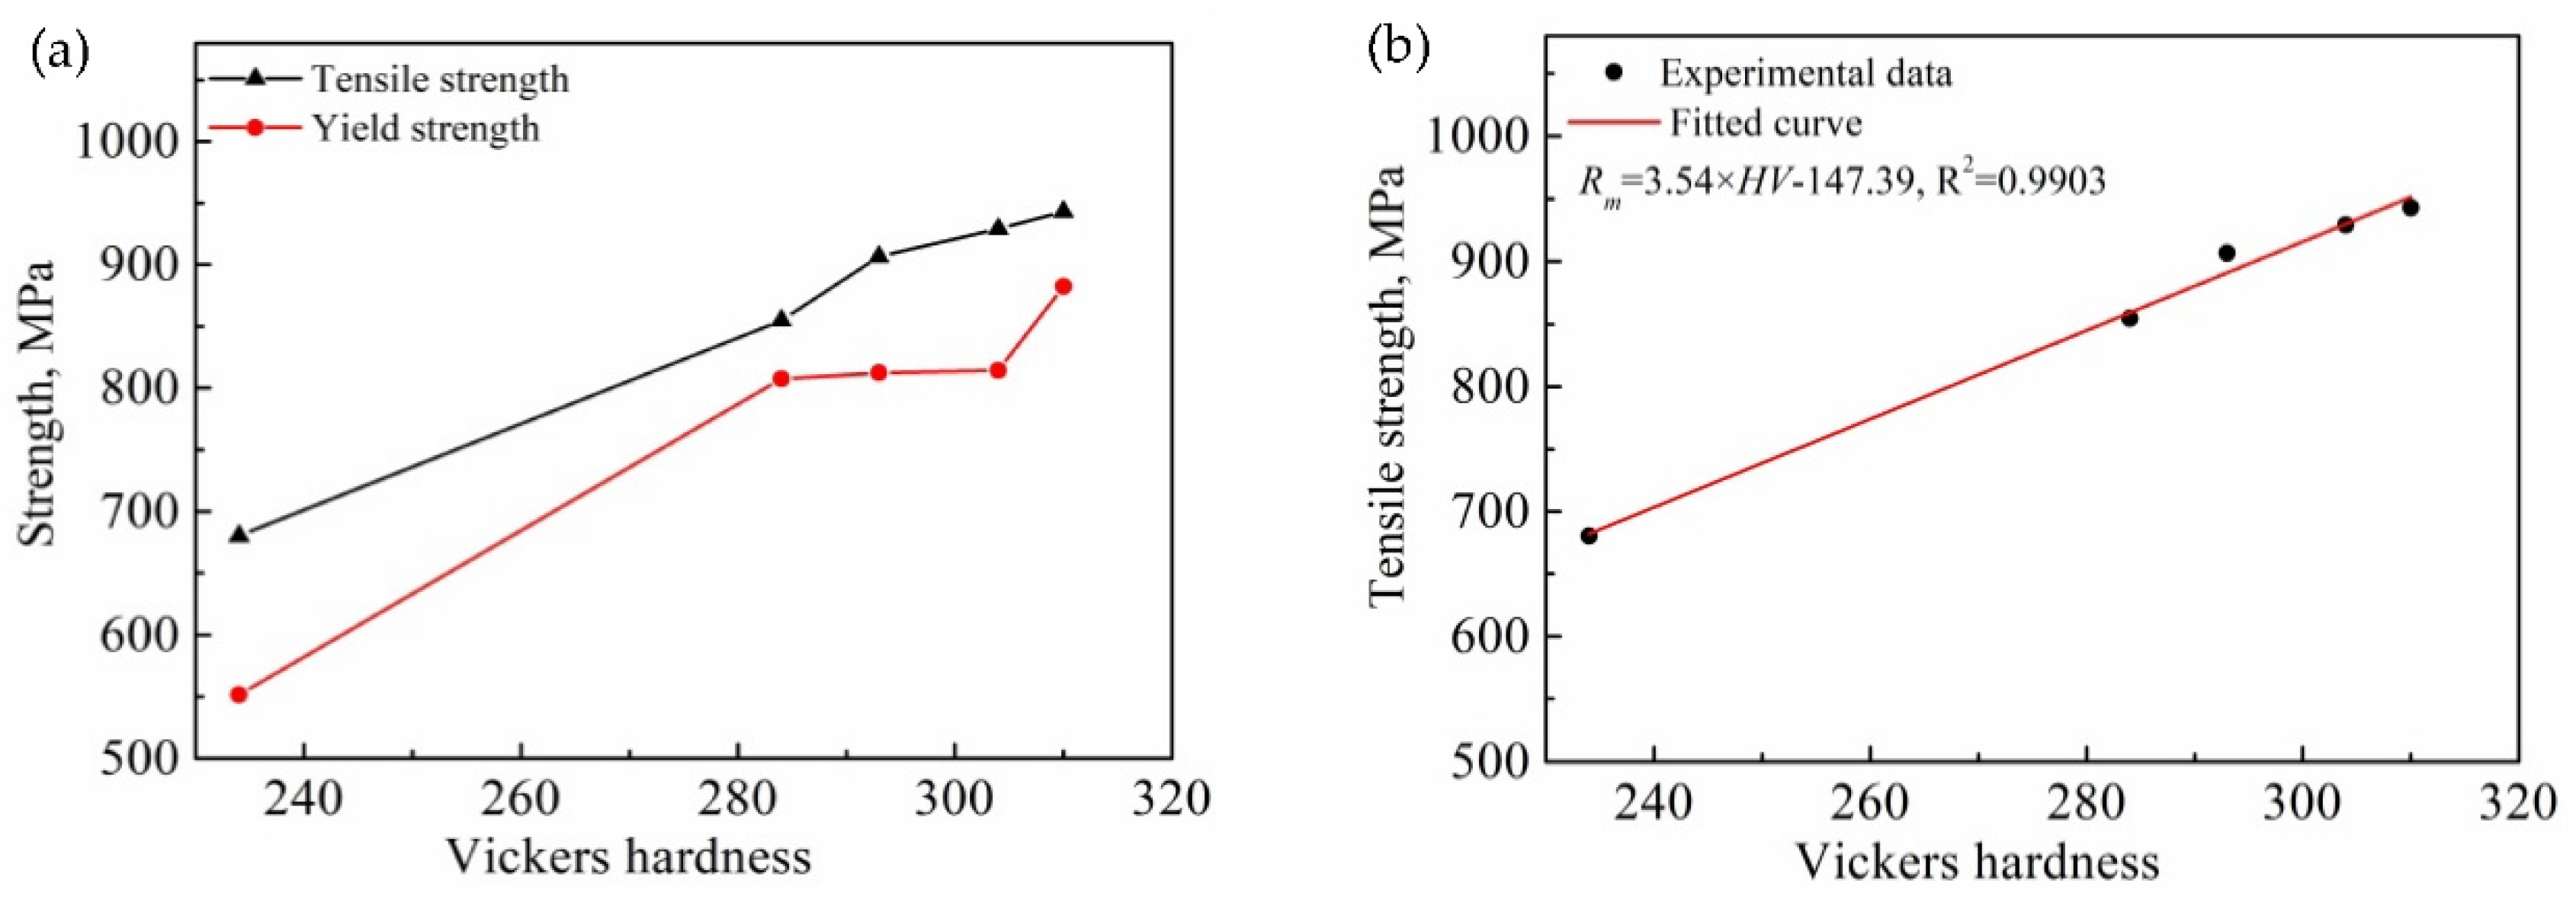
A Gr.4 strip has obvious work-hardening characteristics. After cold-rolling deformation, the strength, yield–strength ratio, and hardness of the material are greatly improved, while the plasticity decreases, and there is a significant linearity between the tensile strength and hardness relation.
(2)
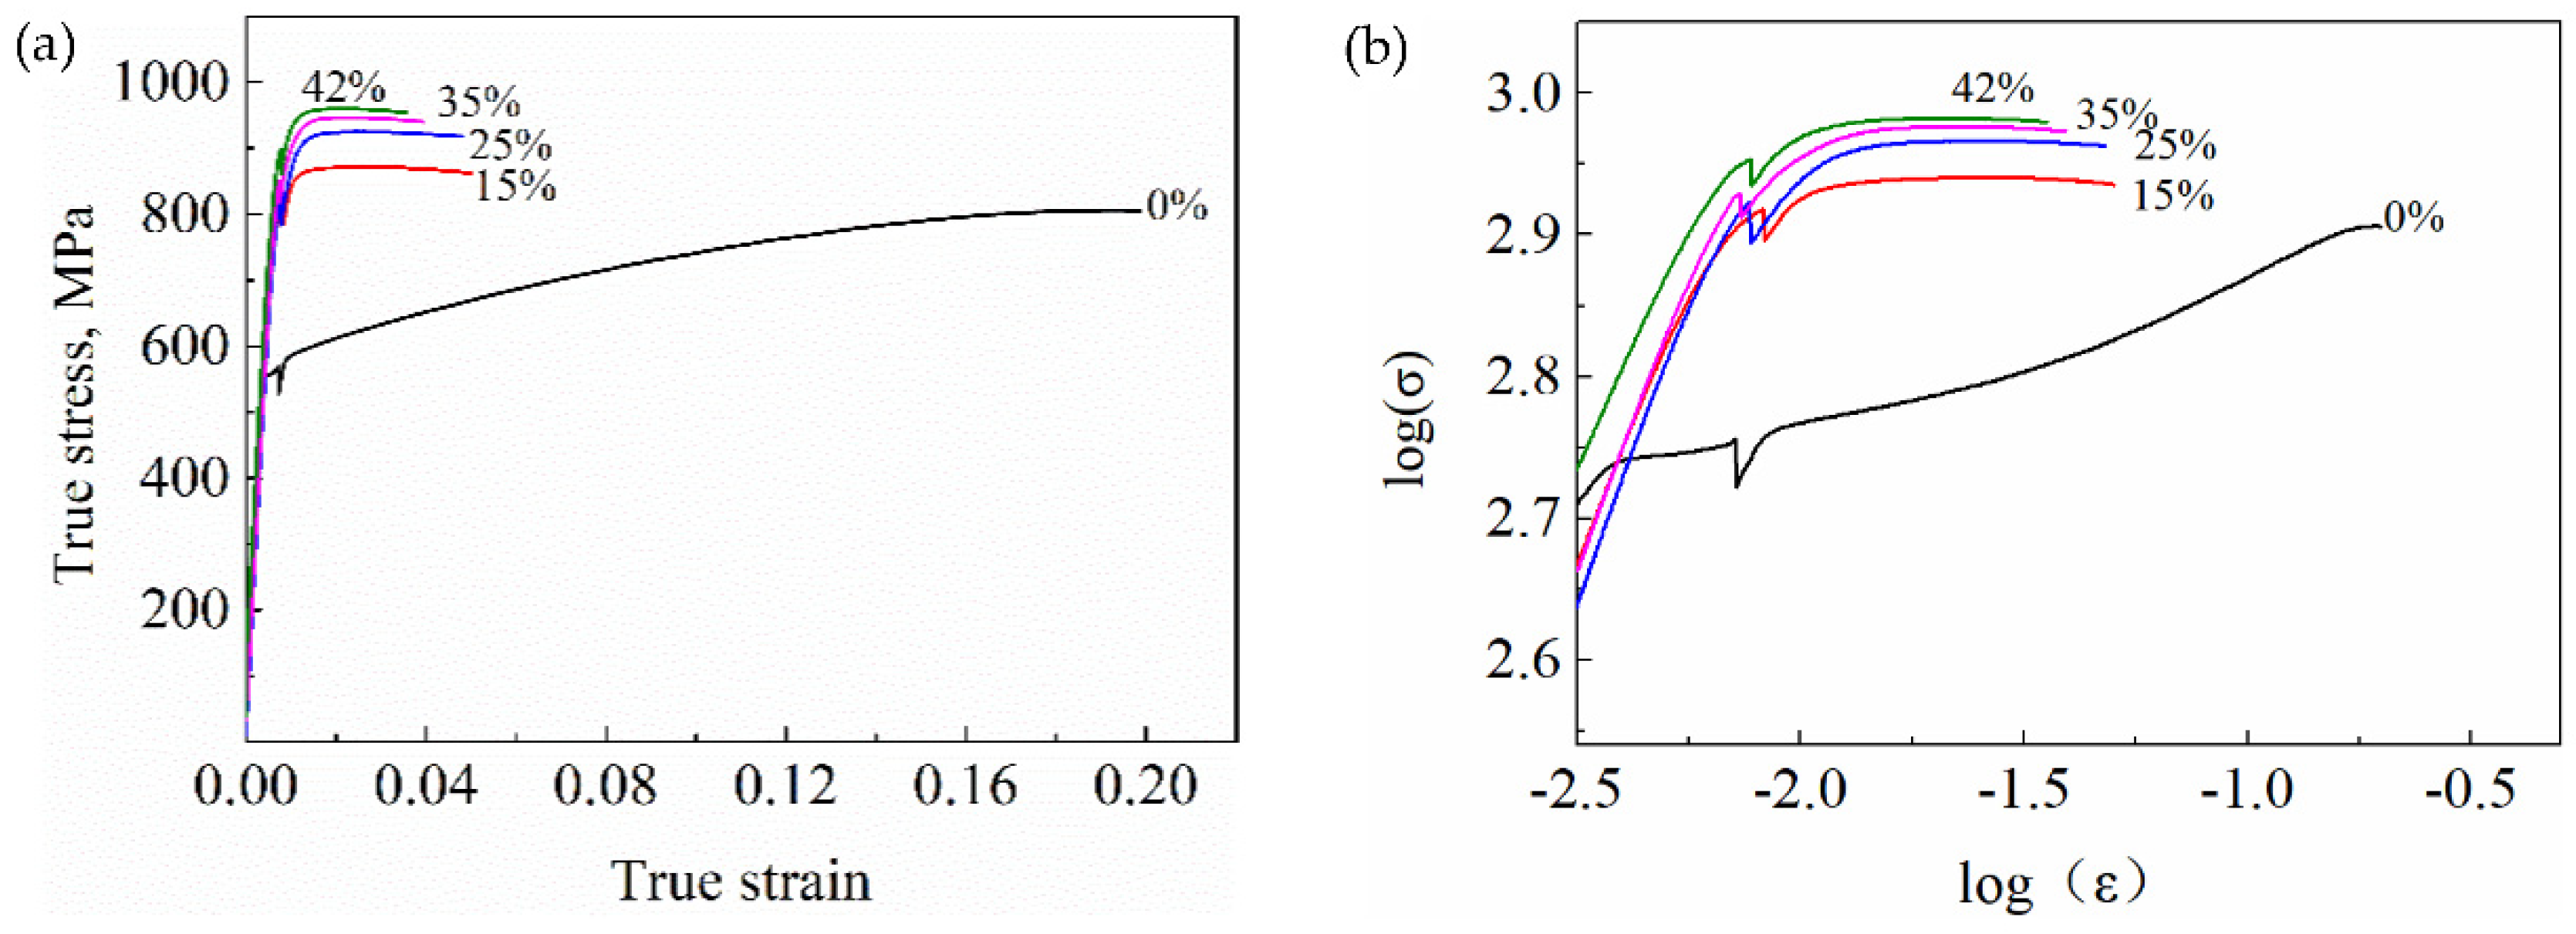
With the increase in deformation, the work-hardening rate of a Gr.4 strip also decreased significantly. During the entire deformation stage, no twins were found in commercially pure titanium Gr.4, and the dominant deformation mechanism was the slipping mode, while the increase in dislocation density and dislocation entanglement resulted in the work-hardening behavior during cold deformation.
(3)
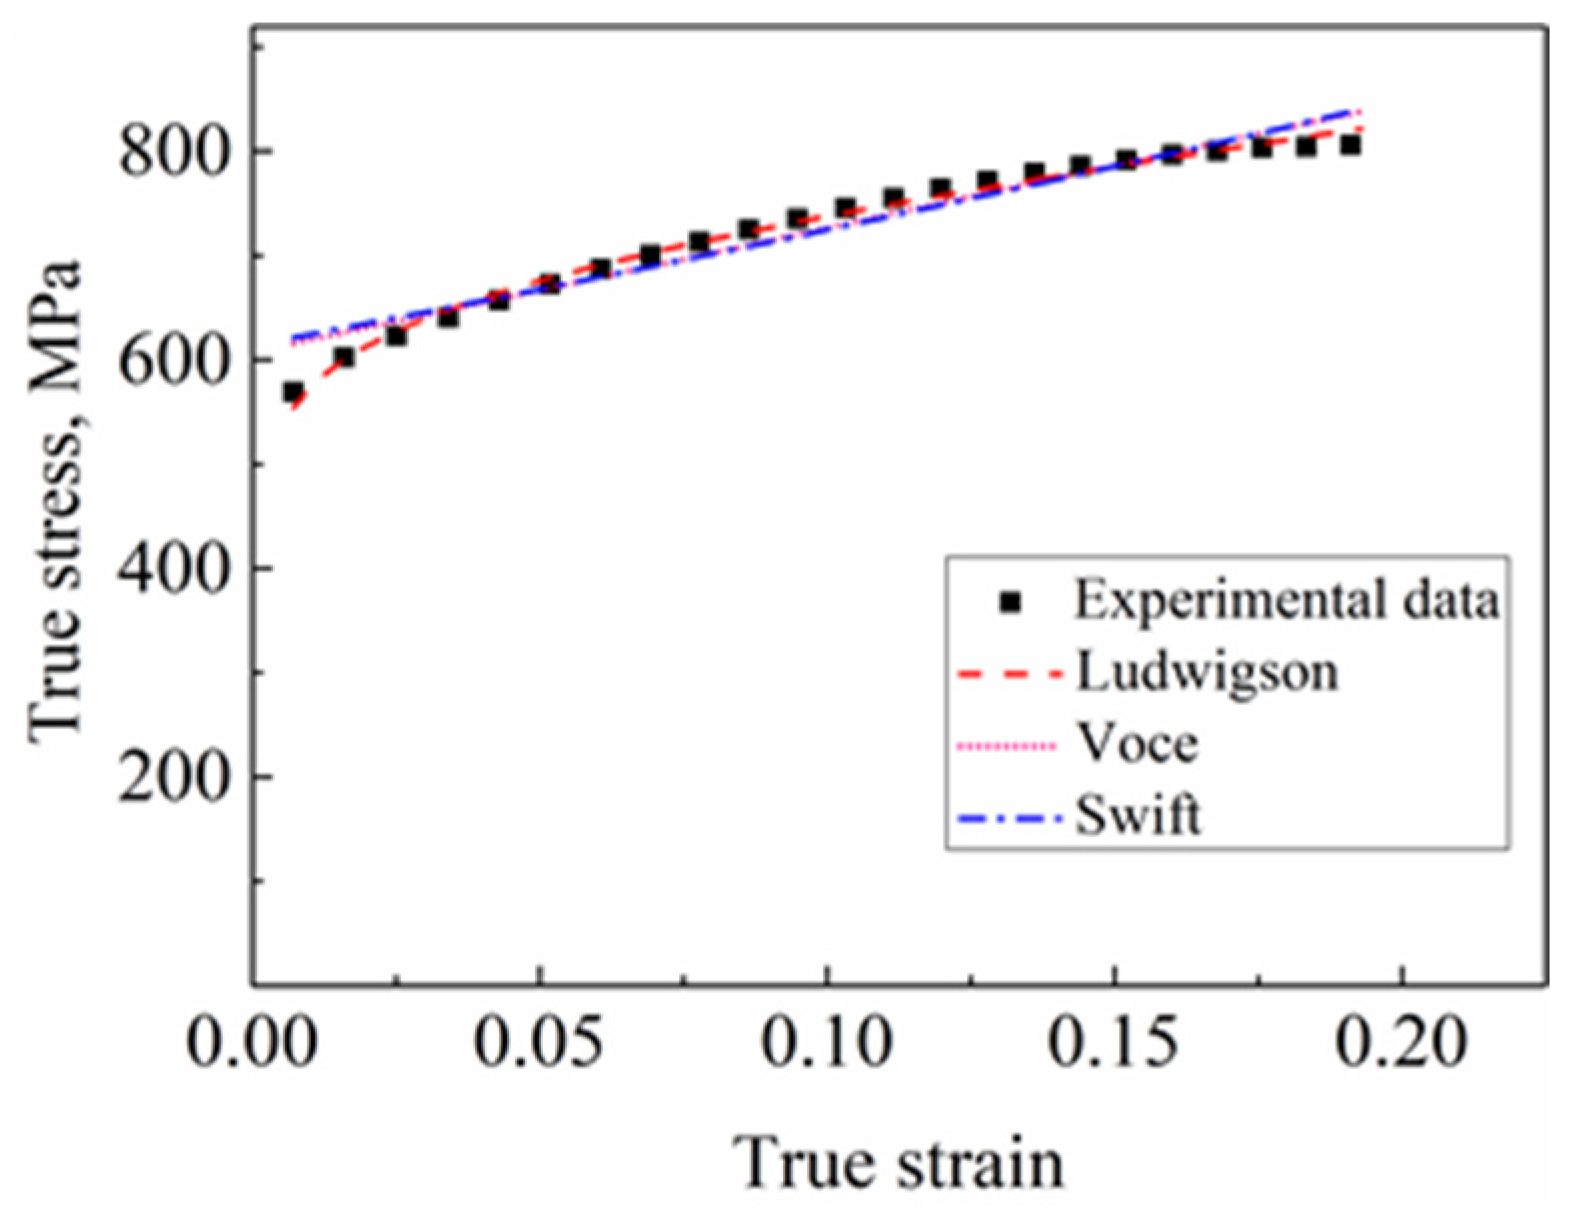
After fitting analysis, the Ludwigson, Voce, and Swift models are all suitable for regression analysis of the tensile true-stress–true-strain curve of the annealed Gr.4 strip, and the Ludwigson model has a higher fitting degree. However, the fitting results of the tensile true-stress–true-strain curve of the Gr.4 strip after cold-deformation hardening are unsatisfactory.

Author Contributions

Experiment concept and design, B.Z. and X.W.; conceptualization, B.Z., X.W., M.W. and H.L.; methodology, B.Z., X.W. and H.L.; experiment performance, B.Z., X.L. and L.S.; data analysis, B.Z., X.W. and X.C.; writing—original draft preparation, B.Z.; writing—review and editing, B.Z. and X.C.; supervision, X.W. and M.W. All authors have read and agreed to the published version of the manuscript.

Funding

This research was funded by the Key R&D Project of the Ningxia Hui Autonomous Region (Grant No. 2021BFH02003) and the State Key Laboratory of Special Rare Metal Materials at the Northwest Rare Metal Materials Research Institute Ningxia Co., Ltd. (Grant Nos. SKL2017K002 and SKL2018K002).

Institutional Review Board Statement

Not applicable.

Informed Consent Statement

Not applicable.

Data Availability Statement

The data presented in this study are available on request from the corresponding author. The data are not publicly available due to privacy.

Conflicts of Interest

The authors declare no conflict of interest.

References

  1. Langer, R.; Tirrell, D.A. Designing materials for biology and medicine. Nature 2004, 428, 487–492. [Google Scholar] [CrossRef] [PubMed]
  2. Roodposhti, P.S.; Farahbakhsh, N.; Sarkar, A.; Murty, K.L. Microstructural approach to equal channel angular processing of commercially pure titanium-A review. Trans. Nonferrous Met. Soc. China 2015, 25, 1353–1366. [Google Scholar] [CrossRef]
  3. Liu, N.; Wang, Y.; He, W.J.; Li, J.; Chapuis, A.; Luan, B.F.; Liu, Q. Microstructure and textural evolution during cold rolling and annealing of commercially pure titanium sheet. Trans. Nonferrous Met. Soc. China 2018, 28, 1123–1131. [Google Scholar] [CrossRef]
  4. Yang, H.; Li, H.; Sun, H.; Zhang, Y.H.; Liu, X.; Zhan, M.; Liu, Y.; Fu, M.W. Anisotropic plasticity and fracture of alpha titanium sheets from cryogenic to warm temperatures. Int. J. Plast. 2022, 156, 103348. [Google Scholar] [CrossRef]
  5. Claudio, B.; Gonzalo, P. Thermomechanical processing of alloys. case of study Ti Gr. 4. Procedia Mater. Sci. 2015, 8, 311–318. [Google Scholar]
  6. Fang, J.; Liu, F.; Di, W.Q.; Xu, G.L.; Cui, Q. Effect of cold-rolling process parameters on mechanical properties and corrosion properties of commercial pure titanium. J. Plast. Eng. 2019, 26, 98–105. [Google Scholar]
  7. Mertová, K.; Salvetr, P.; Duchek, M. Comparison of cryogenic and cold deformation of commercially pure titanium. Mater. Today Proc. 2020, 28, 916–919. [Google Scholar] [CrossRef]
  8. Su, Y.; Shang, Q.H.; Wu, H.; Yan, X.A.; Wu, G.W.; Xue, X.T.; Zhao, Y. Microstructure and mechanical properties of commercial pure titanium Gr4 strip. China Plant Eng. 2020, 16, 207–208. [Google Scholar]
  9. Islamgaliev, R.K.; Kazyhanov, V.U.; Shestakova, L.O.; Sharafutdinov, A.V.; Valiev, R.Z. Microstructure and mechanical properties of titanium (grade 4) processed by high-pressure torsion. Mater. Sci. Eng. A 2008, 493, 190–194. [Google Scholar] [CrossRef]
  10. Li, Y.; Ng, H.P.; Jung, H.D.; Kim, H.E.; Estrin, Y. Enhancement of mechanical properties of grade 4 titanium by equal channel angular pressing with billet encapsulation. Mater. Lett. 2014, 114, 144–147. [Google Scholar] [CrossRef]
  11. Dyakonov, G.S.; Mironov, S.; Enikeev, N.; Semenova, I.P.; Valiev, R.Z.; Semiatin, S.L. Annealing behavior of severely-deformed titanium grade 4. Mater. Sci. Eng. A 2019, 742, 89–101. [Google Scholar] [CrossRef]
  12. Masikane, A.M.; Johnson, O.T.; Ogunmuyiwa, E.N.; Sigalas, I. Densification and tensile properties of titanium grade 4 produced using different routes. Procedia Manuf. 2019, 35, 826–832. [Google Scholar] [CrossRef]
  13. Choi, S.W.; Jeong, J.S.; Won, J.W.; Hong, J.K.; Choi, Y.S. Grade-4 commercially pure titanium with ultrahigh strength achieved by twinning-induced grain refinement through cryogenic deformation. J. Mater. Sci. Technol. 2021, 66, 193–201. [Google Scholar] [CrossRef]
  14. Chausov, M.G.; Maruschak, P.O.; Hutsaylyuk, V.; Śnieżek, L.; Pylypenko, A.P. Effect of complex combined loading mode on the fracture toughness of titanium alloys. Vacuum 2018, 147, 51–57. [Google Scholar] [CrossRef]
  15. Tsukamoto, G.; Kunieda, T.; Yamasaki, S.; Mitsuhara, M.; Nakashima, H. Effects of temperature and grain size on active twinning systems in commercially pure titanium. J. Alloy. Compd. 2021, 884, 161154. [Google Scholar] [CrossRef]
  16. Wang, B.S.; Liu, H.M.; Zhang, Y.G.; Zhou, B.X.; Deng, L.P.; Wang, C.; Chen, J.F.; Zhang, Y.H. Effect of grain size on twinning behavior of pure titanium at room temperature. Mater. Sci. Eng. A 2021, 827, 142060. [Google Scholar] [CrossRef]
  17. Song, R.B.; Xiang, J.Y.; Hou, D.P. Microstructure characteristics and work-hardening mechanism and of 316L austenitic stainless steel during cold deformation. J. Univ. Sci. Technol. Beijing 2013, 35, 55–60. [Google Scholar]
  18. Agnew, S.R.; Capolungo, L.; Calhoun, C.A. Connections between the basal I1 “growth” fault and <c+a> dislocations. Acta Mater. 2015, 82, 255–265. [Google Scholar] [CrossRef]
  19. Sun, H.; Liang, Y.L.; Li, G.M.; Zhang, X.F.; Wang, S.; Huang, C.W. Dislocation hardening and phase transformation-induced high ductility in Ti-6Al-4V with a heterogeneous martensitic microstructure under tensile load. J. Alloy. Compd. 2021, 868, 159155. [Google Scholar] [CrossRef]
  20. Fan, J.H.; Chen, K.X.; Liang, J.P.; Li, Z.J.; Li, X.K. Effect of Cold deformation on microstructure and mechanical behavior of Ni-based high temperature alloy GH3535. Chin. J. Mater. Res. 2015, 29, 439–444. [Google Scholar]
  21. Deng, H.X.; Zheng, W.J.; Song, Z.G.; Cen, Q.H.; Feng, H. Effect of cold deformation on microstructure and mechanical behavior of 0Cr25Ni35AlTi. J. Iron Steel Res. 2015, 27, 67–72. [Google Scholar]
  22. Sun, S.C.; Sun, G.X.; Jiang, Z.H.; Ji, C.T.; Liu, J.A.; Lian, J.S. Effects of cold rolling deformation on microstructure, hardness, and creep behavior of high nitrogen austenitic stainless steel. Chin. Phys. B 2014, 23, 383–388. [Google Scholar] [CrossRef]
  23. Yasnii, P.V.; Marushchak, P.O.; Hlad’o, V.B.; Baran, D.Y. Correlation of the microdislocation parameters with the hardness of plastically deformed heat-resistant steels. Mater. Sci. 2008, 44, 194–200. [Google Scholar] [CrossRef]
  24. Zhang, S.C.; Zheng, W.J.; Song, Z.G.; Feng, H.; Sun, Y. Effect of cold deformation on structure and mechanical behavior of Inconel 690 alloy. J. Iron Steel Res. 2009, 21, 49–54. [Google Scholar]
  25. Cao, J.; Li, F.G.; Ma, X.K.; Sun, Z.K. Tensile stress-strain behavior of metallic alloys. Trans. Nonferrous Met. Soc. China 2017, 27, 2443–2453. [Google Scholar] [CrossRef]
  26. Swift, H.W. Plastic instability under plane stress. J. Mech. Phys. Solids 1952, 1, 1–18. [Google Scholar] [CrossRef]
  27. Monteiro, S.N.; Reed-Hill, R.E. An empirical analysis of titanium stress-strain curves. Metall. Trans. 1973, 4, 1011–1015. [Google Scholar] [CrossRef]
  28. Christopher, J.; Choudhary, B.K.; Samuel, E.I.; Mathew, M.D.; Jayakumar, T. Tensile stress-strain and work hardening behaviour of P9 steel for wrapper application in sodium cooled fast reactors. J. Nucl. Mater. 2012, 420, 583–590. [Google Scholar] [CrossRef]
Figure 1. Microstructures of annealed Gr.4 strip: (a) OM, (b) SE, and (c) BSE.
Metals 12 01166 g001
Figure 2. TEM images and EDS of annealed Gr.4 strip: (a) TEM bright field (BF) image showing the β phase in the grain, the insert corresponds to the selected area electron diffraction pattern (SAEDP), (b) high-angle annular dark-field (HAADF) image and scan map of Ti and Fe, (c) spectra from area of (b), and (d) TEM BF image of the grain boundary (GB).
Metals 12 01166 g002
Figure 3. Microstructures of Gr.4 strip for different cold rolling deformation amounts: (a) 15%, (b) 25%, (c) 35%, and (d) 42%.
Metals 12 01166 g003
Figure 4. TEM BF images of (a,c,e) showing significant increase in the density dislocation with increasing deformation amount and (b,d,f) using a g vector of 10–10, in which <a> type dislocation are show in black: (a) and (b) 15%, (c) and (d) 25%, (e) and (f) 42%.
Metals 12 01166 g004
Figure 5. Mechanical property of Gr.4 strip for different cold-rolling deformations: (a) engineering stress–strain curves, (b) tensile strength and yield strength, (c) elongation, and (d) hardness curves.
Metals 12 01166 g005
Figure 6. The relation between strength and hardness of Gr.4 strip: (a) curves of hardness and strength and (b) fitting curve of tensile strength and hardness.
Metals 12 01166 g006
Figure 7. True-sress–true-strain curves of Gr.4 strip: (a) true-stress–true-strain curves, (b) log–log scale true-stress–true-strain curves.
Metals 12 01166 g007
Figure 8. Three model-fitting curves of true-stress–true-strain curve with 0% deformation.
Metals 12 01166 g008
Figure 9. Work-hardening-rate curve of Gr.4 strip for: (a) true-stress–strain curves and (b) fitting curve of tensile strength.
Metals 12 01166 g009
Table 1. Chemical composition of CP Ti Gr.4 (ω/%).
CNHOFeTi
0.012<0.0100.00120.300.35Bal.
Table 2. Ludwigson, Voce, and Swift regression results of Gr.4 strip for different deformations.
Deformation,
%
LudwigsonVoceSwift
K1/MPan1K2n2Rσ0/MPaσ0 × AβRKs/MPansε0R
0927.40.5726.215−0.4640.99711931.31329.31.00.962346.2303.5352.0790.9401
151260.20.2456.169−10.8770.8393867.5329.75240.4−0.00605.5251.81716.1380.0284
251380.20.2456.147−10.2390.7370918.9−1.8 × 1074.7 × 106−0.006329.0542.3034.4530.1790
351502.30.2456.092−11.1350.7633939.2−7.5 × 1082.0 × 108−0.0076156.7252.1182.3050.2736
421412.80.2466.244−10.8380.8003955.4−2.5 × 1075.7 × 106−0.008712.9682.6215.1350.2199
Publisher’s Note: MDPI stays neutral with regard to jurisdictional claims in published maps and institutional affiliations.

