
Optimization of the Process Parameters of Laser Beam Powder Bed Fusion GTD222 Nickel-Based Superalloy Based on Two Laser Energy Densities

 ,
,  and
and 
Abstract
:1. Introduction
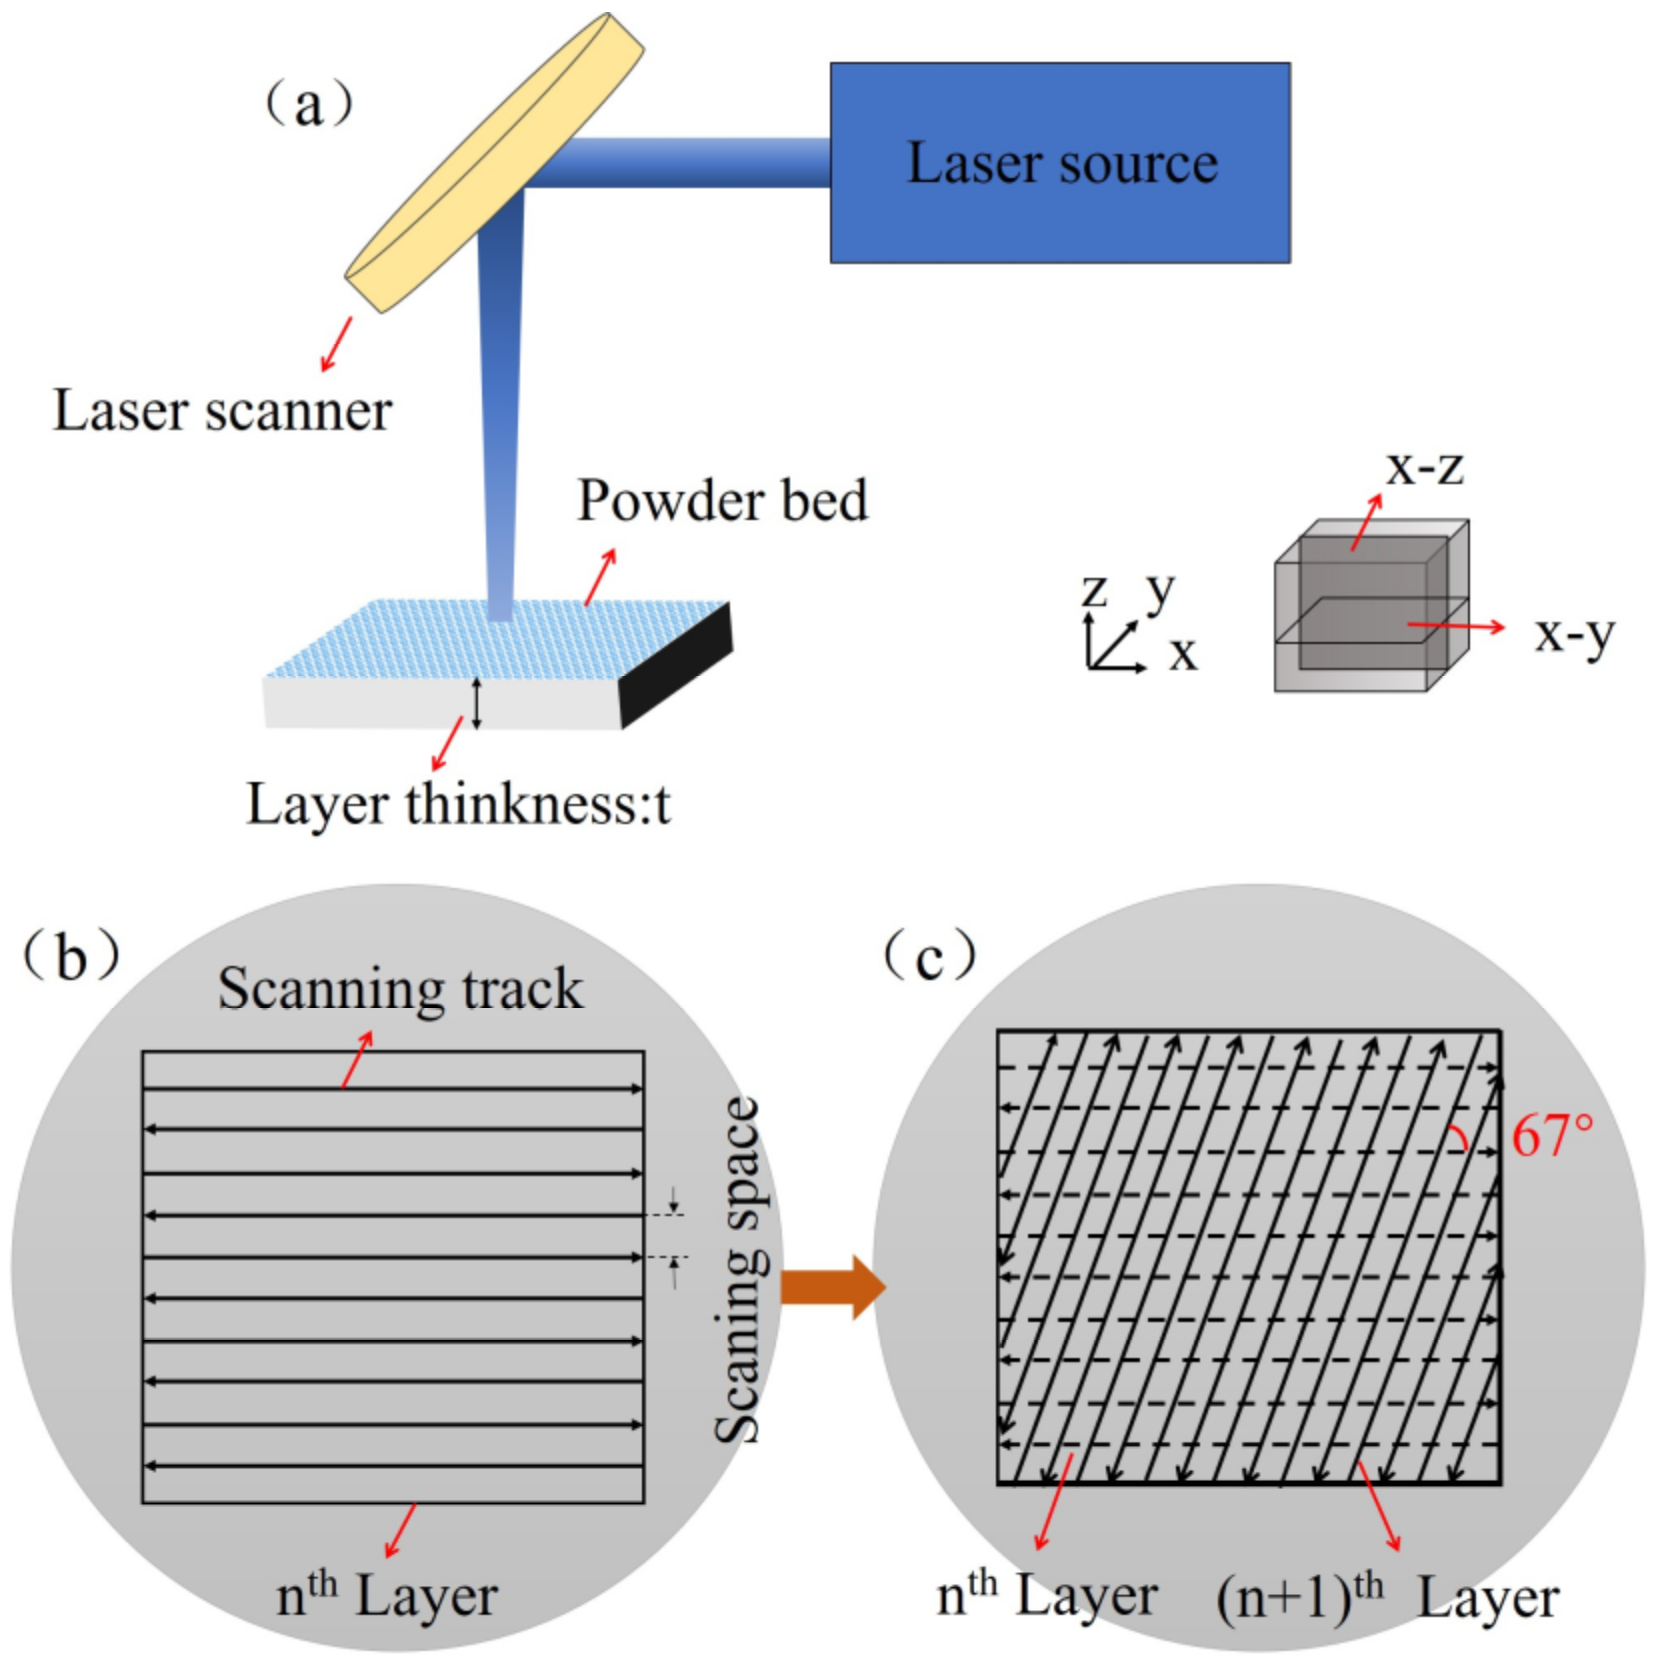
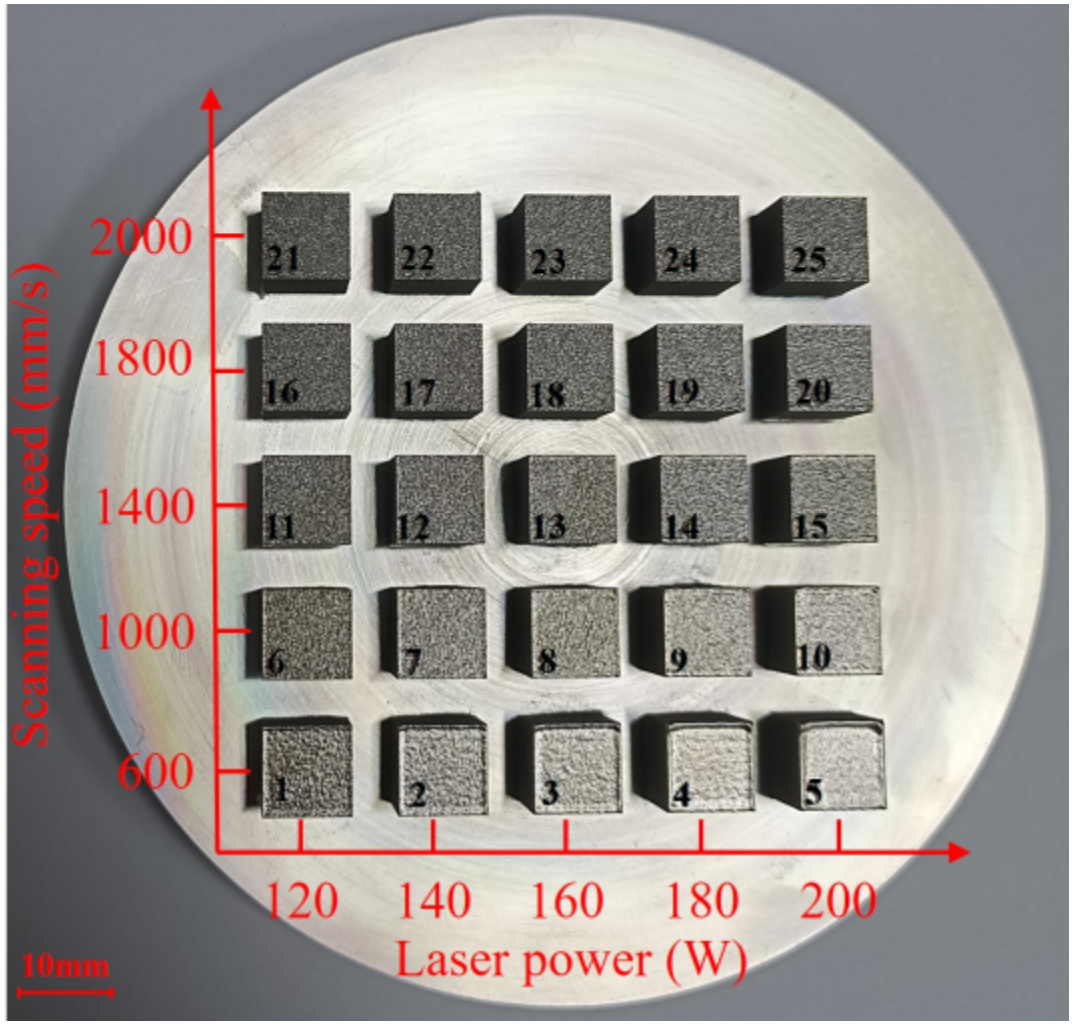
2. Materials and Methods
3. Results
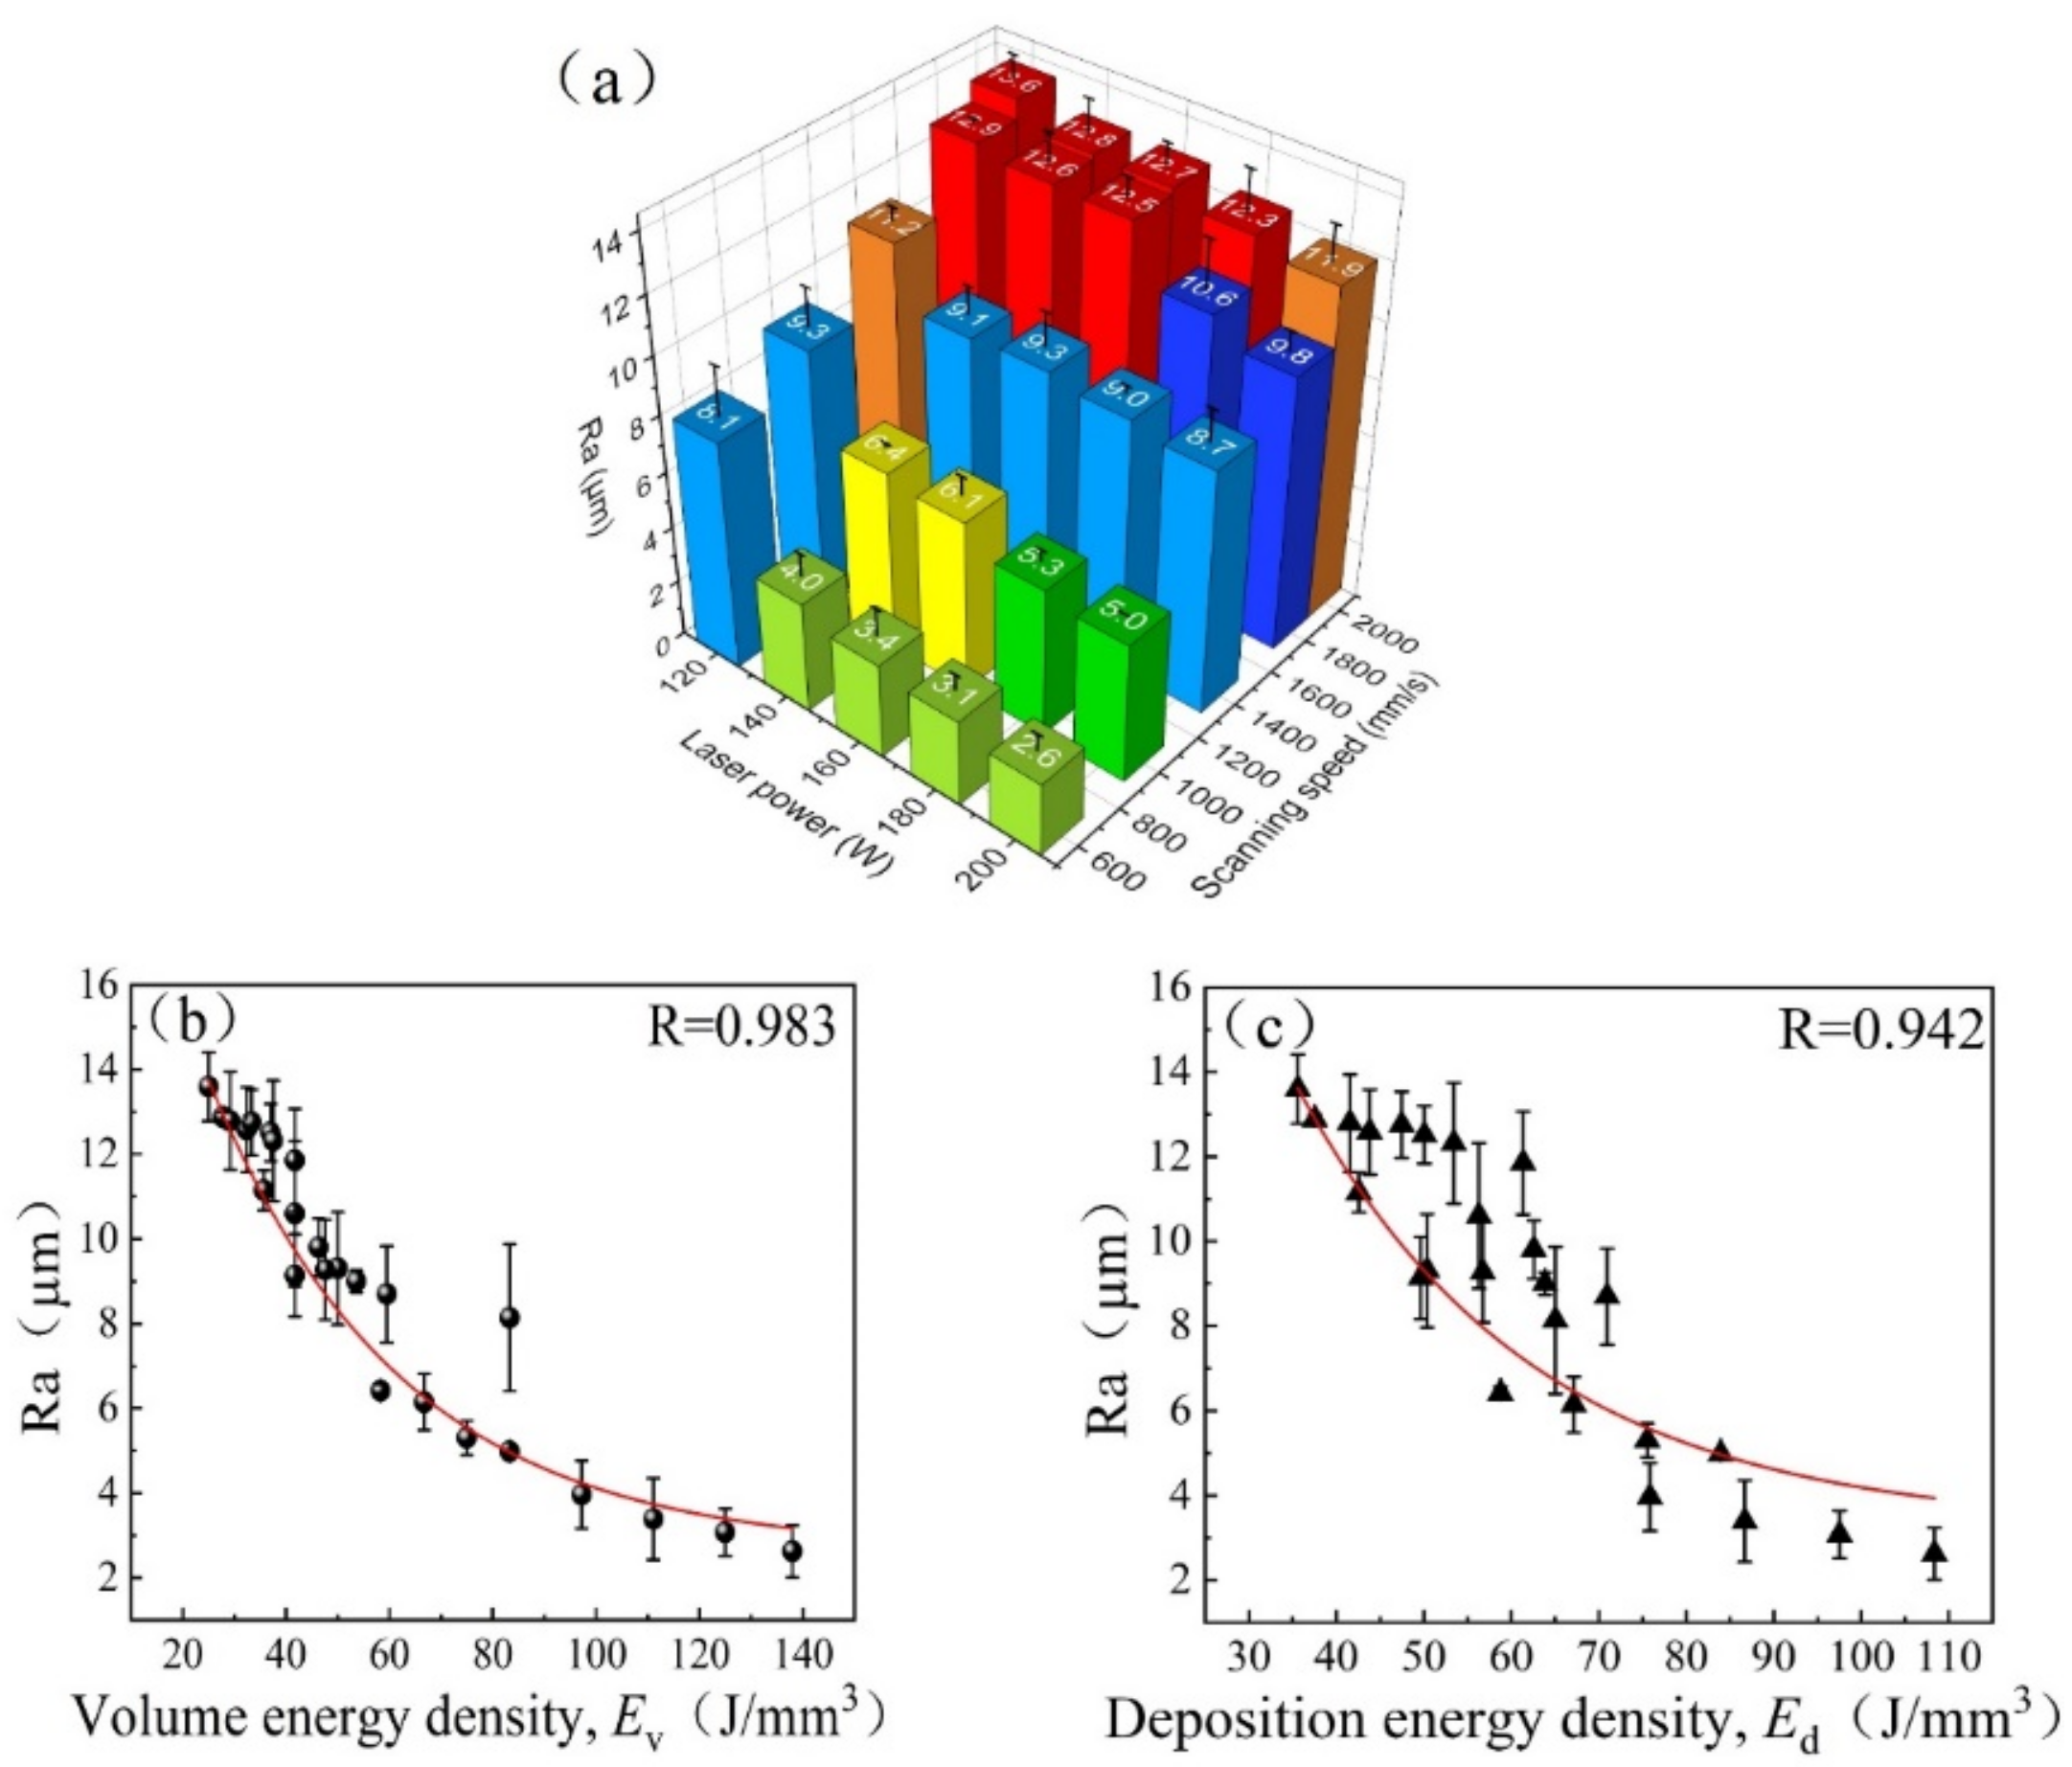
3.1. Roughness
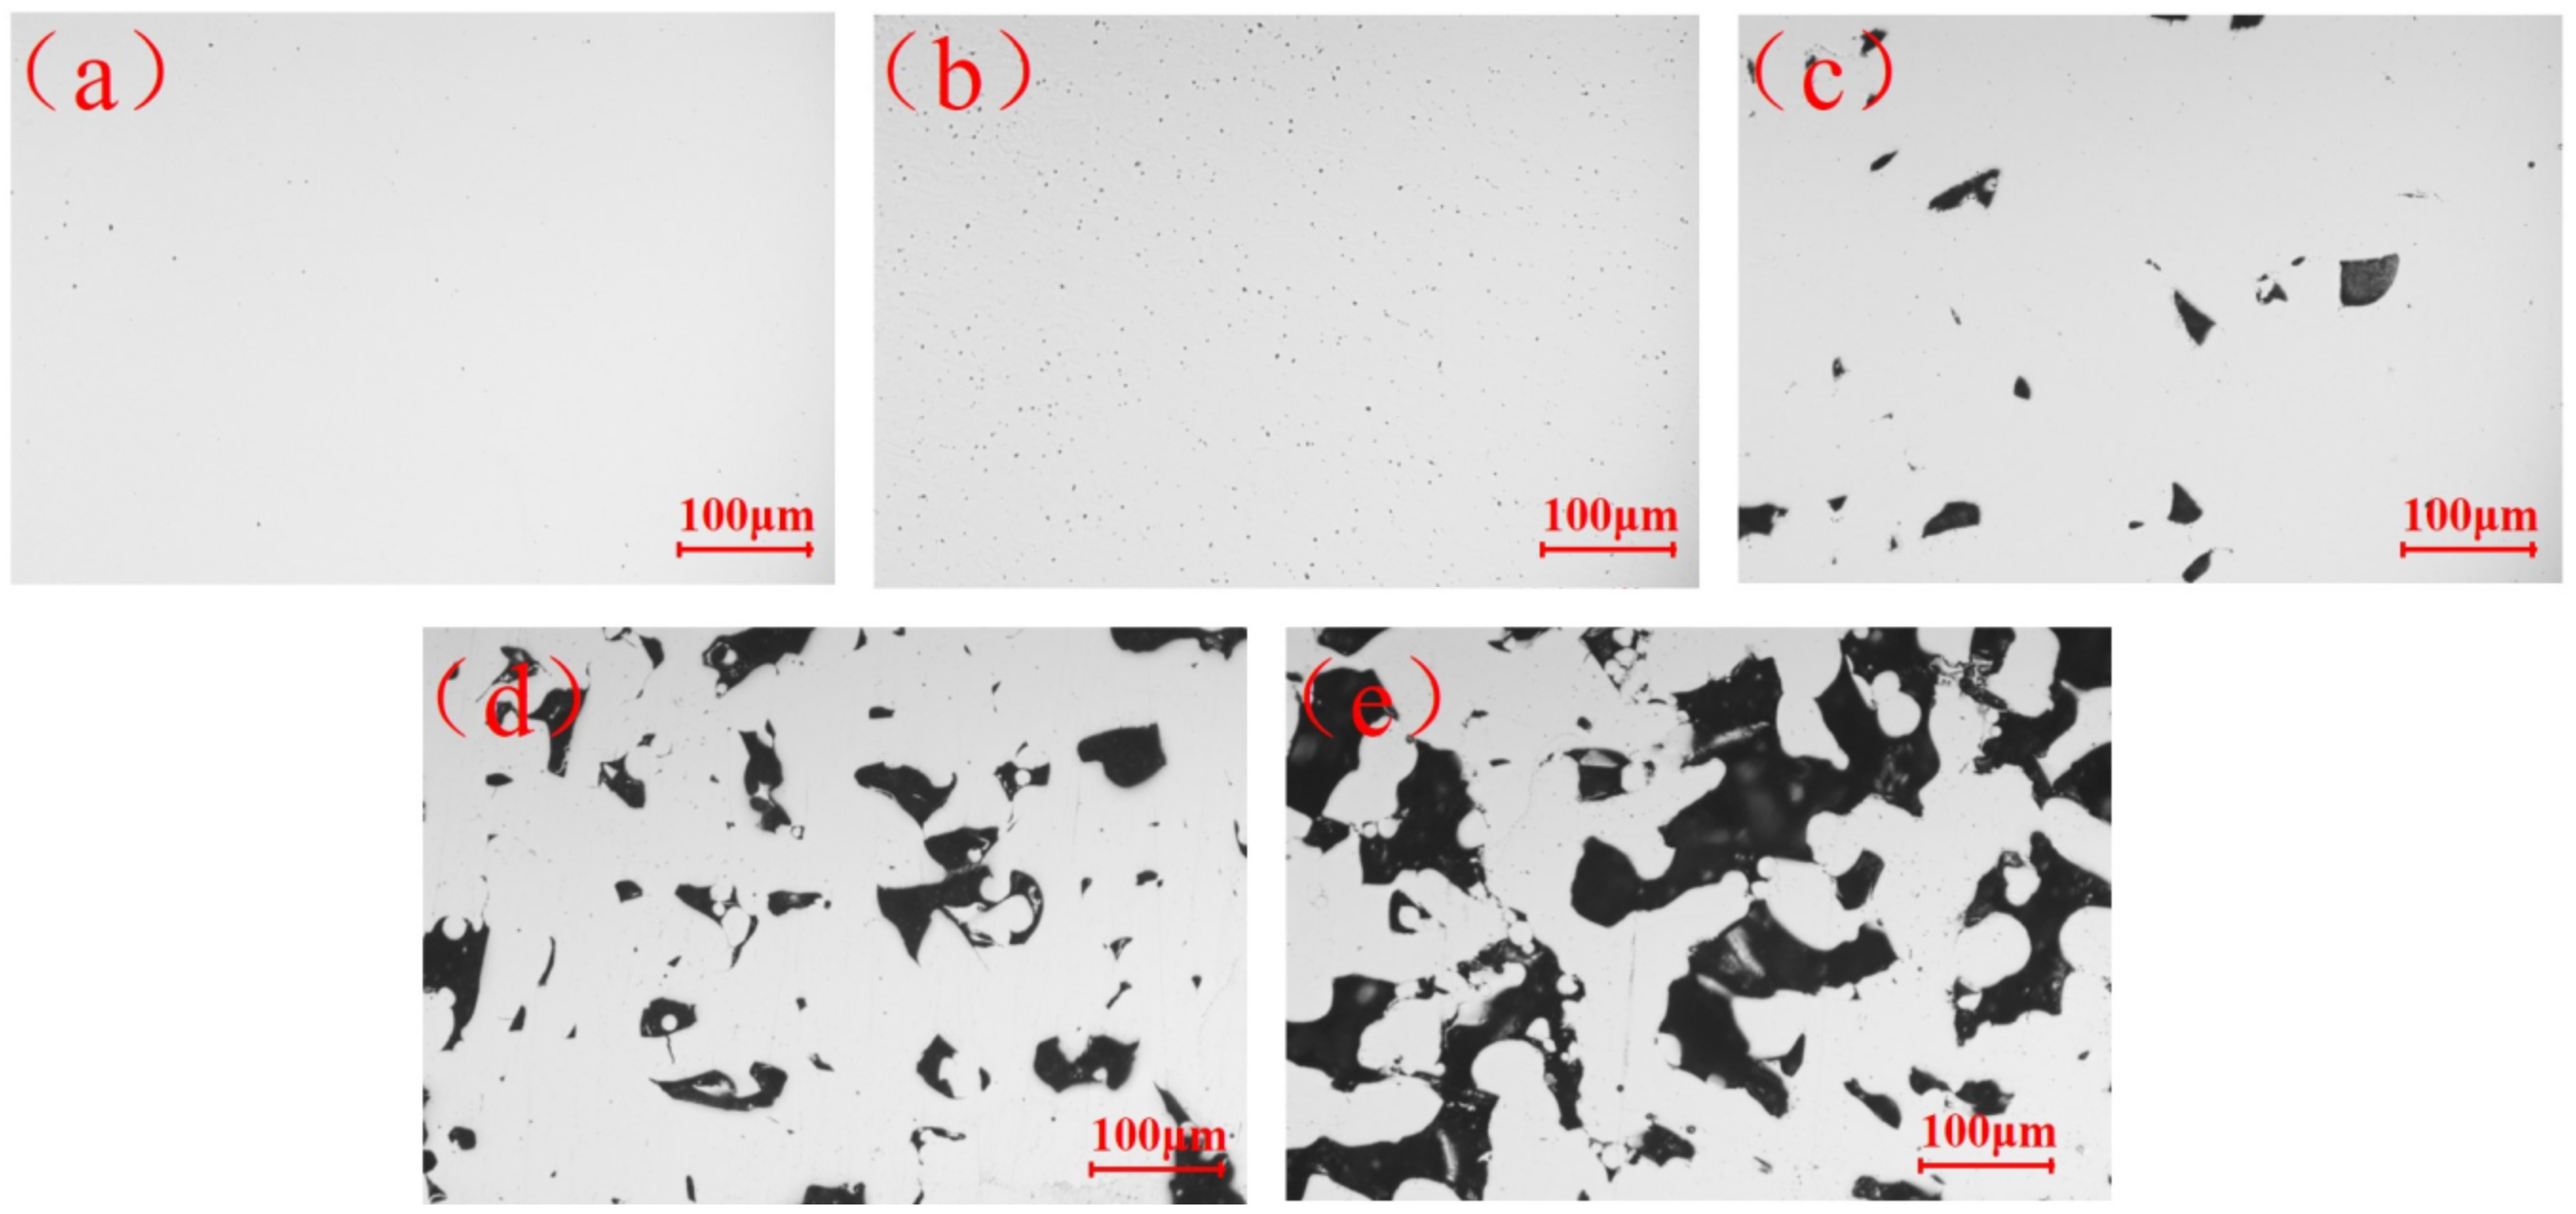
3.2. Porosity
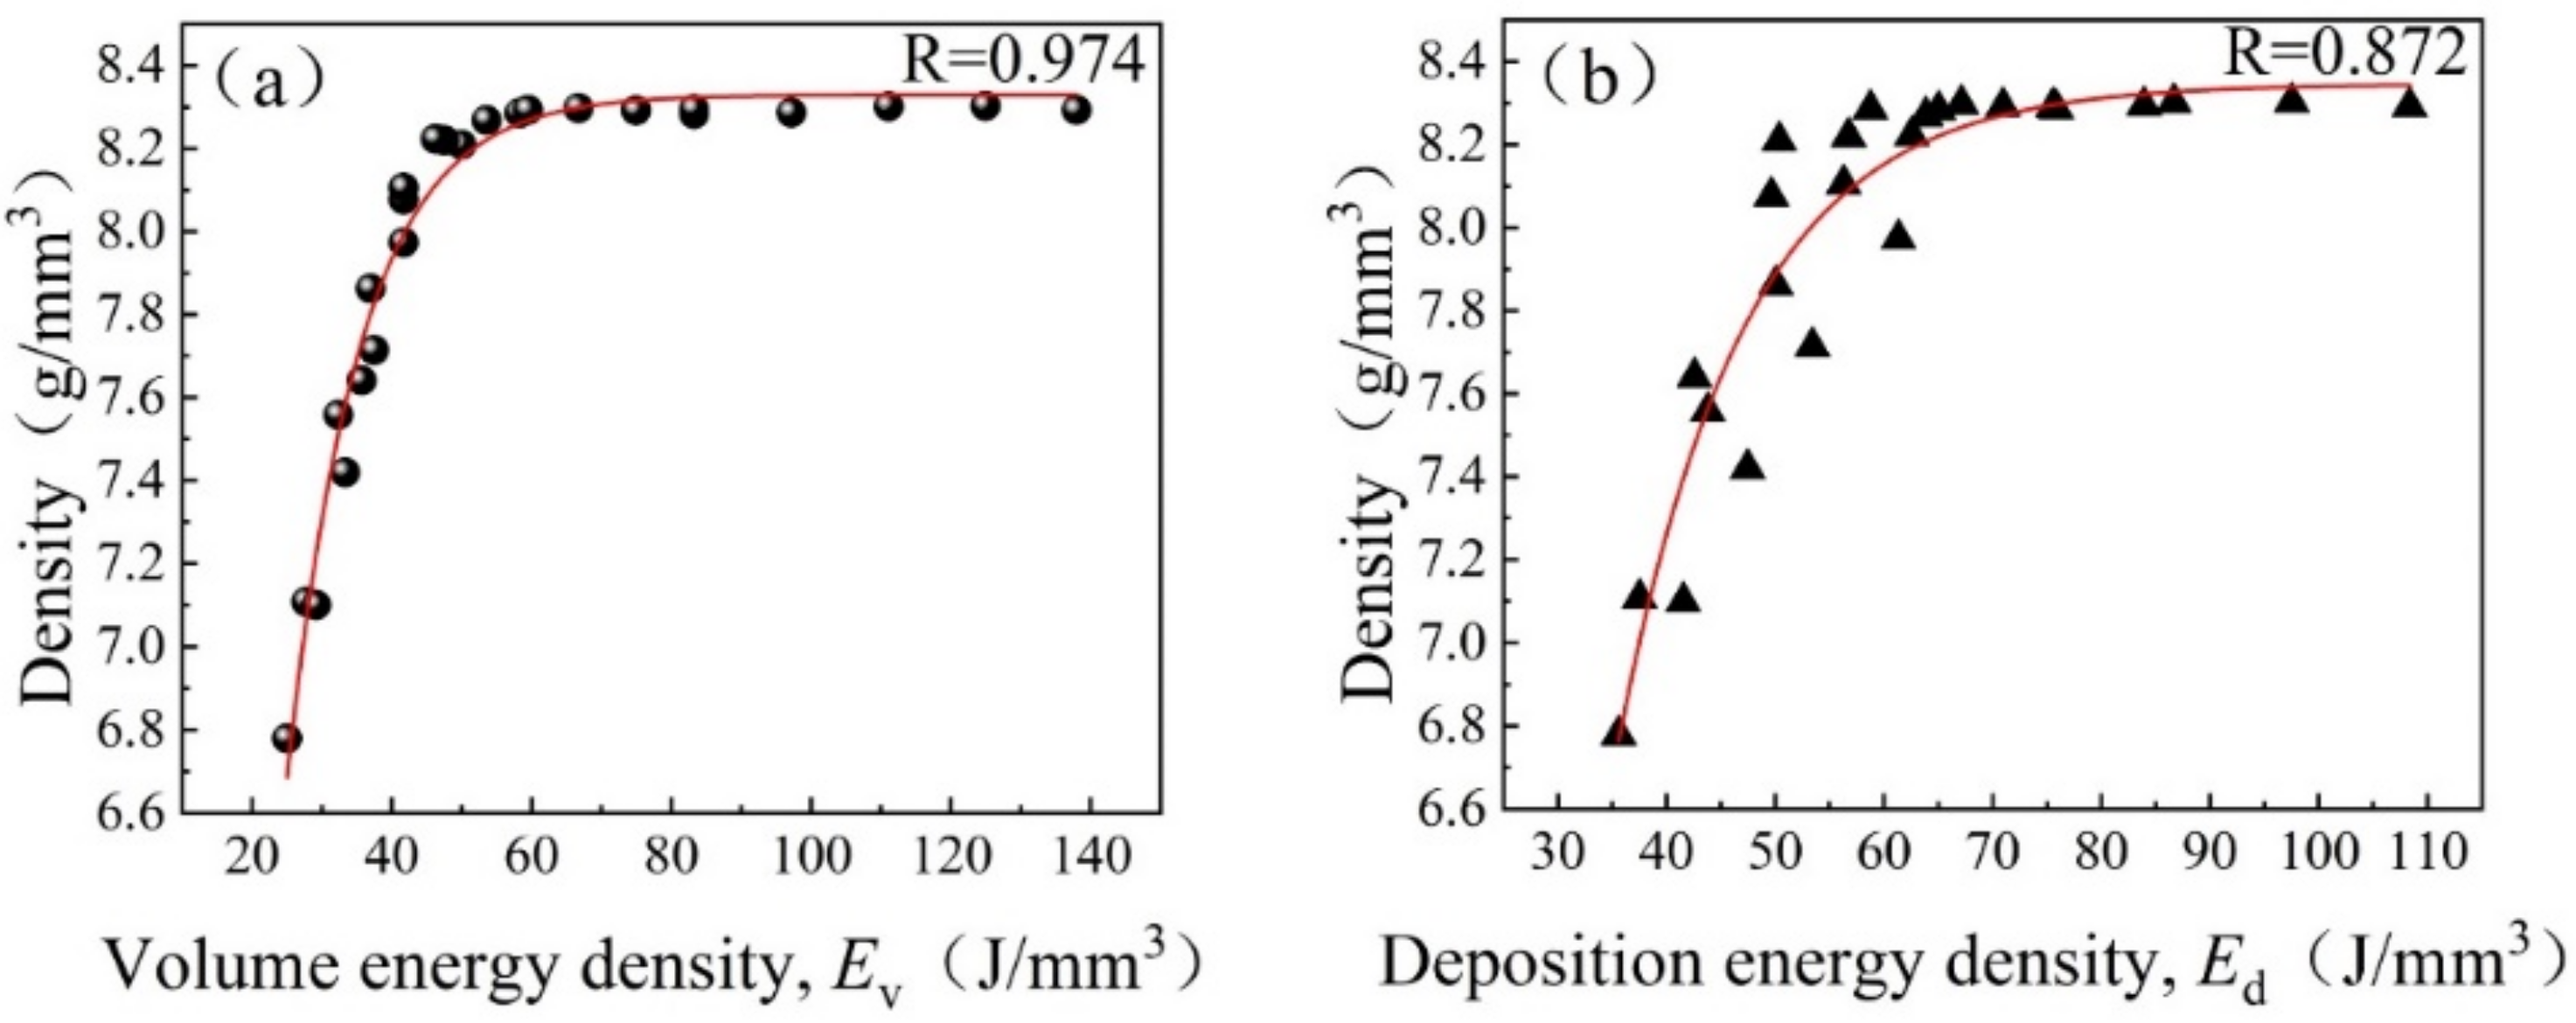
3.3. Density
3.4. Hardness
4. Discussion
5. Conclusions
- (1)
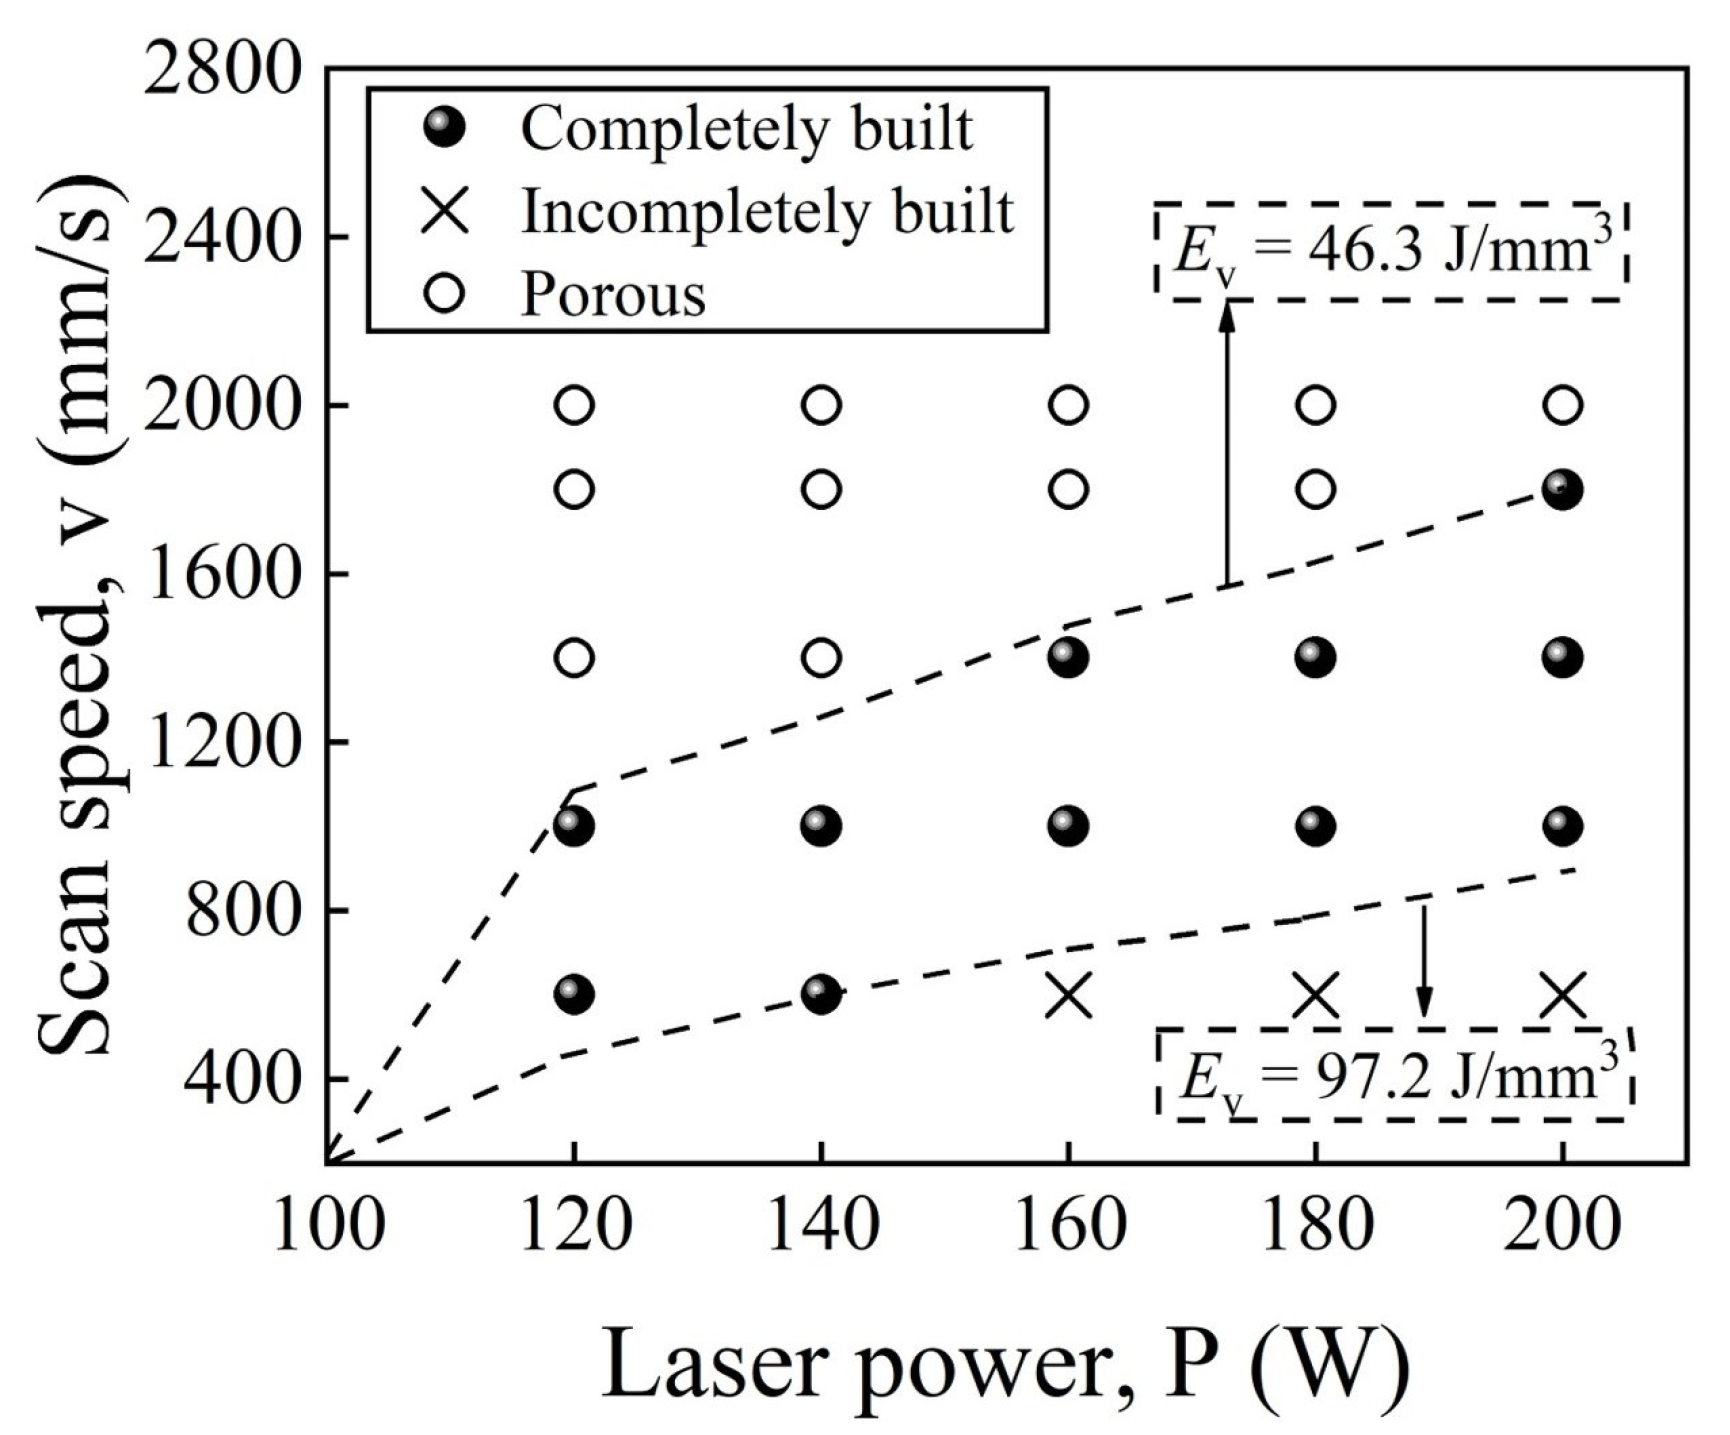
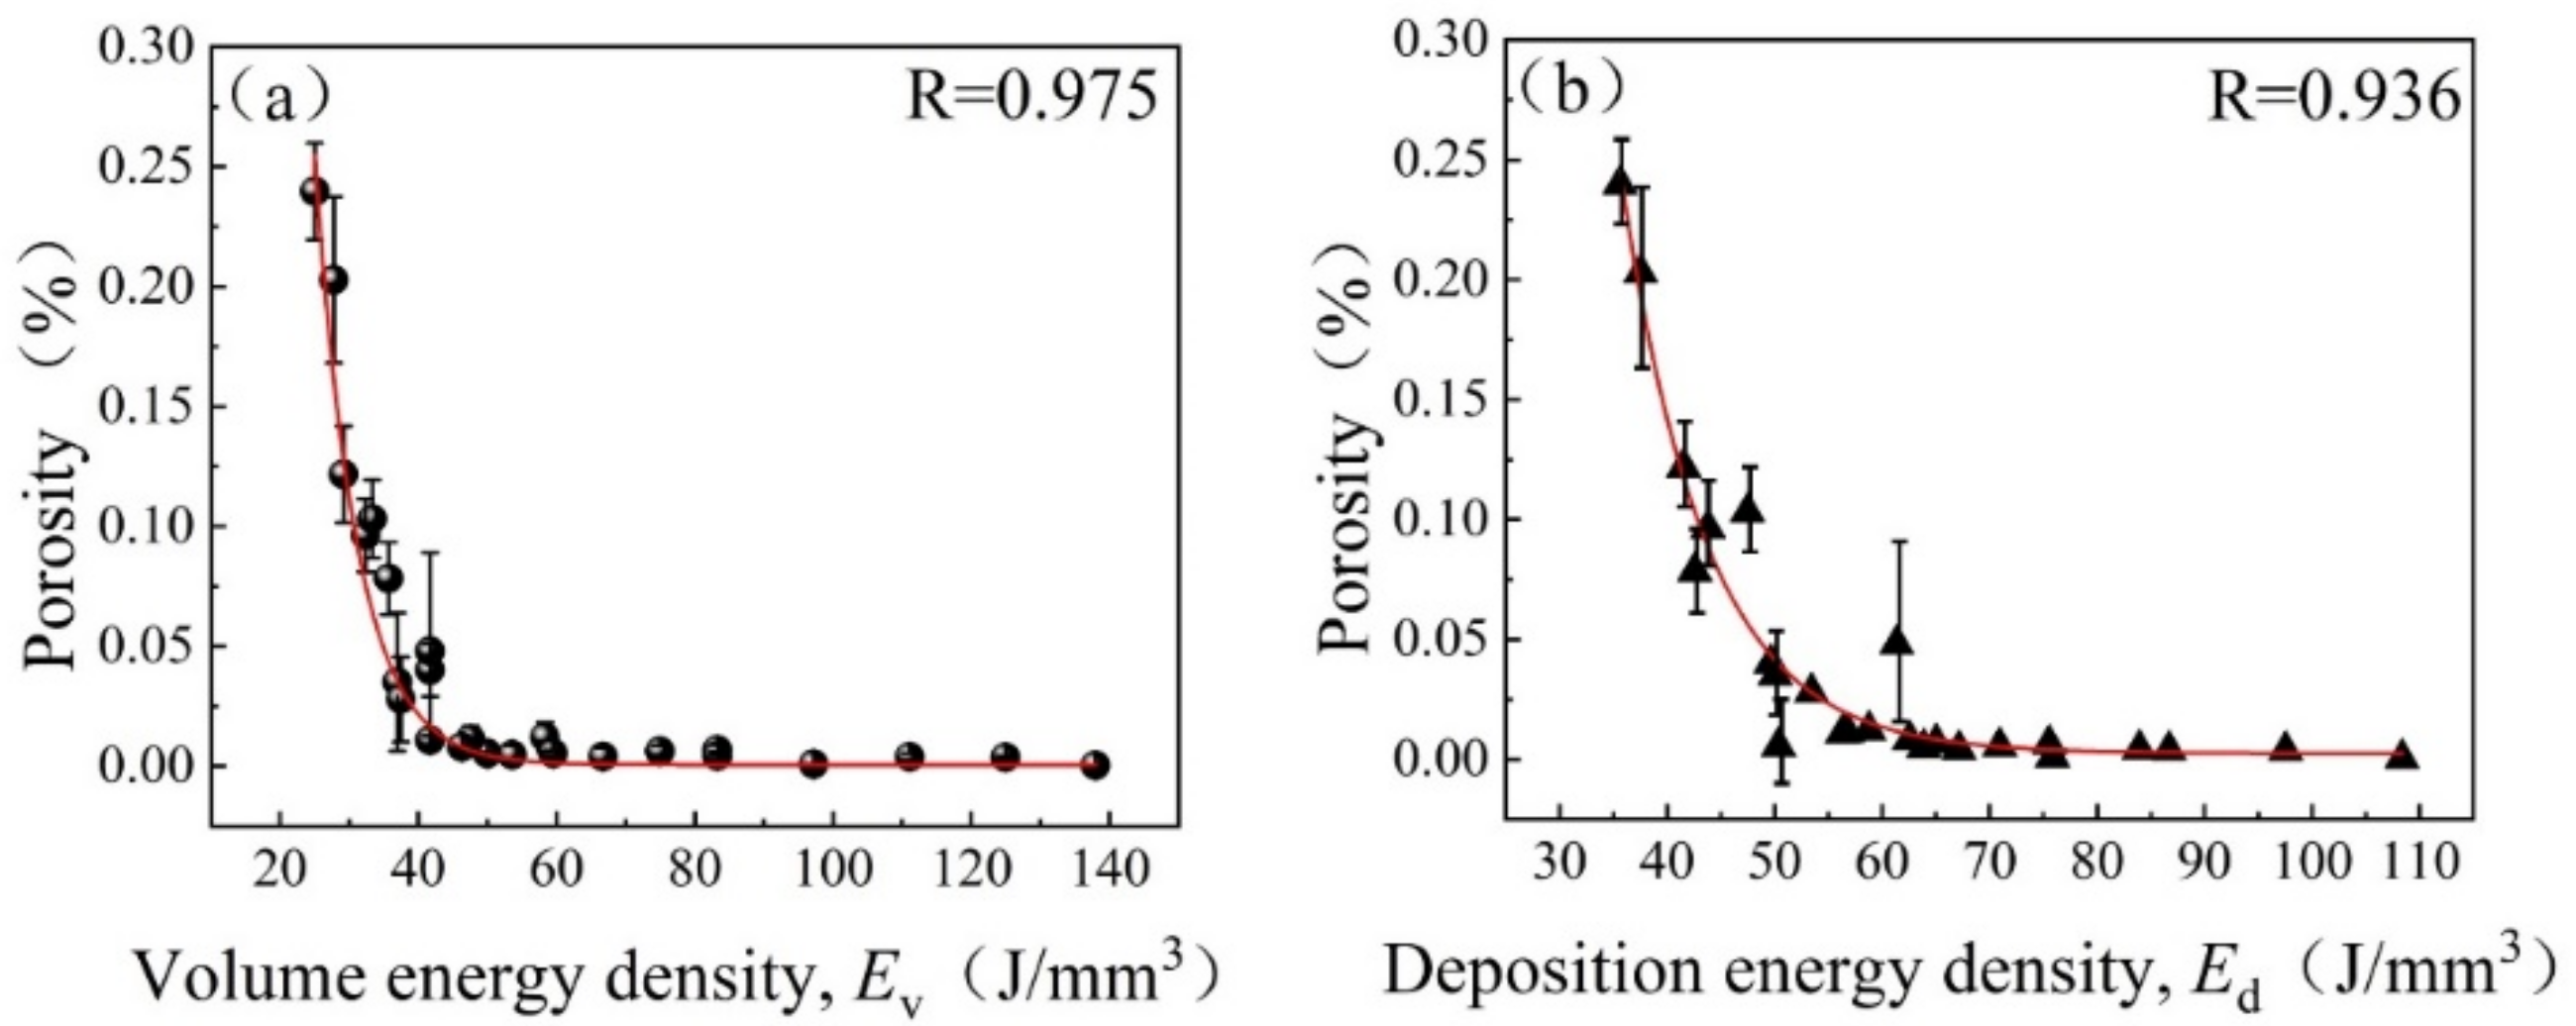
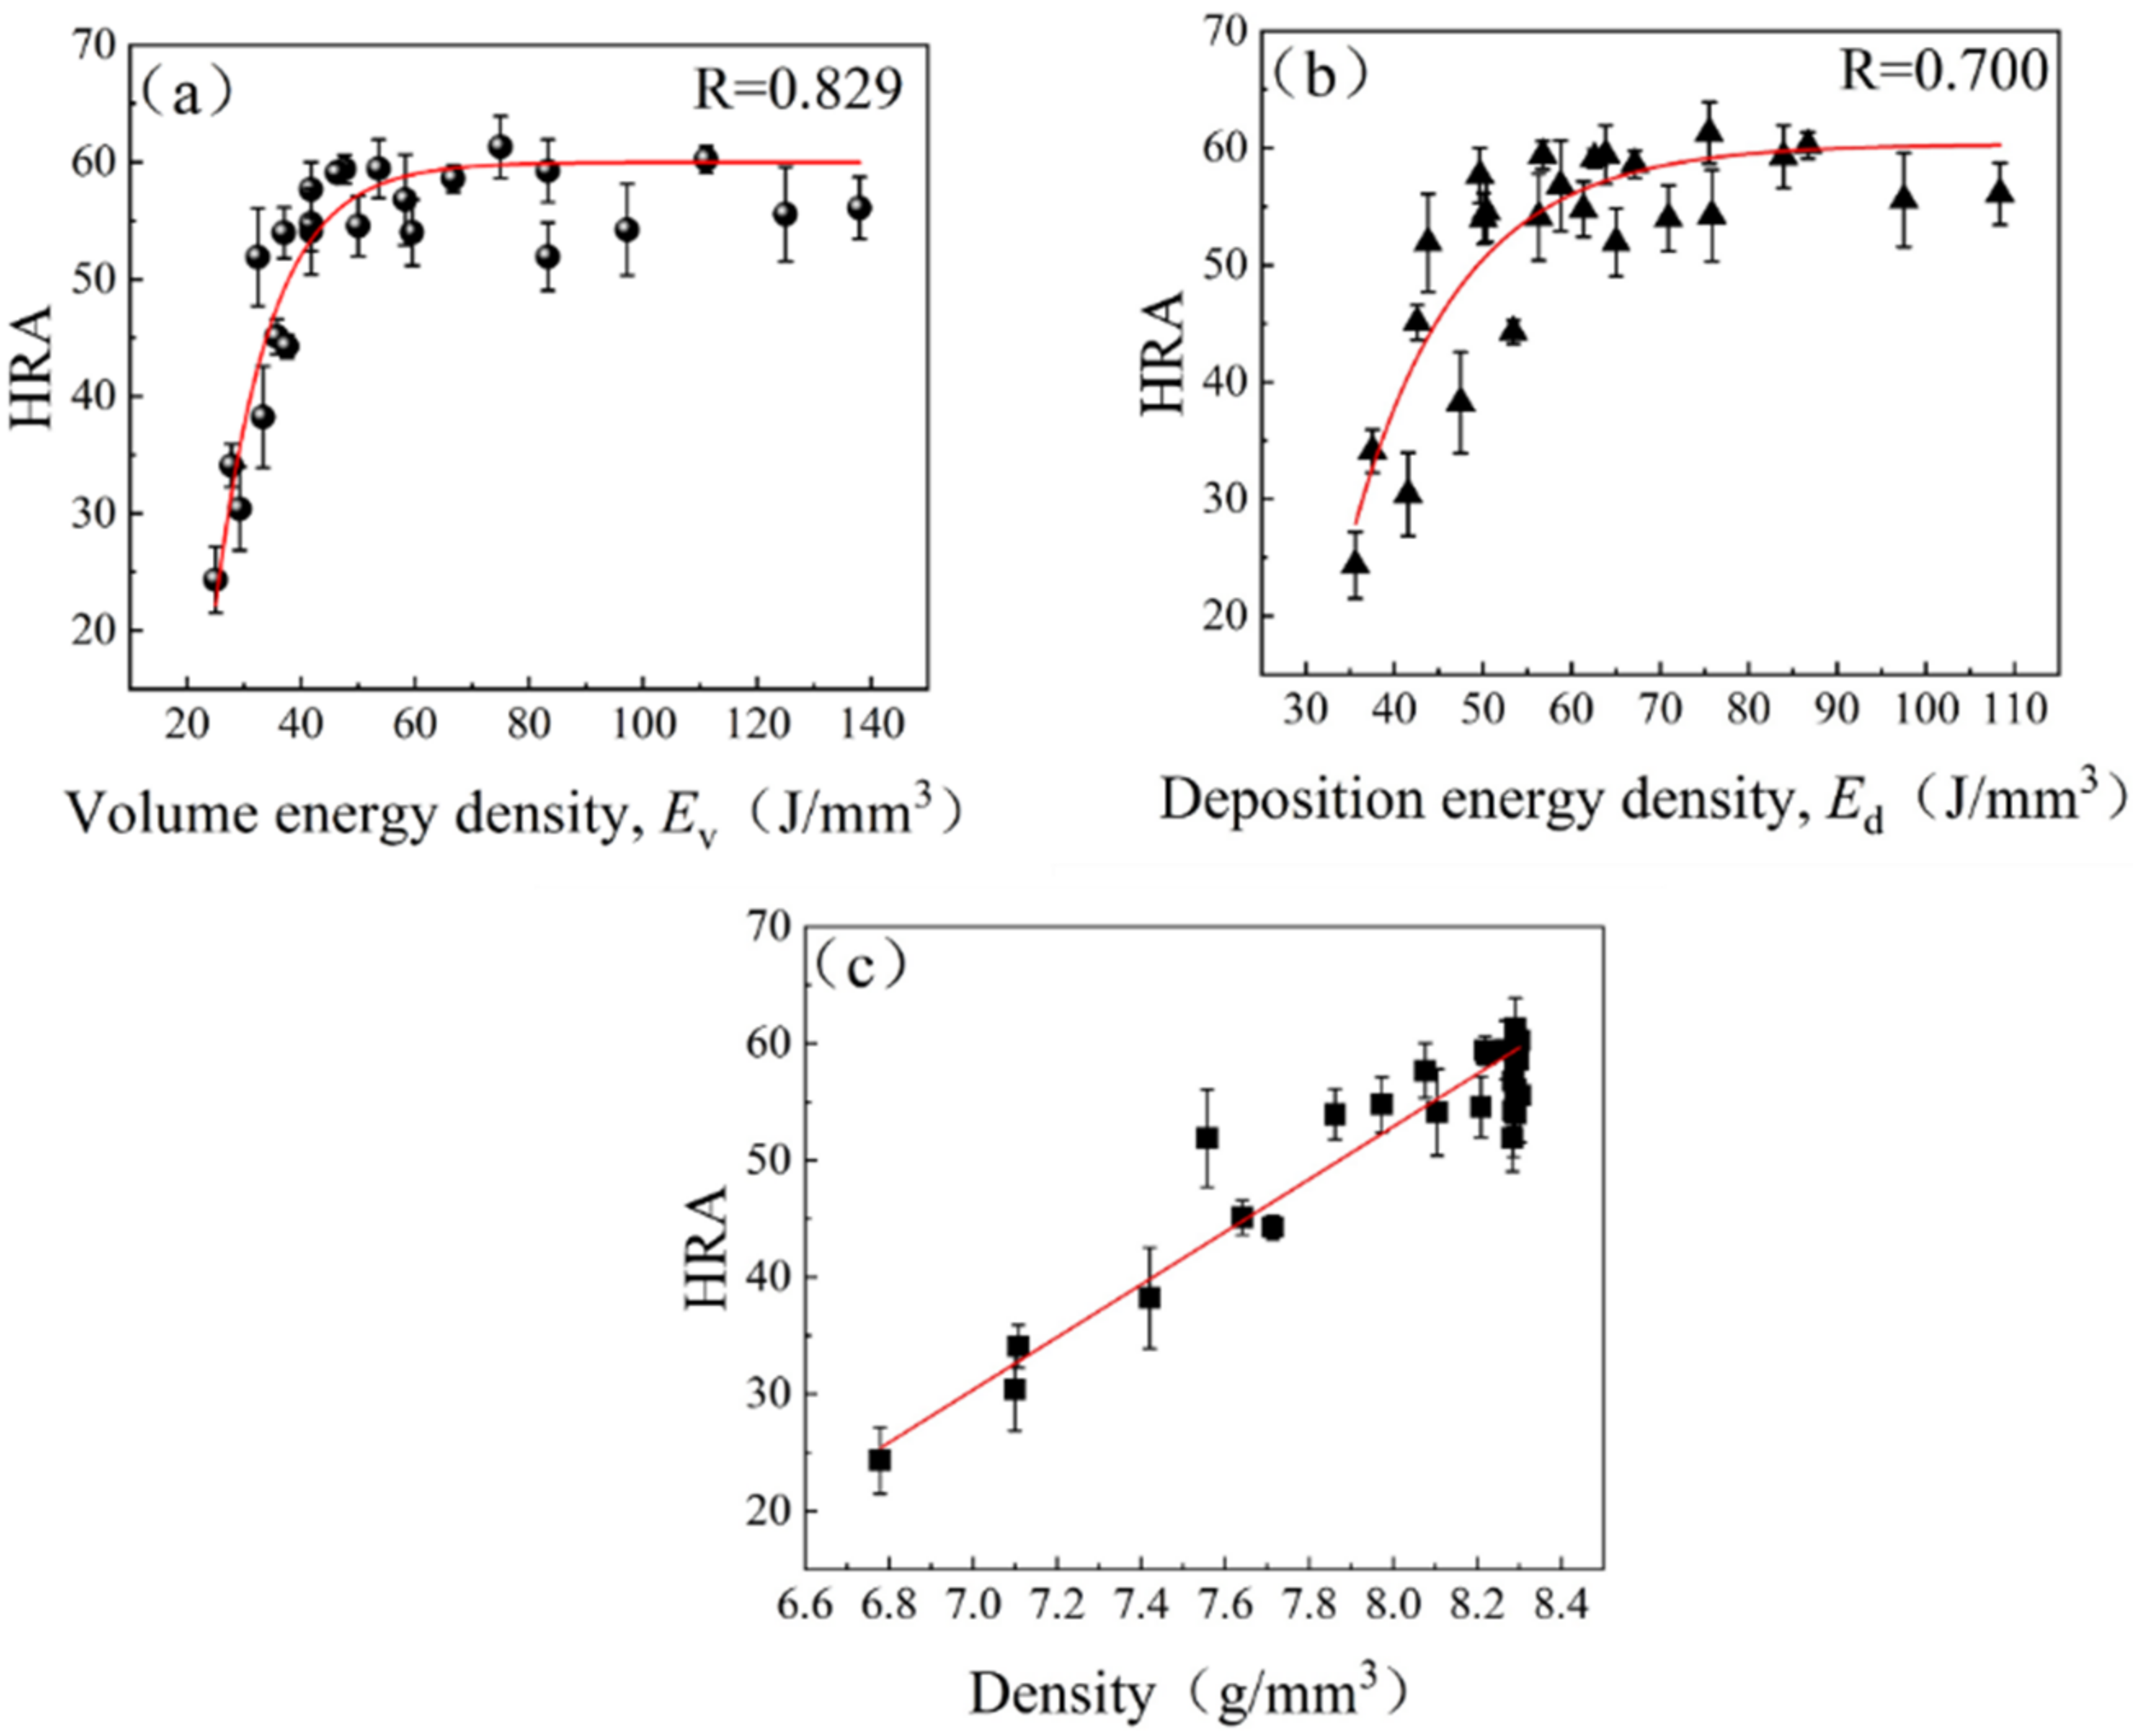
- When the volume energy density increased from 25.0 to 46.3 J/mm3 or the deposition energy density increased from 35.6 to 62.5 J/mm3, the density of LBPBF GTD222 alloy increased from 6.78 g/mm3 to 8.29 g/mm3, the hardness increased from 24.3 HRA to 54.0 HRA, and the porosity decreased from 0.239 to 0.005%. When the volume energy density exceeded 46.3 J/mm3 or the deposition energy density exceeded 62.5 J/mm3, the density and hardness reached the maximum value and almost remained constant.
- (2)
- The fitting curve between the volume energy density and the performance parameters indicates the change of the performance of LBPBF GTD222 alloy more accurately than the curve between the deposition energy density and the performance parameters. The optimized volume energy density was 46.3–97.2 J/mm3.
Author Contributions
Funding
Institutional Review Board Statement
Informed Consent Statement
Data Availability Statement
Conflicts of Interest
References
- Singla, A.K.; Banerjee, M.; Sharma, A.; Singh, J.; Bansal, A.; Gupta, M.K.; Khanna, N.; Shahi, A.S.; Goyal, D.K. Selective laser melting of Ti6Al4V alloy: Process parameters, defects and post-treatments. J. Manuf. Processes. 2021, 64, 161–187. [Google Scholar] [CrossRef]
- Herzog, D.; Seyda, V.; Wycisk, E.; Emmelmann, C. Additive manufacturing of metals. Acta Mater. 2016, 117, 371–392. [Google Scholar] [CrossRef]
- Maohang, Z.; Baicheng, Z.; Yaojie, W.; Xuanhui, Q. Research progress on selective laser melting processing for nickel-based superalloy. Int. J. Miner. Metall. Mater. 2022, 29, 369. [Google Scholar]
- Emmelmann, C.; Kranz, J.; Herzog, D.; Wycisk, E. Laser Additive Manufacturing of Metals. In Laser Technology in Biomimetics; Springer: Berlin/Heidelberg, Germany, 2013; pp. 143–162. [Google Scholar]
- Yuxin, H.; Yu’e, M.; Weihong, Z.; Zhenhai, W. Effects of build direction on thermal exposure and creep performance of SLM Ti6Al4V titanium alloy. Eng. Fail. Anal. 2022, 135, 106063. [Google Scholar]
- Zhenglei, Y.; Zezhou, X.; Yunting, G.; Renlong, X.; Ruiyao, L.; Chaorui, J.; Lunxiang, L.; Zhihui, Z.; Luquan, R. Study on properties of SLM-NiTi shape memory alloy under the same energy density. J. Mater. Res. Technol. 2021, 13, 241–250. [Google Scholar]
- Tian, X.; Rui, W.; Zhongnan, B.; Guoliang, Z.; Qingbiao, T.; Ji, Z. Effect of Heat Treatment on Microstructure and Mechanical Properties of a Selective Laser Melting Processed Ni-Based Superalloy GTD222. Materials 2021, 14, 3668. [Google Scholar]
- Rui, W.; Guoliang, Z.; Qingbiao, T.; Wenzhe, Z.; Chao, Y.; Donghong, W.; Anping, D.; Da, S.; Liang, Z.; Baode, Z. Effect of high temperature aging on microstructures and tensile properties of a selective laser melted GTD222 superalloy. J. Alloy. Compd. 2021, 853, 157226. [Google Scholar]
- Sadowski, M.; Ladani, L.; Brindley, W.; Romano, J. Optimizing quality of additively manufactured Inconel 718 using powder bed laser melting process. Addit. Manuf. 2016, 11, 60–70. [Google Scholar] [CrossRef]
- Zhijun, T.; Shuang, G.; Liang, L.; Bo, H. Effect of Rescanning Strategy on Residual Stress and Distortion of Two Alloys Manufactured by Selective Laser Melting. J. Mater. Eng. Perform. 2021, 30, 6493–6501. [Google Scholar]
- Gogolewski, D.; Bartkowiak, T.; Kozior, T.; Zmarzly, P. Multiscale Analysis of Surface Texture Quality of Models Manufactured by Laser Powder-Bed Fusion Technology and Machining from 316L Steel. Materials 2021, 14, 2794. [Google Scholar] [CrossRef]
- Li, C.; White, R.; Fang, X.Y.; Weaver, M.; Guo, Y.B. Microstructure evolution characteristics of Inconel 625 alloy from selective laser melting to heat treatment. Mater. Sci. Eng. A 2017, 705, 20–31. [Google Scholar] [CrossRef]
- Khorasani, A.M.; Gibson, I.; Ghasemi, A.; Ghaderi, A. Modelling of laser powder bed fusion process and analysing the effective parameters on surface characteristics of Ti-6Al-4V. Int. J. Mech. Sci. 2020, 168, 105299. [Google Scholar] [CrossRef]
- Nguyen, Q.B.; Luu, D.N.; Nai, S.M.L.; Zhu, Z.; Chen, Z.; Wei, J. The role of powder layer thickness on the quality of SLM printed parts. Arch. Civil. Mech. Eng. 2018, 18, 948–955. [Google Scholar] [CrossRef]
- Lopez-Galilea, I.; Ruttert, B.; He, J.; Hammerschmidt, T.; Drautz, R.; Gault, B.; Theisen, W. Additive manufacturing of CMSX-4 Ni-base superalloy by selective laser melting: Influence of processing parameters and heat treatment. Addit. Manuf. 2019, 30, 100874. [Google Scholar] [CrossRef]
- Lukina, E.A.; Bazaleeva, K.O.; Petrushin, N.V.; Treninkov, I.A.; Tsvetkova, E.V. Effect of the selective laser melting parameters on the structure–phase state of a ZhS6K-VI nickel superalloy. Russ. Metall. 2017, 2017, 594–600. [Google Scholar] [CrossRef]
- Shuang, G.; Zhijun, T.; Liang, L.; Bo, H. Effects of geometrical size and structural feature on the shape-distortion behavior of hollow Ti-alloy blade fabricated by additive manufacturing process. J. Laser Appl. 2020, 32, 032005. [Google Scholar]
- Prashanth, K.G.; Scudino, S.; Maity, T.; Das, J.; Eckert, J. Is the energy density a reliable parameter for materials synthesis by selective laser melting? Mater. Res. Lett. 2017, 5, 386–390. [Google Scholar] [CrossRef] [Green Version]
- Cao, X.; Carter, L.N.; Villapún, V.M.; Cantaboni, F.; De Sio, G.; Lowther, M.; Louth, S.E.T.; Grover, L.; Ginestra, P.; Cox, S.C. Optimisation of single contour strategy in selective laser melting of Ti-6Al-4V lattices. Rapid Prototyp. J. 2022, 28, 907–915. [Google Scholar] [CrossRef]
- Scipioni Bertoli, U.; Wolfer, A.J.; Matthews, M.J.; Delplanque, J.-P.R.; Schoenung, J.M. On the limitations of Volumetric Energy Density as a design parameter for Selective Laser Melting. Mater. Design 2017, 113, 331–340. [Google Scholar] [CrossRef] [Green Version]
- Pal, S.; Lojen, G.; Kokol, V.; Drstvensek, I. Evolution of metallurgical properties of Ti-6Al-4V alloy fabricated in different energy densities in the Selective Laser Melting technique. J. Manuf. Processes 2018, 35, 538–546. [Google Scholar] [CrossRef]
- Hann, D.B.; Iammi, J.; Folkes, J. A simple methodology for predicting laser-weld properties from material and laser parameters. J. Phys. D Appl. Phys. 2011, 44, 445401. [Google Scholar] [CrossRef]
- Liverani, E.; Toschi, S.; Ceschini, L.; Fortunato, A. Effect of selective laser melting (SLM) process parameters on microstructure and mechanical properties of 316L austenitic stainless steel. J. Mater. Processing Technol. 2017, 249, 255–263. [Google Scholar] [CrossRef]
- Guoliang, Z.; Weitao, P.; Rui, W.; Donghong, W.; Da, S.; Liang, Z.; Anping, D.; Baode, S. Microstructures and mechanical properties of GTD222 superalloy fabricated by selective laser melting. Mater. Sci. Eng. A 2021, 807, 140668. [Google Scholar]
- Lykov, P.A. The Energy Density as a Reliable Parameter for Characterization of Selective Laser Melting of Various Alloys. Mater. Sci. Forum 2019, 946, 972–977. [Google Scholar] [CrossRef]
- Kempen, K.; Yasa, E.; Thijs, L.; Kruth, J.P.; Van Humbeeck, J. Microstructure and mechanical properties of Selective Laser Melted 18Ni-300 steel. Phys. Procedia 2011, 12, 255–263. [Google Scholar] [CrossRef] [Green Version]
- Casalino, G.; Campanelli, S.L.; Contuzzi, N.; Ludovico, A.D. Experimental investigation and statistical optimisation of the selective laser melting process of a maraging steel. Opt. Laser Technol. 2015, 65, 151–158. [Google Scholar] [CrossRef]
- Suzuki, A.; Nishida, R.; Takata, N.; Kobashi, M.; Kato, M. Design of laser parameters for selectively laser melted maraging steel based on deposited energy density. Addit. Manuf. 2019, 28, 160–168. [Google Scholar] [CrossRef]
- Qiu, C.; Panwisawas, C.; Ward, M.; Basoalto, H.C.; Brooks, J.W.; Attallah, M.M. On the role of melt flow into the surface structure and porosity development during selective laser melting. Acta Mater. 2015, 96, 72–79. [Google Scholar] [CrossRef] [Green Version]
- Khairallah, S.A.; Anderson, A.T.; Rubenchik, A.; King, W.E. Laser powder-bed fusion additive manufacturing: Physics of complex melt flow and formation mechanisms of pores, spatter, and denudation zones. Acta Mater. 2016, 108, 36–45. [Google Scholar] [CrossRef] [Green Version]


| Element | Cr | Co | W | Nb | Ta | Ti | Al | C | Zr | B | Ni |
|---|---|---|---|---|---|---|---|---|---|---|---|
| Content | 22.3 | 18.82 | 1.93 | 0.8 | 0.99 | 2.32 | 1.18 | 0.1 | 0.007 | 0.003 | Bal. |
Publisher’s Note: MDPI stays neutral with regard to jurisdictional claims in published maps and institutional affiliations. |
© 2022 by the authors. Licensee MDPI, Basel, Switzerland. This article is an open access article distributed under the terms and conditions of the Creative Commons Attribution (CC BY) license (https://creativecommons.org/licenses/by/4.0/).
Share and Cite
Wang, Z.; He, B.; Song, Z.; Lan, L.; Lu, G.; Gao, S. Optimization of the Process Parameters of Laser Beam Powder Bed Fusion GTD222 Nickel-Based Superalloy Based on Two Laser Energy Densities. Metals 2022, 12, 1154. https://doi.org/10.3390/met12071154
Wang Z, He B, Song Z, Lan L, Lu G, Gao S. Optimization of the Process Parameters of Laser Beam Powder Bed Fusion GTD222 Nickel-Based Superalloy Based on Two Laser Energy Densities. Metals. 2022; 12(7):1154. https://doi.org/10.3390/met12071154
Chicago/Turabian StyleWang, Zhiqiang, Bo He, Zhenfeng Song, Liang Lan, Guoxin Lu, and Shuang Gao. 2022. "Optimization of the Process Parameters of Laser Beam Powder Bed Fusion GTD222 Nickel-Based Superalloy Based on Two Laser Energy Densities" Metals 12, no. 7: 1154. https://doi.org/10.3390/met12071154
APA StyleWang, Z., He, B., Song, Z., Lan, L., Lu, G., & Gao, S. (2022). Optimization of the Process Parameters of Laser Beam Powder Bed Fusion GTD222 Nickel-Based Superalloy Based on Two Laser Energy Densities. Metals, 12(7), 1154. https://doi.org/10.3390/met12071154