Article

Damage Evolution Simulations via a Coupled Crystal Plasticity and Cohesive Zone Model for Additively Manufactured Austenitic SS 316L DED Components

1
Institute of Science and Innovation in Mechanical and Industrial Engineering (INEGI), FEUP Campus, Rua Dr. Roberto Frias, 400, 4200-465 Porto, Portugal
2
Faculty of Engineering, University of Porto (FEUP), Rua Dr. Roberto Frias, 4200-465 Porto, Portugal
3
COMTES FHT a.s., Prumyslova 995, 334 41 Dobrany, Czech Republic
*
Author to whom correspondence should be addressed.
Metals 2022, 12(7), 1096; https://doi.org/10.3390/met12071096
Submission received: 30 May 2022 / Revised: 16 June 2022 / Accepted: 22 June 2022 / Published: 26 June 2022
(This article belongs to the Section Metal Failure Analysis)

Abstract

:
This study presents a microstructural model applicable to additively manufactured (AM) austenitic SS 316L components fabricated via a direct energy deposition (DED) process. The model is primarily intended to give an understanding of the effect of microscale and mesoscale features, such as grains and melt pool sizes, on the mechanical properties of manufactured components. Based on experimental observations, initial assumptions for the numerical model regarding grain size and melt pool dimensions were considered. Experimental observations based on miniature-sized 316L stainless steel DED-fabricated samples were carried out to shed light on the deformation mechanism of FCC materials at the grain scale. Furthermore, the dependency of latent strain hardening parameters based on the Bassani–Wu hardening model for a single crystal scale is investigated, where the Voronoi tessellation method and probability theory are utilized for the definition of the grain distribution. A hierarchical polycrystalline modeling methodology based on a representative volume element (RVE) with the realistic impact of grain boundaries was adopted for fracture assessment of the AM parts. To qualify the validity of process–structure–property relationships, cohesive zone damage surfaces were used between melt pool boundaries as the predefined initial cracks and the performance of the model is validated based on the experimental observations.

1. Introduction

Additive manufacturing (AM) technologies for the processing of metal parts such as direct energy deposition (DED) have extensively revolutionized the manufacturing capabilities in many industrial facilities. Since their emergence, they have been utilized in a great deal of applications, such as aerospace, biomedical, automotive and electronics among many others. In these technologies, material powder layers are blown and melted according to a predefined trajectory information provided by a CAD file (STL format), processed as a computer numerical control (CNC) code. When a layer of the desired part is manufactured, a new deposit layer is distributed on the building platform to construct another layer. This procedure is continued until the desired part is completely fabricated. While metal AM technologies have various potential and the range of applications has been expanded in recent years, the qualification of final products still remains the main challenge in the widespread adoption of metal AM technologies [1]. The existing research works [2,3,4,5] reveal that the micromechanical properties of parts, namely grain size, solidification morphology and crystallographic texture of an additively manufactured metal component can significantly affect mechanical properties, including strength and ductility. Different thermal gradients and various solidification rates [6] determine the phase formation during cooling [7,8] and together with different building directions [9] and various scan strategies [10] lead to different microstructures. Micro characterization of aforementioned variables, as well as their impact on the mechanical response of the manufactured parts, require a vast number of experiments, which may be time-consuming and expensive. Resorting to modeling and simulation capabilities, advances are expected in the design of novel structures (in macroscale) by controlling the microstructure of the components (in mesoscale) to meet required performances [11]. It may also be helpful to sustain the optimized microstructure and required functional properties of AM parts. Antony et al. [12] investigated the effect of process parameters such as laser power, scanning velocity and beam size on the geometrical characteristics and balling phenomenon of SS 316L samples in SLM fabrication based on experimental measures. They showed that the increase in the laser power leads to a higher temperature and a larger melt pool size. Zhang et al. [13] correlated the dimension of the DED clads with the deposition parameters of the SS 316L AM processing, where they inferred that the variation of melt pool width is more sensitive to laser power than to the depth of the melt pool. Foroozmehr et al. [14] developed a 3D finite element model to simulate the melt pool size of the SS 316L during the laser melting process. They utilized an optical penetration depth and laser diameter to define the volumetric heat source of the laser beam into the powder bed. Their study revealed the effect of laser scanning parameters on dimensions of the melt pool, in which the size of a melt pool changes from initial consecutive tracks until it becomes stable after a few tracks. Prediction of the micromechanical behavior of the SS 316L AM fabricated parts has been largely studied [15,16,17,18]. Rodgers et al. [19,20] developed the Monte Carlo-based method aimed at microstructural simulation during solidification processes such as welding and AM. They showed different types of crystallographic orientations and grain evolution in the AM process driven by various laser scan strategies. Ahmadi et al. [21] and Taheri Andani et al. [22,23] investigated the effect of the manufacturing parameters based on experiments to evaluate the mechanical properties for SS 316L produced by selective laser melting (SLM) process, in order to reveal the effects of the microscopic defects, the melt pool sizes and the crystal orientations of grains on the failure response of AM parts. Allied with considering the microstructural effects of additively manufactured parts on their mechanical properties, Bhujangrao et al. [24] studied the effect of high-temperature on the microstructure for Inconel 718. Moreover, Melzer et al. [25] presented a detailed investigation on the mechanical and microstructural characteristics of a functionally graded material (FGM) of SS 316L and Inconel 718 manufactured by DED. They studied the effect of the material interface on the mechanical response of the produced parts experimentally. The same group of authors [26] studied the effect of processing parameters on the melt pool size throughout the high-fidelity process modelling for DED. They focused on the correlation of the melt pool size with the G-R response related to solidification and grain structures. Readers are referred to [27] for considering the effect of changing temperature during a tensile test and DRX models like JMAK when taking into account the grain evolution under tensile behavior. To the best knowledge of authors, there still exists a lack of fundamental understanding of the macroscale material behavior as a function of the microstructural properties. The presence of melt pools, along with the grains and grain boundaries, increases the microstructural complexities of the DED products which in turn, introduces challenges in comprehending the connection between the major microstructural features and the macroscopic mechanical response of the DED-fabricated parts.
In this regard, the present study intends to introduce a computational framework to make a correlation between the grains and melt pool of the SS 316L samples, which are produced by DED with a macroscale mechanical response. Firstly, the explicit microstructure representative model, including grain and melt pool, is created in the FE commercial package ABAQUS. Then, the physically-based crystal plasticity (CP) constitutive model is implemented in order to define the material properties of the grains and melt pools. The FEM calibration was carried out based on experimental tensile tests for miniature tensile samples to assign the hardening model parameters. Melt pool modeling is created with overlapping cylinder segmentations, which are connected to each other, and to deal with their boundary modeling, a cohesive zone model (CZM) is utilized to include the damage in the material. Several finite element models are simulated to assess the effects of grain size, melt pool morphology, and RVE size on the mechanical response of DED parts. The model framework outcome of the present research is expected to be applicable in other AM-based manufacturing methods when it comes to the investigation of the grain and melt pool effect on mechanical characterization.

2. Experimental Procedure

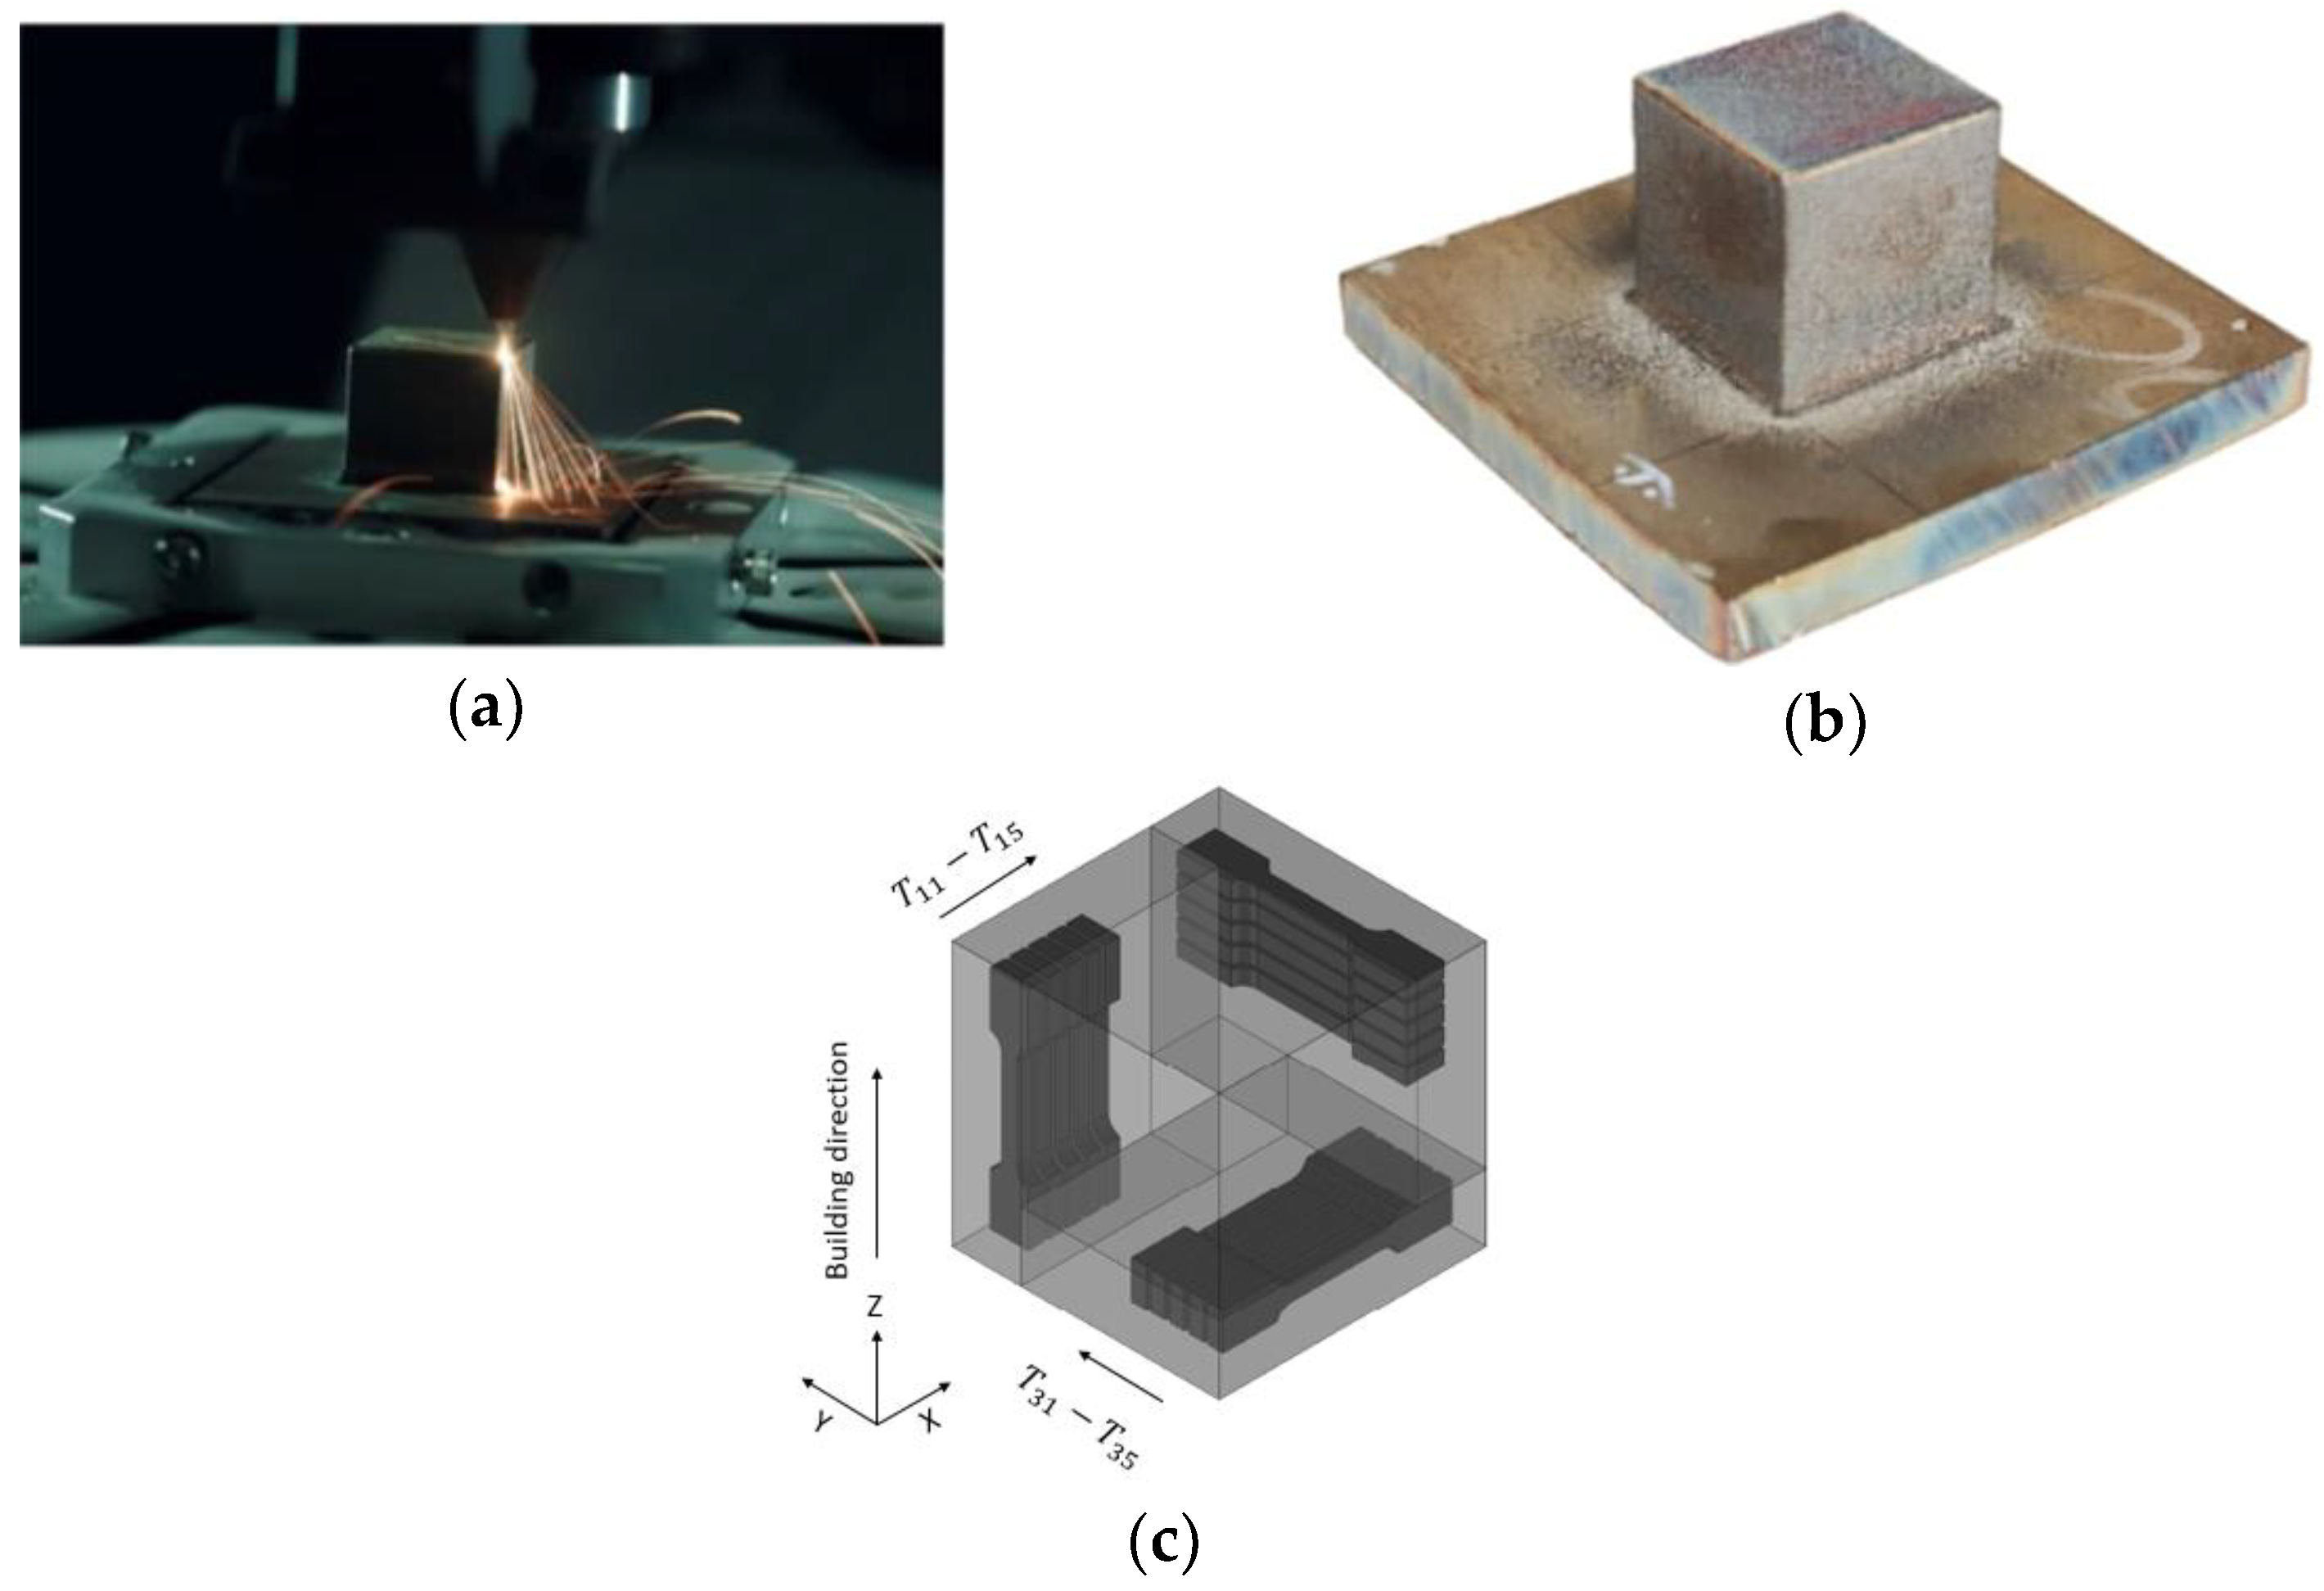
2.1. DED-Fabricated SS 316L Cubic Components
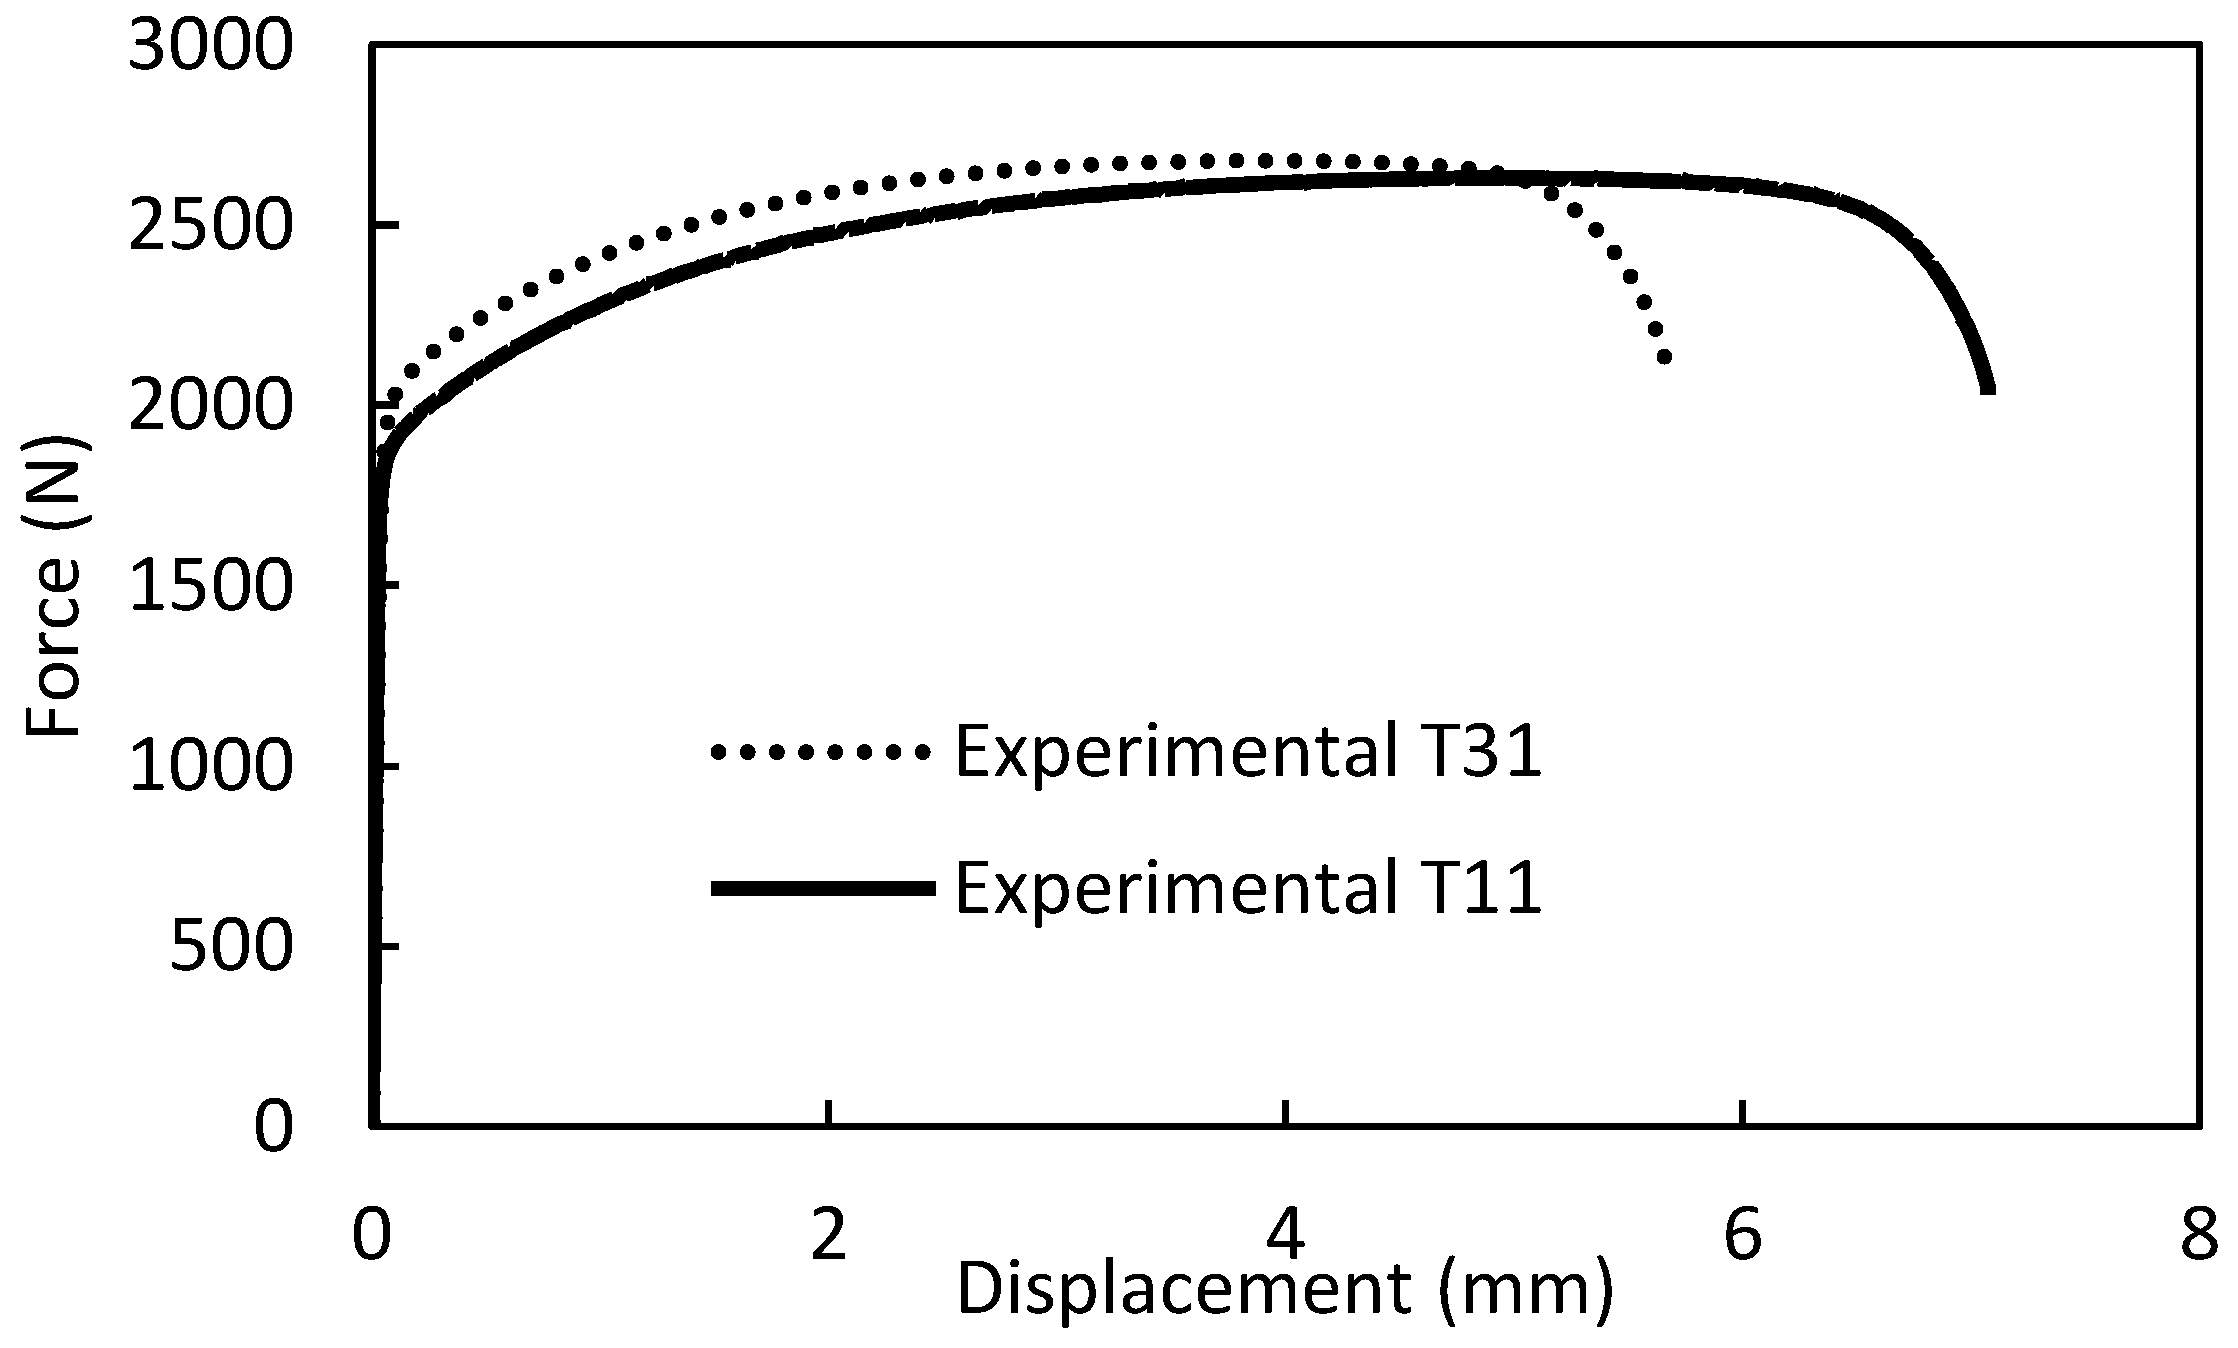
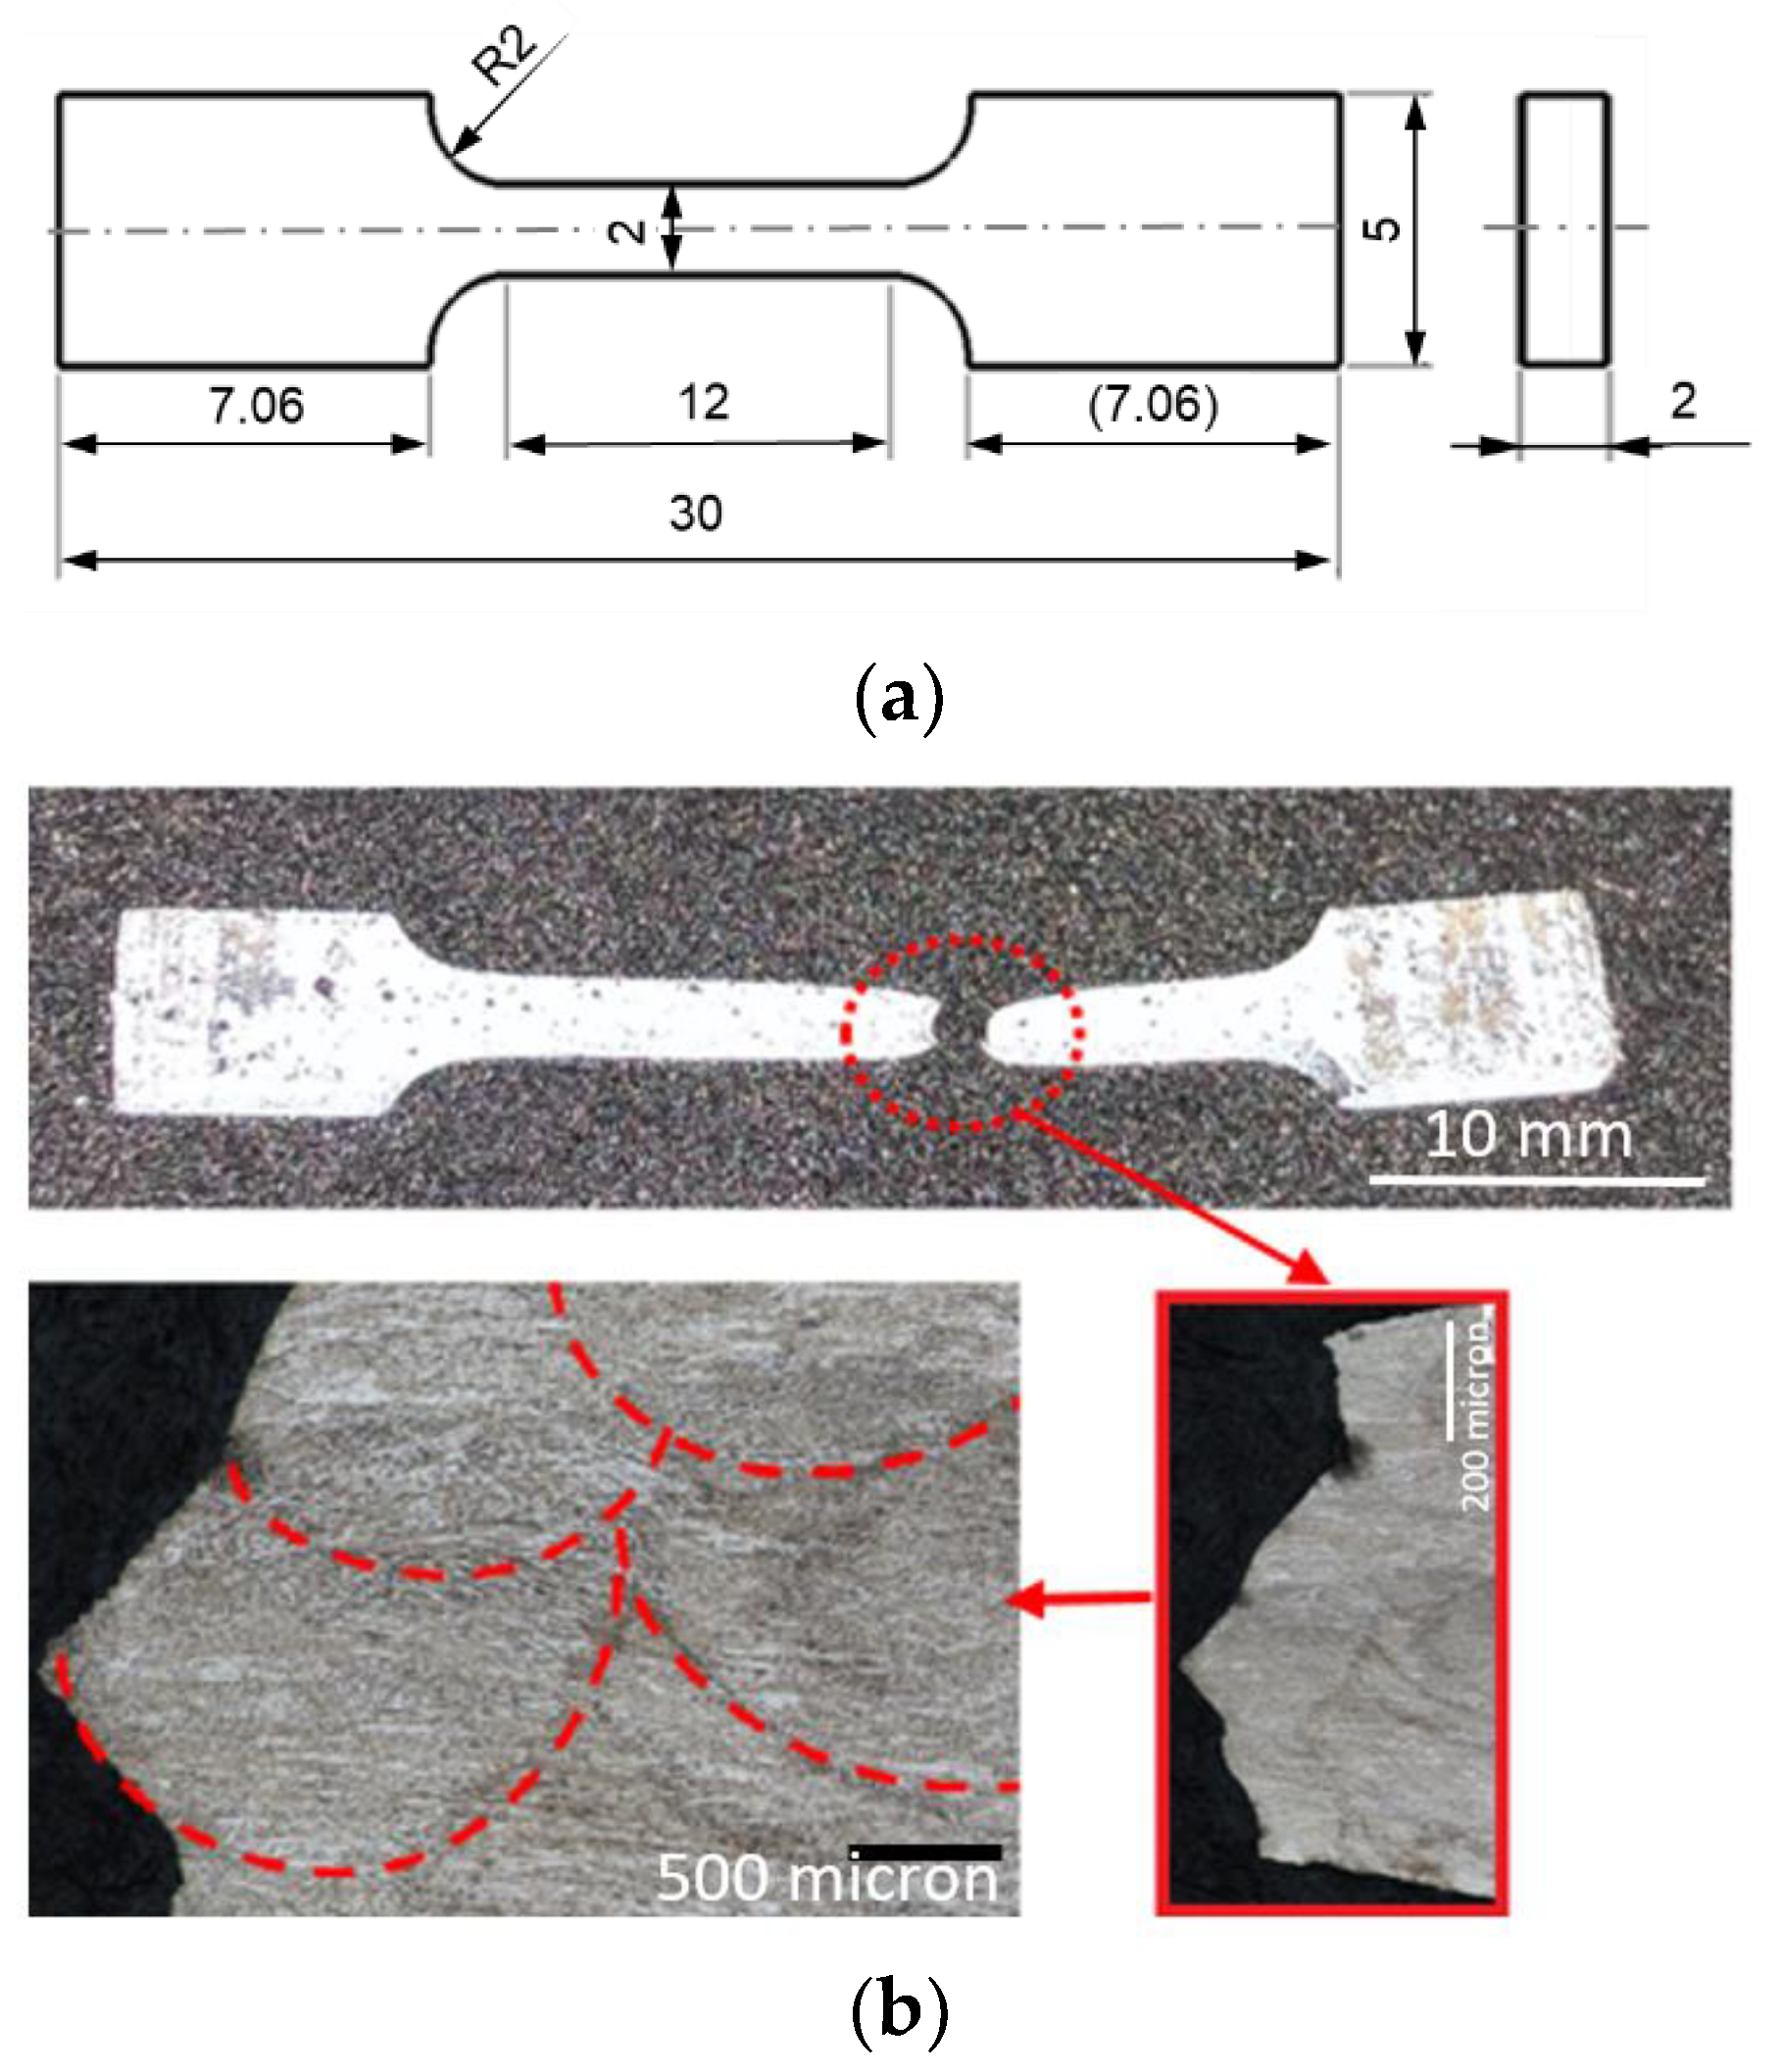
In the present work, the direct energy deposition DED technique was used for printing an austenitic SS 316L feed material. The commercial brand of machine is InssTek MX-600 (InssTek, Daejeon, South Korea) equipped with a 2 kW Ytterbium fiber laser unit. In order to fabricate a fully dense SS 316L cube, the laser beam diameter of 800   μ m is chosen. The schematic representation of the printing machine is shown in Figure 1a throughout printing the cube. The employed fabrication parameters including the laser power, scanning speed, layer thickness, powder feed rate and track overlap are 417   W , 14.166   mm / s , 0.25   mm , 3   g r / s , 0.5   mm , respectively. The miniature tensile coupons were taken from a 3-D fabricated cube with dimensions of 35 × 35 × 35   m m 3 , shown in Figure 1b. The specimens were extracted by wire electrical discharge machining (EDM) from the cube. A total of 15 specimens in 3 orientations (5 specimens per orientation) were cut for further investigations. Thus, the terminology for the samples can be written as T i j , where i and j respectively stand for the orientation index and sample number, which is referred to in Figure 1c. The vast evolution of the material properties of specimens with different anisotropy configurations was declared by authors in their previous researches [17,28] for the same material to shed some light on the effect of printing orientation on the mechanical properties. The experimental procedure in the present work is briefly explained here and interested readers are referred to the previous work of authors in [17]. In this study, two samples including T 11 and T 31 were selected to describe the effect of orientation on the mechanical properties and further analyses on the section of CP evolution were provided for sample T 11 .

2.2. Tensile Test

By conducting uniaxial tensile tests on miniaturized coupons with the geometry depicted in Figure 2a, the stress-strain curves are obtained. The test was carried out with the linear drive testing machine having the maximum load capacity of 5   kN . The strains were measured through a noncontact video extensometer optically with the gauge length of 11 mm. subsequent to the testing; the failed sample T 11 and its enlarged fracture surfaces are demonstrated in Figure 2b. The force-displacement data is provided in Figure 3 for samples T 11 and T 31 . During the DED process, the laser beam melts blown powder particles which forms melting pools that are connected to each other by a thin surface with different material properties than the bulk material. Each of the solidified melt pools may contain several grains. Figure 4 shows the morphology of the melt pool for sample T 11 .

3. Numerical Procedure

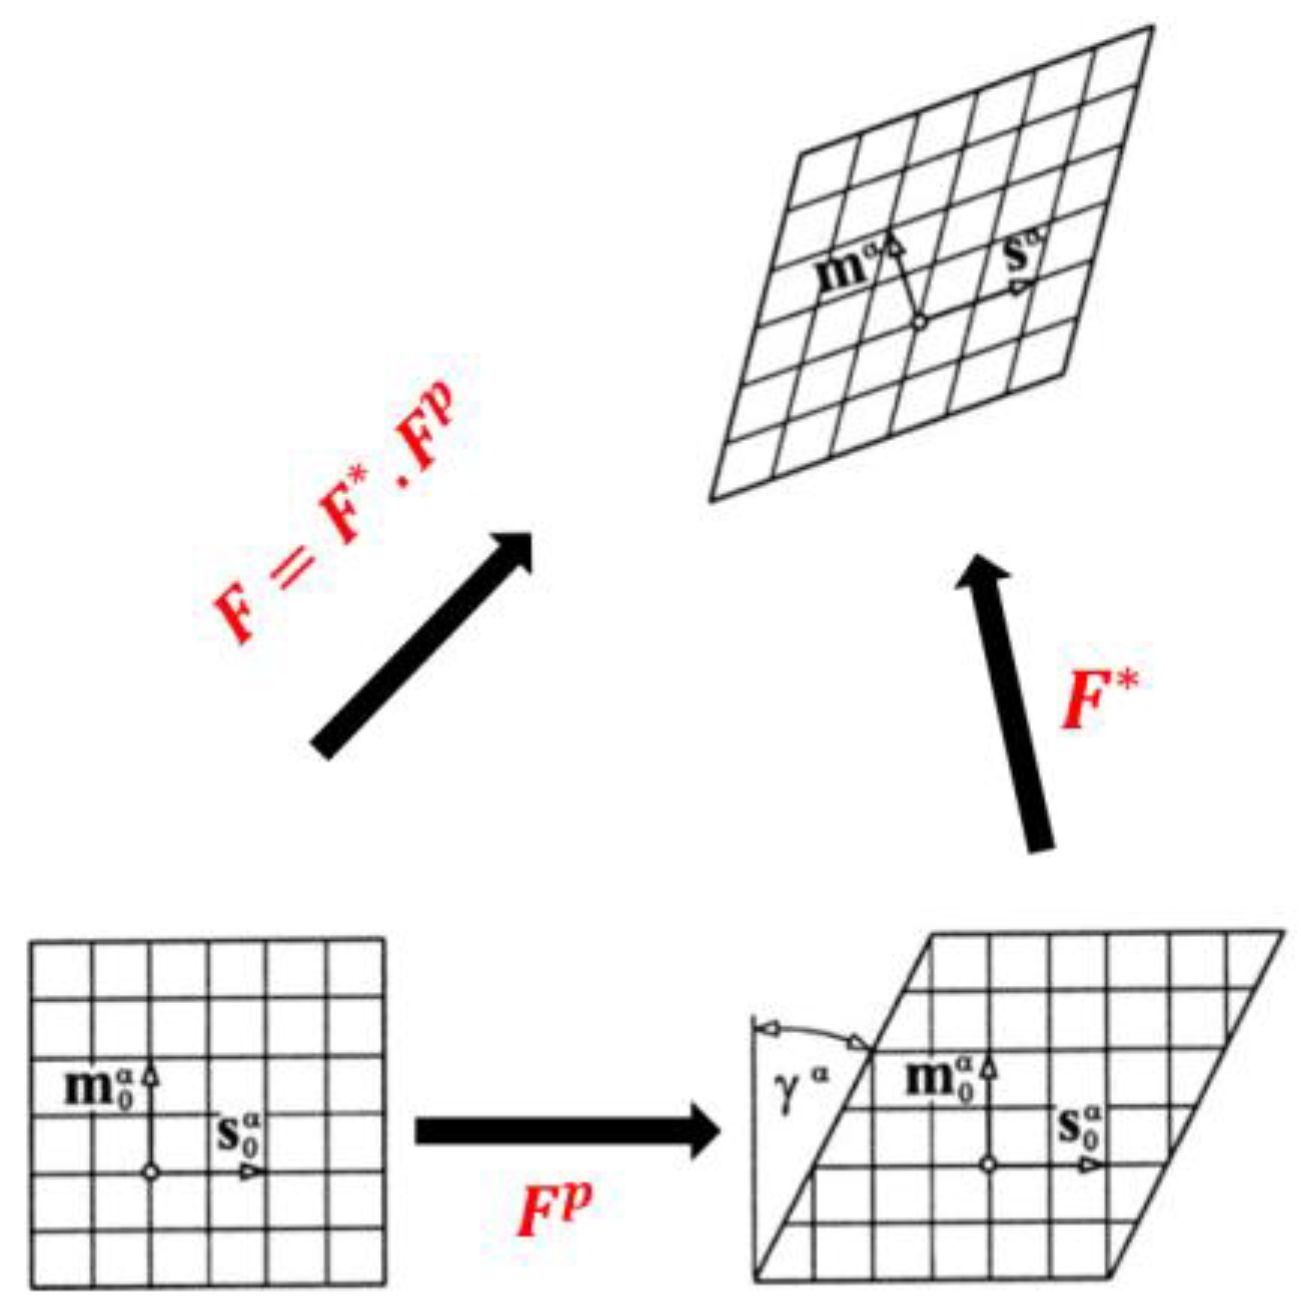
3.1. Classical CP Hypothesis

CP methodology accounts for orientation-dependent slip in grains that is a key feature of DED metal structures. In 1938, the initial concept of plastic deformation of single crystals was presented by Taylor [29] while numerical formulation making was done by Hill [30] and Rice [31]. It is assumed that the elastic deformation of a single crystal is caused due to the movement of dislocations on the slip planes of the crystal. The deformation gradient can be divided into two parts, as shown in Equation (1):
F = F * . F p
where F * is the deformation gradient caused by stretching and rotation of the crystal and F p presents the solely plastic deformation gradient. The schematic of this deformation can be seen in Figure 5:
The rate of plastic deformation F ˙ p can be related to the slip plane normal and direction m ( α ) and S ( α ) by Equation (2):
F ˙ P . F P 1 = α γ ˙ α   S ( α )   m ( α )
where α is the number of slip systems and γ ˙ α is the plastic slip rate in the α t h slip system. γ ˙ α can be described by the corresponding resolved shear stress τ α in the α t h slip system by Equation (3). The plastic slip occurs when the shear stress reaches a critical level in the direction of slipping on the crystallographic plate [32].
γ ˙ α = γ 0 α ˙ s g n ( τ ) α ( | τ α / g α | ) n
The sign γ ˙ α is determined by shear stress τ α , n is the rate sensitivity exponent, and g α is the material strain hardening which is described by following Equation (4):
g ˙ α = β = 1 m h α β   γ ˙ β
where h α β is the slip-hardening module which is related to shear strains. The sum ranges over all activated slip systems and m is the total number of activated slip systems. The coefficient h α β represents the self-hardening modulus when α = β . Otherwise, latent hardening modulus h α α = h α β can be represented as Equation (5):
h α α = h α β = h ( γ ) = ( h 0 s e c h 2 | h 0 γ ( τ s τ 0 ) |   )                    
where h 0 is the initial hardening modulus and τ s is the stage-I stress, τ 0 is the initial shear stress, q is the hardening factor (which is equal 1 for isotropic hardening module) and γ is the Taylor cumulative shear strain on all slip systems which is defined as in Equation (6):
γ = α = 1 12 γ α d t

3.2. Mesoscale Modeling of DED SS 316L

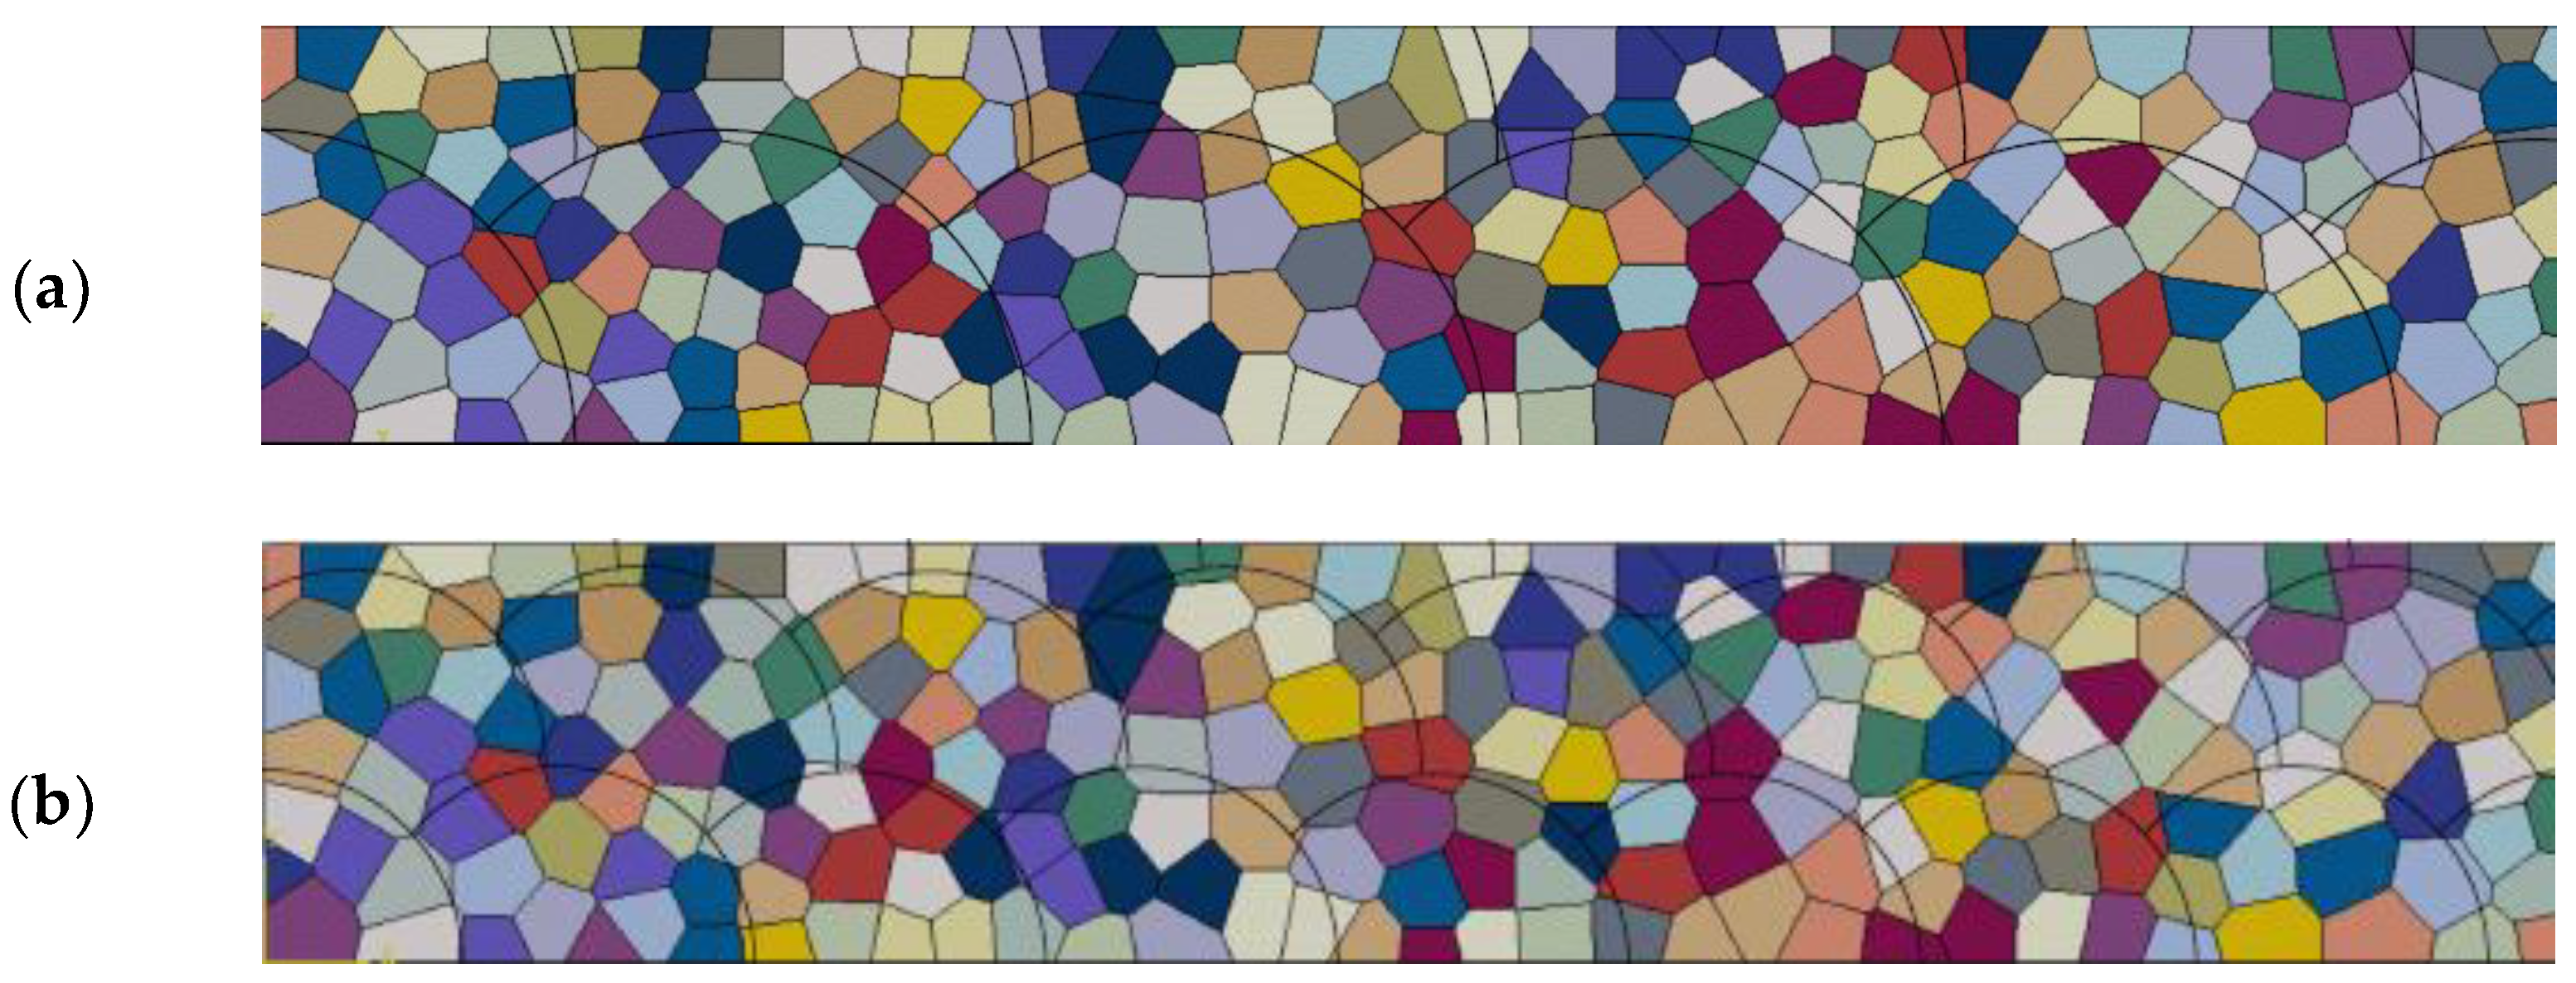
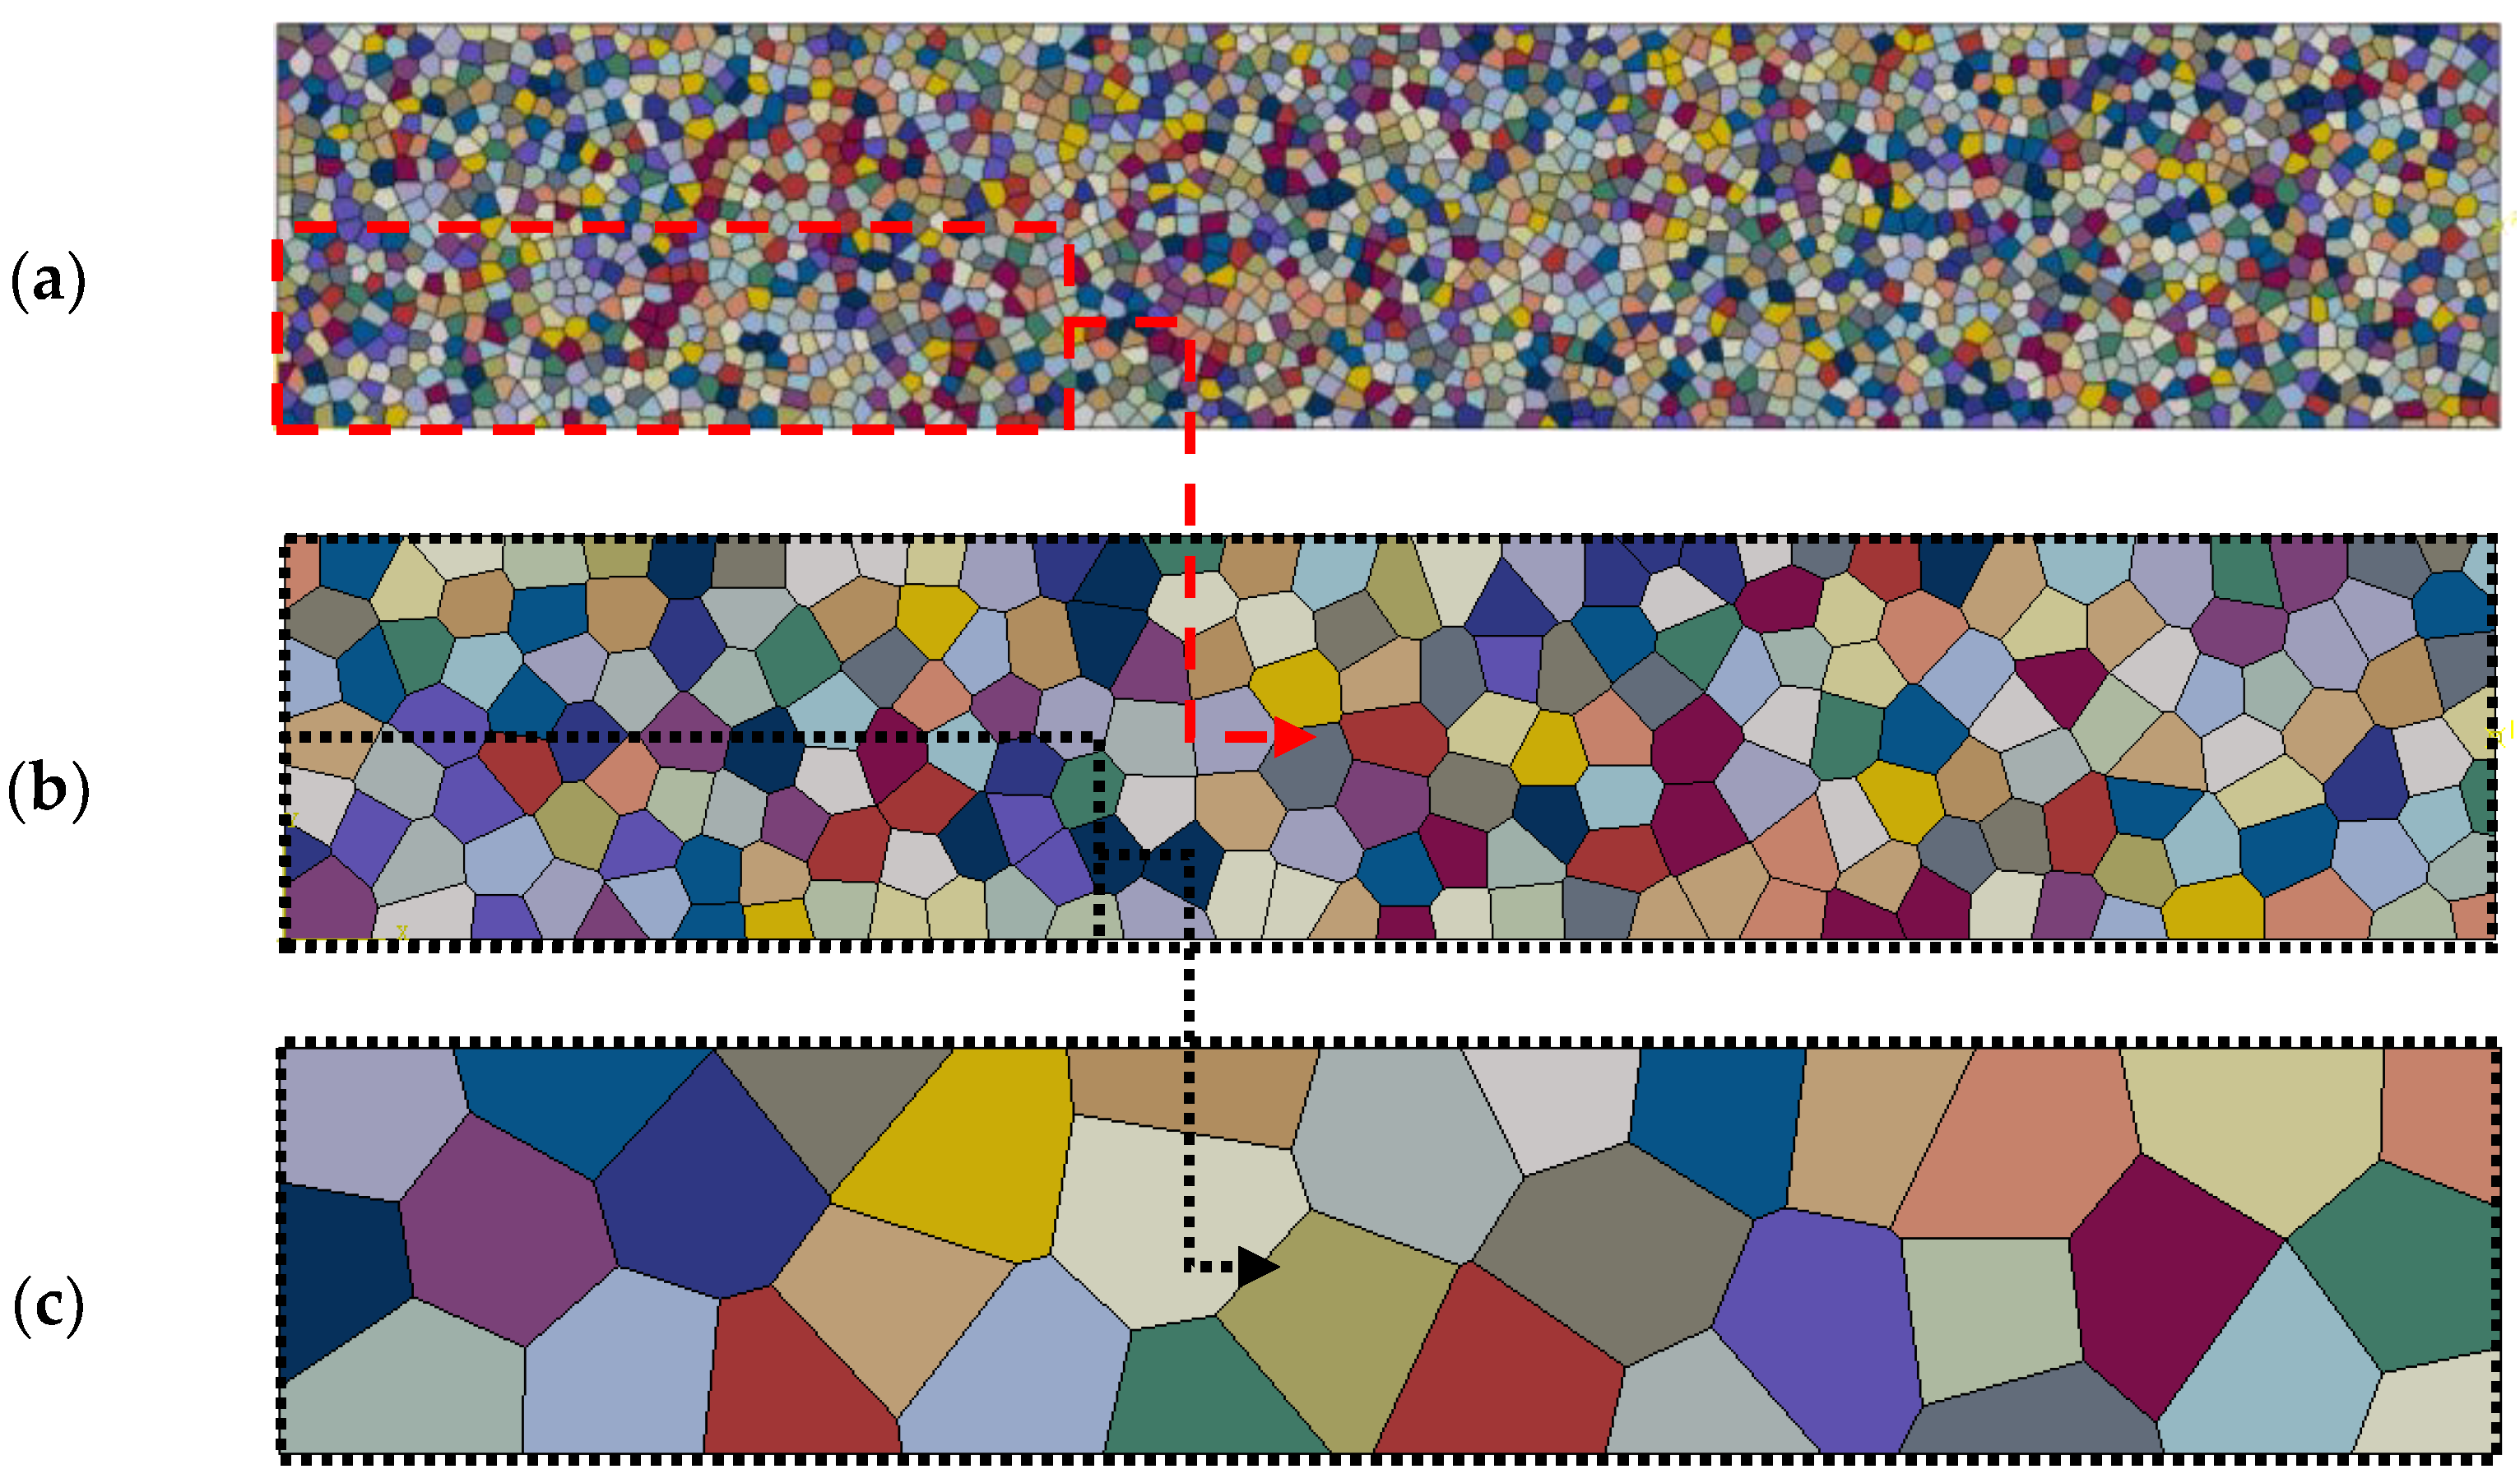
3.2.1. Grain-Scale Modeling Based on Voronoi Tessellation

The effect of the grain size, RVE and melt pool sizes are investigated for T 11 sample. The software VGRAIN [33] was used to specify the grain size, orientation and distribution. With the 2D model, the grain shape and size were studied, while material behavior in uniaxial test was derived from the 3D model considering the real size and shape of particles. The Voronoi-tessellation mathematical model is employed to generate virtual grain structures and their random distributions. Figure 6 shows the systematic process from building a grain structure to building a finite element (FE) model. After generating a 2D grain structure using the aforementioned CP model, grain orientations and material properties are assigned subsequently. The built script is directly imported into a commercially available FE package, ABAQUS.

3.2.2. RVE Size Selection

In order to simulate the mechanical behavior of a polycrystalline material at the grain level scale, a representative volume element (RVE) consisting of a sufficient number of grains is required in order to represent the global material behavior developed for T 11 (Figure 7). In this work, an RVE was developed to have a realistic microstructure of the material rather than the artificially constructed using Voronoi tessellation technique. Based on the material’s microstructure obtained from SEM, coordinates of grain boundaries were determined using VGARIN software. In order to get the actual dimensions of all the grains, SEM image was processed according to the actual scale to obtain the coordinates of all grain boundaries. The developed model herein is based on surface images of the material and thus considers the realistic microstructure only in 2D while neglecting the heterogeneity of the material in the third dimension.

3.2.3. Melt Pool Modeling

The presence of melt pools, besides the grains and grain boundaries, increases the microstructural complexities of the DED products, which consequently complicates connecting the microstructural features to the macroscopic mechanical response of the manufactured DED materials. First, the explicit microstructural representation (morphology and crystallographic orientations of grains) of an SS 316L component was generated in a finite element model (FEM). Then, the overlapped cylinders containing several grains and grain boundaries were implemented into the model to simulate melt pools morphology in physically-based CP constitutive model (Figure 8).

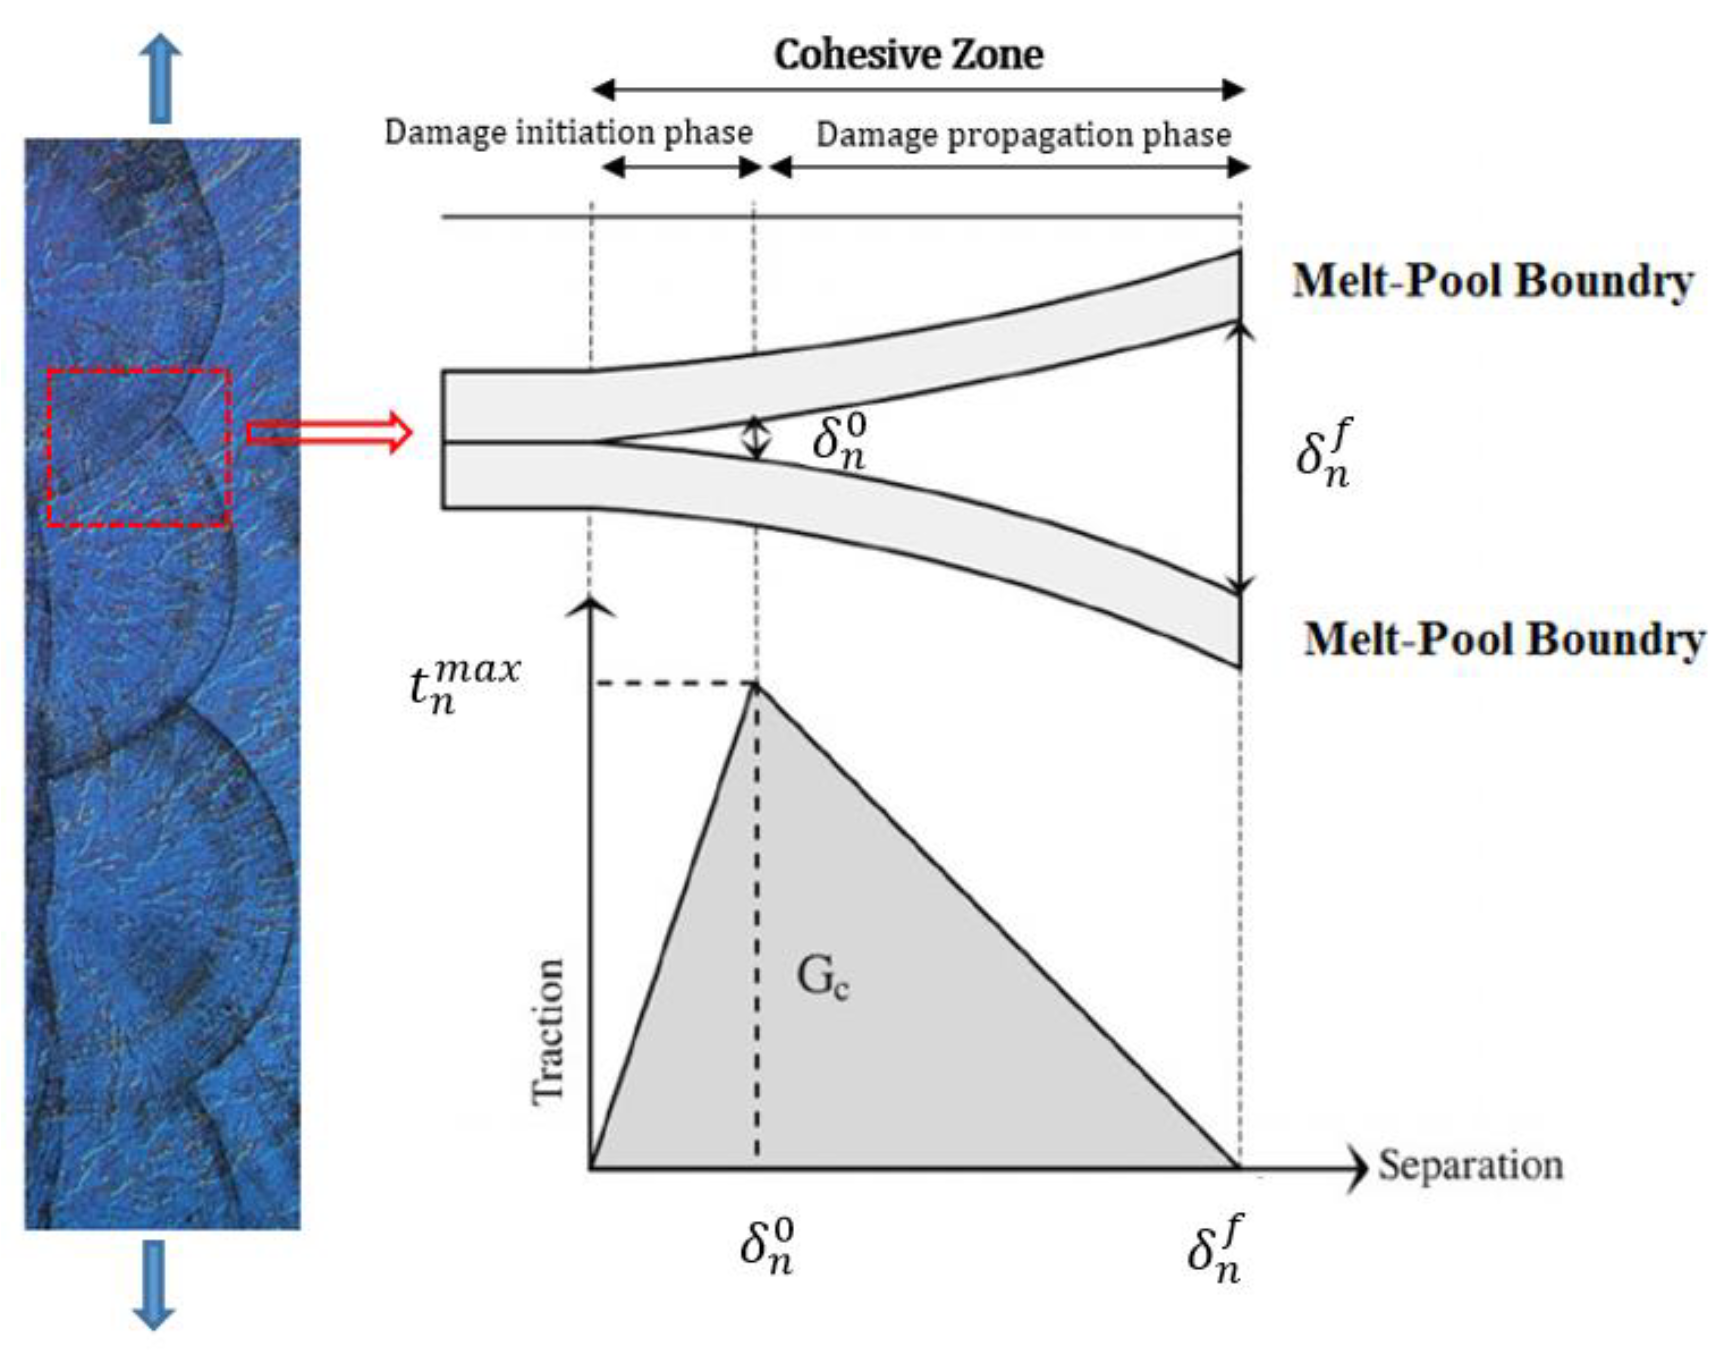
3.2.4. Cohesive Zone Modeling (CZM) for Melt Pool Boundaries

To investigate the damage and the interface interaction definition at the melt pool boundaries, CZM is used in this study. Cohesive traction-separation law is characterized by a relation between a cohesive traction vector and displacement separation vector acting across the cohesive surfaces. In other words, CZM is a continuous incident in which separation starts across an extended crack or cohesive zone that is limited by cohesive tractions. The crack path is defined by cohesive surfaces, by which herein they are considered at the pool boundaries. Based on existing literature and previous works by authors on the same material [17,34], porosity and anisotropy could emerge during the layer-by-layer printing process, which may result in imperfections or interlayer bonding weaknesses. In this work, we initially assume perfect grain boundaries. The melt pool boundaries are remarkably weaker than the grain boundaries and damage often initiates and propagates at these boundaries [35]. The cohesive response of the melt pool boundaries follows a traction–separation law (TSL). The traction between two crack surfaces is described as a function of the crack opening displacement and the relation is usually referred to as a TSL. Different TSLs with different shapes have been developed and proposed by authors. However, one of the most common TSLs is the triangular or bilinear shape as shown in Figure 9. The triangular CZM shape consists of two lines. The first line shows the initial stiffness ( k ) which determines the region where the damage is zero within the studied boundary. The relation between the cohesive traction and separation can be expressed by Equation (7):
{ t n t s t t } = [ k n n 0 0 0 k s s 0 0 0 k t t ] { δ n δ s δ t }
in which n , s and t indexes represent the normal direction and two orthogonal shear directions respectively. However, by further increase in the separation, the damage initiates. A mode-dependent quadratic stress criterion was applied in this study to determine the damage initiation condition. Based on this model, damage starts when the quadratic interaction function given in Equation (8) reaches the value of 1:
{ t n t n 0 } 2 + { t s t s 0 } 2 + { t t t t 0 } 2 = 1
By increasing the separation at the pool boundary, the damage evolution phase starts once the property degradation of the interface commences. Damage evolution law follows the degradation rate of the cohesive properties subsequent to the initiation of damage. Due to the complexities arising from the mode mixity and the difficulty in reaching the fracture energy of the interface at the pool boundaries, an independent damage evolution criterion was employed, where the total fracture energy of the interface is considered as a failure criterion. The shape of the bilinear CZM can be defined by three main parameters including cohesive strength σ c (a maximum surface traction in which damage initiates), initial stiffness ( k ) and the fracture energy G c   (the area under traction-separation curve).

3.3. Finite Element Implementation

In this study, curve fitting and optimization is based on the macroscopic response of polycrystalline according to the tensile test data from the coupons. A single crystal UMAT code (Huang code [36]) was implemented into the finite element software ABAQUS. The textural orientations were allocated to each grain in order to model the materials in longitudinal direction. The material properties, including the anisotropic elasticity and CP for the SS 316L, are calibrated based on experimental tensile test curves for SS 316L single crystals at selected crystallographic orientations. The calculated single-crystal elastic constants of this steel are C 11 = 284   G P a , C 12 = 140   G P a and C 44 = 107   G P a . The allocated stiffness values for melt pool boundaries include K n n = 200 × 10 6   MPa / mm , K s s = K t t = K n n / 2 ( 1 + ϑ ) = 80 × 10 6   MPa / mm   ( K   > >   E / L ) . where E is Young’s modulus of the material and L is the dimension of the specimen (herein along the longitudinal direction of the gauge length). The degradation process begins when the contact stresses and/or contact separations can satisfy certain damage initiation criteria. In this study, the traction value is considered as t n 0 = ( 1 ~ 4 ) σ y = 580   M P a , while the corresponding separations at the interface are denoted by δ n 0 = δ s 0 = δ t 0 . The parameter of the mode I fracture toughness is equal to K I C = 71   MPa and G = K I C 2 ( 1 ϑ 2 ) / E [37]. For damage evolution, the fracture energy of G   ~   23.89   N / mm with linear softening is used, which is equal to the area of traction–separation graph presented in Figure 9 [38]. FE discretization of the model is carried out using linear solid triangle (CPE3) elements. As is shown in Figure 10, the left edge of the structure is fixed along the x direction and the bottom left edge node is constrained along y direction. Displacement is applied at a middle point on the right face of the model along the x direction according to the experimental procedure.

4. Result and Discussion

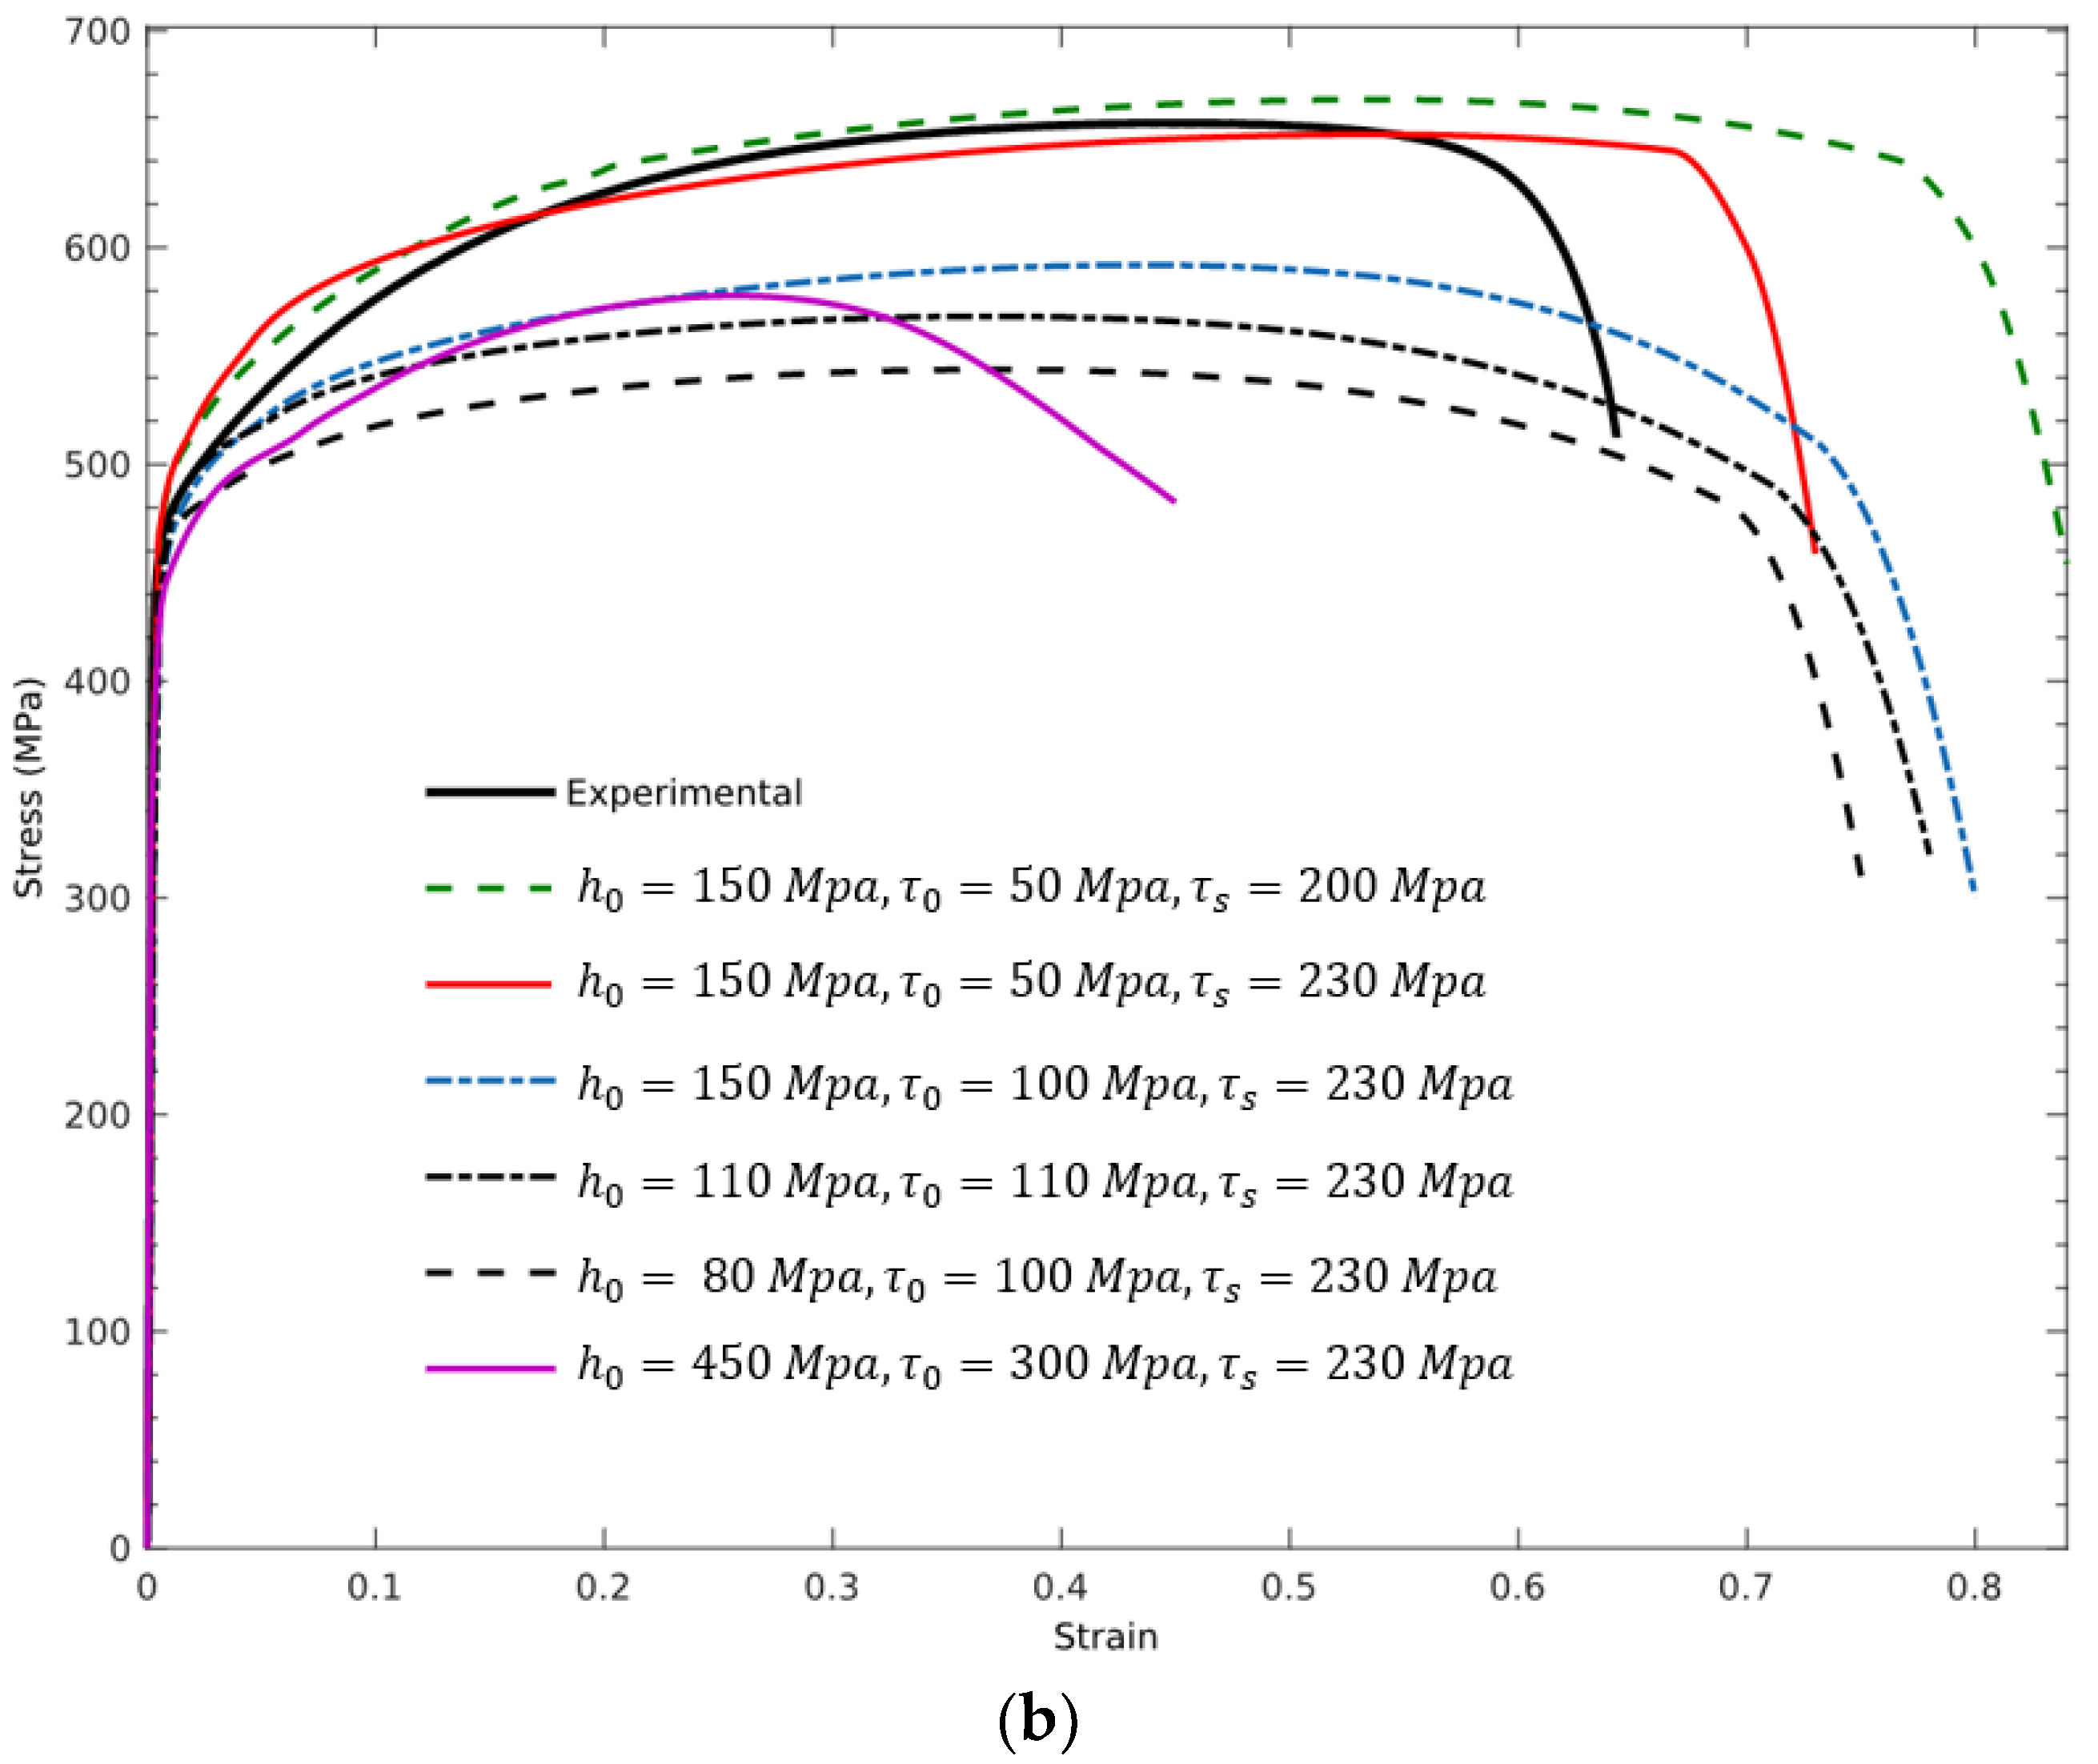
4.1. Calibration of the CP Coefficients

Sensitivity analyses need to be carried out to calibrate coefficients including the initial hardening modulus ( h 0 ), stage-I stress ( τ s ) and initial shear stress ( τ 0 ). By using a single crystal material SS 316 L with FCC structure [39], a good agreement can be found between experimental and numerical curves obtained based on two sets of input parameters, as is illustrated in Figure 11a. By running several tests according to Figure 11b, and taking into the account that the RVE model containing 199 grains has a lower initial shear stress compared to the single crystal, the value of τ 0 = 50   M P a produced the closest match to the experimental stress strain graphs and can be used henceforth. The influence of the parameter h 0 on the calculated tensile curves determines the inclination and the curvature of the graph in the plastic region. Higher values of this parameter result in steeper curves; however, changing this value has little effect on the position of the maximum applied force and the value of 150   M P a is selected for this material behavior. Reference stress τ s defines the onset of the large plastic deformation and its variation affects the length of the linear part of the curve beyond the yield point. Table 1 shows the calibrated hardening values based on the Bassani–Wu hardening rule using the present CP model.

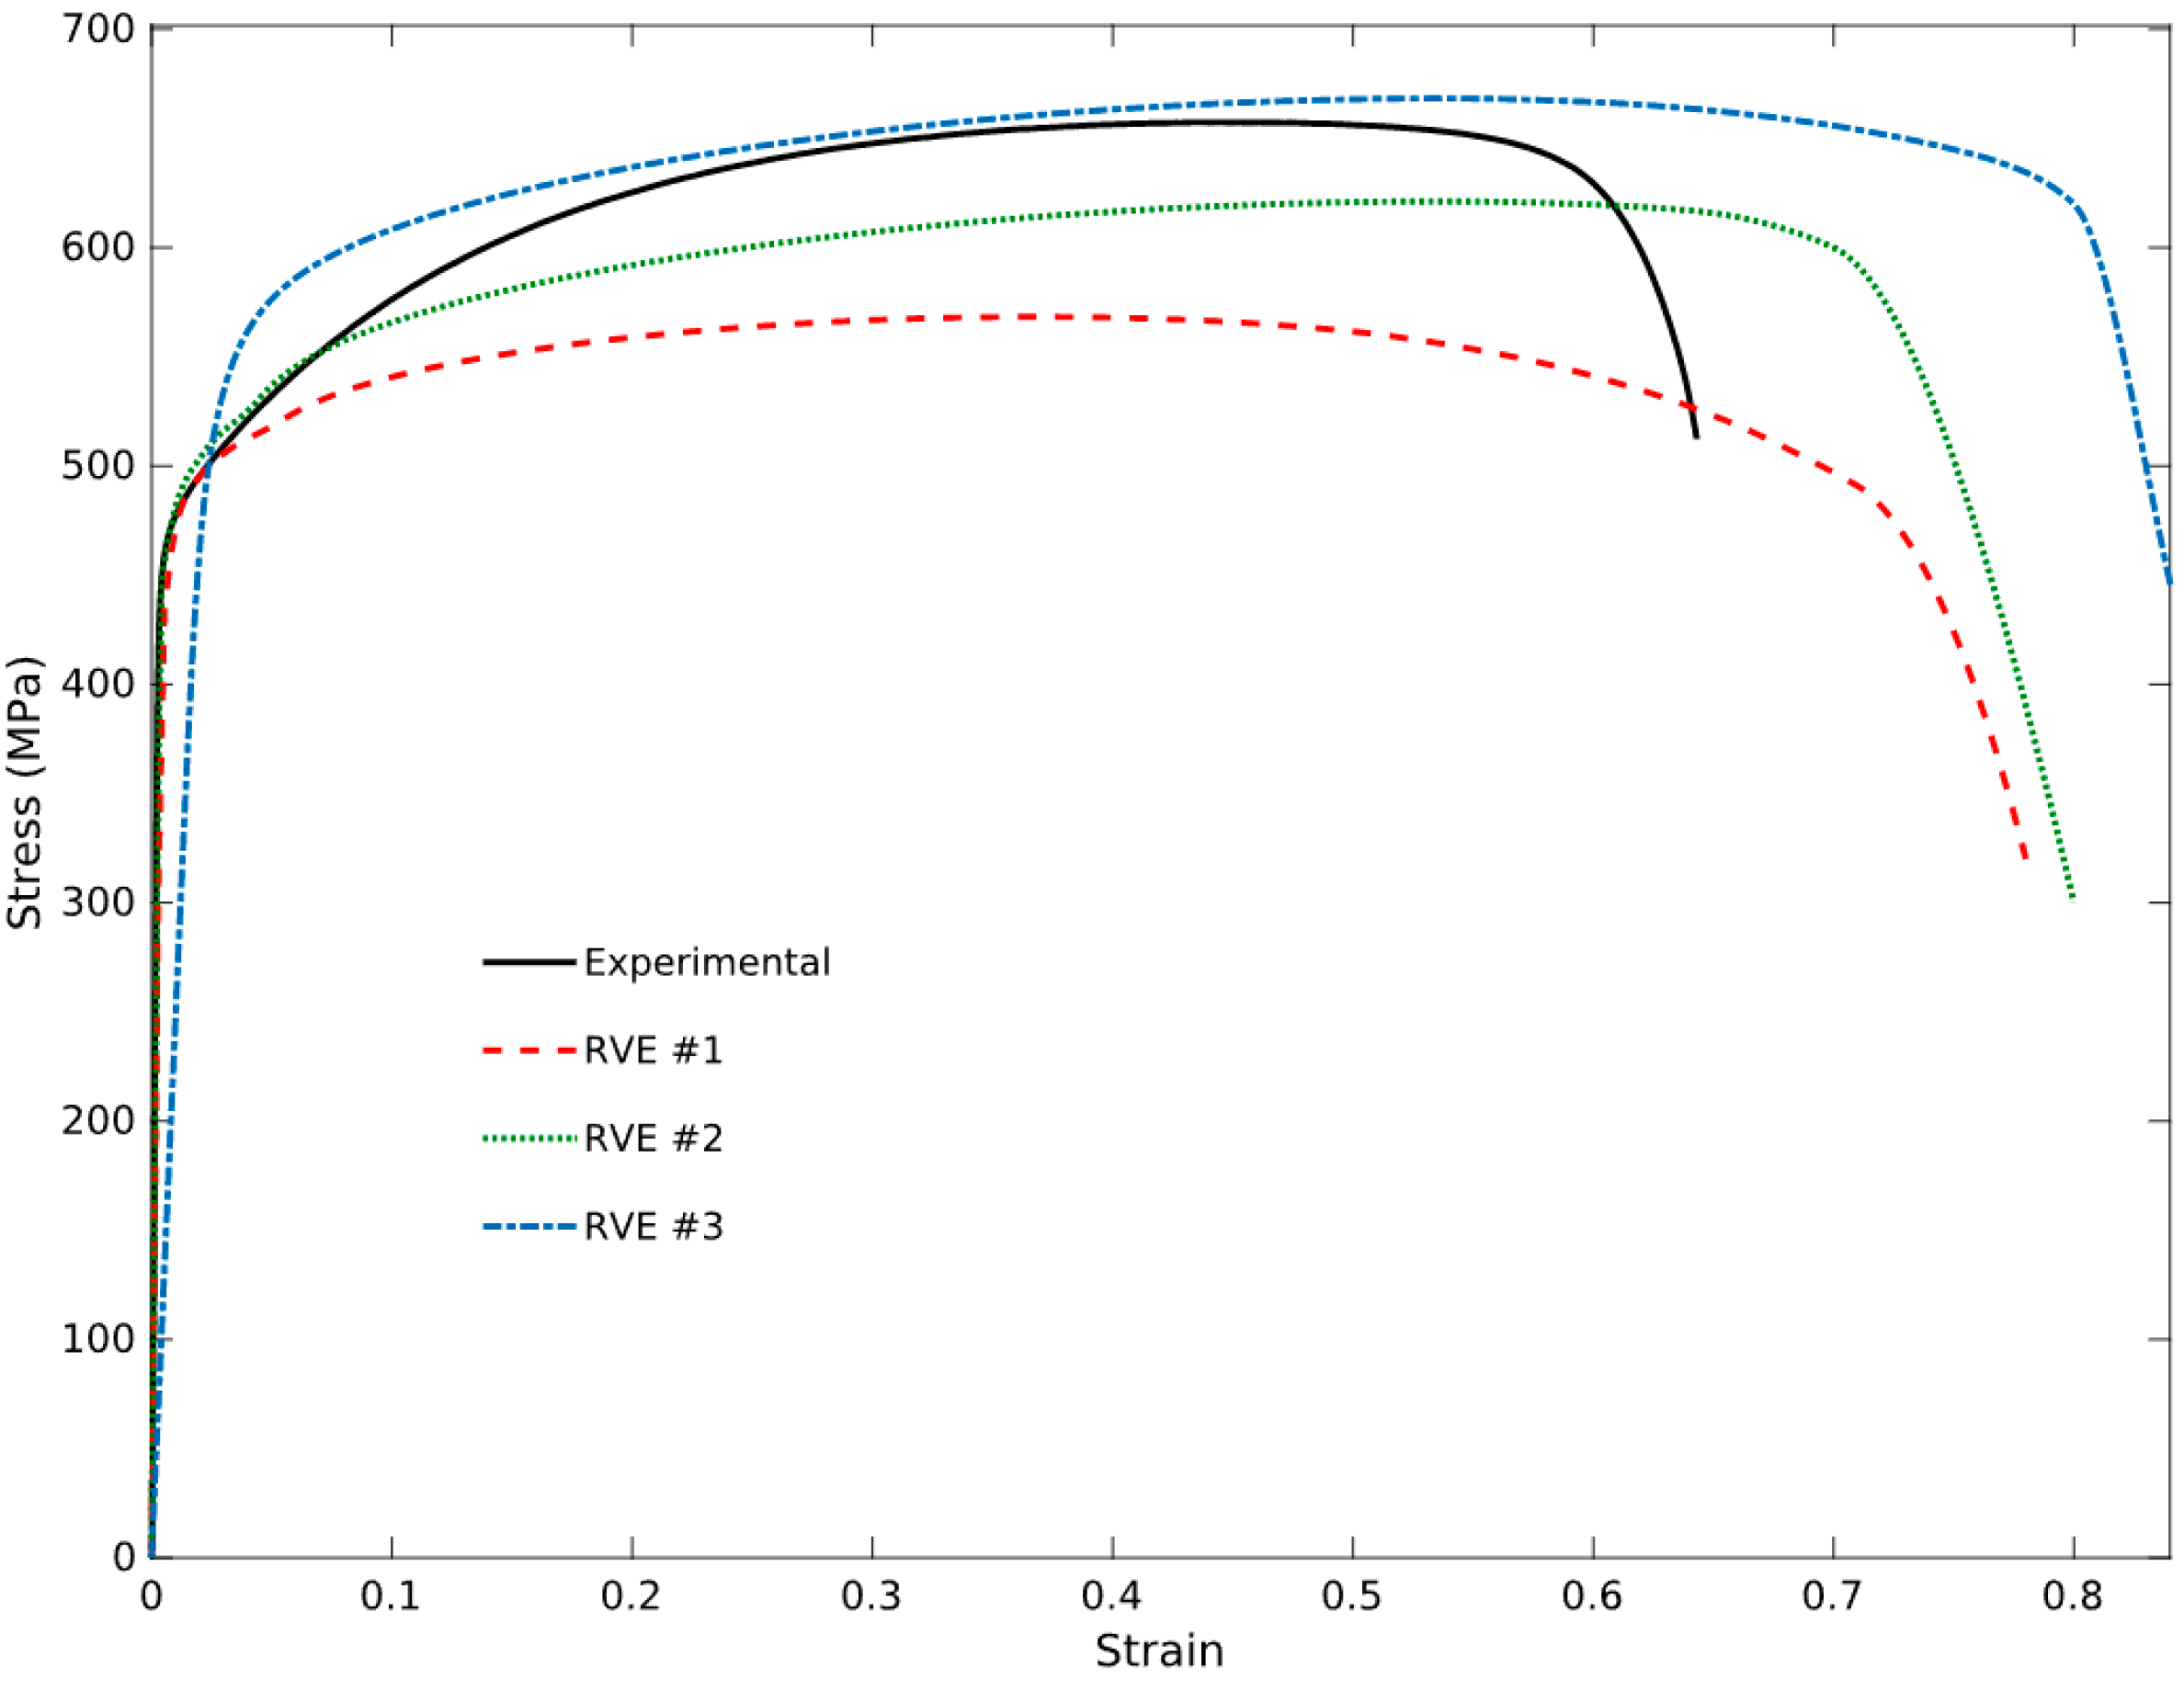
4.2. RVE Size Influence

The mechanical properties depend on the seeding and tessellation approaches described in section grain creation. To avoid the conventional 2D modeling which leads to high computational cost, a suitable size of RVE can help us to understand the precise prediction of the mechanical response of DED metallic components. This size, even though it can impose higher computational costs, needs to be chosen sufficiently large to contain a desirable number of grains and melt pools. Figure 12 demonstrates the remarkable effect of the choice of RVE sizes from Figure 7 on the stress-strain graphs:

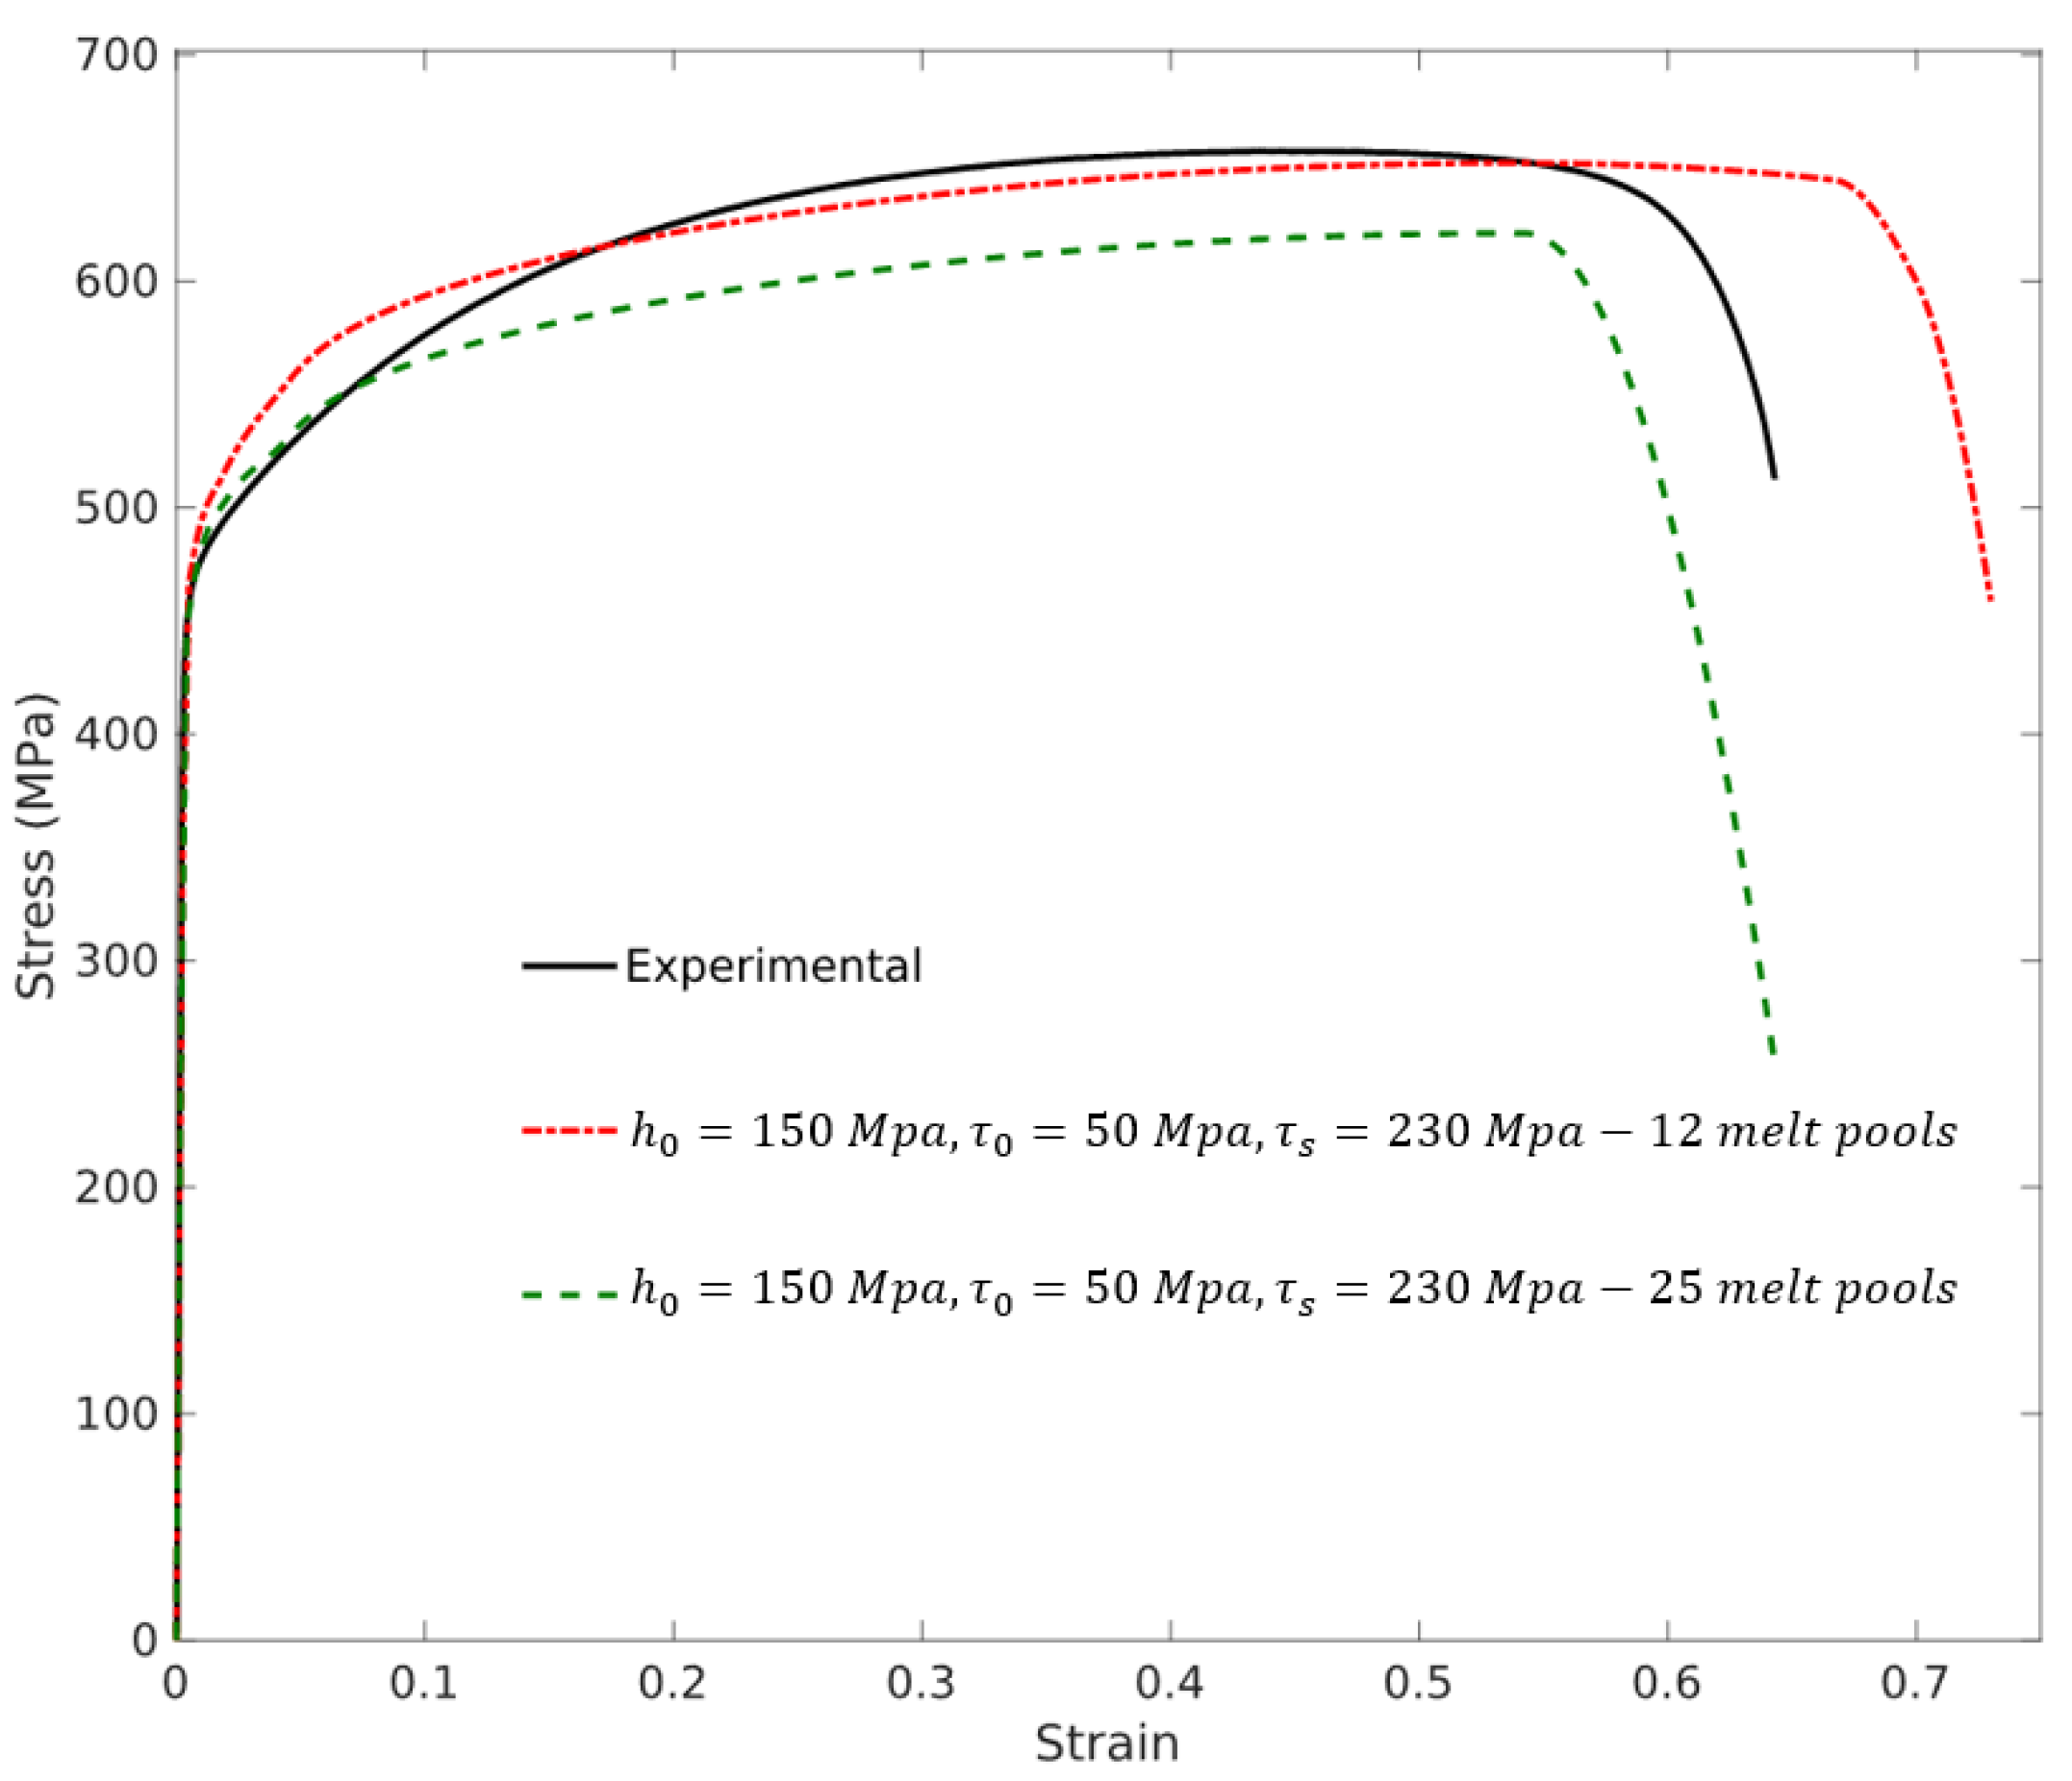
4.3. Effect of The Melt Pool

The variation of melt pool dimensions, with respect to the energy density factor, has been investigated in numerous studies. Energy density is widely used as a metric when designing processing parameters for additive manufacturing or expressing properties of additively manufactured materials, which can be defined as laser power,   P , over the product of laser scan speed,   v , and the hatch space,   h , and layer thickness t , i.e., E D = P / ( v h t ) , with unit of J / m 3 [40]. The same group of authors proved in another numerical study that increasing the scanning speed leads to a smaller melt pool, while increasing laser power induces the bigger melt pool [26]. Thus, by increasing the energy density, the size of the melt pool expands where this process commonly leads to parts with enhanced material properties. Moreover, the melt pool boundaries binding increases by reduction of the scanning speed and increasing the laser power. Figure 13 reveals the effect of the number of the melt pool on the textured fabrication. For this purpose, a specific RVE with different numbers of melt pool are chosen to see their influence on the material properties.

4.4. Effect of Damage Evolution on Melt Pool
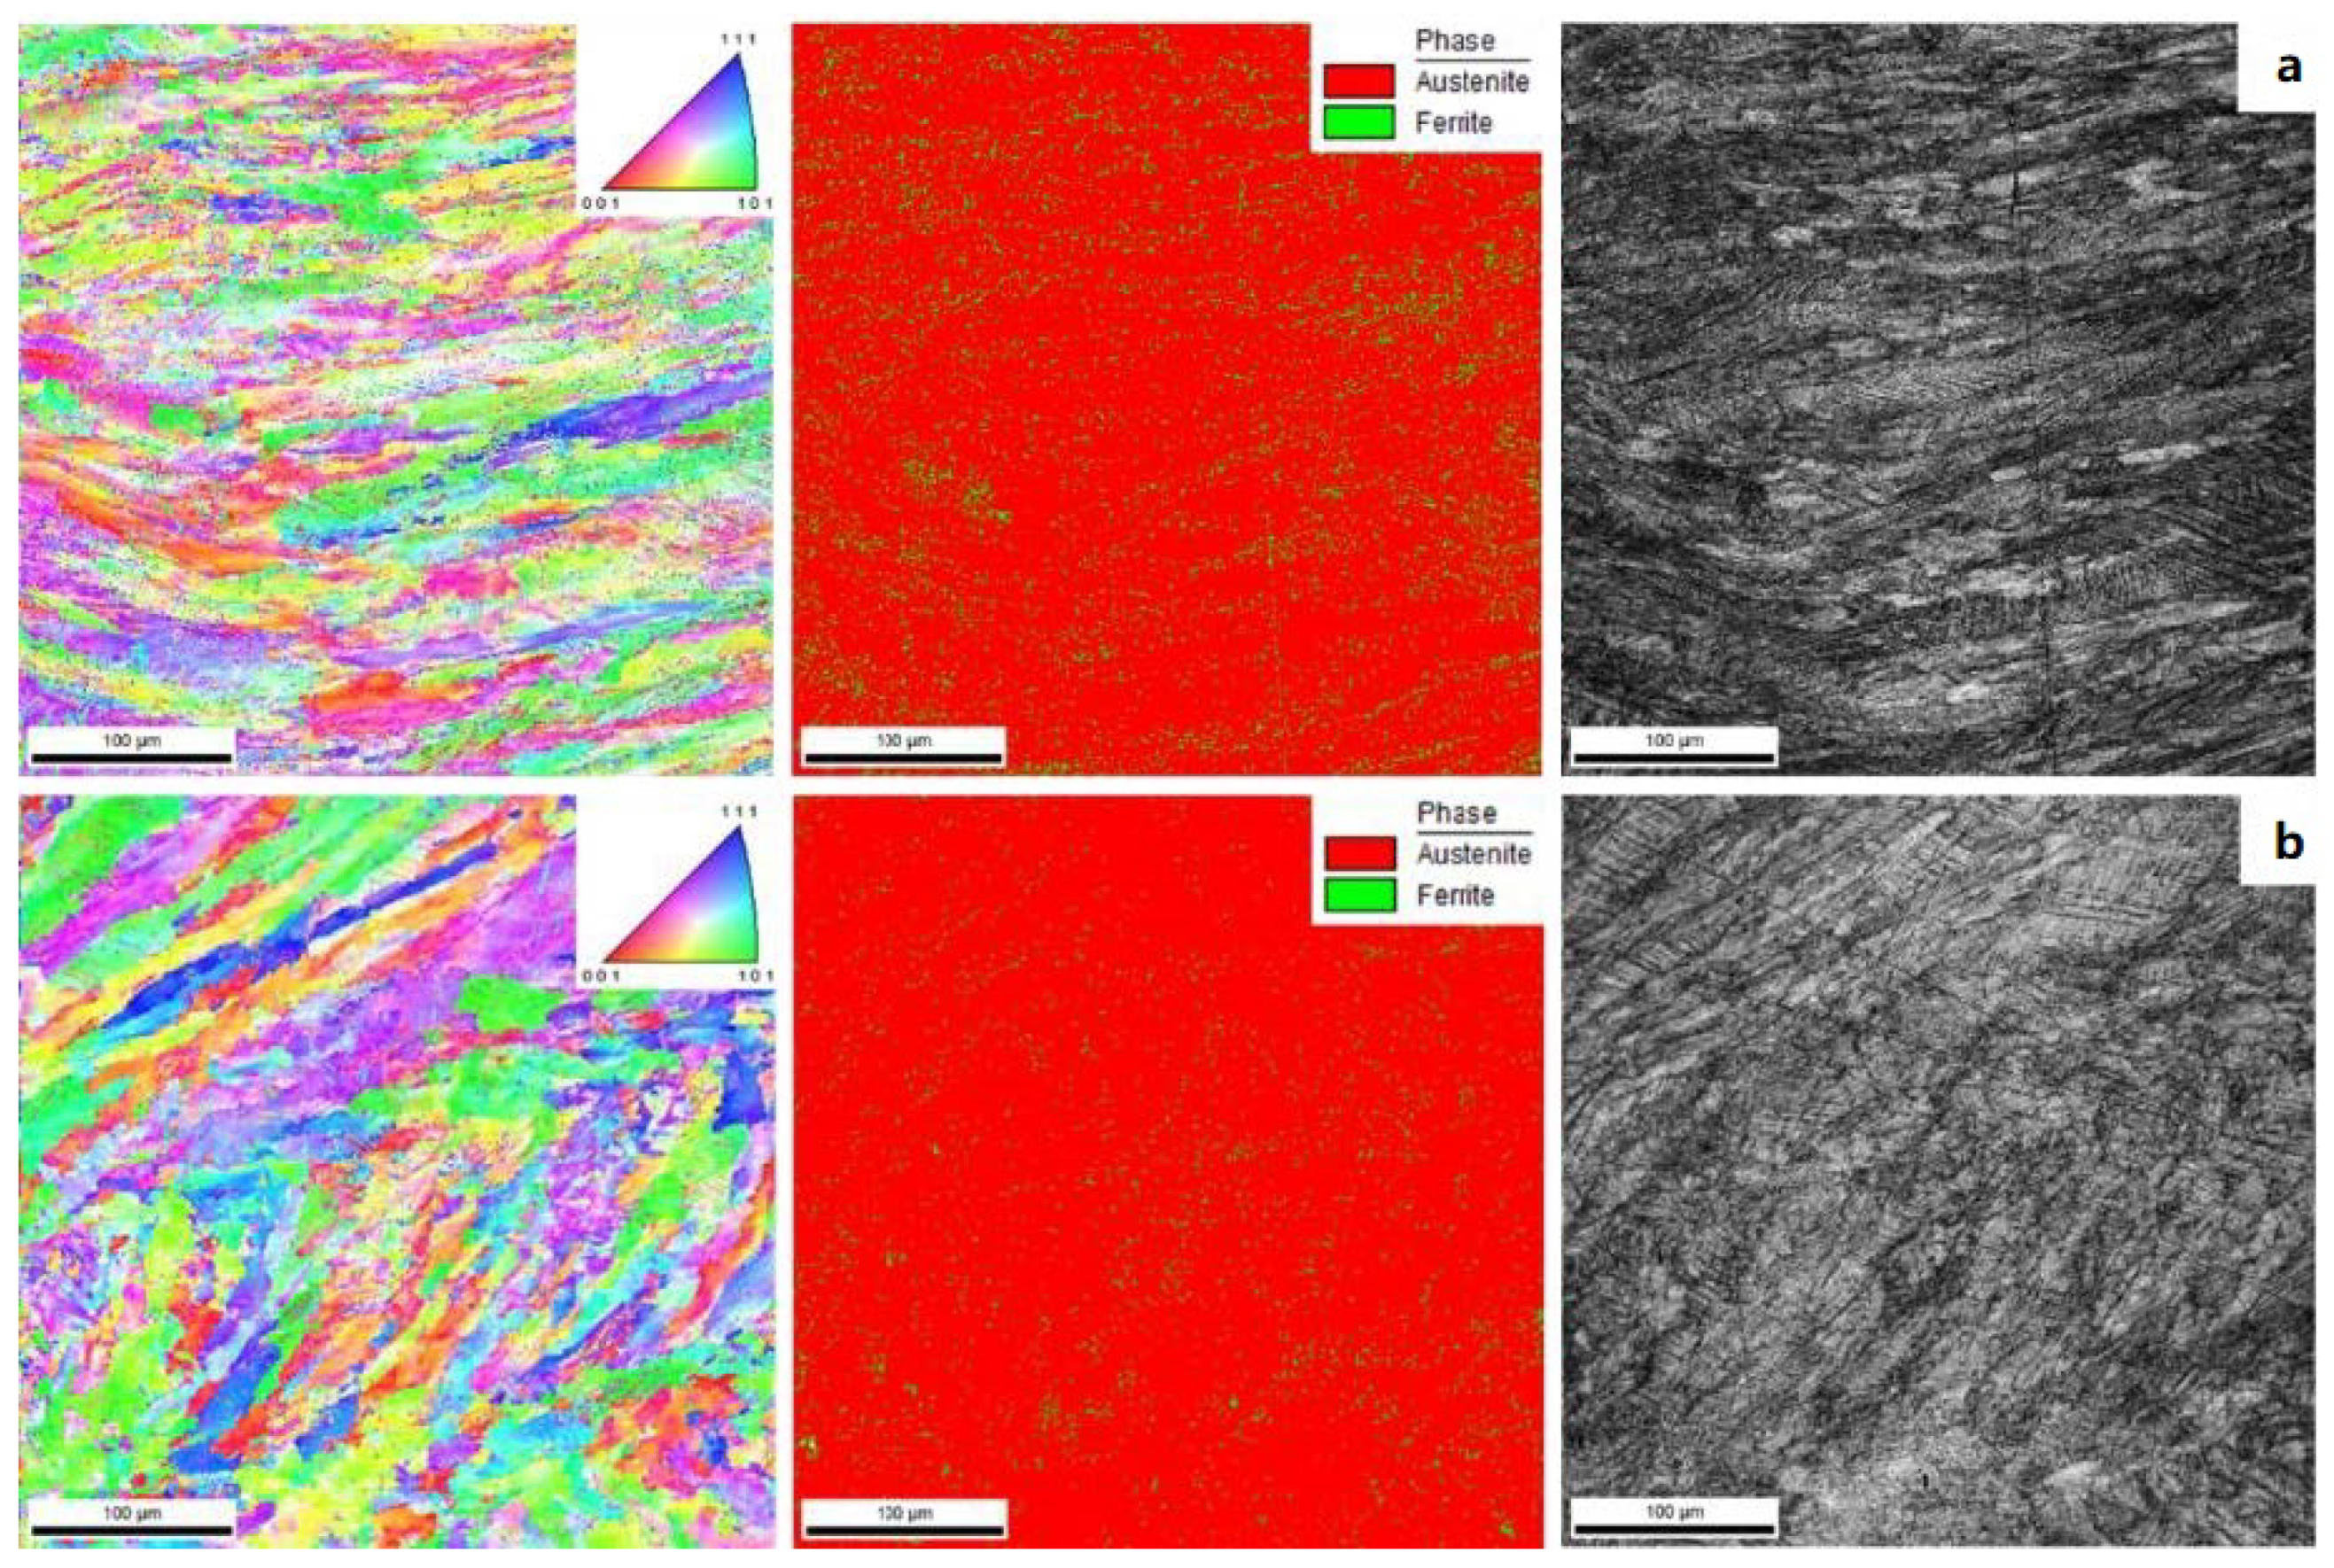
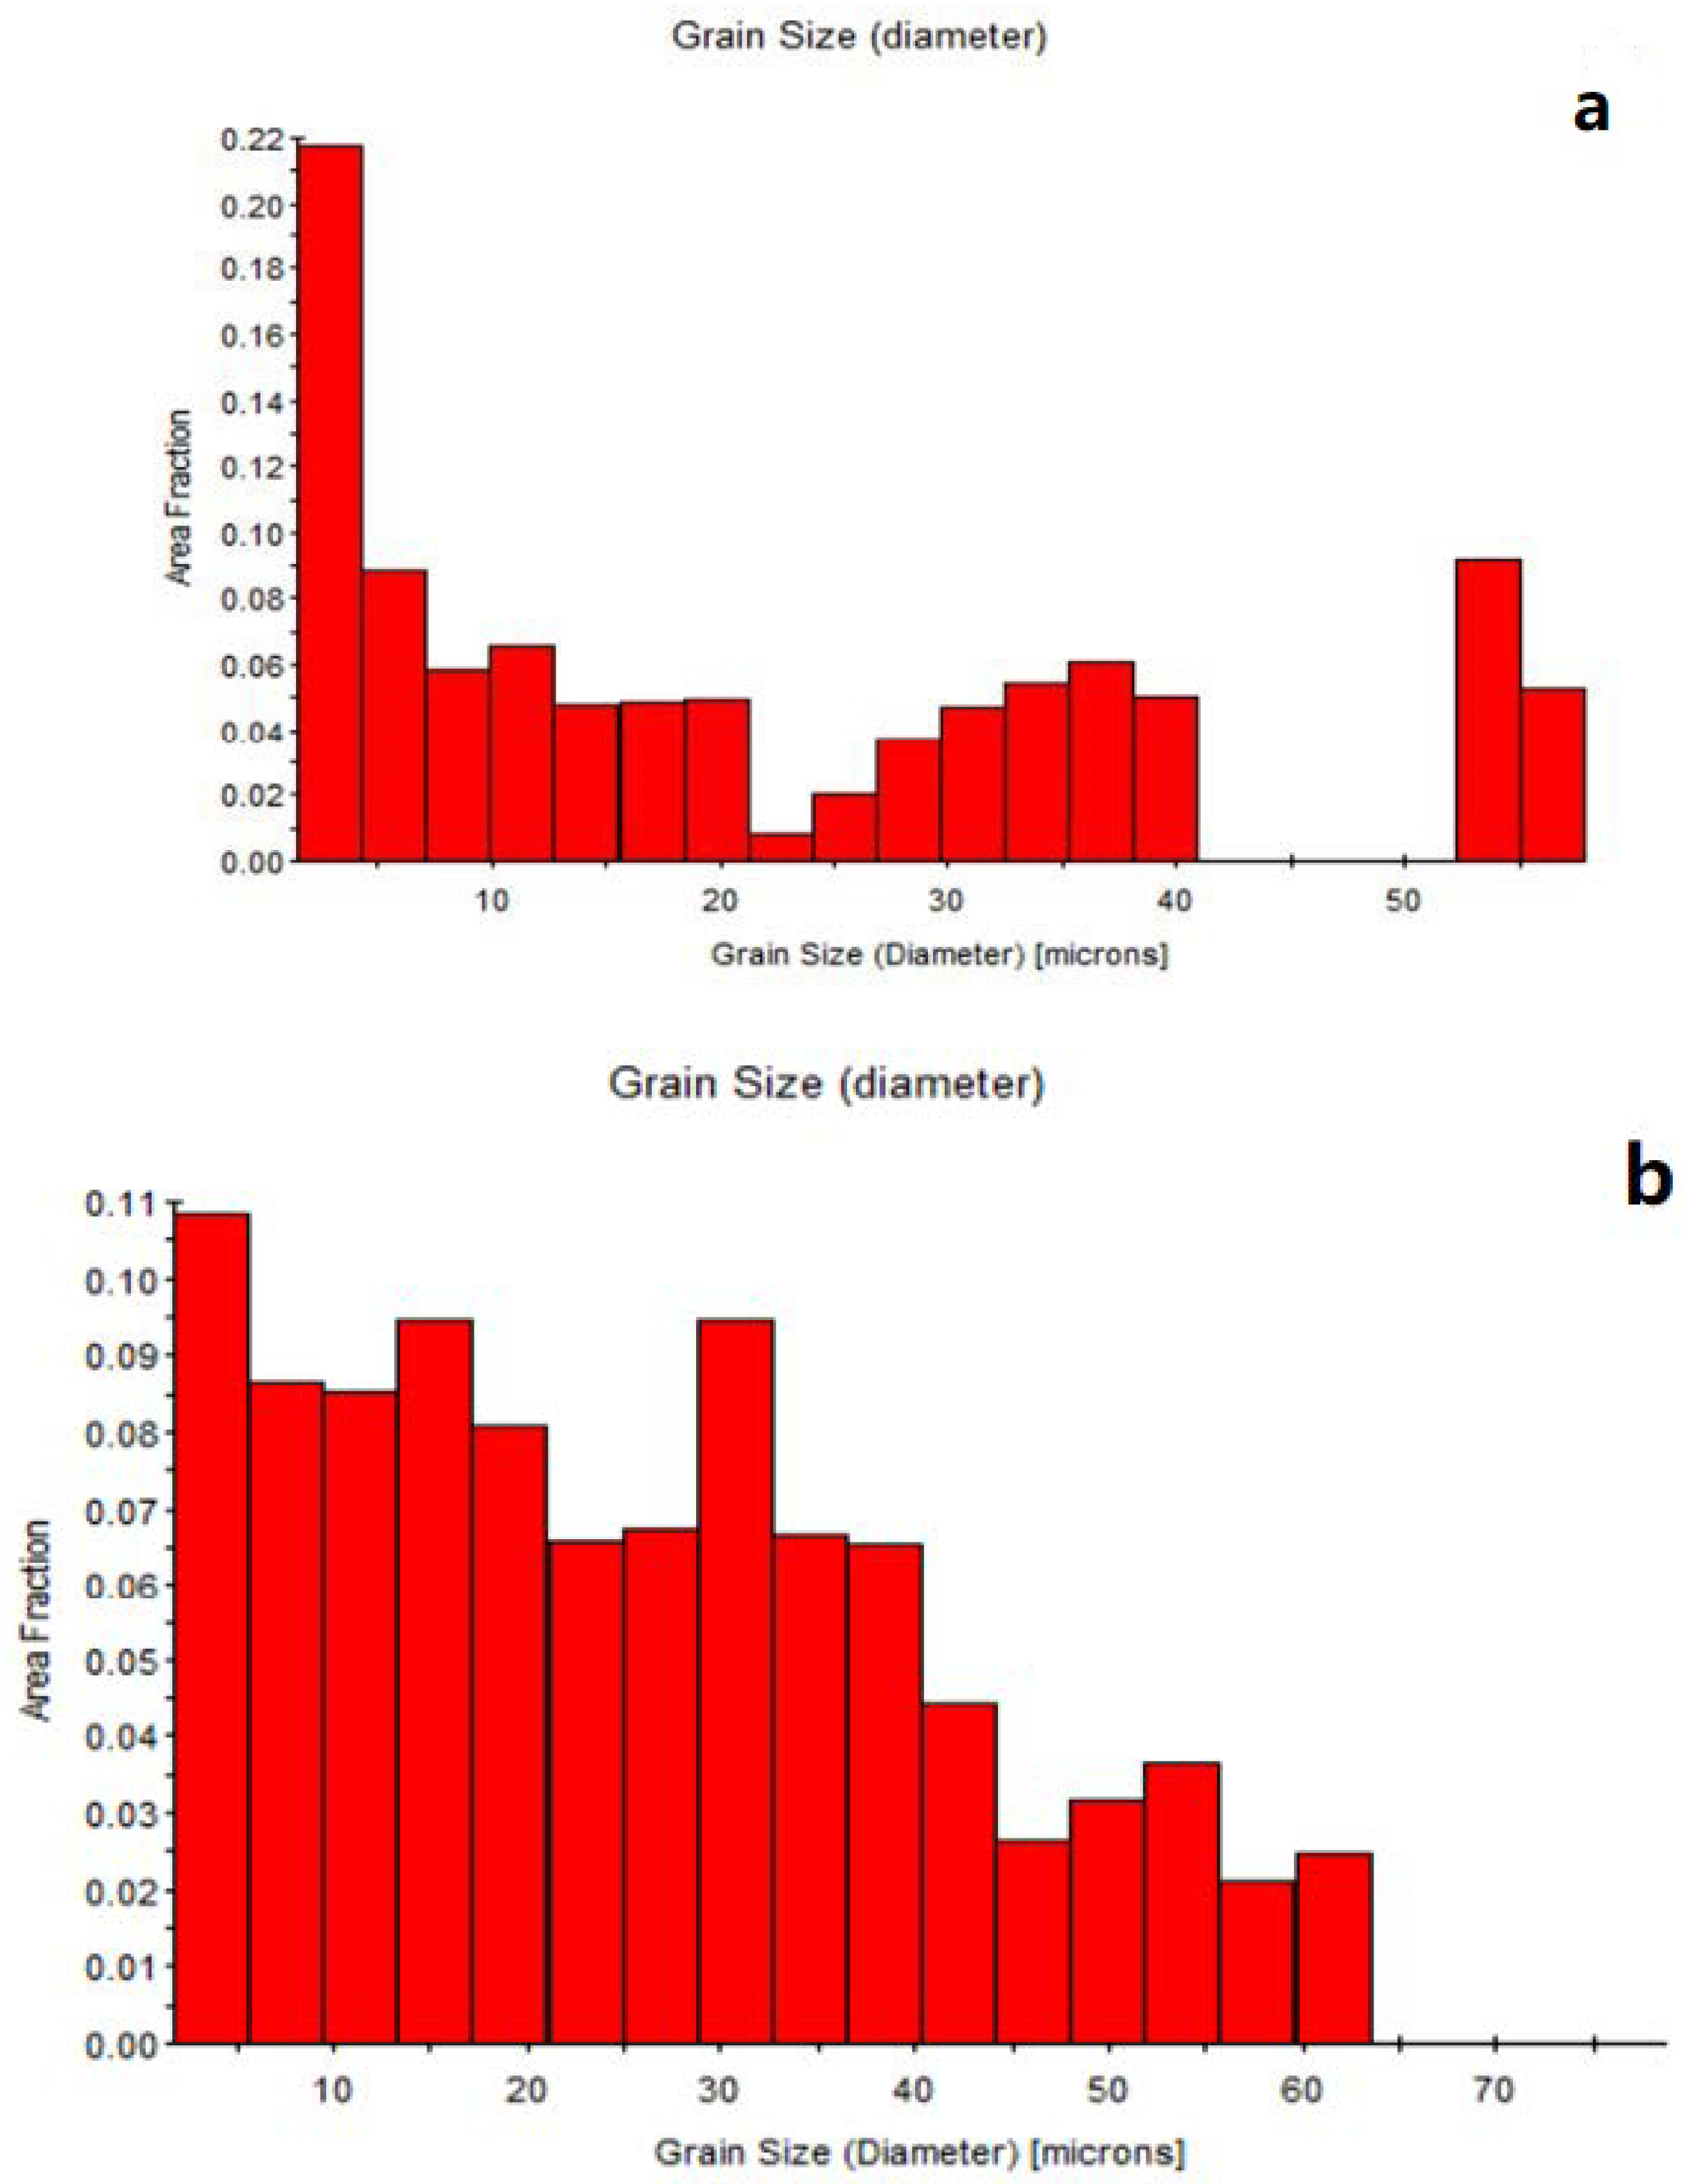
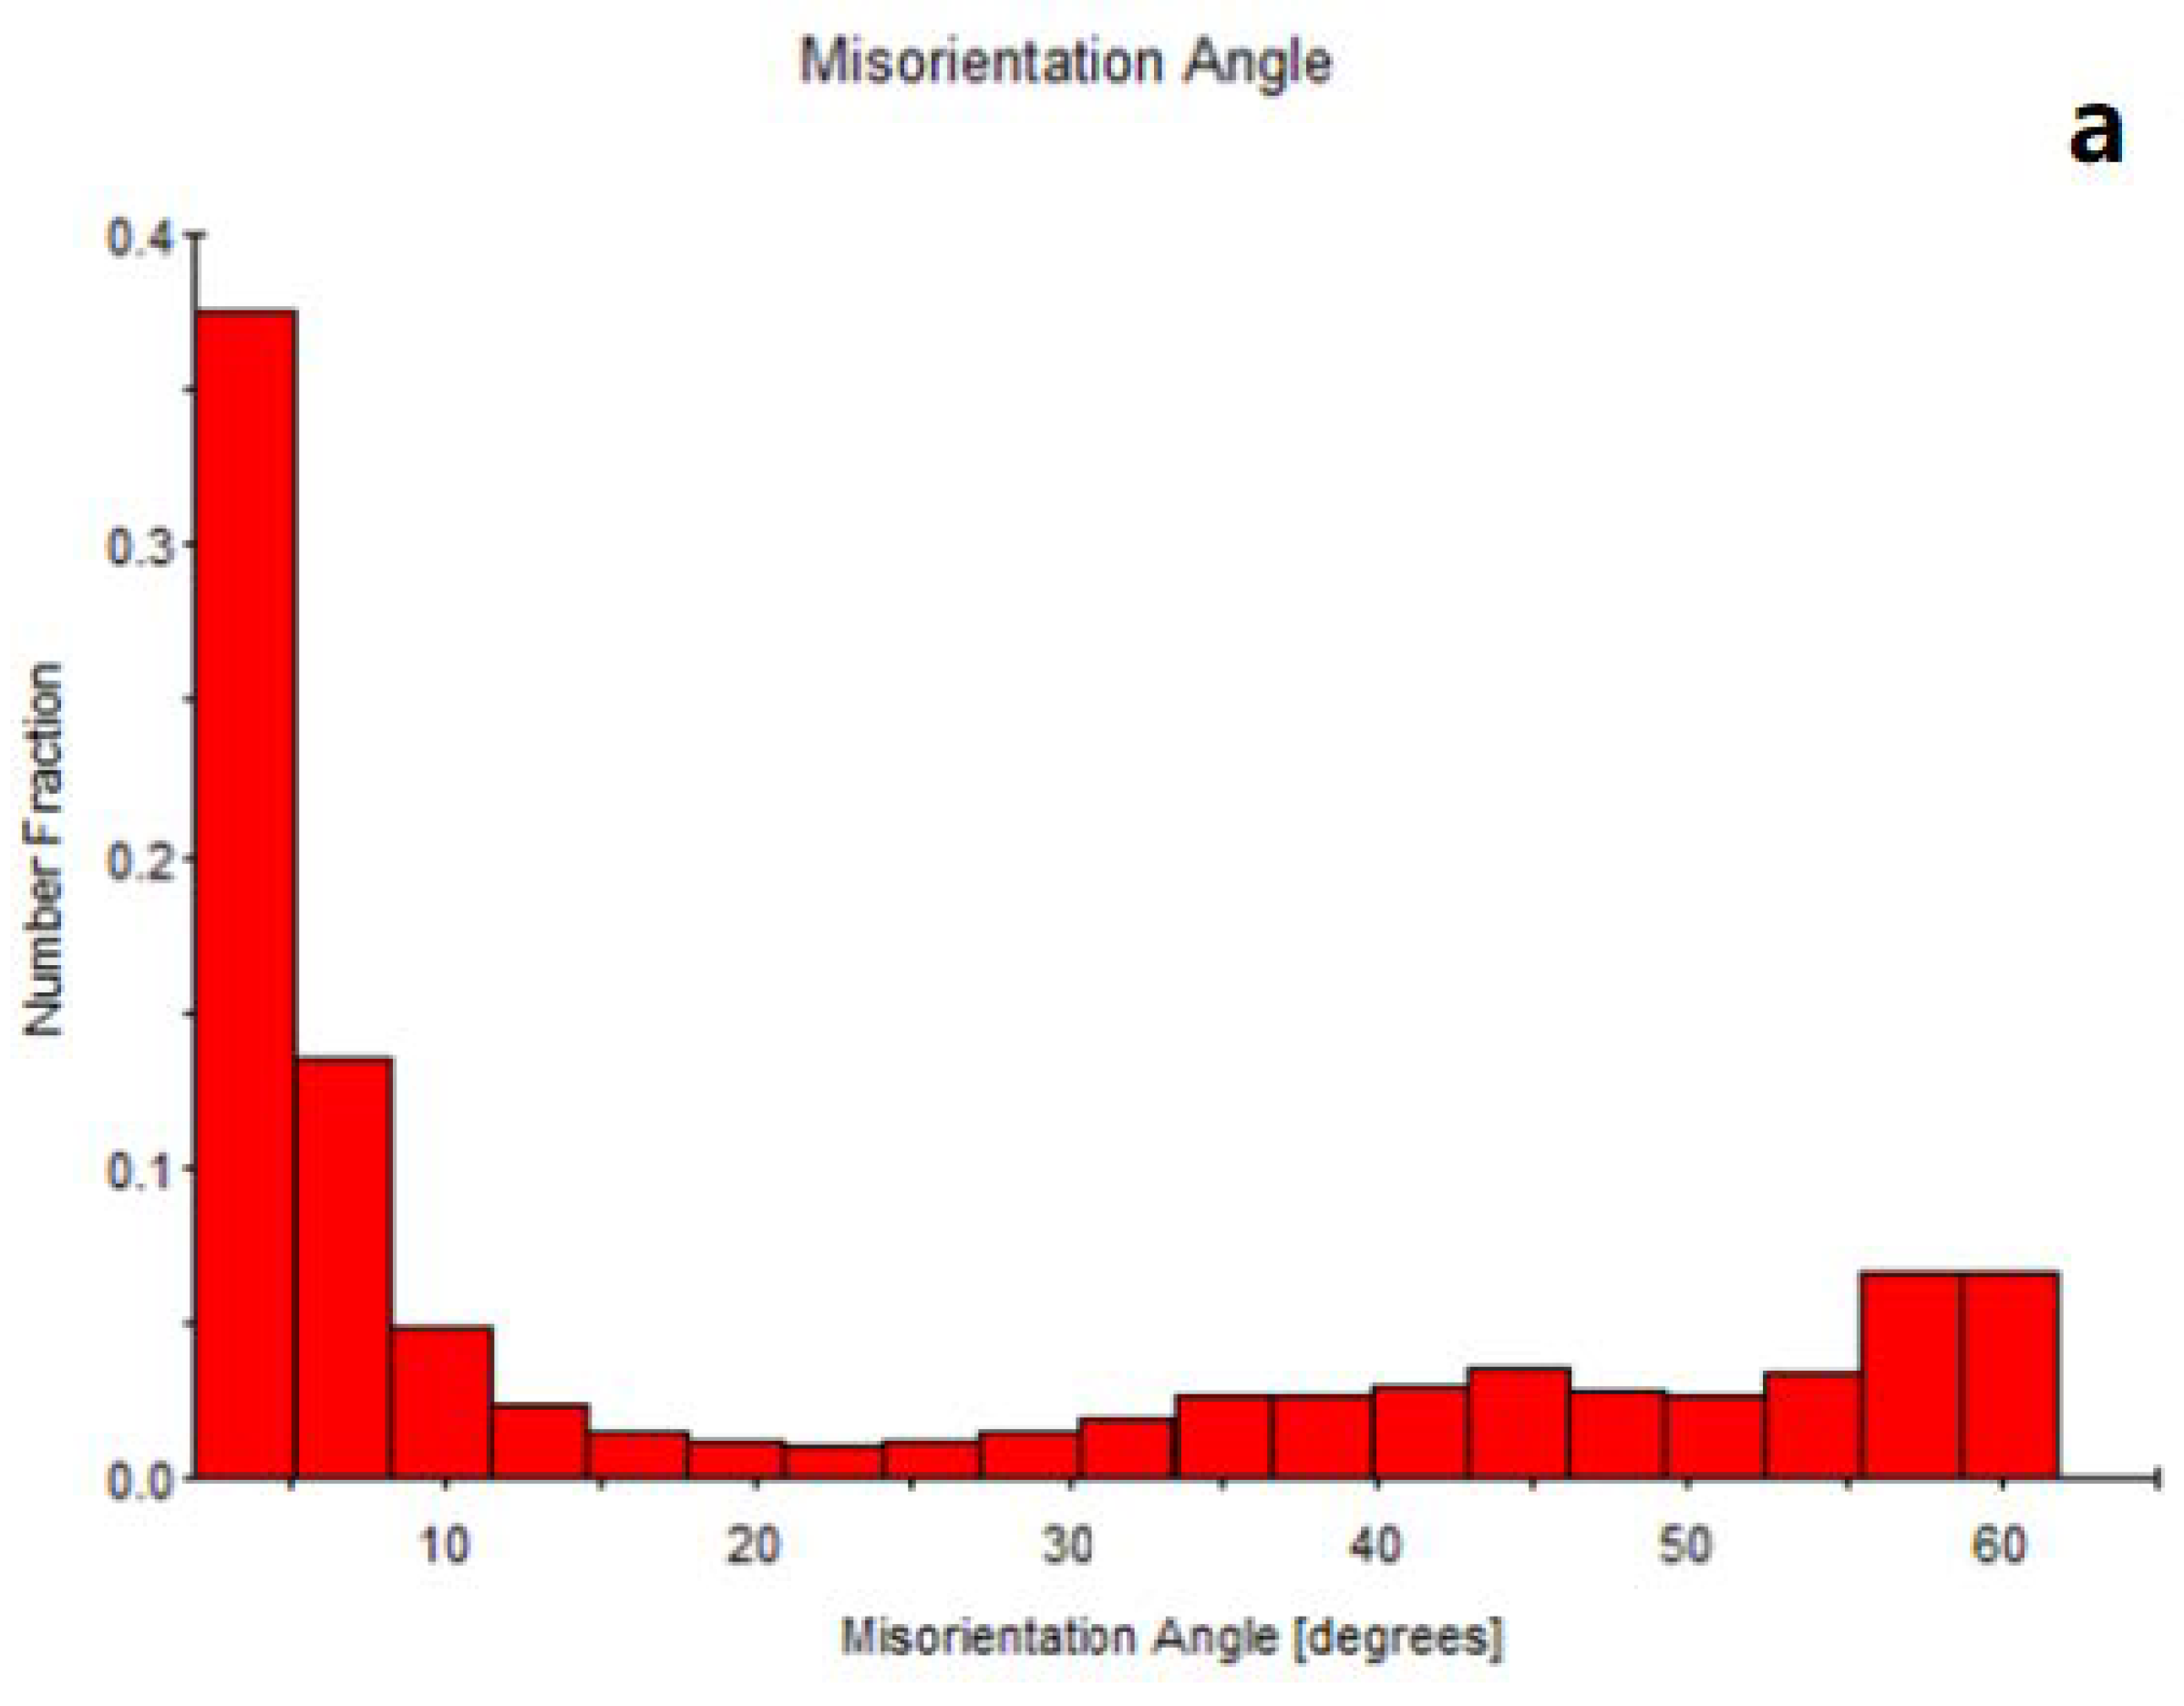
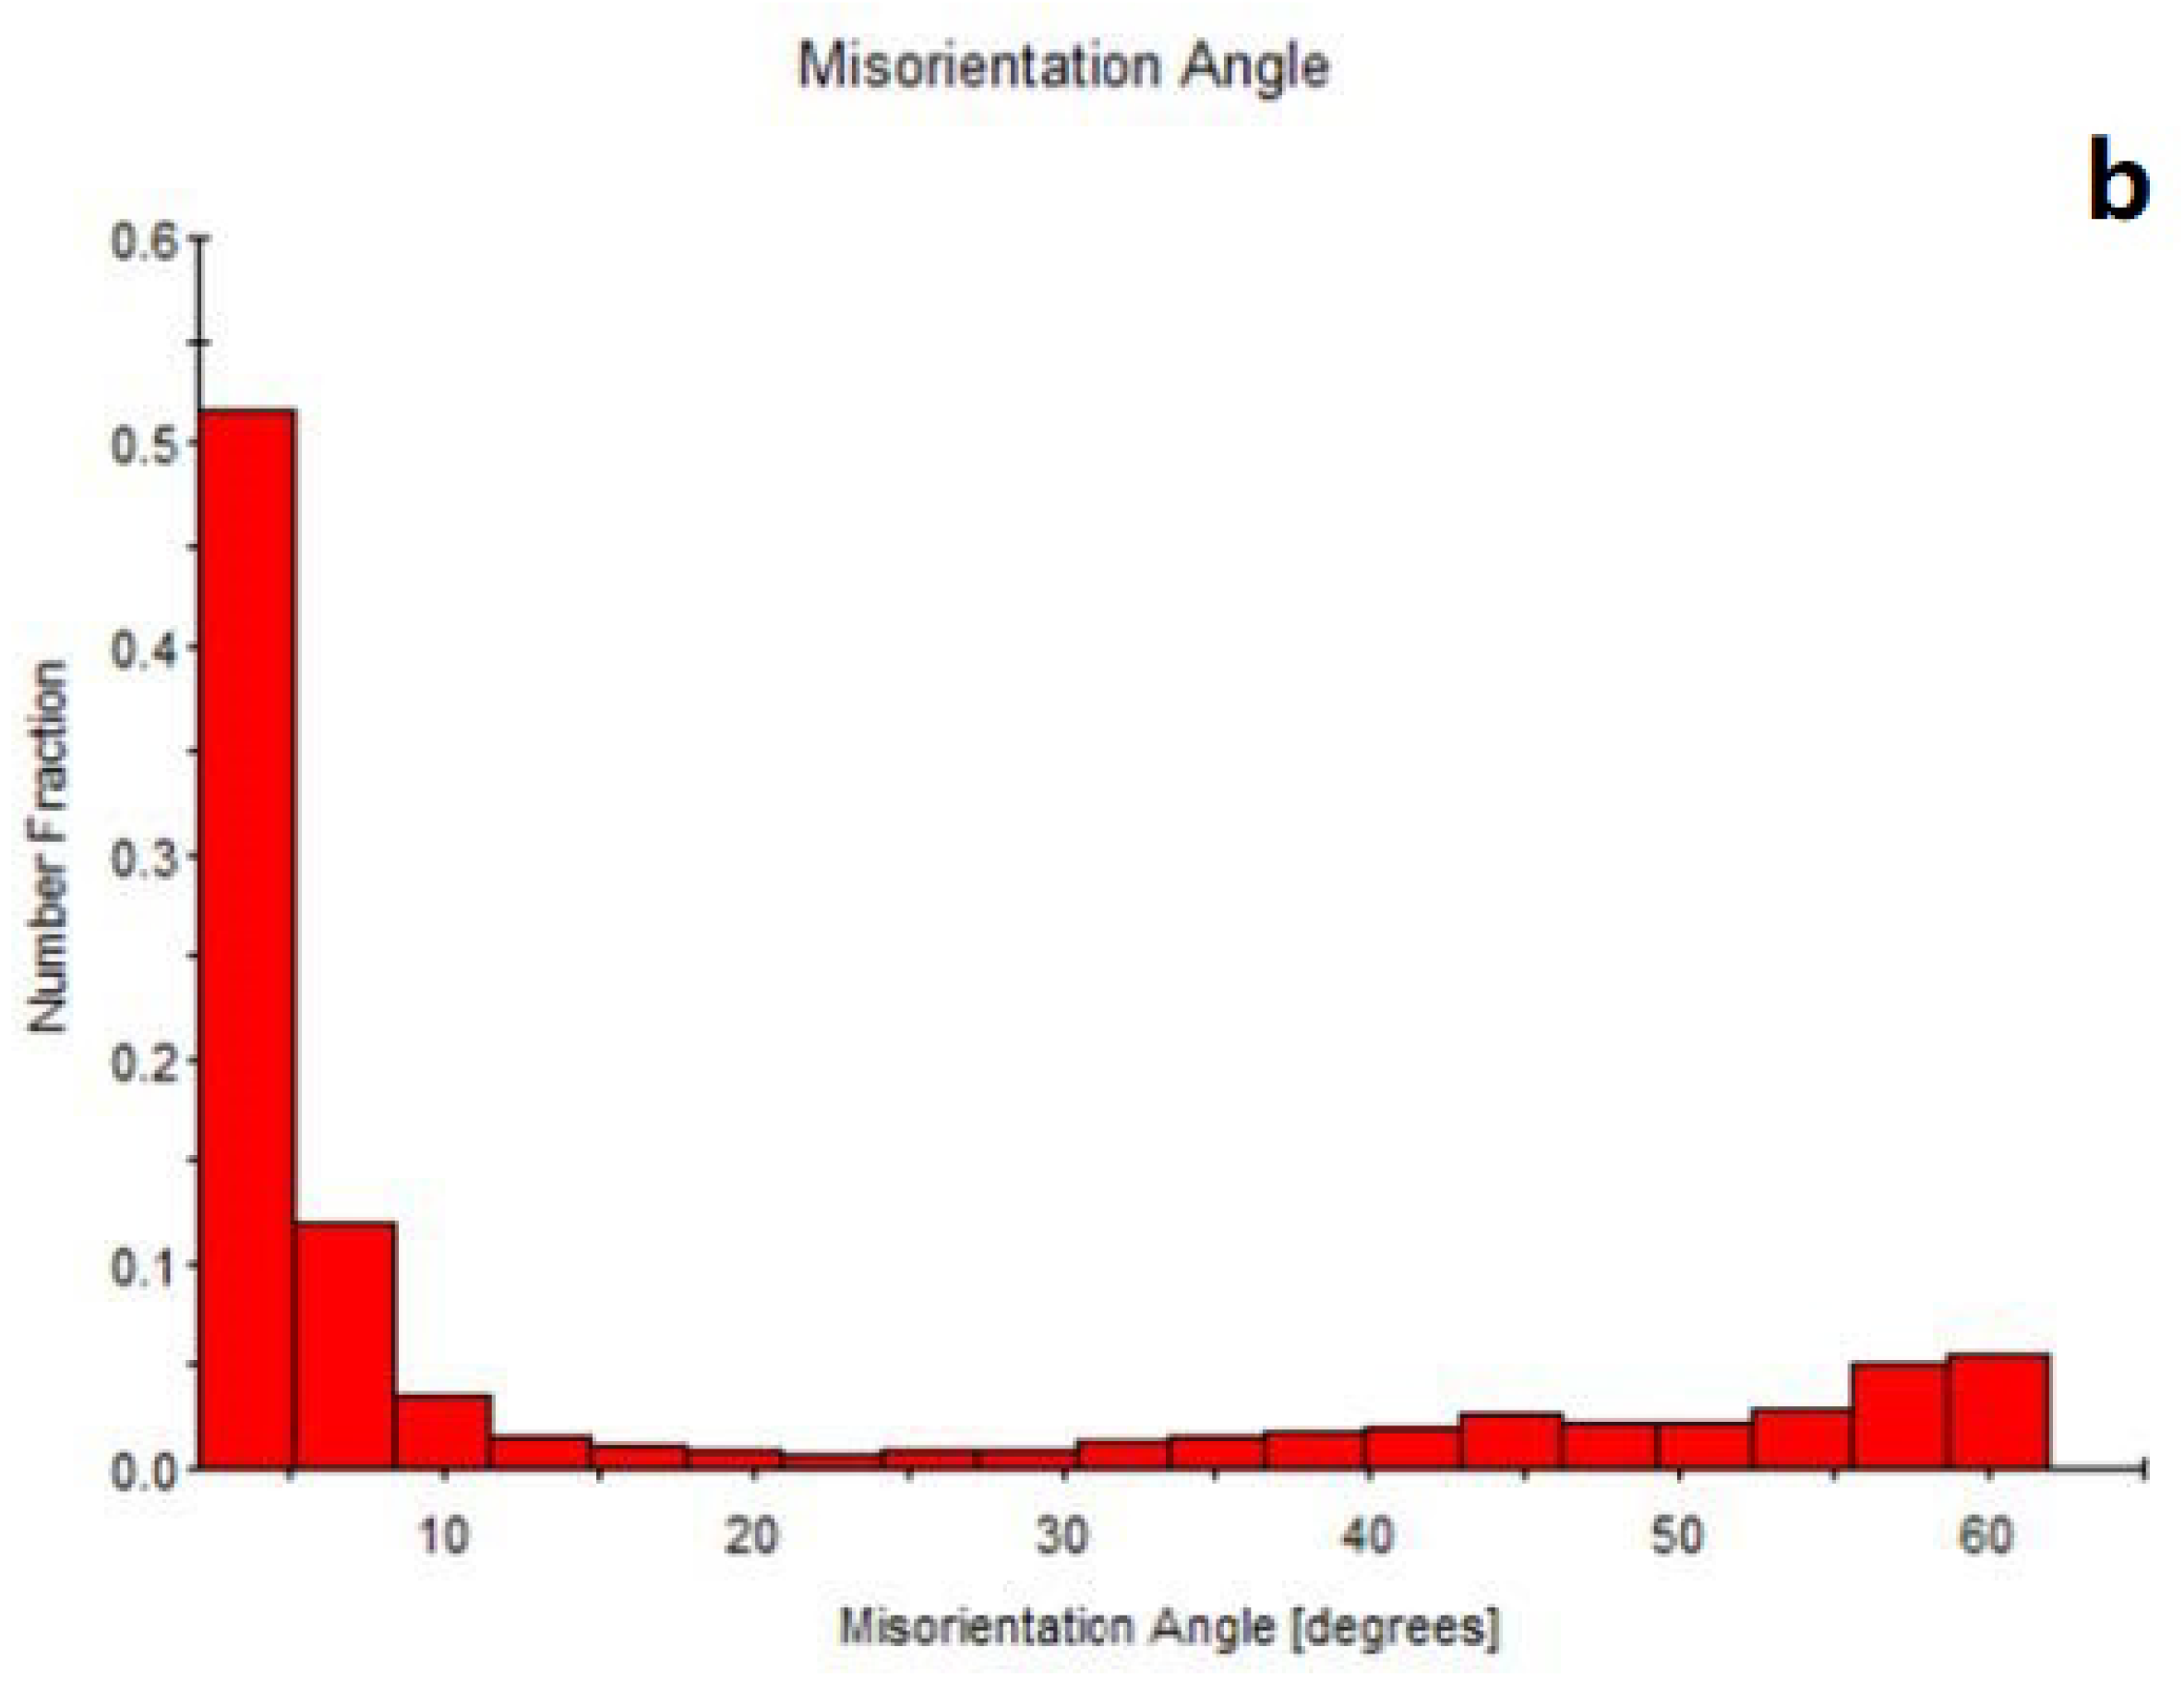
Defect formation in the area of the melting pool is a common problem in additive manufacturing technology. Melting pool boundaries between successive tracks may induce crack initiation when tensile loading increases to a certain level [41]; damage evolution in the melt pools is considered herein. In Figure 14a,b, the distribution of stress and strain in the beginning of material response degradation is shown. The node with maximum stress-strain represents the peak values of the traction that correspond to the δ n 0 when the deformation is almost normal to the melt pool interface. The process of degradation (damage evolution) begins once the traction or separation law meets a certain damage initiation criterion. The quadratic nominal stress criterion is assumed in this study, in which damage initiates when a quadratic interaction function reaches a value of one (Figure 14c).

4.5. EBSD Analysis

For brevity, electron backscatter diffraction (EBSD) maps are discussed here to validate the results of the CP finite element model. For this purpose, a scanning electron microscope (FEI Quanta 400 FEG ESEM) equipped with a unit (TSL-EDAX EBSD) was used for phase identification and grain size detection. For EBSD evaluation, the samples went through an additional polishing step, using a 0.06   μ m silica colloidal suspension, for a superior surface finish and removal of polishing induced plastic deformation, allowing us to obtain Kikuchi patterns [41]. EBSD maps of microstructures, phases and crystallographic directions of the SS 316L tensile test samples ( T 11 and T 31 ) are shown in Figure 15, allowing the observation of a single-phase γ -austenite structure. Consequently, as for the T 11 specimen map (Figure 15a), the austenite content is 93.10% and the ferrite content (martensite) is 6.9%, while for the T 31 specimen (Figure 15b), these percentages are 97.2 % and 2.8 % , respectively. These differences in induced phases stem from various heating and cooling cycles during printing of the cube. By increasing the deformation, martensite formation occurs in austenitic stainless steel, which is formed by stacking the grain contours’ dislocations, when high stress is reached, promoting a barrier to sliding. Twin boundaries in stainless steel can be formed during annealing in steel production and subsequent plastic deformation. The higher density of dislocations also facilitates twin boundaries, since twins’ nucleation requires high stresses, which normally develop in dislocation clusters. The maps show sliding bands that can be seen in Figure 16, which are regions of high dislocation density. The decrease in grain size also indicated the more pronounced refinement of the microstructure during stress. The higher the dislocation density, the more pronounced the microstructure’s refinement effect during stress, producing a greater amount of grain boundaries that can act like a smaller grain effect. The T 11 specimen (Figure 16a) showed a more refined structure than the T 31 specimen (Figure 16b), where the influence of the application of stress was more evident, producing grains from high angles of misorientation, as shown in Figure 17a,b. Increasing misorientation is associated with the reduction of dislocations and promotes the nucleation of twin deformation. This phenomenon acts as a barrier to dislocations and increases the mechanical resistance of the material, which may act like decreasing grain size.

5. Conclusions

In this work, a microstructural polycrystalline model is proposed to study the effect of the microscale and mesoscale features such as grains and melt pool on the mechanical properties of DED-manufactured SS 316L components. The uniaxial response of the fabricated coupons varies with the distance from the component cube surfaces stemming from different microstructure features, such as induced phases and grain distribution. Besides, the grain boundaries and the melt pools are modeled with overlapped cylinders contacting several grains. To make an affordable trade-off between the computational accuracy and cost in modelling of the grains, this RVE study is proposed.
The size of the RVE have a direct effect on the macroscopic features of the DED components. After determination of the RVE size, such data can be used for damage evolution numerical analysis, which is conducted herein based on the CZM model applicable within the melt pool boundaries. By conducting sensitivity analyses, the CP material coefficients are calibrated based on uniaxial tensile test data on polycrystalline DED-fabricated SS 316L coupons. The utilized CP in an FE model considers the effect of grain texture and crystal orientation in CP material modelling. The influence of the number of grains on the variation in the yield stress was observed. According to the results, selecting large RVEs with a high number of grains leads to a decrease in the value of the yield stress and ultimately tensile strength. The melt pool boundaries binding increases by a reduction of the scanning speed and an increase in the laser power; an increase in the energy density leads to a bigger melt pool and stronger bonding, which leads to parts with enhanced mechanical properties. Regarding the impact of the number of melt pools on the tensile properties, melt pool size controlling can be prone as a significant way to achieve the required features. Apart from an additive fabrication technique (whether direct energy deposition or selective laser melting), the proposed methodology is expected to yield satisfactory outcomes in dealing with the grain morphology and melt pool size effects on the mechanical behavior, and it is believed that it will provide complementary insights into the material design concept and pave the way for the broader use of DED in the industry.
Future directions in the scope of the present research can be outlined with different strain rate effects in tensile tests on the Dynamic Recrystallization (DRX) phenomena and coupling CP with dynamic recrystallization methods like the modified Johnson–Mehl–Avrami–Kolmogorov (JMAK) method.

Author Contributions

R.D., J.C.d.S. and A.R. proposed the methodology and results data analyses followed in this research by R.D., E.A., J.C.d.S. and A.R.; A.F. carried out the EBSD analysis and discussions; J.D. printed the additively part in COMTES. All authors participated in the discussion of the results and the writing of the manuscript. All authors have read and agreed to the published version of the manuscript.

Funding

This work was supported by Fundo Europeu de Desenvolvimento Regional (FEDER) through Programa Operacional Competitividade e Internacionalização (COMPETE 2020) and national funds through Fundação para a Ciência e a Tecnologia (FCT), Portugal, grant number: ADDing (POCI-01-0145-FEDER-030490). The first author truly acknowledges the funding provided by Ministério da Educação e Ciência, Fundação para a Ciência e a Tecnologia (Portugal), under grant 2021.08685.BD. The work was also supported by ERDF Pre-Application Research of Functionally Graduated Materials by Additive Technologies, No. CZ.02.1.01/0.0/0.0/17_048/0007350 by the Ministry of Education, Youth and Sport of the Czech Republic.

Institutional Review Board Statement

Not applicable.

Informed Consent Statement

Not applicable.

Data Availability Statement

Not applicable.

Conflicts of Interest

The authors declare no conflict of interest.

References

  1. Kim, F.H.; Moylan, S.P. Literature Review of Metal Additive Manufacturing Defects; US Department of Commerce, National Institute of Standards and Technology: Gaithersburg, MD, USA, 2018; pp. 1–17. [Google Scholar]
  2. Fu, J.; Qu, S.; Ding, J.; Song, X.; Fu, M.W. Comparison of the microstructure, mechanical properties and distortion of stainless steel 316 L fabricated by micro and conventional laser powder bed fusion. Addit. Manuf. 2021, 44, 102067. [Google Scholar] [CrossRef]
  3. Zinovieva, O.; Romanova, V.; Balokhonov, R. Effects of scanning pattern on the grain structure and elastic properties of additively manufactured 316L austenitic stainless steel. Mater. Sci. Eng. A 2022, 832, 142447. [Google Scholar] [CrossRef]
  4. Sames, W.J.; List, F.A.; Pannala, S.; Dehoff, R.R.; Babu, S.S. The metallurgy and processing science of metal additive manufacturing. Int. Mater. Rev. 2016, 61, 315–360. [Google Scholar] [CrossRef]
  5. DebRoy, T.; Wei, H.L.; Zuback, J.S.; Mukherjee, T.; Elmer, J.W.; Milewski, J.O.; Beese, A.M.; Wilson-Heid, A.; De, A.; Zhang, W. Additive manufacturing of metallic components—Process, structure and properties. Prog. Mater. Sci. 2018, 92, 112–224. [Google Scholar] [CrossRef]
  6. Wei, H.L.; Elmer, J.W.; Debroy, T. Origin of grain orientation during solidification of an aluminum alloy. Acta Mater. 2016, 115, 123–131. [Google Scholar] [CrossRef] [Green Version]
  7. Chen, Y.; Lu, F.; Zhang, K.; Nie, P.; Elmi Hosseini, S.R.; Feng, K.; Li, Z. Dendritic microstructure and hot cracking of laser additive manufactured Inconel 718 under improved base cooling. J. Alloys Compd. 2016, 670, 312–321. [Google Scholar] [CrossRef]
  8. Darabi, R.; Azinpour, E.; Fiorentin, F.K.; Abarca, M.J.; Cesar de Sá, J.; Dzugan, J. Experimental and computational analysis of additively manufactured tensile specimens: Assessment of localized-cooling rate and ductile fracture using the Gurson-Tvergaard-Needleman damage model. Proc. Inst. Mech. Eng. Part L J. Mater. Des. Appl. 2021, 235, 1430–1442. [Google Scholar] [CrossRef]
  9. Parimi, L.L.; Ravi, G.; Clark, D.; Attallah, M.M. Microstructural and texture development in direct laser fabricated IN718. Mater. Charact. 2014, 89, 102–111. [Google Scholar] [CrossRef]
  10. Zerbst, U.; Bruno, G.; Buffiere, J.-Y.; Wegener, T.; Niendorf, T.; Wu, T.; Zhang, X.; Kashaev, N.; Meneghetti, G.; Hrabe, N.; et al. Damage tolerant design of additively manufactured metallic components subjected to cyclic loading: State of the art and challenges. Prog. Mater. Sci. 2021, 121, 100786. [Google Scholar] [CrossRef]
  11. Francois, M.M.; Sun, A.; King, W.E.; Henson, N.J.; Tourret, D.; Bronkhorst, C.A.; Carlson, N.N.; Newman, C.K.; Haut, T.; Bakosi, J.; et al. Modeling of additive manufacturing processes for metals: Challenges and opportunities. Curr. Opin. Solid State Mater. Sci. 2017, 21, 198–206. [Google Scholar] [CrossRef]
  12. Antony, K.; Arivazhagan, N.; Senthilkumaran, K. Numerical and experimental investigations on laser melting of stainless steel 316L metal powders. J. Manuf. Process. 2014, 16, 345–355. [Google Scholar] [CrossRef]
  13. Zheng, B.; Haley, J.C.; Yang, N.; Yee, J.; Terrassa, K.W.; Zhou, Y.; Lavernia, E.J.; Schoenung, J.M. On the evolution of microstructure and defect control in 316L SS components fabricated via directed energy deposition. Mater. Sci. Eng. A 2019, 764, 138243. [Google Scholar] [CrossRef]
  14. Foroozmehr, A.; Badrossamay, M.; Foroozmehr, E.; Golabi, S. Finite Element Simulation of Selective Laser Melting process considering Optical Penetration Depth of laser in powder bed. Mater. Des. 2016, 89, 255–263. [Google Scholar] [CrossRef]
  15. Keller, T.; Lindwall, G.; Ghosh, S.; Ma, L.; Lane, B.M.; Zhang, F.; Kattner, U.R.; Lass, E.A.; Heigel, J.C.; Idell, Y.; et al. Application of finite element, phase-field, and CALPHAD-based methods to additive manufacturing of Ni-based superalloys. Acta Mater. 2017, 139, 244–253. [Google Scholar] [CrossRef] [PubMed]
  16. Oh, W.J.; Lee, W.J.; Kim, M.S.; Jeon, J.B.; Shim, D.S. Repairing additive-manufactured 316L stainless steel using direct energy deposition. Opt. Laser Technol. 2019, 117, 6–17. [Google Scholar] [CrossRef]
  17. Azinpour, E.; Darabi, R.; Cesar de Sa, J.; Santos, A.; Hodek, J.; Dzugan, J. Fracture analysis in directed energy deposition (DED) manufactured 316L stainless steel using a phase-field approach. Finite Elem. Anal. Des. 2020, 177, 103417. [Google Scholar] [CrossRef]
  18. Aversa, A.; Saboori, A.; Librera, E.; de Chirico, M.; Biamino, S.; Lombardi, M.; Fino, P. The role of Directed Energy Deposition atmosphere mode on the microstructure and mechanical properties of 316L samples. Addit. Manuf. 2020, 34, 101274. [Google Scholar] [CrossRef]
  19. Rodgers, T.M.; Madison, J.D.; Tikare, V. Simulation of metal additive manufacturing microstructures using kinetic Monte Carlo. Comput. Mater. Sci. 2017, 135, 78–89. [Google Scholar] [CrossRef]
  20. Froes, F.; Boyer, R. Additive Manufacturing for the Aerospace Industry; Elsevier: Amsterdam, The Netherlands, 2019; ISBN 9780128140635. [Google Scholar]
  21. Ahmadi, A.; Mirzaeifar, R.; Moghaddam, N.S.; Turabi, A.S.; Karaca, H.E.; Elahinia, M. Effect of manufacturing parameters on mechanical properties of 316L stainless steel parts fabricated by selective laser melting: A computational framework. Mater. Des. 2016, 112, 328–338. [Google Scholar] [CrossRef]
  22. Taheri Andani, M.; Ghodrati, M.; Karamooz-Ravari, M.R.; Mirzaeifar, R.; Ni, J. Damage modeling of metallic alloys made by additive manufacturing. Mater. Sci. Eng. A 2019, 743, 656–664. [Google Scholar] [CrossRef]
  23. Taheri Andani, M.; Karamooz-Ravari, M.R.; Mirzaeifar, R.; Ni, J. Micromechanics modeling of metallic alloys 3D printed by selective laser melting. Mater. Des. 2018, 137, 204–213. [Google Scholar] [CrossRef]
  24. Bhujangrao, T.; Veiga, F.; Suárez, A.; Iriondo, E.; Mata, F.G. High-temperature mechanical properties of IN718 alloy: Comparison of additive manufactured and wrought samples. Crystals 2020, 10, 689. [Google Scholar] [CrossRef]
  25. Melzer, D.; Džugan, J.; Koukolíková, M.; Rzepa, S.; Vavřík, J. Structural integrity and mechanical properties of the functionally graded material based on 316L/IN718 processed by DED technology. Mater. Sci. Eng. A 2021, 811, 141038. [Google Scholar] [CrossRef]
  26. Darabi, R.; Ferreira, A.; Azinpour, E.; de Sa, J.C.; Reis, A. Thermal study of a cladding layer of Inconel 625 in Directed Energy Deposition (DED) process using a phase-field model. Int. J. Adv. Manuf. Technol. 2022, 119, 3975–3993. [Google Scholar] [CrossRef]
  27. Churyumov, A.Y.; Medvedeva, S.V.; Mamzurina, O.I.; Kazakova, A.A.; Churyumova, T.A. United approach to modelling of the hot deformation behavior, fracture, and microstructure evolution of austenitic stainless AISI 316Ti steel. Appl. Sci. 2021, 11, 3204. [Google Scholar] [CrossRef]
  28. Darabi, R.; Azinpour, E. Fracture Prediction Based on Evaluation of Initial Porosity Induced By Direct Energy Deposition. Eur. J. Comput. Mech. 2021, 29, 223–254. [Google Scholar] [CrossRef]
  29. Taylor, G.I. Taylor_1938.pdf. Journal of the Institute of Metals 1938, 62, 307–324. [Google Scholar]
  30. Hill, R.; Rice, J.R. Constitutive analysis of elastic-plastic crystals at arbitrary strain. J. Mech. Phys. Solids 1972, 20, 401–413. [Google Scholar] [CrossRef]
  31. Rice, J.R. Inelastic constitutive relations for solids: An internal-variable theory and its application to metal plasticity. J. Mech. Phys. Solids 1971, 19, 433–455. [Google Scholar] [CrossRef]
  32. Habibi, M.; Darabi, R.; Sa, J.C.; Reis, A. An innovation in finite element simulation via crystal plasticity assessment of grain morphology effect on sheet metal formability. Proc. Inst. Mech. Eng. Part L J. Mater. Des. Appl. 2021, 235, 1937–1951. [Google Scholar] [CrossRef]
  33. Zhang, P.; Karimpour, M.; Balint, D.; Lin, J. Three-dimensional virtual grain structure generation with grain size control. Mech. Mater. 2012, 55, 89–101. [Google Scholar] [CrossRef]
  34. Shifeng, W.; Shuai, L.; Qingsong, W.; Yan, C.; Sheng, Z.; Yusheng, S. Effect of molten pool boundaries on the mechanical properties of selective laser melting parts. J. Mater. Process. Technol. 2014, 214, 2660–2667. [Google Scholar] [CrossRef]
  35. Huang, Y. A User-Material Subroutine Incorporating Single crystal Plasticity in the ABAQUS Finite Element Program; Mech Report 178; Harvard University: Cambridge, MA, USA, 1991. [Google Scholar]
  36. Chua, C.K.; Wong, C.H.; Yeong, W.Y. Roadmap on Additive Manufacturing Standards. In Standards, Quality Control, and Measurement Sciences in 3D Printing and Additive Manufacturing; Academic Press: Cambridge, MA, USA, 2017; pp. 31–55. [Google Scholar] [CrossRef]
  37. Rocha, A.V.M.; Akhavan-Safar, A.; Carbas, R.; Marques, E.A.S.; Goyal, R.; El-zein, M.; da Silva, L.F.M. Numerical analysis of mixed-mode fatigue crack growth of adhesive joints using CZM. Theor. Appl. Fract. Mech. 2020, 106, 102493. [Google Scholar] [CrossRef]
  38. Simonovski, I. Material properties calibration for 316L steel using polycrystalline model. In Proceedings of the 13th International Conference on Nuclear Engineering Abstracts, Beijing, China, 16–20 May 2005; pp. 1–8. [Google Scholar]
  39. Guo, Q.; Zhao, C.; Qu, M.; Xiong, L.; Escano, L.I.; Hojjatzadeh, S.M.H.; Parab, N.D.; Fezzaa, K.; Everhart, W.; Sun, T.; et al. In-situ characterization and quantification of melt pool variation under constant input energy density in laser powder bed fusion additive manufacturing process. Addit. Manuf. 2019, 28, 600–609. [Google Scholar] [CrossRef]
  40. Zhong, Y.; Liu, L.; Wikman, S.; Cui, D.; Shen, Z. Intragranular cellular segregation network structure strengthening 316L stainless steel prepared by selective laser melting. J. Nucl. Mater. 2016, 470, 170–178. [Google Scholar] [CrossRef]
  41. Davies, E.R. Introduction to texture analysis. In Handbook of Texture Analysis; Imperial College Press: London, UK, 2008; ISBN 9781848161160. [Google Scholar]
Figure 1. Manufacturing of cube by DED: (a) mounted cube throughout fabrication: (b) post fabricated cube; (c) tensile test samples.
Metals 12 01096 g001
Figure 2. Schematic of tensile test samples: (a) geometry of the miniature tensile test samples (dimensions in mm): (b) enlarged fracture surface after failure in T 11 .
Metals 12 01096 g002
Figure 3. Comparison of force displacement for T 11 , T 31 .
Metals 12 01096 g003
Figure 4. Melt pool morphology for sample T 11 and definition of building direction (BD) and scanning direction (SD).
Metals 12 01096 g004
Figure 5. Kinematic model of elastoplastic deformation of a single crystal. The material flows through the crystalline lattice by crystallographic slip, which gives rise to deformation gradient F p . Subsequently, the material with embedded lattice deforms elastically from the intermediate to current configuration. The corresponding deformation gradient is F * .
Metals 12 01096 g005
Figure 6. Integration procedure of the VGRAIN system for micromechanics analyses with CPT.
Metals 12 01096 g006
Figure 7. RVE for T 11 : (a) 0.511 × 0.091 mm × mm with 6633 grains (RVE#1); (b) 0.089 × 0.0158 mm × mm with 199 grains (RVE#2); (c) 0.00035 × 0.00006 mm × mm with 32 grains (RVE#3).
Metals 12 01096 g007
Figure 8. Models with different numbers of pools and 199 grains in T 11 : (a) contains 12 melt pools; (b) contains 25 melt pools.
Metals 12 01096 g008
Figure 9. Bilinear traction–separation model on the melt pools domains.
Metals 12 01096 g009
Figure 10. The finite element model indicating the displacement boundary conditions and remote applied load for 199 grains.
Metals 12 01096 g010
Figure 11. Calibration of the Bassani–Wu strain hardening rule parameters through engineering stress-strain graphs based on the experimental measures for: (a) a single crystal and (b) an RVE with 199 grains and 12 melt pools.
Metals 12 01096 g011aMetals 12 01096 g011b
Figure 12. The influence of changing RVE size on engineering stress-strain curve.
Metals 12 01096 g012
Figure 13. The influence of changing melt pool numbers for RVE with 199 grains on engineering stress-strain curve.
Metals 12 01096 g013
Figure 14. (a) Stress distribution for h 0 = 150   M P a , τ 0 = 50   M P a ,   τ s = 230   M P a 12   m e l t   p o o l s ; (b) Strain distribution for h 0 = 150   M P a ,   τ 0 = 50   M P a ,   τ s = 230   M P a 12   m e l t   p o o l s ; (c) Deformed configuration of melt pool of T 11 associated with the index of the quadratic stress damage criterion.
Metals 12 01096 g014
Figure 15. EBSD Orientation Imaging Microscopies (OIM) and phase mapping: (a) T 11 ; (b) T 31 after conducting the tensile test.
Metals 12 01096 g015
Figure 16. Grain size diameter for (a): T 11 ; (b): T 31 .
Metals 12 01096 g016
Figure 17. Misorientation angle for: (a) T 11 ; (b) T 31 .
Metals 12 01096 g017aMetals 12 01096 g017b
Table 1. Calibrated material properties for Bassani–Wu strain hardening rule.
Material n . a ˙ . h 0 τ s τ 0
SS 316L200.00115023050
Publisher’s Note: MDPI stays neutral with regard to jurisdictional claims in published maps and institutional affiliations.

