
Reinforcement of Tooling Using Residual Stresses Generated by Cladding by Arc Welding


Abstract
1. Introduction
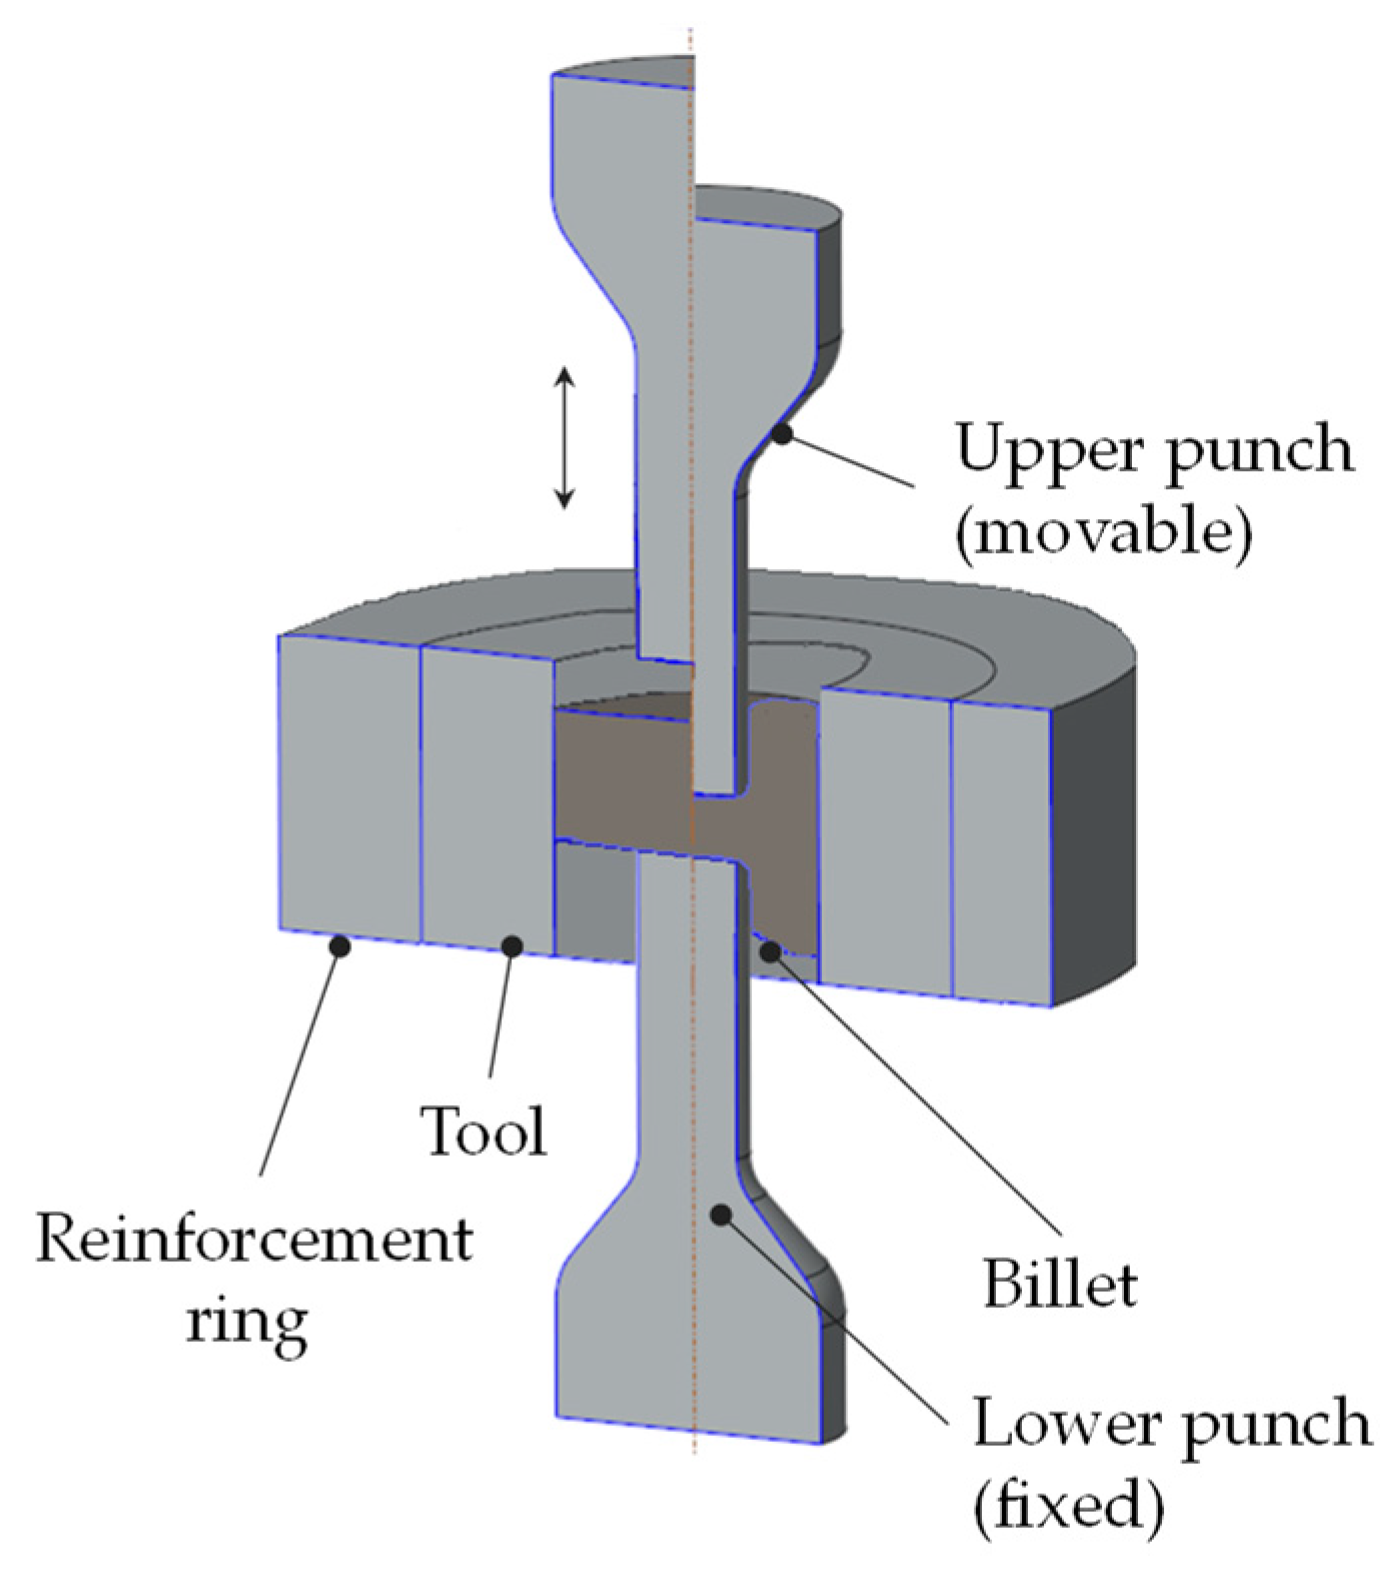
1.1. Extrusion Tool
1.2. Reinforcement of Toolings
1.3. Scope and Structure
- To utilize stresses of the weld-cladding process for reinforcing the cylindrical tool.
- To adopt the weld-cladding pattern to maximize the compressive stresses on a cylindrical tool surface.
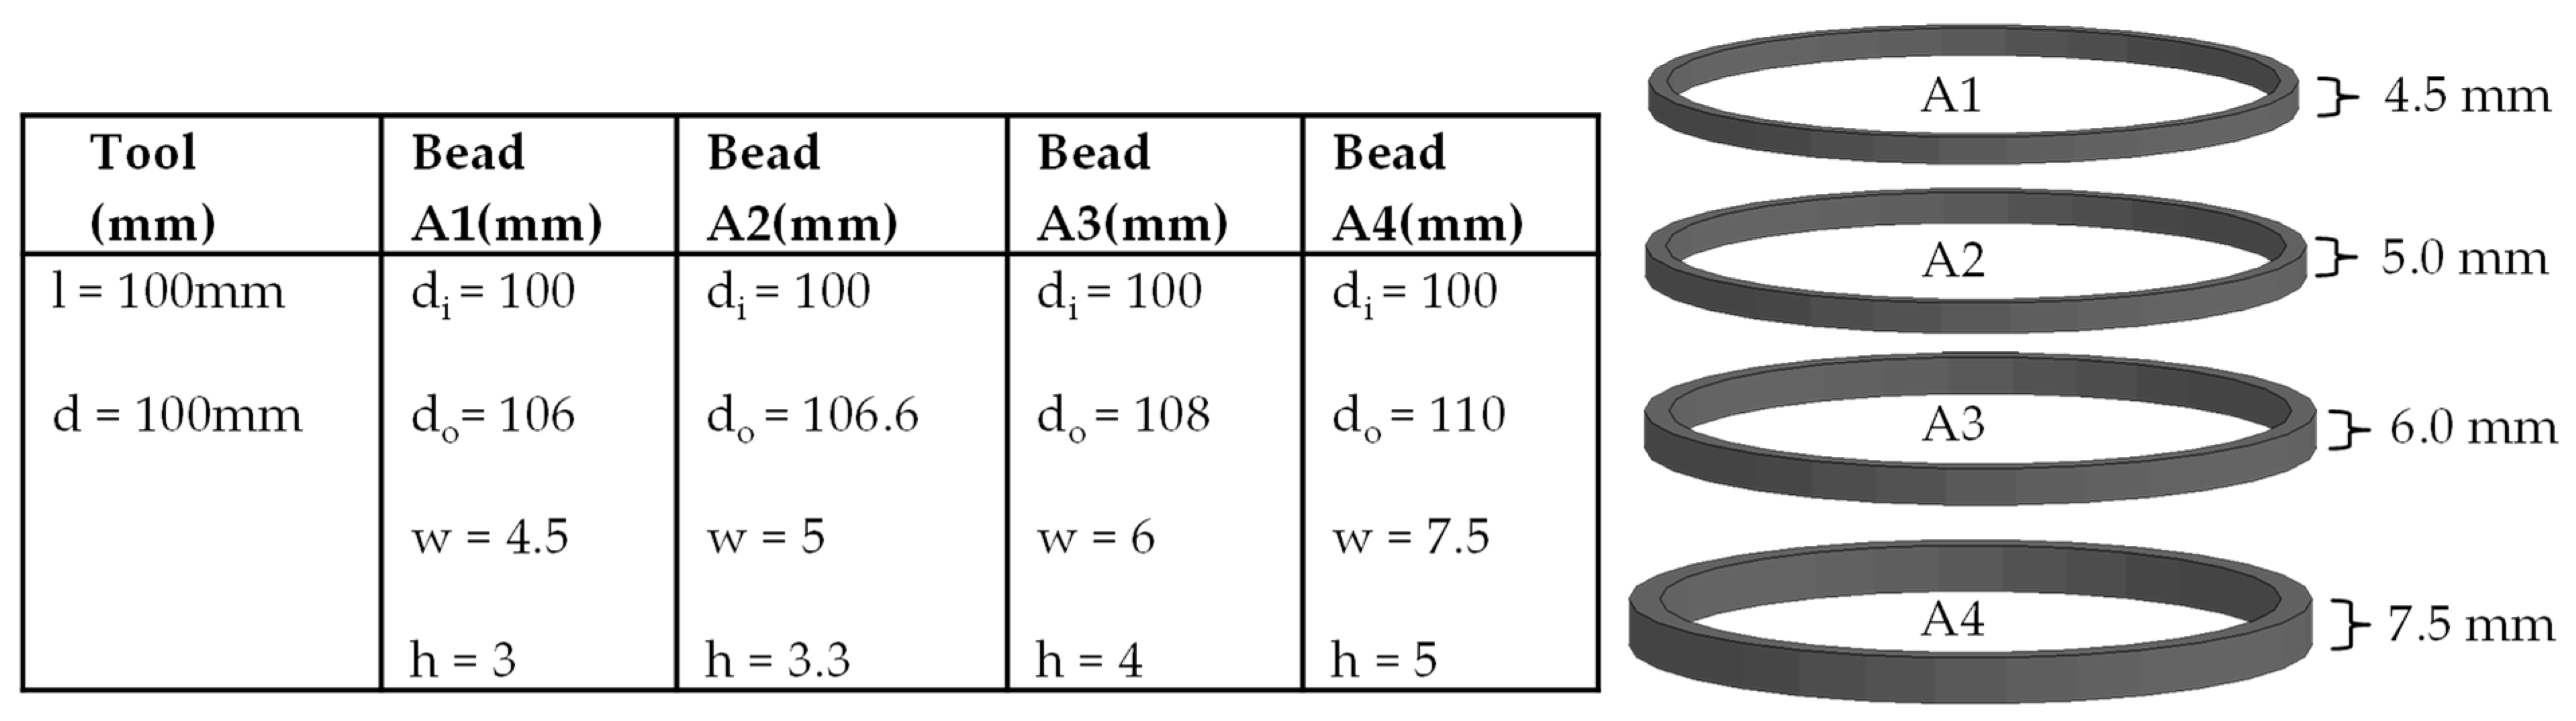
- To find how the weld-bead size affects the compressive stresses on the tool.
- To analyze the effect of changing the tool’s materials and process parameters on the maximum achievable compressive stresses.
2. Materials and Methods
2.1. Numerical Procedure
2.1.1. Element Activation Technique
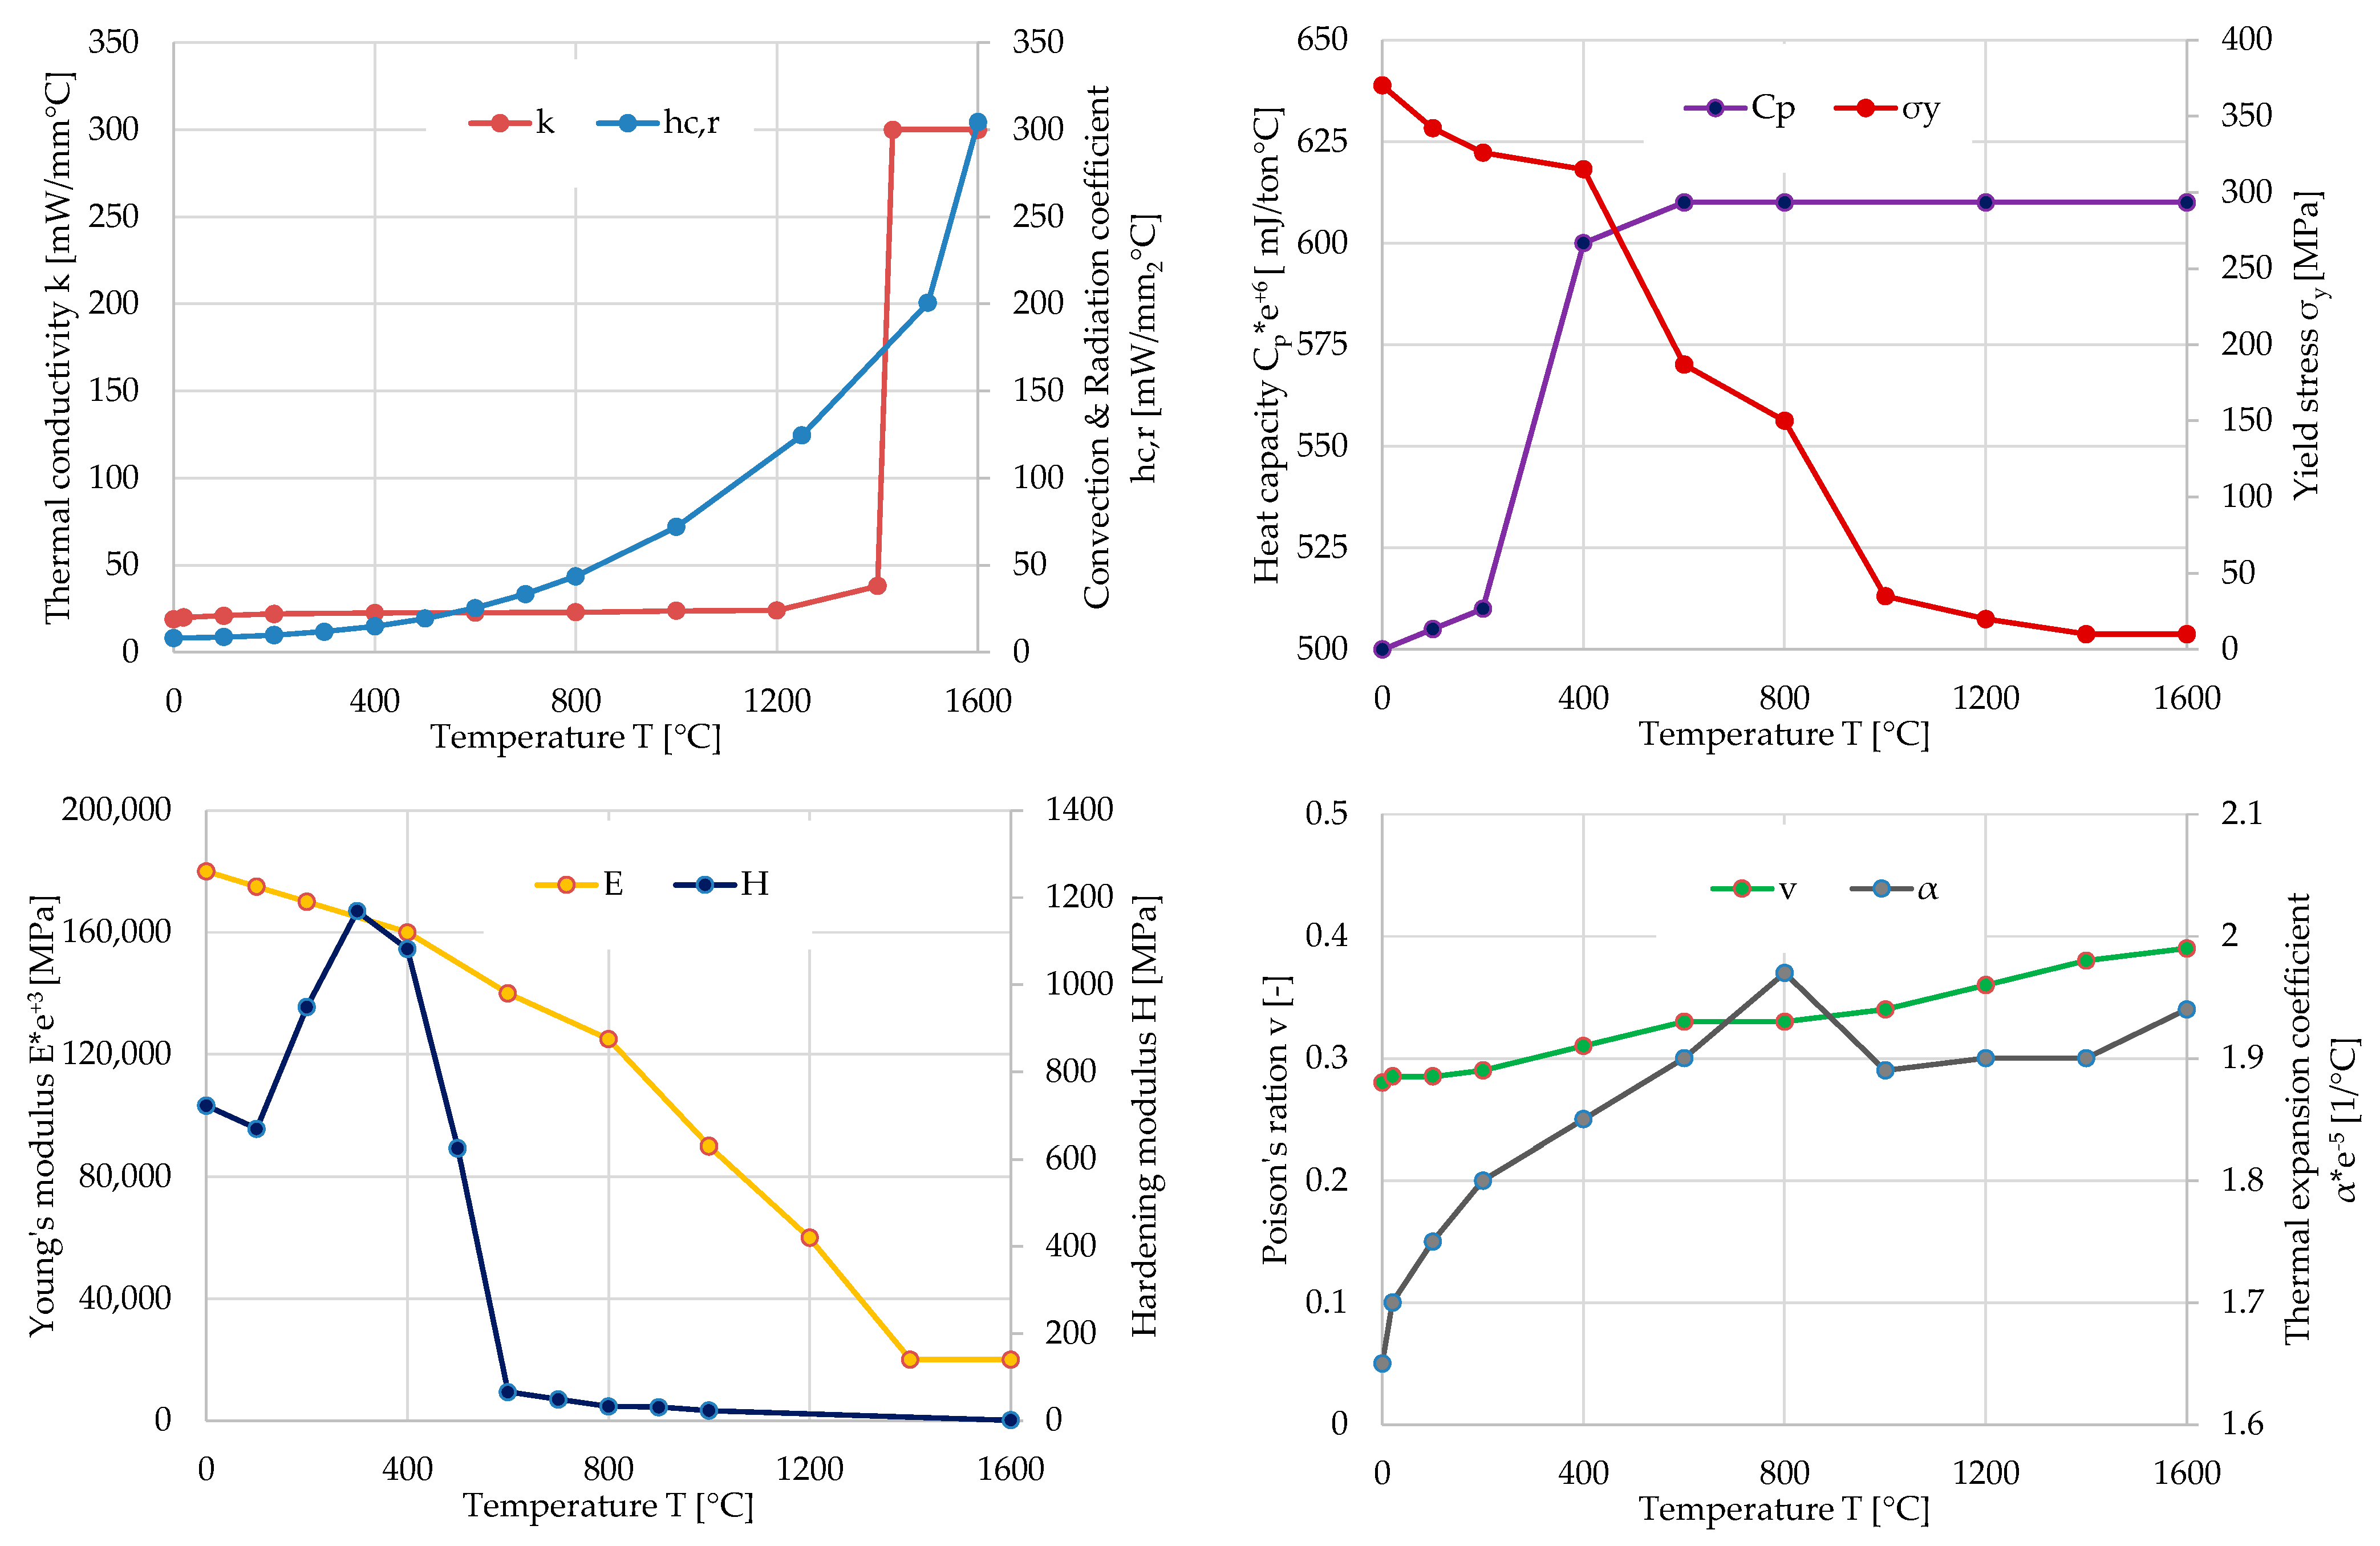
2.1.2. Material Model
2.1.3. Heat Source Model
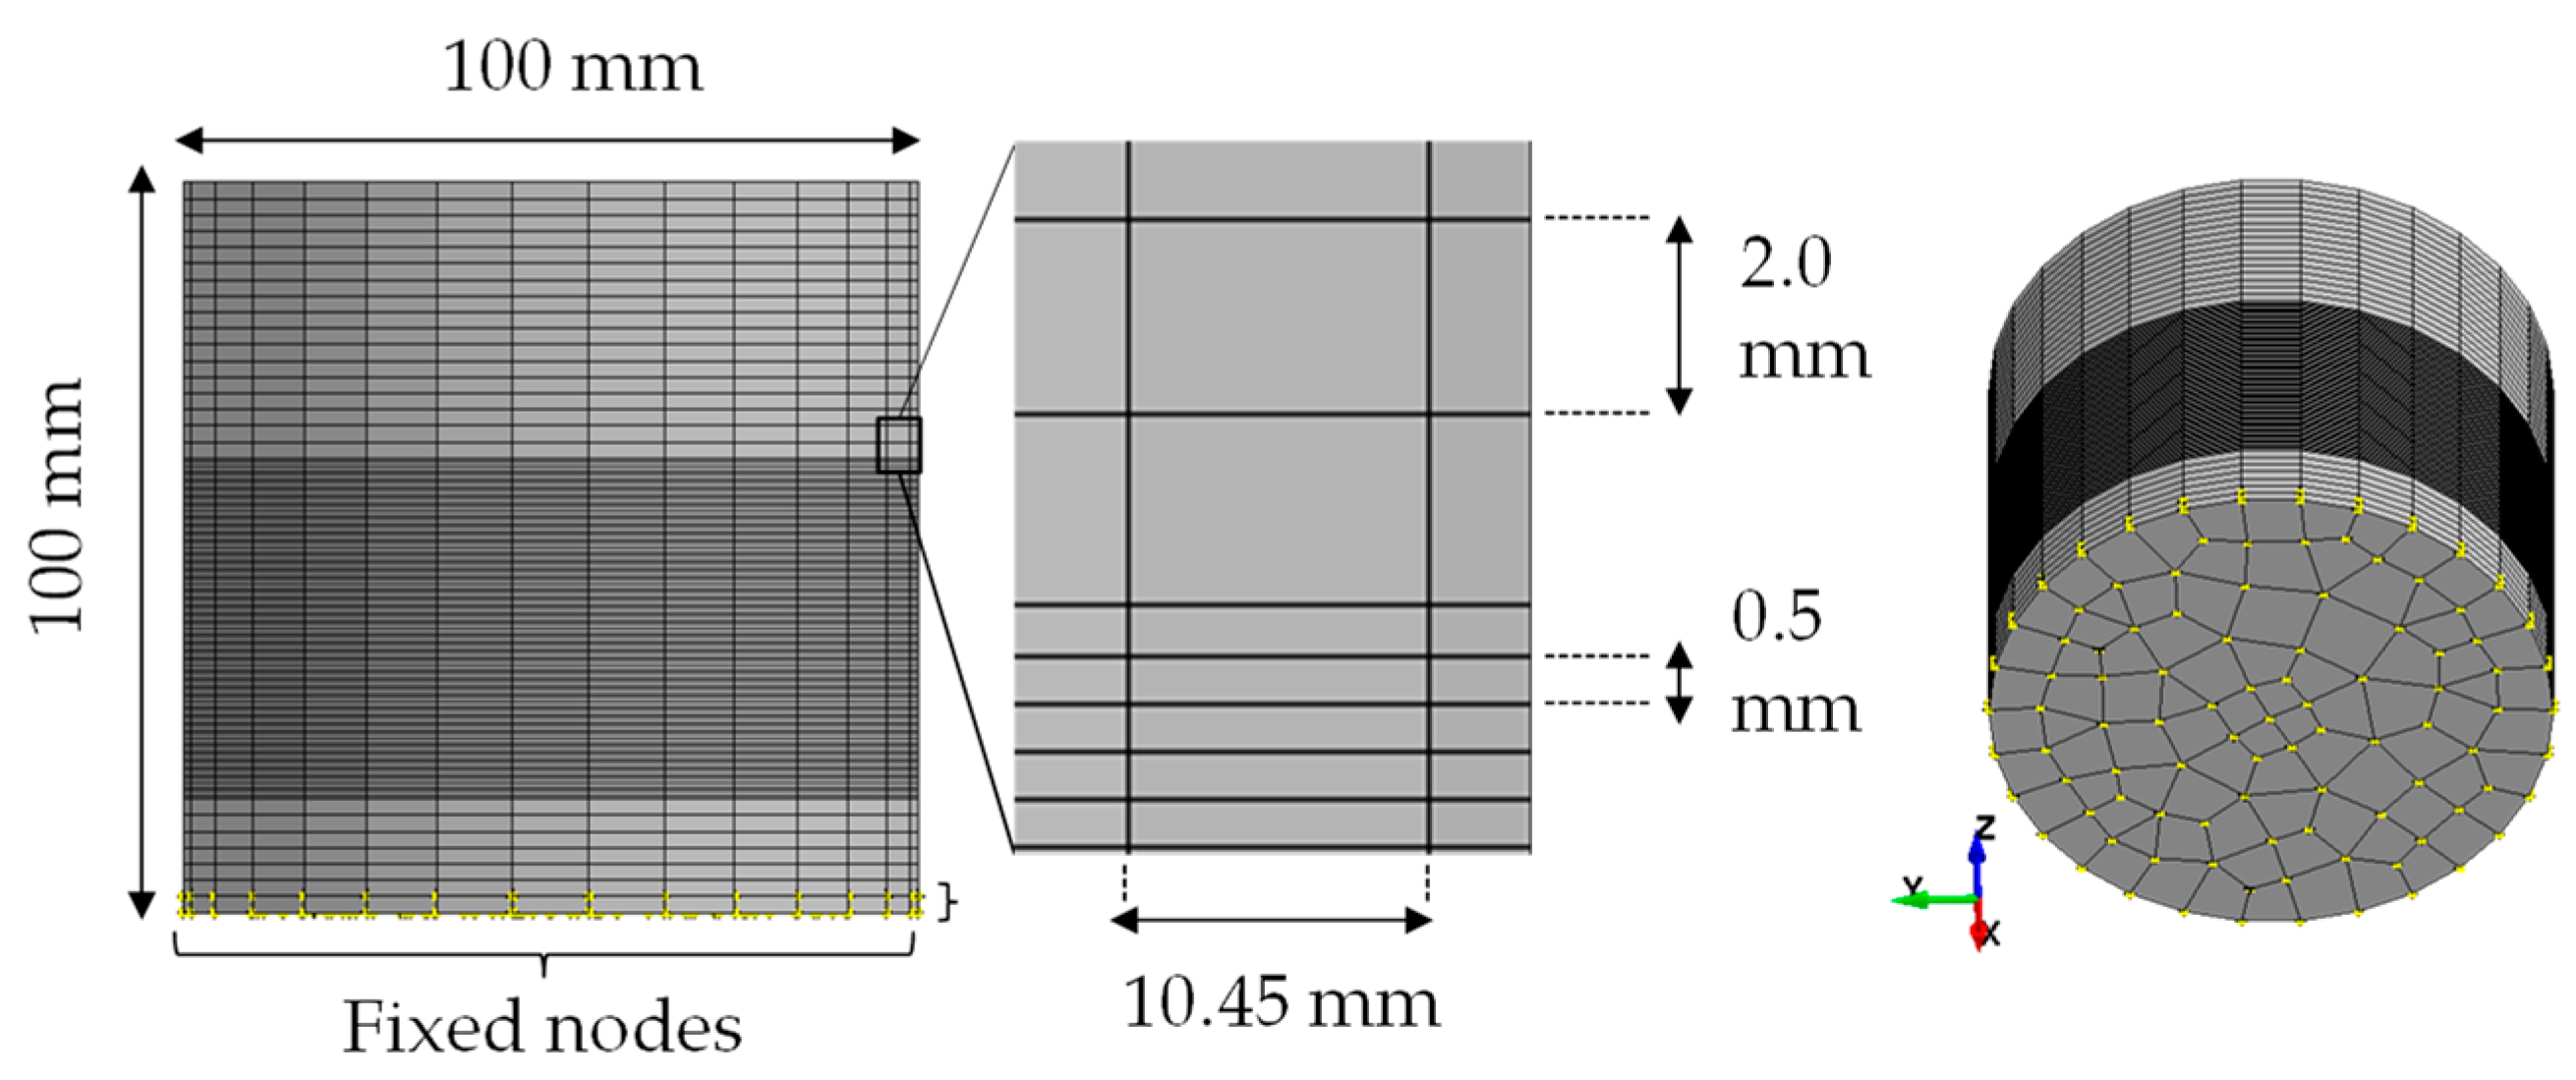
2.1.4. Meshing and Clamping
2.2. Finite Element Model (FEM) of a Single-Bead Cladding
2.2.1. Weld-Bead Position on a Tool with an Internal Cavity
2.2.2. Welding on the Tools of Different Diameters
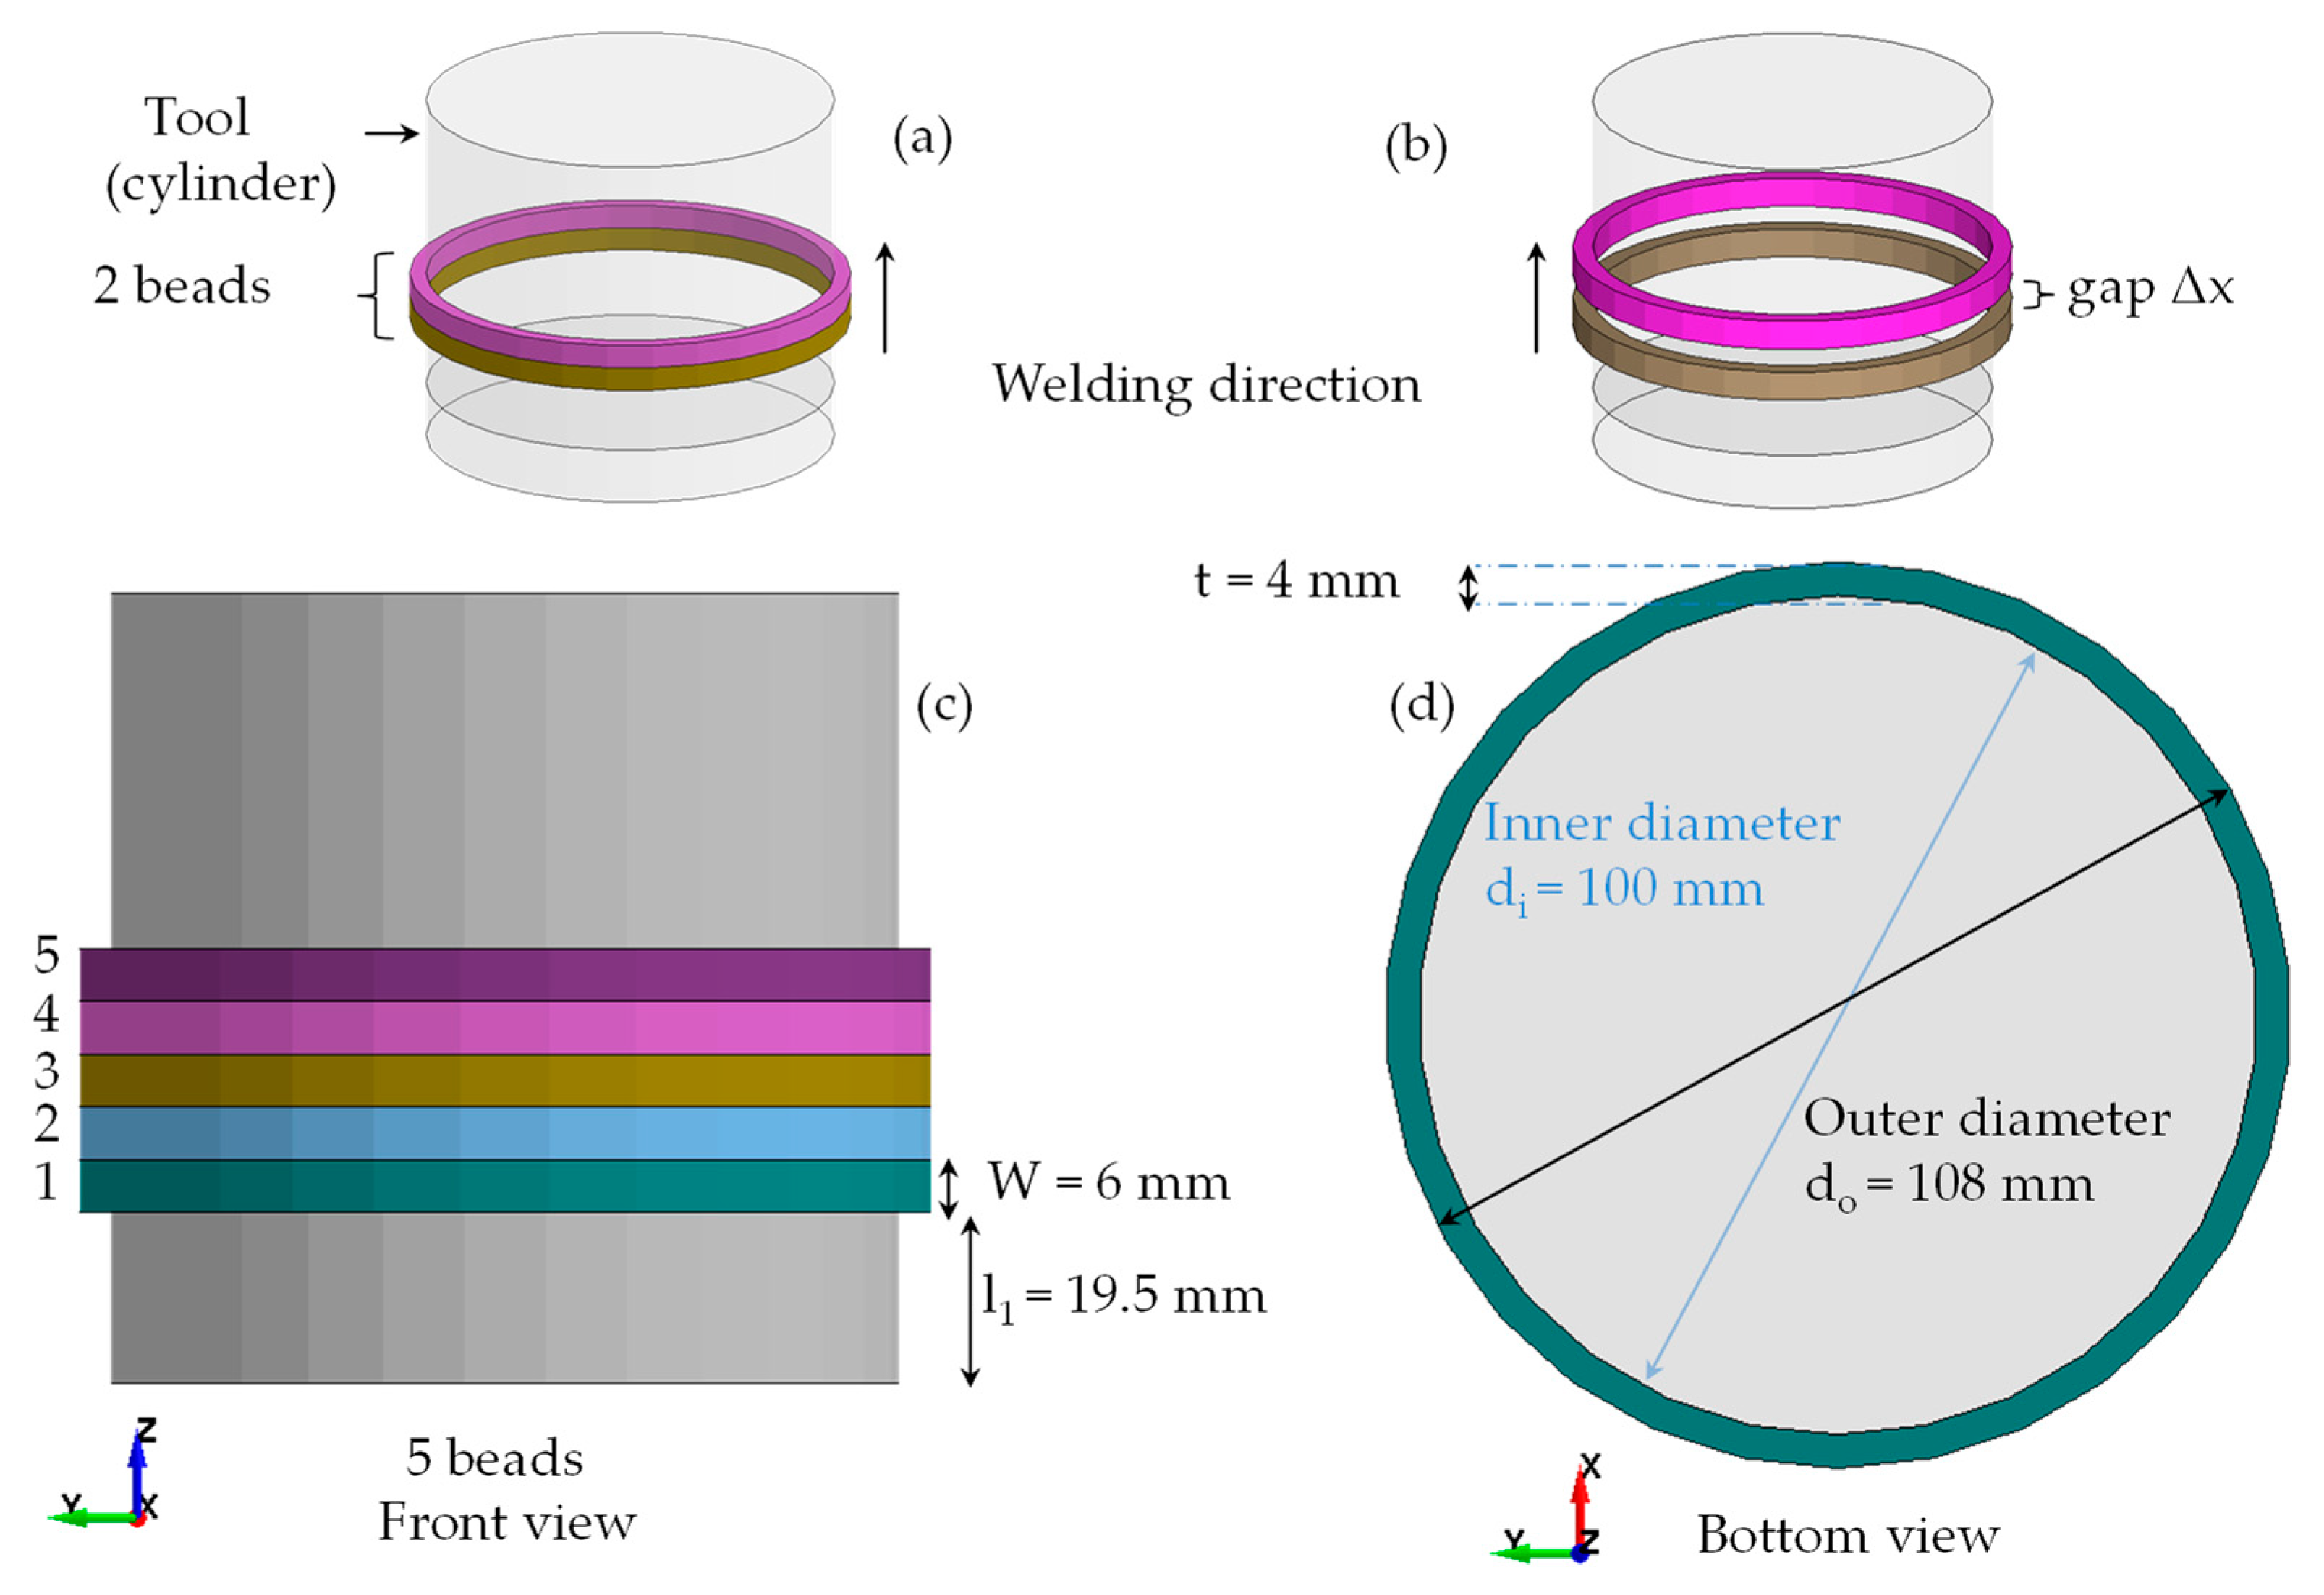
2.3. Finite Element Model (FEM) for Multiple-Bead Cladding
2.3.1. Single-Layer Parallel Cladding of Multiple Beads with and without a Gap
2.3.2. Multilayer Parallel Welding of Beads
2.4. Experimental Procedure for Single-Bead Cladding
2.4.1. Specimen Production
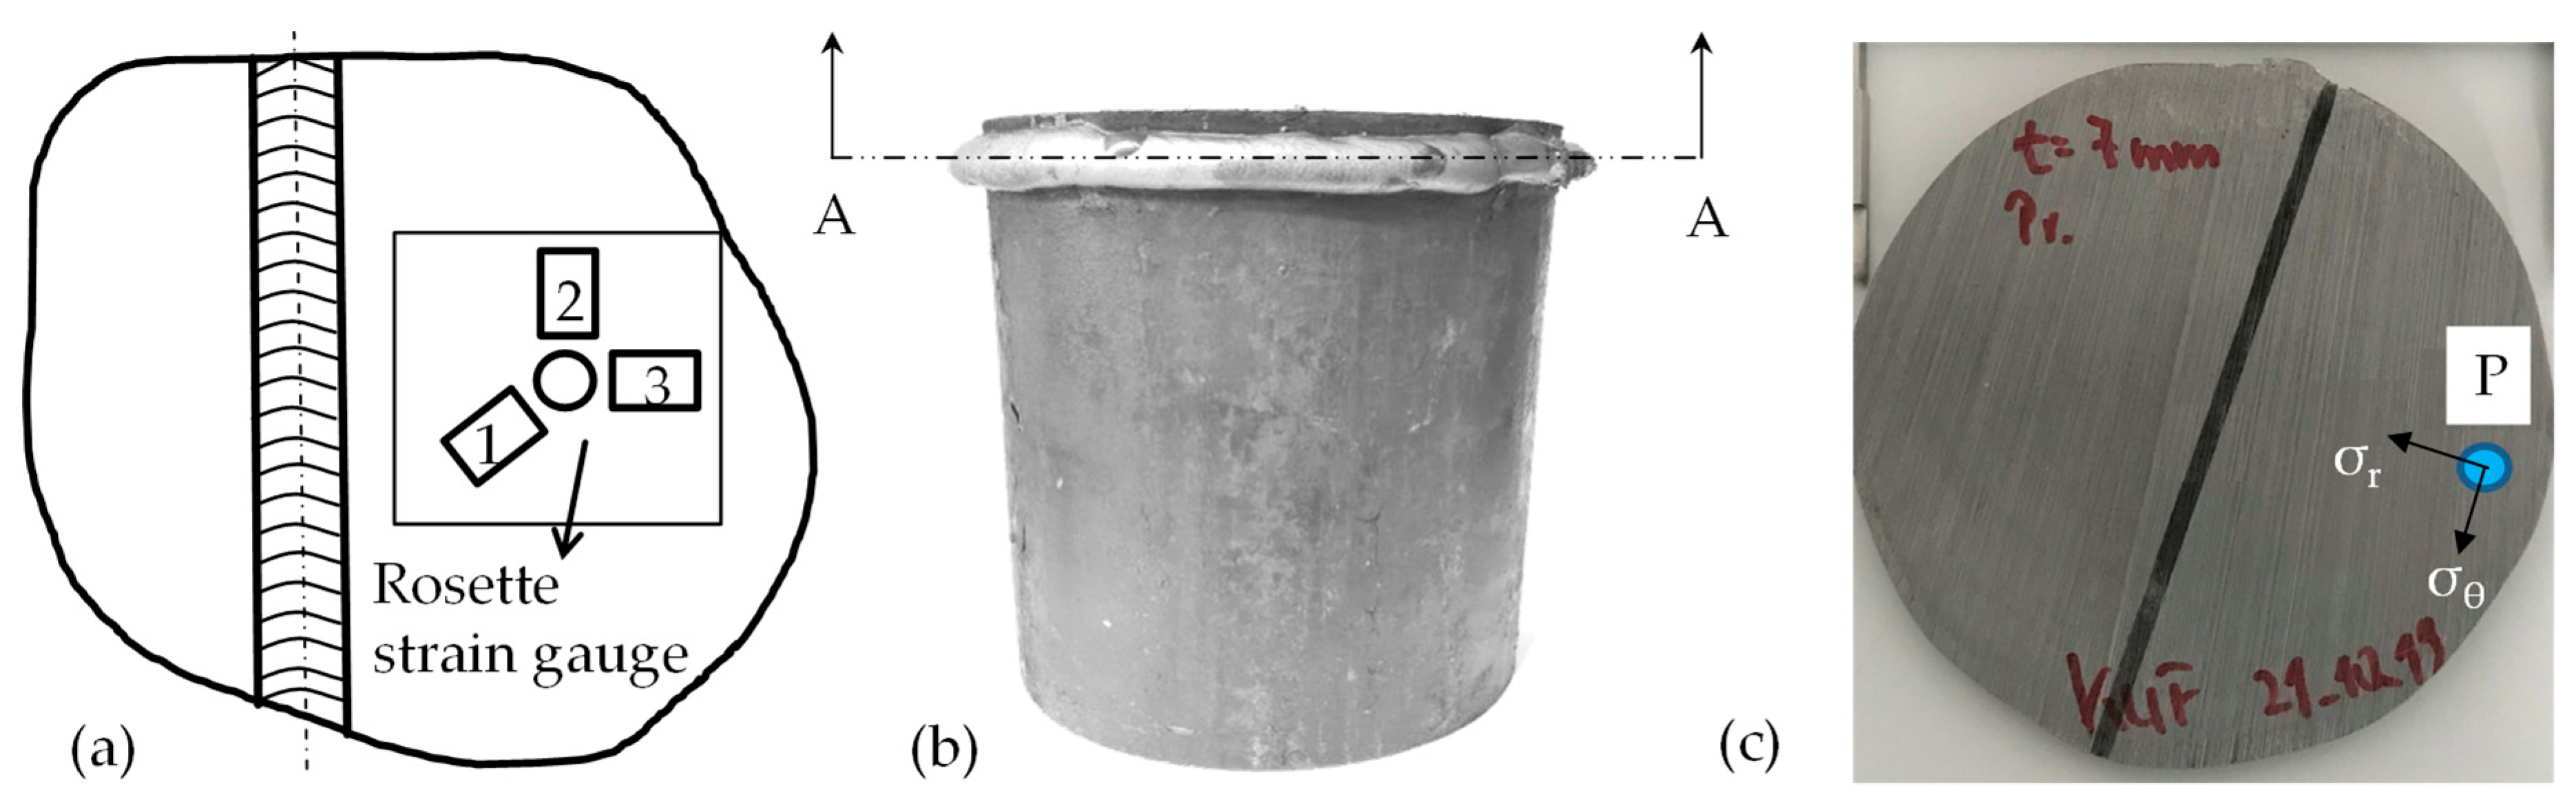
2.4.2. Residual Stress Measurement
3. Results and Discussions
3.1. Single Bead Weld-Cladding Simulation
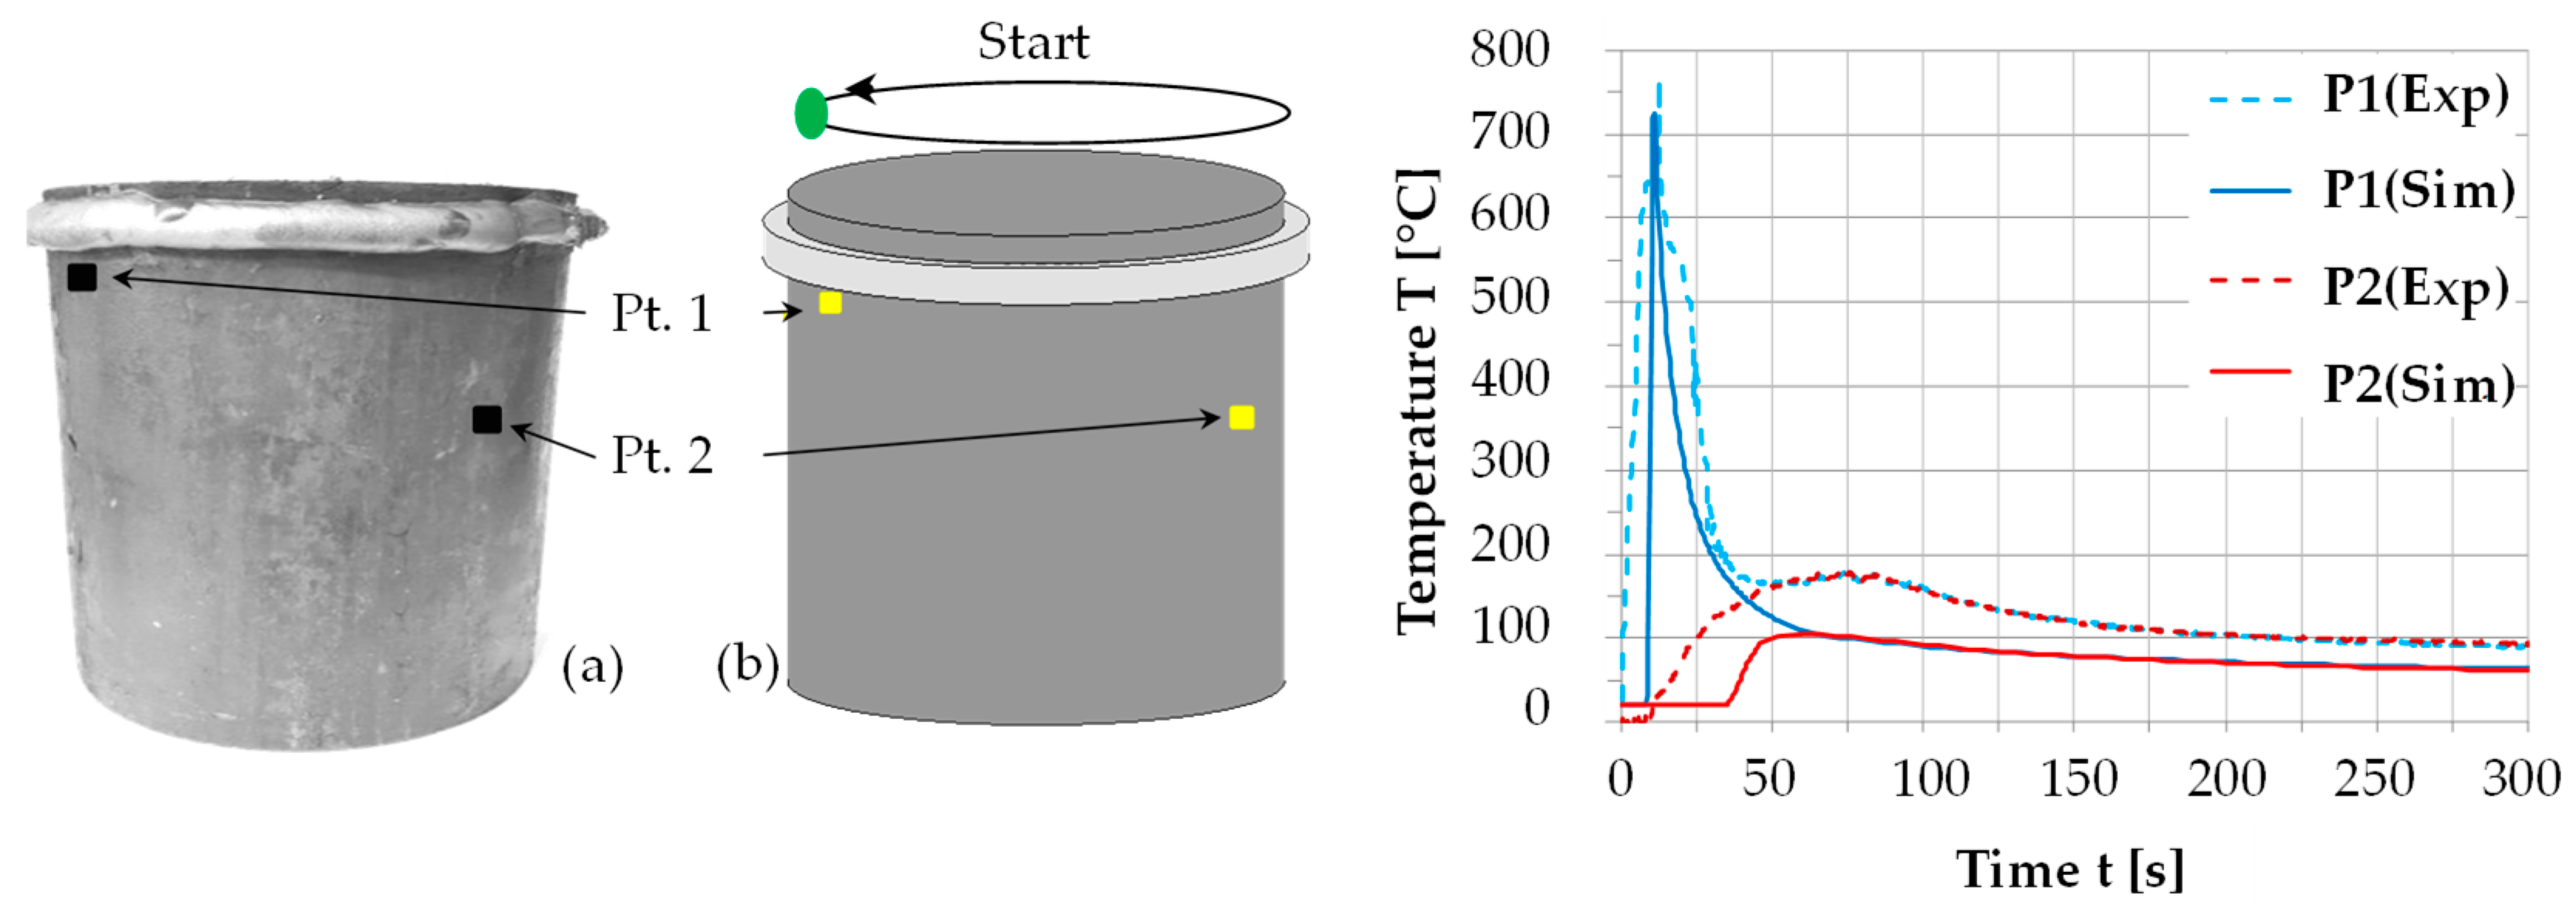
3.2. Experimental Validation of Single Bead Simulation
3.3. Optimization of a Single-Layer, Multiple-Beads Cladding
3.3.1. Influence of the Numbers of Beads and Their Dimensions
3.3.2. Influence of a Gap between the Beads
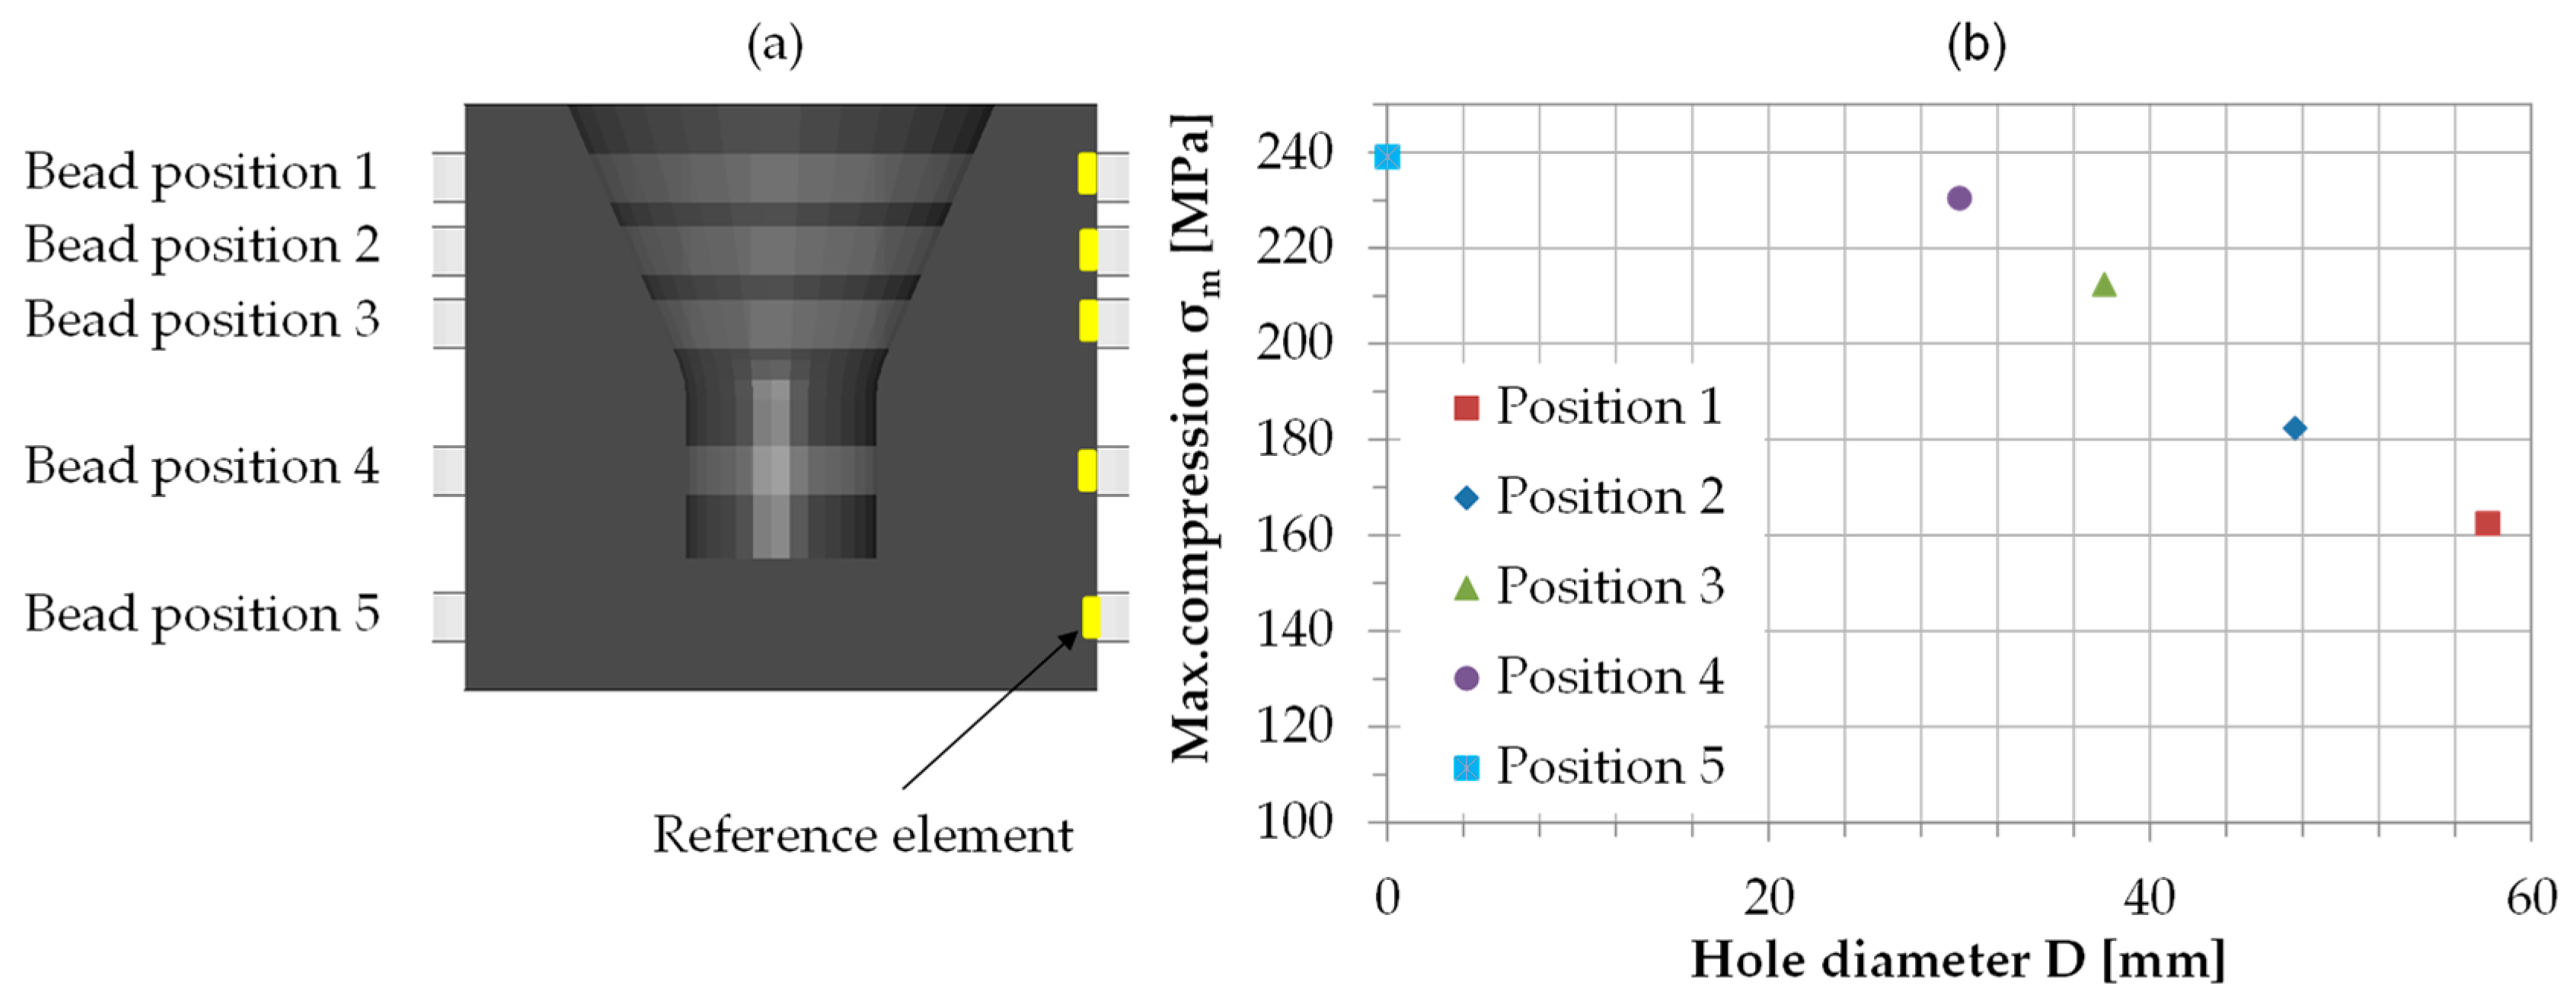
3.3.3. Influence of the Internal Hole in the Tool
3.3.4. Influence of a Time Delay between the Weld-Beads
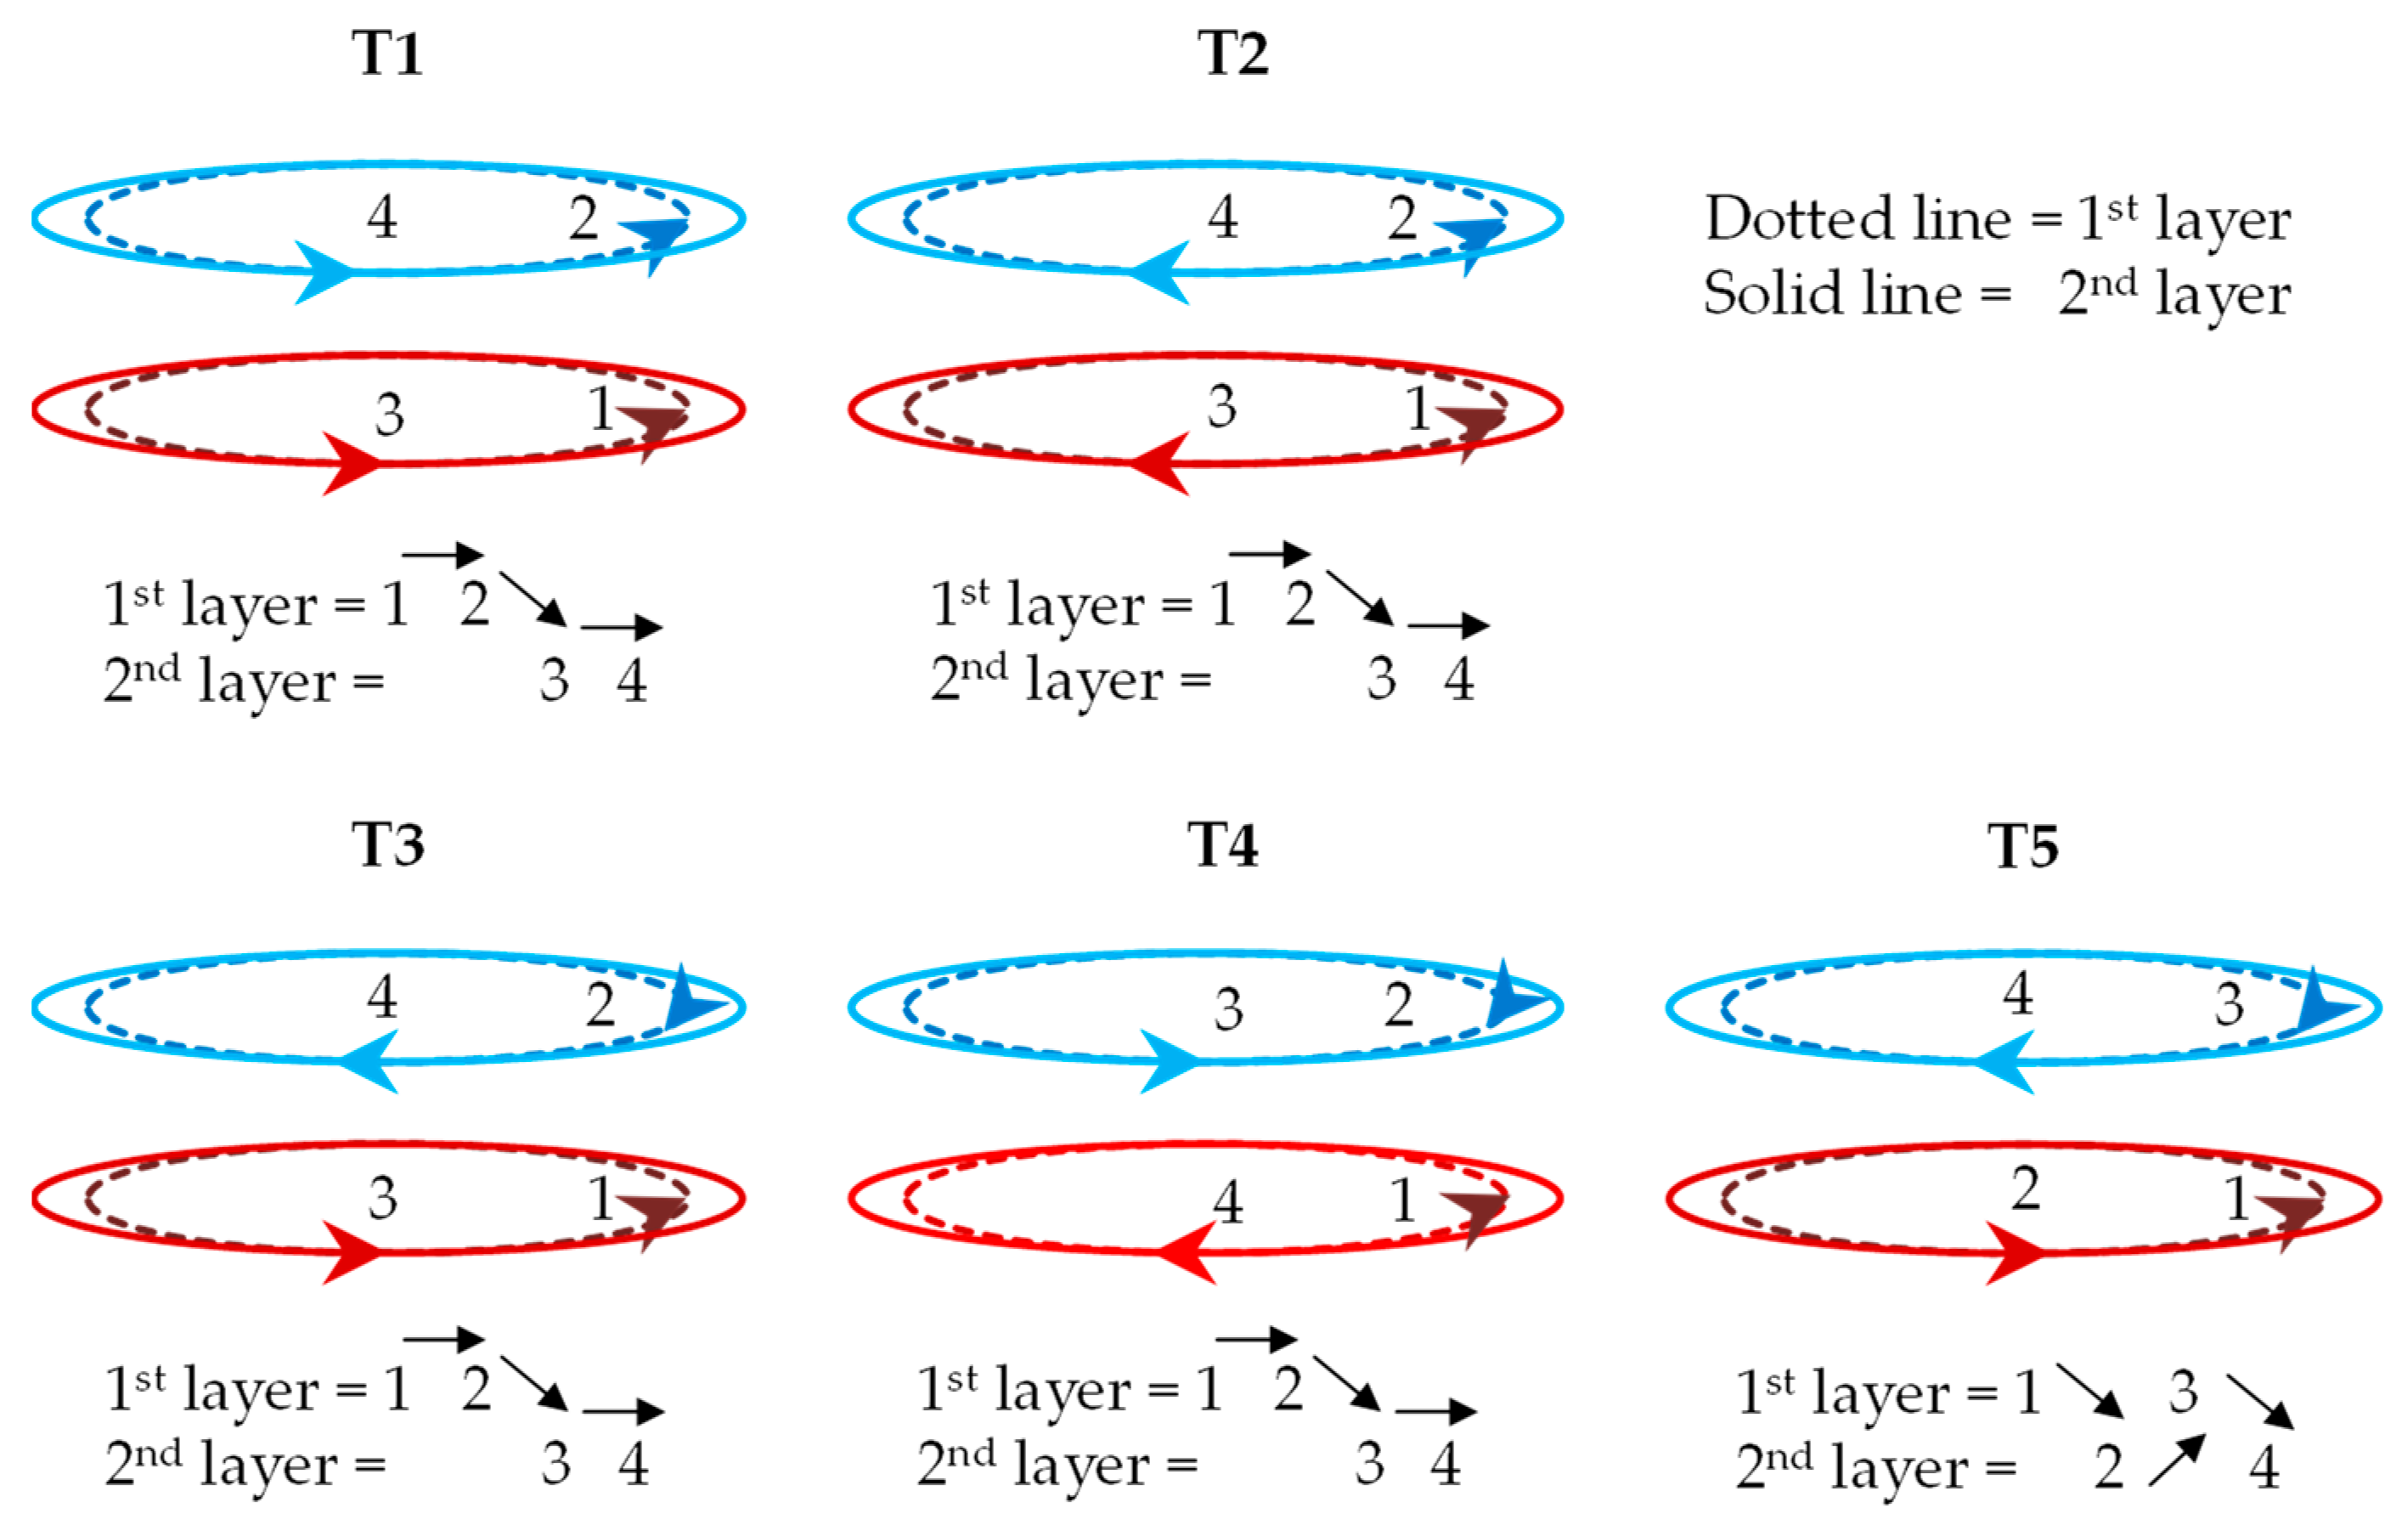
3.3.5. Influence of the Welding Direction
3.4. Optimization of the Multiple-Layered Weld-Cladding Patterns
- ➢
- 2 × 1 = A single layer of 2 beads welded parallel to each other.
- ➢
- 2 × 2 = Two welding layers, each layer having two parallel beads.
- ➢
- 2 × 3 = Three welding layers, each layer having two parallel beads.
3.4.1. Influence of Different Trajectories
3.4.2. Influence of Adding Multiple Layers
3.5. Maximum Compressive Stresses in Different Practical Scenarios
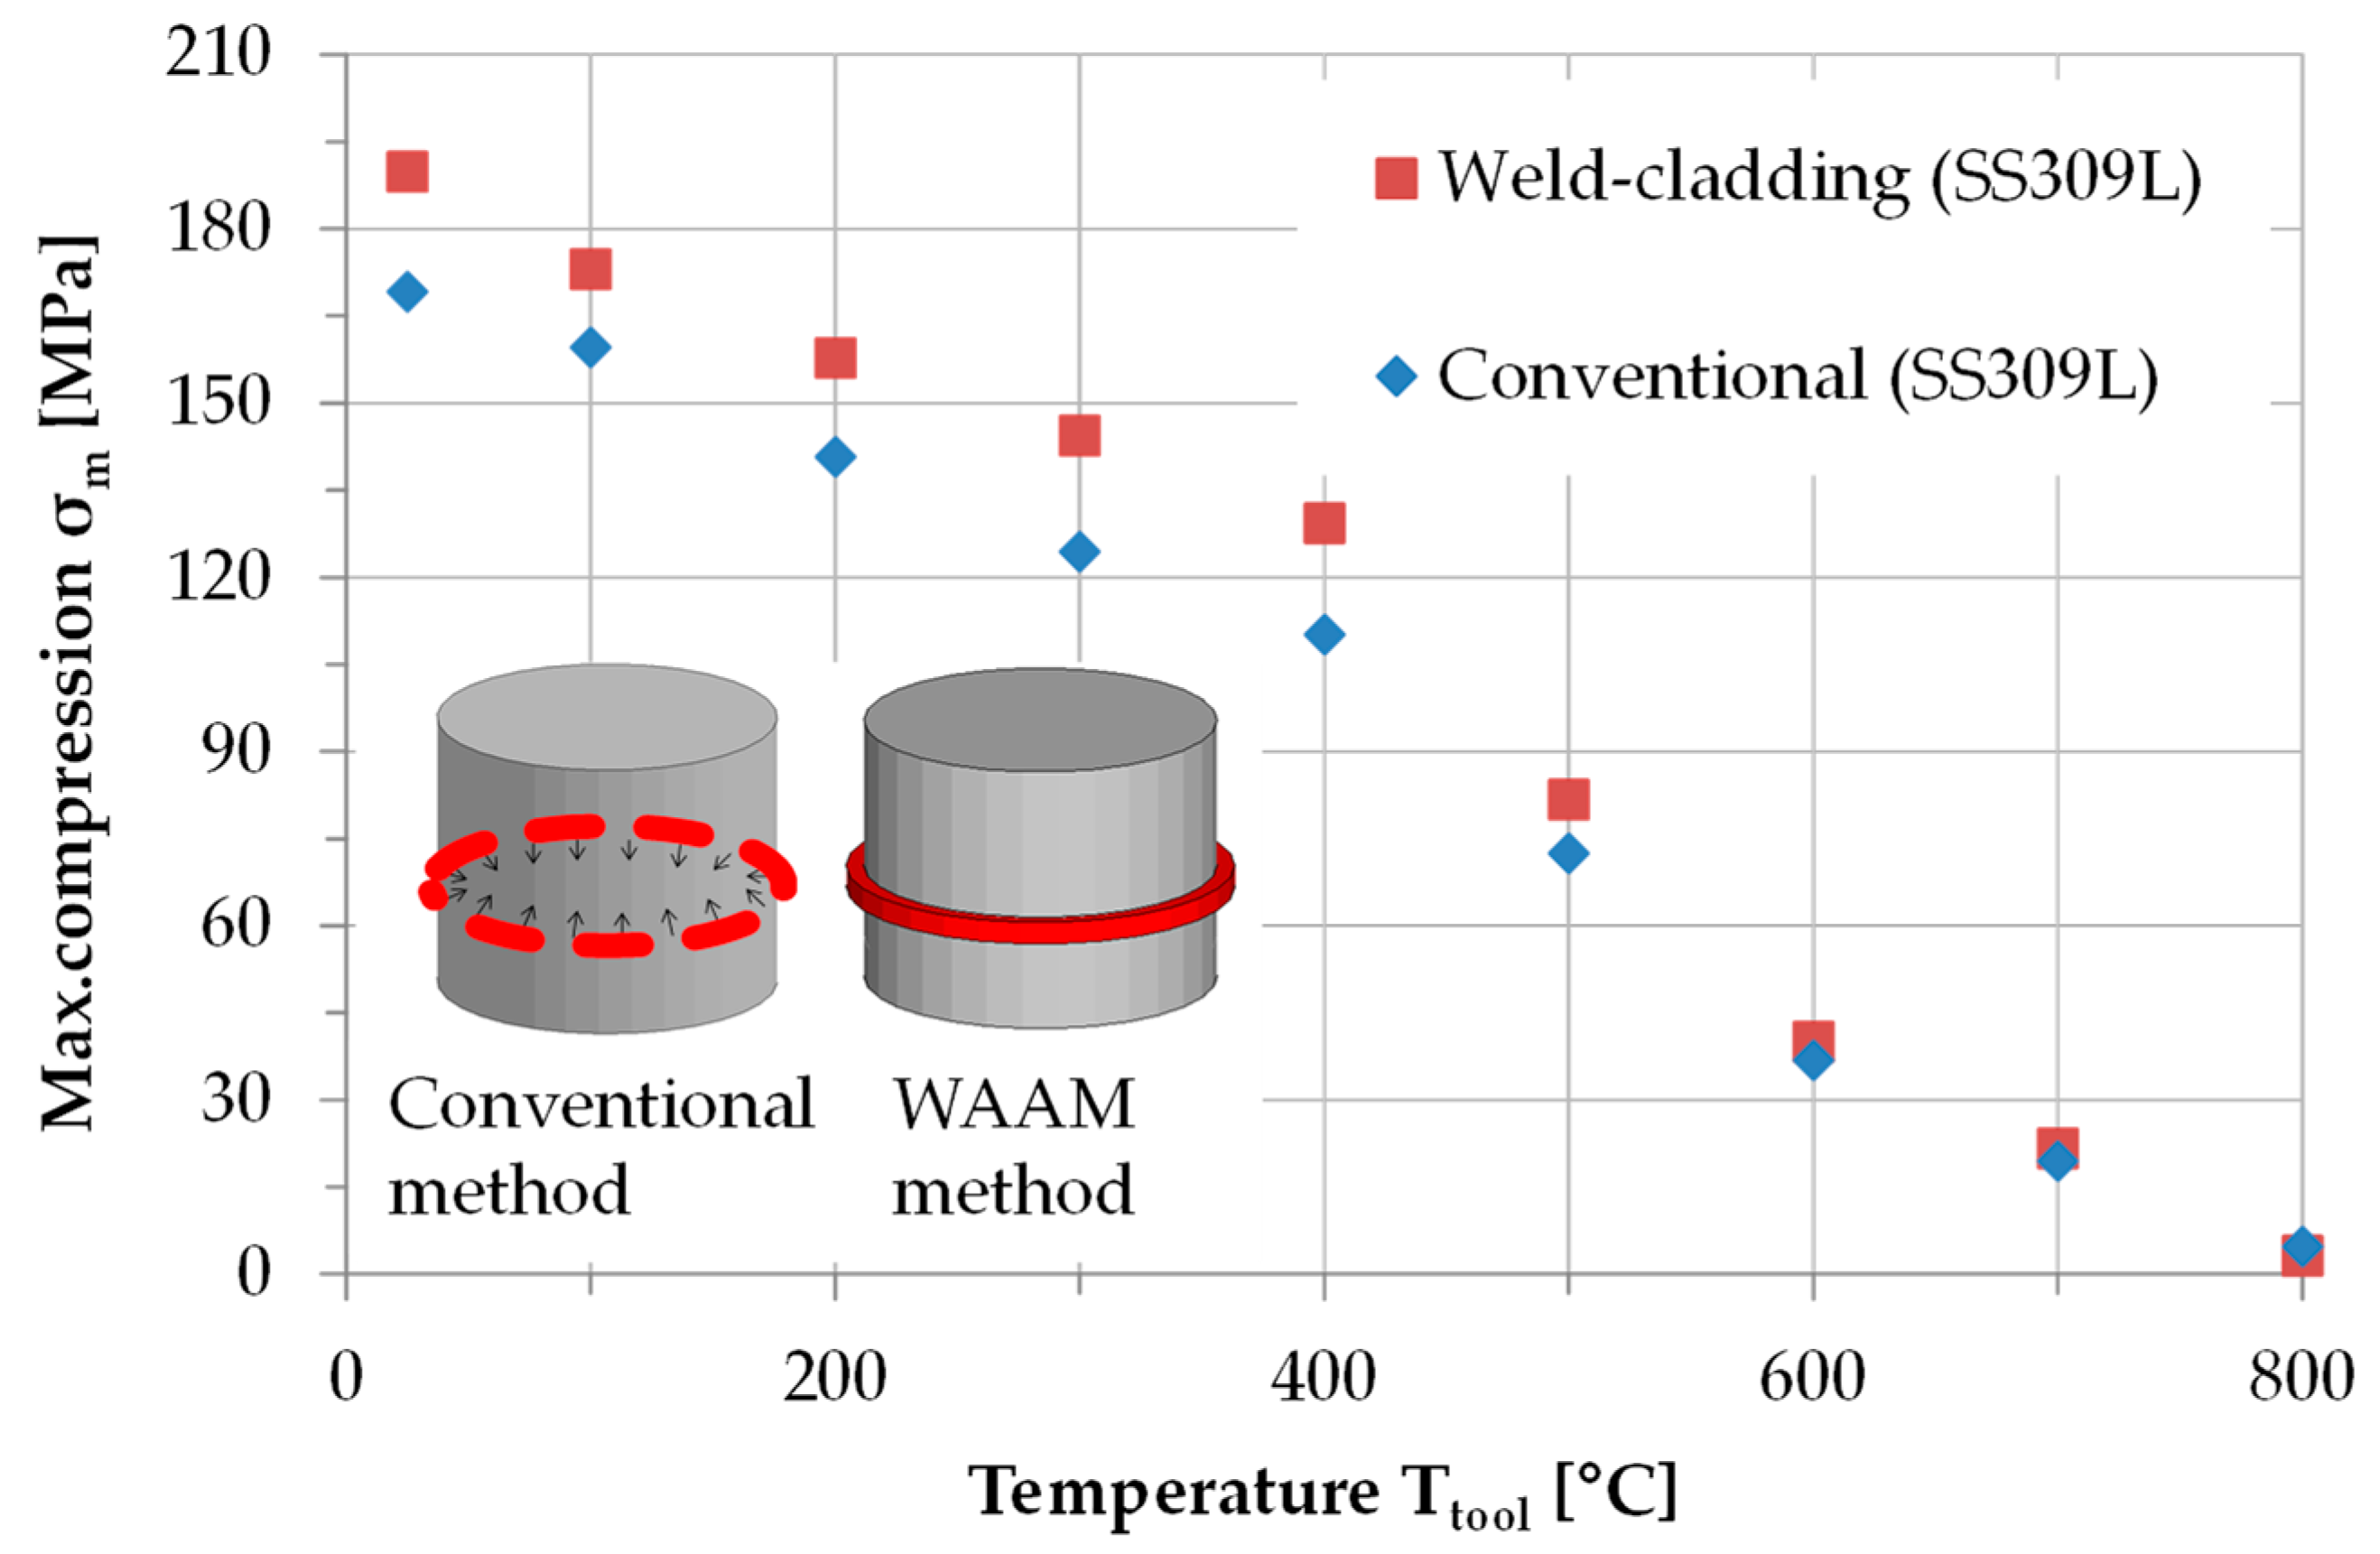
3.5.1. Reinforcement of the Tool under Operating Conditions
3.5.2. Influence of the Tool’s Diameter on the Maximum Compressive Stresses under Different Operating Conditions
- (i)
- Constant velocity: The welding velocity and heat input remained unchanged, while the welding time was adjusted based on the length of the welding path.
- (ii)
- Constant welding time: The welding time was constant, while the welding velocity and heat input were adjusted based on the cross-sectional area of the weld-bead.
- (iii)
- Maximal reinforcement: The entire bead was heated beyond the melting point and then cooled to room temperature using the efficient method.
3.5.3. Influence of Heat Source Velocity on Maximum Compressive Stresses
4. Discussion
5. Summary and Conclusions
- Approximately 40–60% of residual stresses in the tool surface are induced by mechanical contact of beads to the tool, while the rest developed due to repeated thermal cycles.
- The thermal contraction of the weld bead and the thermal expansion and contraction of the tool during the wire-arc welding process can be used to strengthen the tools.
- Repeated heating and cooling of beads accumulate heat within the model, resulting in slow cooling and reduced tool reinforcement.
- In the multiple bead welding process, reheating reduces the compressive stresses generated by the previous beads on the tool. With the 100 mm diameter of a tool, and beads of dimension A3 (h = 4 mm, w = 6 mm), establishing a minimum gap Δx ≥ 11 mm reduces the thermal influence of the adjacent beads.
- During welding, the weld bead with a larger cross-section should be preferred. The beads of dimension A4 (7.5 mm × 5 mm) introduced the maximum compressive stresses in the tool in almost all the welding patterns. Therefore, they can be adapted to reinforce the components more effectively.
- The weld-cladding of multiple beads (5-beads) in parallel sequence without delay adds more reinforcement to the tool and minimizes distortion compared to the welding with a time delay between each bead.
- Due to heat accumulation, adding each new layer in a multilayer weld-cladding process mitigates the compressive stresses in the tool. For example, when welding the tool with A4 beads, the 2-layered (2 × 2) pattern produced approximately 11–14% less compressive stresses than the 1-layered (2 × 1) pattern. Similarly, the 3-layered (2 × 3) pattern induced even less compressive stresses in the tool.
- The tool’s reinforcement is reduced to 98% of its initial value during an extrusion operation at an operating temperature of 800 °C.
- Internal features such as a hole or a notch reduce the tool’s stiffness.
- Increasing the tool and bead diameters improves heat flow and increases the maximum compressive stresses on the tool surface after cooling.
Author Contributions
Funding
Data Availability Statement
Acknowledgments
Conflicts of Interest
References
- Bambach, M.; Sviridov, A.; Weisheit, A.; Schleifenbaum, J. Case Studies on Local Reinforcement of Sheet Metal Components by Laser Additive Manufacturing. Metals 2017, 7, 113. [Google Scholar] [CrossRef]
- Teller, M.; Bambach, M.; Hirt, G.; Ross, I.; Temmler, A.; Poprawe, R.; Bolvardi, H.; Prünte, S.; Schneider, J.M. Investigation of the Suitability of Surface Treatments for Dry Cold Extrusion by Process-Oriented Tribological Testing. Key Eng. Mater. 2015, 651, 473–479. [Google Scholar] [CrossRef]
- Hope, M.J.; Bally, M.B.; Webb, G.; Cullis, P.R. Production of large unilamellar vesicles by a rapid extrusion procedure. Characterization of size distribution, trapped volume and ability to maintain a membrane potential. Biochim. Biophys. Acta (BBA) Biomembr. 1985, 812, 55–65. [Google Scholar] [CrossRef]
- Namburi, K.P.V.; Kothasiri, A.F.; Yerubandi, V.S.M. Modeling and simulation of Aluminum 1100 alloy in an extrusion process. Mater. Today Proc. 2019, 23, 518–522. [Google Scholar] [CrossRef]
- Schrader, T.; Shirgaokar, M.; Altan, T. A critical evaluation of the double cup extrusion test for selection of cold forging lubricants. J. Mater. Processing Technol. 2007, 189, 36–44. [Google Scholar] [CrossRef]
- Lee, H.Y.; Noh, J.H.; Hwang, B.B. Surface stresses and flow modes on contact surface in a combined double cup extrusion process. Tribol. Int. 2013, 64, 215–224. [Google Scholar] [CrossRef]
- Chen, L.-Y.; Liang, S.-X.; Liu, Y.; Zhang, L.-C. Additive manufacturing of metallic lattice structures: Unconstrained design, accurate fabrication, fascinated performances, and challenges. Mater. Sci. Eng. R Rep. 2021, 146, 100648. [Google Scholar] [CrossRef]
- Penumakala, P.K.; Santo, J.; Thomas, A. A critical review on the fused deposition modeling of thermoplastic polymer composites. Compos. Part B Eng. 2020, 201, 108336. [Google Scholar] [CrossRef]
- Liang, S.-X.; Wang, X.; Zhang, W.; Liu, Y.-J.; Wang, W.; Zhang, L.-C. Selective laser melting manufactured porous Fe-based metallic glass matrix composite with remarkable catalytic activity and reusability. Appl. Mater. Today 2020, 19, 100543. [Google Scholar] [CrossRef]
- Zare, H.R.; Darijani, H. A novel autofrettage method for strengthening and design of thick-walled cylinders. Mater. Des. 2016, 105, 366–374. [Google Scholar] [CrossRef]
- Arbak, M. Material Adapted Design of Cold Forging Tools Exemplified by Powder Metallurgical Tool Steels and Ceramics. Ph.D. Thesis, Friedrich-Alexander-Universität Erlangen-Nürnberg, Erlangen, Germany, 2012. [Google Scholar]
- Klocke, F. Manufacturing Processes 4; Springer: Berlin/Heidelberg, Germany, 2013. [Google Scholar]
- Lange, K. Massivumformung; Springer: Berlin, Germany, 1988. [Google Scholar]
- Tzeng, J.T.; Moy, P. Composite Energy Storage Flywheel Design for Fatigue Crack Resistance. IEEE Trans. Magn. 2009, 45, 480–484. [Google Scholar] [CrossRef]
- Haneklaus, N.; Reuven, R.; Cionea, C.; Hosemann, P.; Peterson, P.F. Tube expansion and diffusion bonding of 316L stainless steel tube-to-tube sheet joints using a commercial roller tube expander. J. Mater. Processing Technol. 2016, 234, 27–32. [Google Scholar] [CrossRef]
- Rees, D.W.A. The fatigue life of thick-walled autofrettaged cylinders with closed ends. Fat. Frac. Eng. Mat. Struct. 1991, 14, 51–68. [Google Scholar] [CrossRef]
- Kanber, B. Boundary Element Analysis of Interference Fits. Turk. J. Eng. Environ. Sci. 2006, 30, 323–330. [Google Scholar]
- ASI. American National Standard Preferred Hole Basis Metric Clearance Fits, 1978 (R2004). Available online: http://www.zpag.net/Usinage/standard_ansiB4_2_1978.htm (accessed on 2 March 2021).
- Schaeffler. Mounting and Dismounting of Rolling Bearings; Schaeffler Technologies: Schweinfurt, Germany, 2013. [Google Scholar]
- Mohan, A.; Jaisingh, J. Fatigue analysis of thermal shrink-fit autofrettage in pressure cylinder using finite element analysis. J. Mater. Res. Technol. 2020, 9, 8606–8617. [Google Scholar]
- Mather, J.; Baines, B.H. Distribution of stress in axially symmetrical shrink-fit assemblies. Wear 1972, 21, 339–360. [Google Scholar] [CrossRef]
- DriscoPlex. Engineering Considerations for Temperature Change. Available online: http://www.performancepipe.com/en-us/Documents/PP814-TN%20Thermal%20Effects.pdf (accessed on 17 July 2019).
- Abdelsalam, O.R. Design optimization for a three-layers shrink-fitted pressure vessel exposed to very high pressure. IOP Conf. Ser. Mater. Sci. Eng. 2019, 610, 12077. [Google Scholar] [CrossRef]
- Armanios, E.A.; Bucinell, R.B.; Wilson, D.W.; Tzeng, J.T. Viscoelastic Modeling of Press-Fitted Composite Cylinders. J. Compos. Technol. Res. 2001, 23, 21. [Google Scholar] [CrossRef]
- Beghini, M.; Loffredo, M.; Monelli, B.D.; Bagattini, A. Residual stress measurements in an autofrettaged cylinder through the Initial Strain Distribution method. Int. J. Press. Vessel. Pip. 2018, 168, 87–93. [Google Scholar] [CrossRef]
- Thumser, R.; Bergmann, J.W.; Vormwald, M. Residual stress fields and fatigue analysis of autofrettaged parts. Int. J. Press. Vessel. Pip. 2002, 79, 113–117. [Google Scholar] [CrossRef]
- Haghpanah Jahromi, B.; Farrahi, G.H.; Maleki, M.; Nayeb-Hashemi, H.; Vaziri, A. Residual stresses in autofrettaged vessel made of functionally graded material. Eng. Struct. 2009, 31, 2930–2935. [Google Scholar] [CrossRef]
- Shufen, R.; Dixit, U.S. An analysis of thermal autofrettage process with heat treatment. Int. J. Mech. Sci. 2018, 144, 134–145. [Google Scholar] [CrossRef]
- Kamal, S.M.; Borsaikia, A.C.; Dixit, U.S. Experimental assessment of residual stresses induced by the thermal autofrettage of thick-walled cylinders. J. Strain Anal. Eng. Des. 2016, 51, 144–160. [Google Scholar] [CrossRef]
- Malik, M.A.; Rashid, B.; Khan, M.; Khushnood, S. Modeling and Simulation of Residual Stresses in Mechanical Autofrettage. In Proceedings of the ASME 2005 International Mechanical Engineering Congress and Exposition, Orlando, FL, USA, 5–11 November 2005; pp. 905–913. [Google Scholar]
- Kaplan, M.; Glick, H.; Howell, W.; D’Souza, V. The Radial Piston Approach to the Explosive Autofrettage of Thickwalled Forging Dies. In Proceedings of the Thirteenth International Machine Tool Design and Research Conference, Birmingham, UK, 18–22 September 1972; Tobias, S.A., Koenigsberger, F., Eds.; Macmillan Education: London, UK, 1973; pp. 419–426. [Google Scholar]
- Zare, H.R.; Darijani, H. Strengthening and design of the linear hardening thick-walled cylinders using the new method of rotational autofrettage. Int. J. Mech. Sci. 2017, 124, 1–8. [Google Scholar] [CrossRef]
- Perl, M.; Saley, T. The detrimental effect of autofrettage on externally cracked modern tank gun barrels. Def. Technol. 2019, 15, 146–153. [Google Scholar] [CrossRef]
- Gavriljuk, V.G.; Berns, H.; Escher, C.; Glavatskaya, N.I.; Sozinov, A.; Petrov, Y.N. Grain boundary strengthening in austenitic nitrogen steels. Mater. Sci. Eng. A 1999, 271, 14–21. [Google Scholar] [CrossRef]
- Cáceres, C.H.; Rovera, D.M. Solid solution strengthening in concentrated Mg–Al alloys. J. Light Met. 2001, 1, 151–156. [Google Scholar] [CrossRef]
- Morita, T.; Hatsuoka, K.; Iizuka, T.; Kawasaki, K. Strengthening of Ti–6Al–4V Alloy by Short-Time Duplex Heat Treatment. Mater. Trans. 2005, 46, 1681–1686. [Google Scholar] [CrossRef]
- Gladman, T. Precipitation hardening in metals. Mater. Sci. Technol. 2013, 15, 30–36. [Google Scholar] [CrossRef]
- Zehetbauer, M.; Seumer, V. Cold work hardening in stages IV and V of F.C.C. metals—I. Experiments and interpretation. Acta Metall. Mater. 1993, 41, 577–588. [Google Scholar] [CrossRef]
- Venkateswara Rao, N.; Madhusudhan Reddy, G.; Nagarjuna, S. Weld overlay cladding of high strength low alloy steel with austenitic stainless steel—Structure and properties. Mater. Des. 2011, 32, 2496–2506. [Google Scholar] [CrossRef]
- Ufrgs, L.; Alia, B.L.; Alley, R.L.; Apblett, W.R., Jr.; Baeslack, W.A.; Ballis, W.; Bampton, C.C.; Banerjee, P.; Banker, J.G.; Bartifay, R.G.; et al. Welding, Brazing and Soldering: ASM Handbook, 9th ed.; ASM International: Materials Park, OH, USA, 1983. [Google Scholar]
- Pan, Y.-M.; Chen, S.-W. Research on overlaying welding rod of high hardness maraging steel. Front. Mech. Eng. China 2006, 1, 465–467. [Google Scholar] [CrossRef]
- Jiang, W.C.; Wang, B.Y.; Gong, J.M.; Tu, S.T. Finite element analysis of the effect of welding heat input and layer number on residual stress in repair welds for a stainless steel clad plate. Mater. Des. 2011, 32, 2851–2857. [Google Scholar] [CrossRef]
- Benghalia, G.; Wood, J. Autofrettage of Weld Clad Components. Procedia Eng. 2015, 130, 453–465. [Google Scholar] [CrossRef][Green Version]
- Schnier, G.; Wood, J.; Galloway, A. Investigating the Effects of Process Variables on the Residual Stresses of Weld and Laser Cladding. Adv. Mater. Res. 2014, 996, 481–487. [Google Scholar] [CrossRef]
- Luo, F.; Yao, J.-H.; Hu, X.-X.; Chai, G.-Z. Effect of Laser Power on the Cladding Temperature Field and the Heat Affected Zone. J. Iron Steel Res. Int. 2011, 18, 73–78. [Google Scholar] [CrossRef]
- Gao, W.; Zhao, S.; Wang, Y.; Zhang, Z.; Liu, F.; Lin, X. Numerical simulation of thermal field and Fe-based coating doped Ti. Int. J. Heat Mass Transf. 2016, 92, 83–90. [Google Scholar] [CrossRef]
- Kumar, A.; Roy, S. Effect of three-dimensional melt pool convection on process characteristics during laser cladding. Comput. Mater. Sci. 2009, 46, 495–506. [Google Scholar] [CrossRef]
- Hosseini, A.V.; Hurtig, K.; Karlsson, L. Bead by bead study of a multipass shielded metal arc-welded super-duplex stainless steel. Weld World 2020, 64, 283–299. [Google Scholar] [CrossRef]
- Smith, M.C.; Smith, A.C.; Wimpory, R.; Ohms, C. A review of the NeT Task Group 1 residual stress measurement and analysis round robin on a single weld bead-on-plate specimen. Int. J. Press. Vessel. Pip. 2014, 120, 93–140. [Google Scholar] [CrossRef]
- Karlsson, L.; Goldak, J. Computational Welding Mechanics. In Encyclopedia of Thermal Stresses; Hetnarski, R.B., Ed.; Springer: Dordrecht, The Netherlands, 2014; pp. 630–637. [Google Scholar]
- Modelling Options in Computational Welding Mechanics (CWM). Computational Welding Mechanics; Elsevier: Amsterdam, The Netherlands, 2007; pp. 119–163. [Google Scholar]
- Foroozmehr, E.; Kovacevic, R. Effect of path planning on the laser powder deposition process: Thermal and structural evaluation. Int. J. Adv. Manuf. Technol. 2010, 51, 659–669. [Google Scholar] [CrossRef]
- Buhl, J.; Israr, R.; Bambach, M. Modeling and convergence analysis of directed energy deposition simulations with hybrid implicit/explicit and implicit solutions. J. Mach. Eng. 2019, 19, 95–108. [Google Scholar] [CrossRef]
- Kerfriden, P.; Claus, S.; Mihai, I. A mixed-dimensional CutFEM methodology for the simulation of fibre-reinforced composites. Adv. Model. Simul. Eng. Sci. 2020, 7, 1–26. [Google Scholar] [CrossRef][Green Version]
- Buhl, J.; Klöppel, T.; Merten, M.; Haufe, A.; Rameez, I.; Bambach, M. Numerical prediction of process-dependent properties of high-performance Ti6Al4 in LS-DYNA. In Proceedings of the 24th International Conference on Material Forming, Liege, Belgium, 14–16 April 2021. [Google Scholar]
- Simufact. Info-Sheet Heat Source. Available online: https://studylib.net/doc/8338133/info-sheet-heat-source (accessed on 20 June 2019).
- Goldak, J.; Chakravarti, A.; Bibby, M. A new finite element model for welding heat sources. Metall. Trans. B 1984, 15, 299–305. [Google Scholar] [CrossRef]
- Israr, R. Simulation of Different Path Strategies for Wire-Arc Additive Manufacturing with Lagrangian Finite Element Methods; Israr, R., Buhl, J., Elze, L., Bambach, M., Eds.; Brandenburg University of Technology: Cottbus, Germany, 2018. [Google Scholar]
- Israr, R.; Buhl, J.; Bambach, M. Numerical Analysis of Different Fixation Strategies in Direct Energy Deposition Processes. Procedia Manuf. 2020, 47, 1184–1189. [Google Scholar] [CrossRef]
- Israr, R.; Buhl, J.; Bambach, M. A study on power-controlled wire-arc additive manufacturing using a data-driven surrogate model. Int. J. Adv. Manuf. Technol. 2021, 117, 2133–2147. [Google Scholar] [CrossRef]
- Ur Rehman, M.A.; Farooq, O.; Khalid, A.; Niaz, A. Effect of Delay Time between Welding and Stress Relieve Annealing on Mechanical Properties and Distortion of 30CrMnSiA Steel. Stud. Res. Pap. Conf. 2015, 2, 49. [Google Scholar]
- Teng, T.-L.; Chang, P.-H.; Tseng, W.-C. Effect of welding sequences on residual stresses. Comput. Struct. 2003, 81, 273–286. [Google Scholar] [CrossRef]
- Linde. Advantage Welding Wire, Mild Steel, 70S6 0.035″, 44 Lb Spool. Available online: https://www.lindedirect.com/catalogs/item-content/adg035-e70s6-44/advantage/pr_70139684#:~:text=ER70S%2D6%20contains%20higher%20levels,in%20minimal%20post%2Dweld%20grinding (accessed on 20 May 2022).
- American Welding Society. Specification for Carbon Steel Electrodes and Rods for Gas Shielded Arc Welding (ANSI/AWS A5.18-93); American Welding Society: Miami, FL, USA, 1993; Available online: http://www.esfahanfoolad.com/UserImages/file/Standards/101.pdf (accessed on 28 August 2019).
- Deutsches Institut für Normung DIN. Material Specification Sheet (DIN-EN-10025-2). Available online: http://www.steelss.com/Carbon-steel/s235.html (accessed on 21 October 2019).
- Ge, J.; Lin, J.; Lei, Y.; Fu, H. Location-related thermal history, microstructure, and mechanical properties of arc additively manufactured 2Cr13 steel using cold metal transfer welding. Mater. Sci. Eng. A 2018, 715, 144–153. [Google Scholar] [CrossRef]
- Nguyen, L.; Buhl, J.; Bambach, M. Continuous Eulerian tool path strategies for wire-arc additive manufacturing of rib-web structures with machine-learning-based adaptive void filling. Addit. Manuf. 2020, 35, 101265. [Google Scholar] [CrossRef]
- Yadaiah, N.; Bag, S. Effect of Heat Source Parameters in Thermal and Mechanical Analysis of Linear GTA Welding Process. ISIJ Int. 2012, 52, 2069–2075. [Google Scholar] [CrossRef]
- LS-DYNA Support. Equation of State. Available online: https://www.dynasupport.com/howtos/general/equation-of-state (accessed on 6 March 2020).
- Jousten, K.; Hendricks, J.; Barker, D.; Douglas, K.; Eckel, S.; Egan, P.; Fedchak, J.; Flügge, J.; Gaise, C.; Olson, D.; et al. Perspectives for a new realization of the pascal by optical methods. Metrologia 2017, 54, S146–S161. [Google Scholar] [CrossRef]
- Lanxess. Shrinkage and Distortion Calculation. Available online: https://techcenter.lanxess.com/scp/americas/en/techServscp/79017/article.jsp?print=true&docId=79015 (accessed on 5 July 2019).
- Hu, Z.; Qin, X.; Shao, T. Welding Thermal Simulation and Metallurgical Characteristics Analysis in WAAM for 5CrNiMo Hot Forging Die Remanufacturing. Procedia Eng. 2017, 207, 2203–2208. [Google Scholar] [CrossRef]
- Ganguly, S.; Sule, J.; Yakubu, M.Y. Stress Engineering of Multi-pass Welds of Structural Steel to Enhance Structural Integrity. J. Mater. Eng Perform 2016, 25, 3238–3244. [Google Scholar] [CrossRef]
- Mughal, M.P.; Fawad, H.; Mufti, R. Finite element prediction of thermal stresses and deformations in layered manufacturing of metallic parts. Acta Mech. 2006, 183, 61–79. [Google Scholar] [CrossRef]
- Holzapfel, H.; Schulze, V.; Vöhringer, O.; Macherauch, E. Residual stress relaxation in an AISI 4140 steel due to quasistatic and cyclic loading at higher temperatures. Mater. Sci. Eng. A 1998, 248, 9–18. [Google Scholar] [CrossRef]
- Juijerm, P.; Altenberger, I. Effect of temperature on cyclic deformation behavior and residual stress relaxation of deep rolled under-aged aluminium alloy AA6110. Mater. Sci. Eng. A 2007, 452, 475–482. [Google Scholar] [CrossRef]
- Ravisankar, A.; Velaga, S.K.; Rajput, G.; Venugopal, S. Influence of welding speed and power on residual stress during gas tungsten arc welding (GTAW) of thin sections with constant heat input: A study using numerical simulation and experimental validation. J. Manuf. Processes 2014, 16, 200–211. [Google Scholar] [CrossRef]
- Karolczuk, A.; Kluger, K.; Derda, S.; Prażmowski, M.; Paul, H. Influence of Impact Velocity on the Residual Stress, Tensile Strength, and Structural Properties of an Explosively Welded Composite Plate. Materials 2020, 13, 2686. [Google Scholar] [CrossRef]


| Parameter | Symbol | A1 | A2 | A3 | A4 |
|---|---|---|---|---|---|
| Weld pool width | a | 2.25 mm | 2.5 mm | 3.0 mm | 3.75 mm |
| Weld pool depth | b | 3.0 mm | 3.3 mm | 4.0 mm | 5.0 mm |
| Weld pool (forward direction) | cf | 1.5 mm | 1.6 mm | 2.0 mm | 2.5 mm |
| Weld pool (rear direction) | cr | 6.0 mm | 6.4 mm | 8.0 mm | 10.0 mm |
| Weld pool energy | Q | 1840 W | 2248 W | 3271 W | 5111 W |
| Parameter | Value |
|---|---|
| Welding current [I] | 141 A |
| Welding voltage [U] | 13.2 V |
| Torch travel speed [TS] | 7.5 mm/s |
| Wire feed [WF] | 123 mm/s |
| Material | Element (Wt %) | |||||
|---|---|---|---|---|---|---|
| C | Mn | Si | P | S | Cr + Mo + Ni | |
| ER70 S-6 | 0.06–0.15 | 1.4–1.85 | 0.8–1.15 | 0.025 | 0.035 max | <0.63 |
| S235 | 0.17 max | 1.40 max | - | 0.045 max | 0.045 max | - |
Publisher’s Note: MDPI stays neutral with regard to jurisdictional claims in published maps and institutional affiliations. |
© 2022 by the authors. Licensee MDPI, Basel, Switzerland. This article is an open access article distributed under the terms and conditions of the Creative Commons Attribution (CC BY) license (https://creativecommons.org/licenses/by/4.0/).
Share and Cite
Israr, R.; Buhl, J.; Härtel, S.; Bambach, M. Reinforcement of Tooling Using Residual Stresses Generated by Cladding by Arc Welding. Metals 2022, 12, 984. https://doi.org/10.3390/met12060984
Israr R, Buhl J, Härtel S, Bambach M. Reinforcement of Tooling Using Residual Stresses Generated by Cladding by Arc Welding. Metals. 2022; 12(6):984. https://doi.org/10.3390/met12060984
Chicago/Turabian StyleIsrar, Rameez, Johannes Buhl, Sebastian Härtel, and Markus Bambach. 2022. "Reinforcement of Tooling Using Residual Stresses Generated by Cladding by Arc Welding" Metals 12, no. 6: 984. https://doi.org/10.3390/met12060984
APA StyleIsrar, R., Buhl, J., Härtel, S., & Bambach, M. (2022). Reinforcement of Tooling Using Residual Stresses Generated by Cladding by Arc Welding. Metals, 12(6), 984. https://doi.org/10.3390/met12060984