Article

Experimental and Numerical Analysis of Steel Beams’ Efficiency with Different Shapes of Corrugated Webs under Free Vibrations

by
Ahmed Mohamed Sayed
1,2,*,
Yassir G. Elaraki
2 and
Oussama Elalaoui
2
1
Department of Civil Engineering, College of Engineering, Assiut University, Assiut 71511, Egypt
2
Department of Civil and Environmental Engineering, College of Engineering, Majmaah University, Al-Majmaah 11952, Saudi Arabia
*
Author to whom correspondence should be addressed.
Metals 2022, 12(6), 938; https://doi.org/10.3390/met12060938
Submission received: 26 April 2022 / Revised: 23 May 2022 / Accepted: 27 May 2022 / Published: 29 May 2022

Abstract

:
The use of corrugated webs in steel beams has become one of the most practical ways to increase the efficiency of beams in resisting loads, natural frequencies, and their resulting displacements. Such a practice has the benefit of achieving the same efficiency as beams with a flat web with a greater thickness. Consequently, the effect of the types of corrugated webs on the flexure mode shapes and natural frequencies in the steel beams has been investigated by analyzing 23 beams with flat and corrugated webs using the finite element (FE) numerical analysis technique. Hence, two flat web steel beams with and without stiffeners were experimentally tested and compared to FE numerical modeling results. Moreover, three types (trapezoidal, rectangular, triangular) of corrugated webs were tested and studied in addition to other parameters such as thickness, width, length, and angle. The investigation results show that FE numerical analysis is very highly accurate in predicting the natural frequencies and flexure mode shape changes of beams with corrugated webs. Accordingly, a saving of at least 33% in thickness could be realized as compared to the flat type. The triangular corrugated web is more efficient in the 1st mode shape, while rectangular is better for the other modes. The effectiveness of the angle for the triangular type in resisting mode shape and frequencies was clearly noticed, and decreases of 0.60 and 0.78, respectively, were recorded. It is also perceived that the effect of thickness and angle is linear for specified cases.

1. Introduction

The corrugated web in steel elements (beams and columns) has become one of the most useful ways to increase the resistance and efficiency of the elements without using stiffeners for the webs. Many types of corrugated webs, such as trapezoidal, rectangular, triangular, and sinusoidal, could be used. Numerous researchers have concluded that the adoption of corrugated webs provides thickness over flat webs. In addition, an increase in the resistance to external loads and a change in the failure mode from global to local buckling was observed [1,2]. Chan et al. [3] tested steel beams with vertical and horizontal corrugated web sinusoidal types with a thickness of 4 mm. The vertical corrugated web type demonstrated greater moment capacity than the horizontal type. Sayed-Ahmed [4] and Kazemi nia Korrani [5] studied finite element (FE) numerical analysis on the lateral stability and lateral-torsional buckling of corrugated web beams. They showed that the resistance to lateral-torsional buckling of the flat web is less than the resistance of the corrugated web. Numerous other studies have taken into consideration the effect of different types of loads, such as flexural and lateral-torsional moments [6,7,8], shear forces [9,10,11], fatigue loads [12,13], and cyclic loads [14,15,16]. However, few types of research have been performed to explore the effect of flexure displacement mode shapes and natural frequencies on beams with corrugated webs under the influence of free vibrations.
Vibration testing has emerged as a powerful tool targeting efficient monitoring systems to monitor and inspect structures. Brownjohn et al. [17,18] studied a suspension bridge’s ambient vibration (wind and traffic excitation), providing resonant frequencies, mode shapes, and damping ratios. They proposed a numerical model updating scheme based on the measurement results to describe the deterioration and assess the effective stiffness. Zhong and Oyadiji [19,20] presented a crack detection method based on finding the difference between two sets of detailed coefficients obtained using the wavelet transform of two sets of mode shape data of a cracked beam. Previous studies [21,22,23,24] have highlighted the importance of using displacement mode shapes to specify the behavior of structural elements by examining the presence of eventual damage and their locations. Rucevskis et al. [25] described a method that requires only the mode shape curvature data of the damaged structures. In this method, the damage index is defined as the absolute difference between the measured curvature of the damaged and the undamaged structures. The structure was subject to free vibration to determine the elements’ efficiency and their resistance to loads [26,27,28,29].
Previous studies used several methods to evaluate the flexure mode shapes and natural frequencies of steel beams, but it was performed on steel beams with flat webs only, whether with or without stiffener. The steel beams with corrugated webs have also been studied very widely under the influence of many types of static loads, but these corrugated webs have not been studied in resistance to the flexure mode shapes and natural frequencies. Therefore, this study will mainly focus on the effect of the corrugated web shape and the efficiency with the comparison to the flat web in resisting flexure displacement mode shapes and natural frequencies using FE numerical analysis. Three forms of corrugated webs were used (trapezoidal, rectangular, and triangular), and studied for various parameters that may affect each type of corrugated webs, such as thickness, width, length, and angle of inclination of the corrugated web. In order to facilitate the comparison process and determine the best one in terms of efficiency, normalization was performed by dividing the measured values over the largest measured value of the control beam, obtained from the models of beams.
A considerable number of recent studies confirmed the efficiency of FE numerical analysis in modeling structural elements, namely those made from steel structures. Numerical analysis was conducted in the modeling of damaged elements [30,31]. The accuracy of predicted results has a mean ratio of 1.007, a variation coefficient (COV) of 1.24%, and a correlation coefficient (r) of about 0.996. Numerical analysis was also used to model the elements subjected to free vibration [32,33], to shear force [34], and those subjected to axial force [35] for fixed mean values of the yield stress, modulus of elasticity, ultimate stress, and ultimate strain equal to 1.02, 1.00, 1.003, and 1.016, respectively. Other studies have considered other more complex steel elements, such as overlapped tubular joints under the influence of axial loads or bending in- or out-of-plane [36,37,38]. It has also proven to be highly accurate in representing these elements when compared to experimental tests. The findings mentioned above showed that FE numerical analysis affords very high accuracy in modeling various structural elements. Validation of simulated models was assessed employing the experimental testing program performed on two flat web steel beams. Flexure displacement mode shapes and natural frequencies were measured at different stages.

2. Potential Contributions

The previous literature considered the study and analysis of steel beams with corrugated webs under the influence of static and dynamic loads, as well as the study of steel beams with flat webs with or without stiffeners under the influence of free vibrations. They also studied and analyzed the use of the FE analysis system in modeling the various steel elements and showed that the results are highly accurate compared with experimental results. This literature review noted that there is a deficiency in the study of steel beams with corrugated webs under the influence of free vibrations. Therefore, here, modeling will be performed using FE numerical analysis on steel beams with corrugated webs under the influence of free vibrations and finding the effect on different flexure mode shapes. The corrugated webs are used in the steel beams rather than the flat webs because they have a significant effect on raising the efficiency of the steel beams if the same thickness was used, or savings in the volume of steel material used to make the web if what is required is a steel beam with efficiency similar to the beam with the flat web. This research will make two steel beams with a flat web, one without stiffeners and the other with stiffeners. The effect on these beams by free vibrations and the definition of the extent of this effect on different flexure mode shapes will be analyzed. Then, these results will be used to verify the accuracy of using FE numerical analysis to model such steel elements. After ensuring the accuracy of using FE numerical analysis, an analysis will be performed on beams with corrugated webs of different shapes and variables to see the effect on the efficiency of these beams under the influence of free vibrations. In this research, no experimental tests were performed on the steel beams with corrugated webs for two reasons. The first was to save the time and costs required to make beams with corrugated webs, as 21 steel beams with corrugated webs were tested. Secondly, the results prove that using FE numerical analysis can analyze such steel elements with high accuracy, so it was used as an alternative to expensive laboratory tests. Nevertheless, it was necessary to perform an experimental test analysis on steel beams under the influence of free vibrations to be able to measure the accuracy of using FE numerical analysis in this type of load.

3. Testing Programs

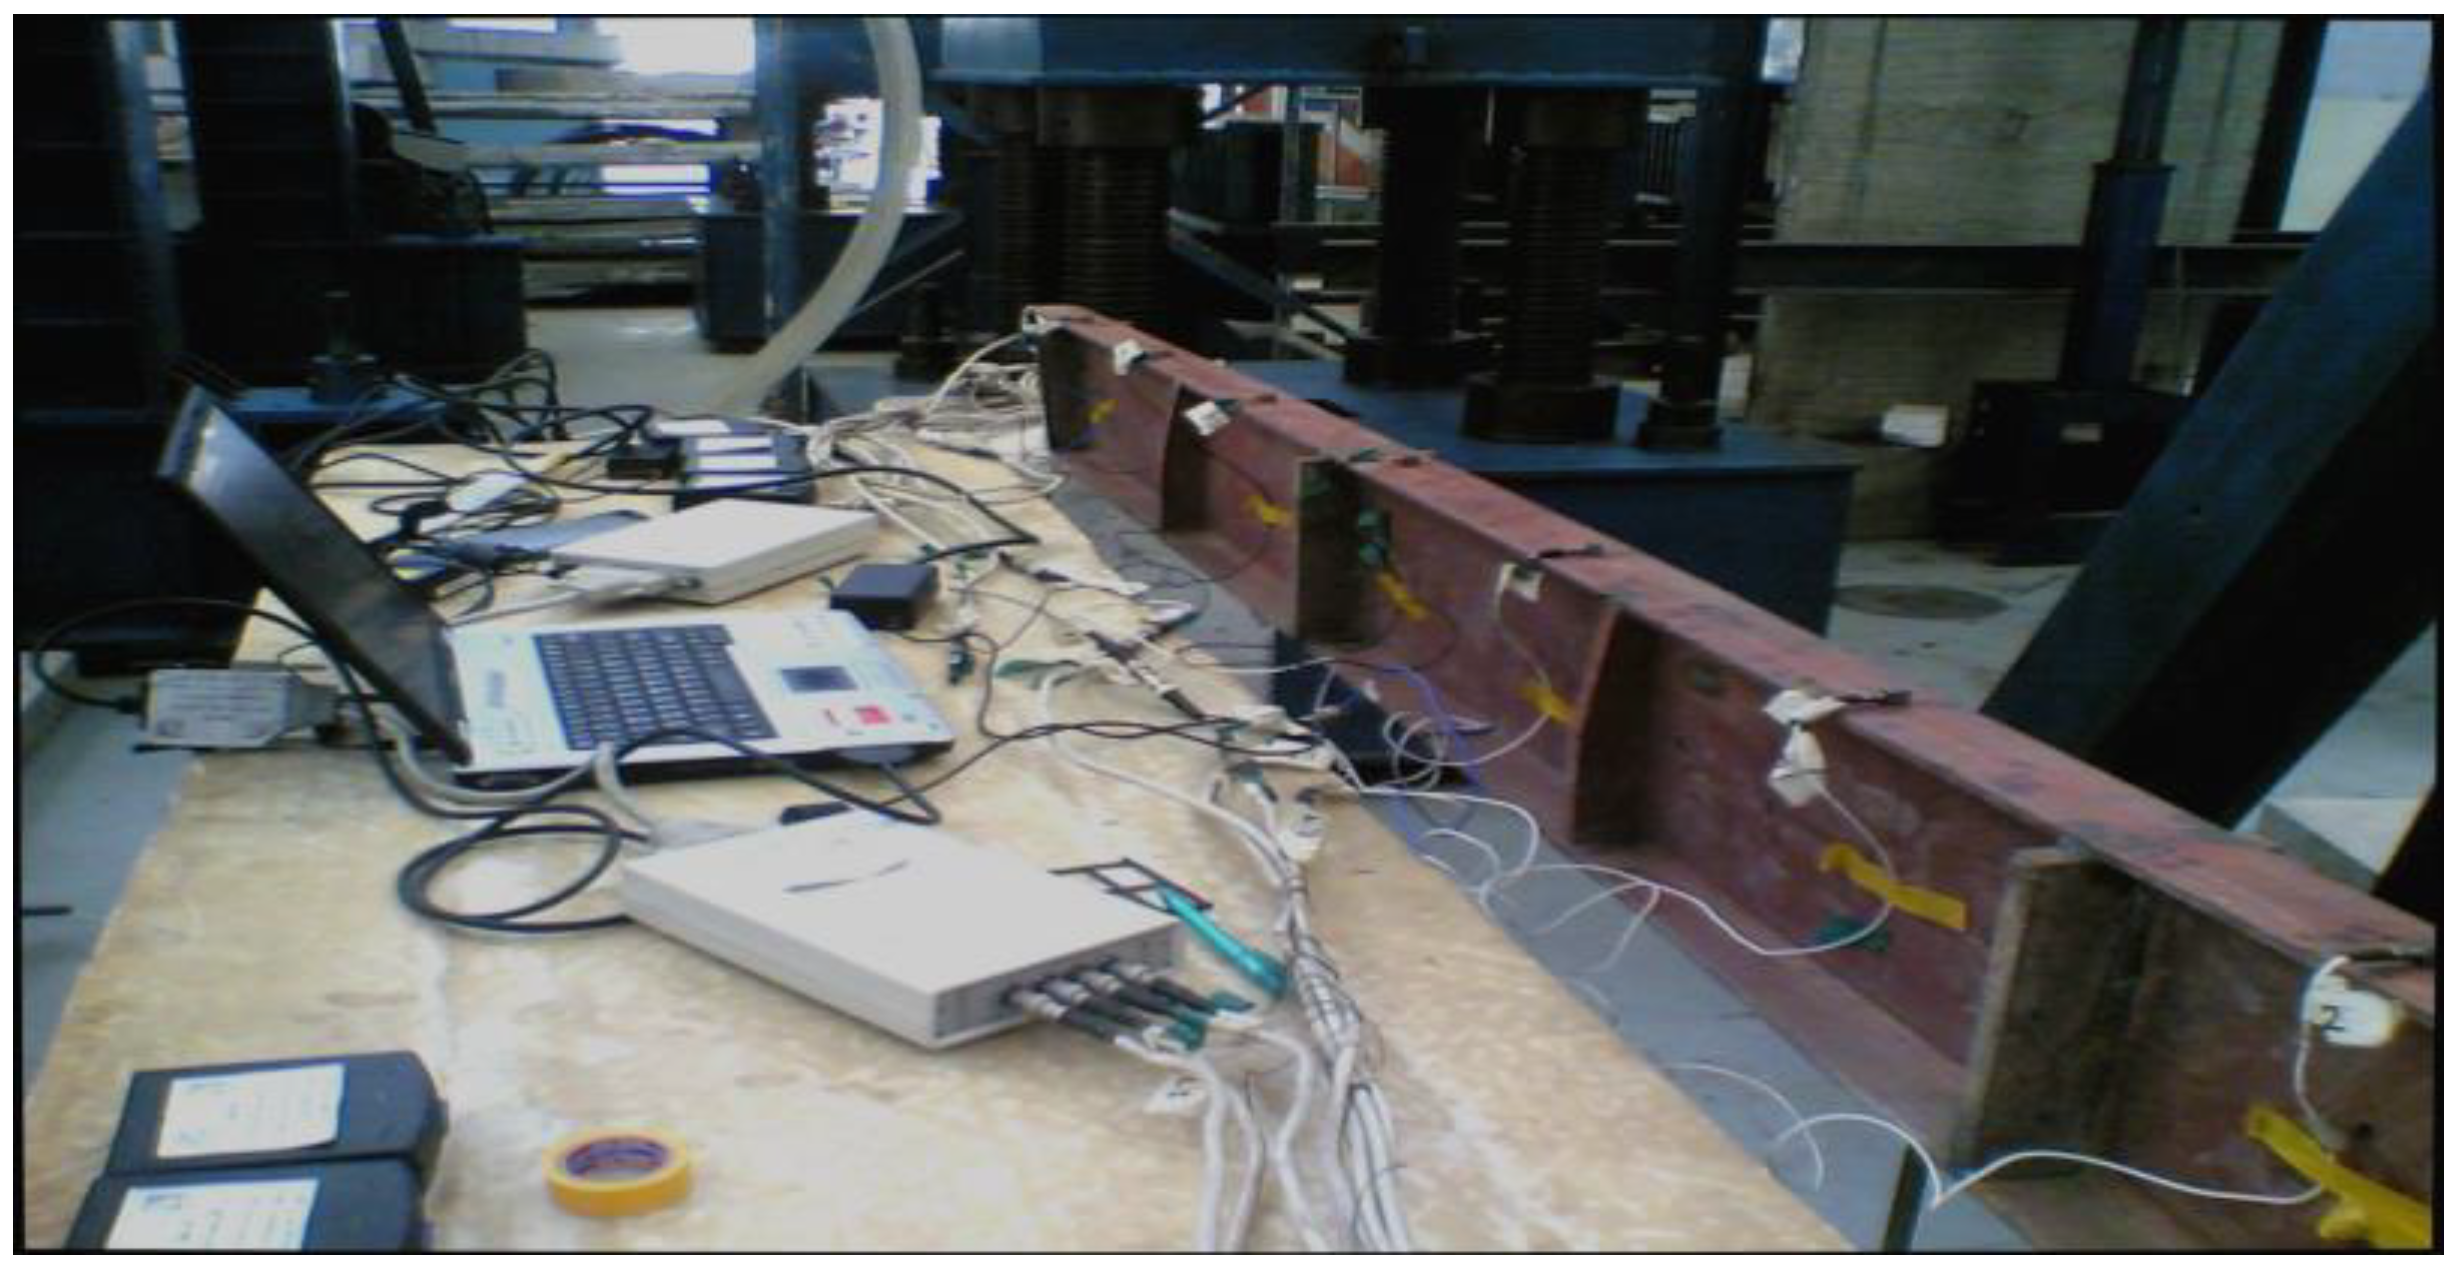
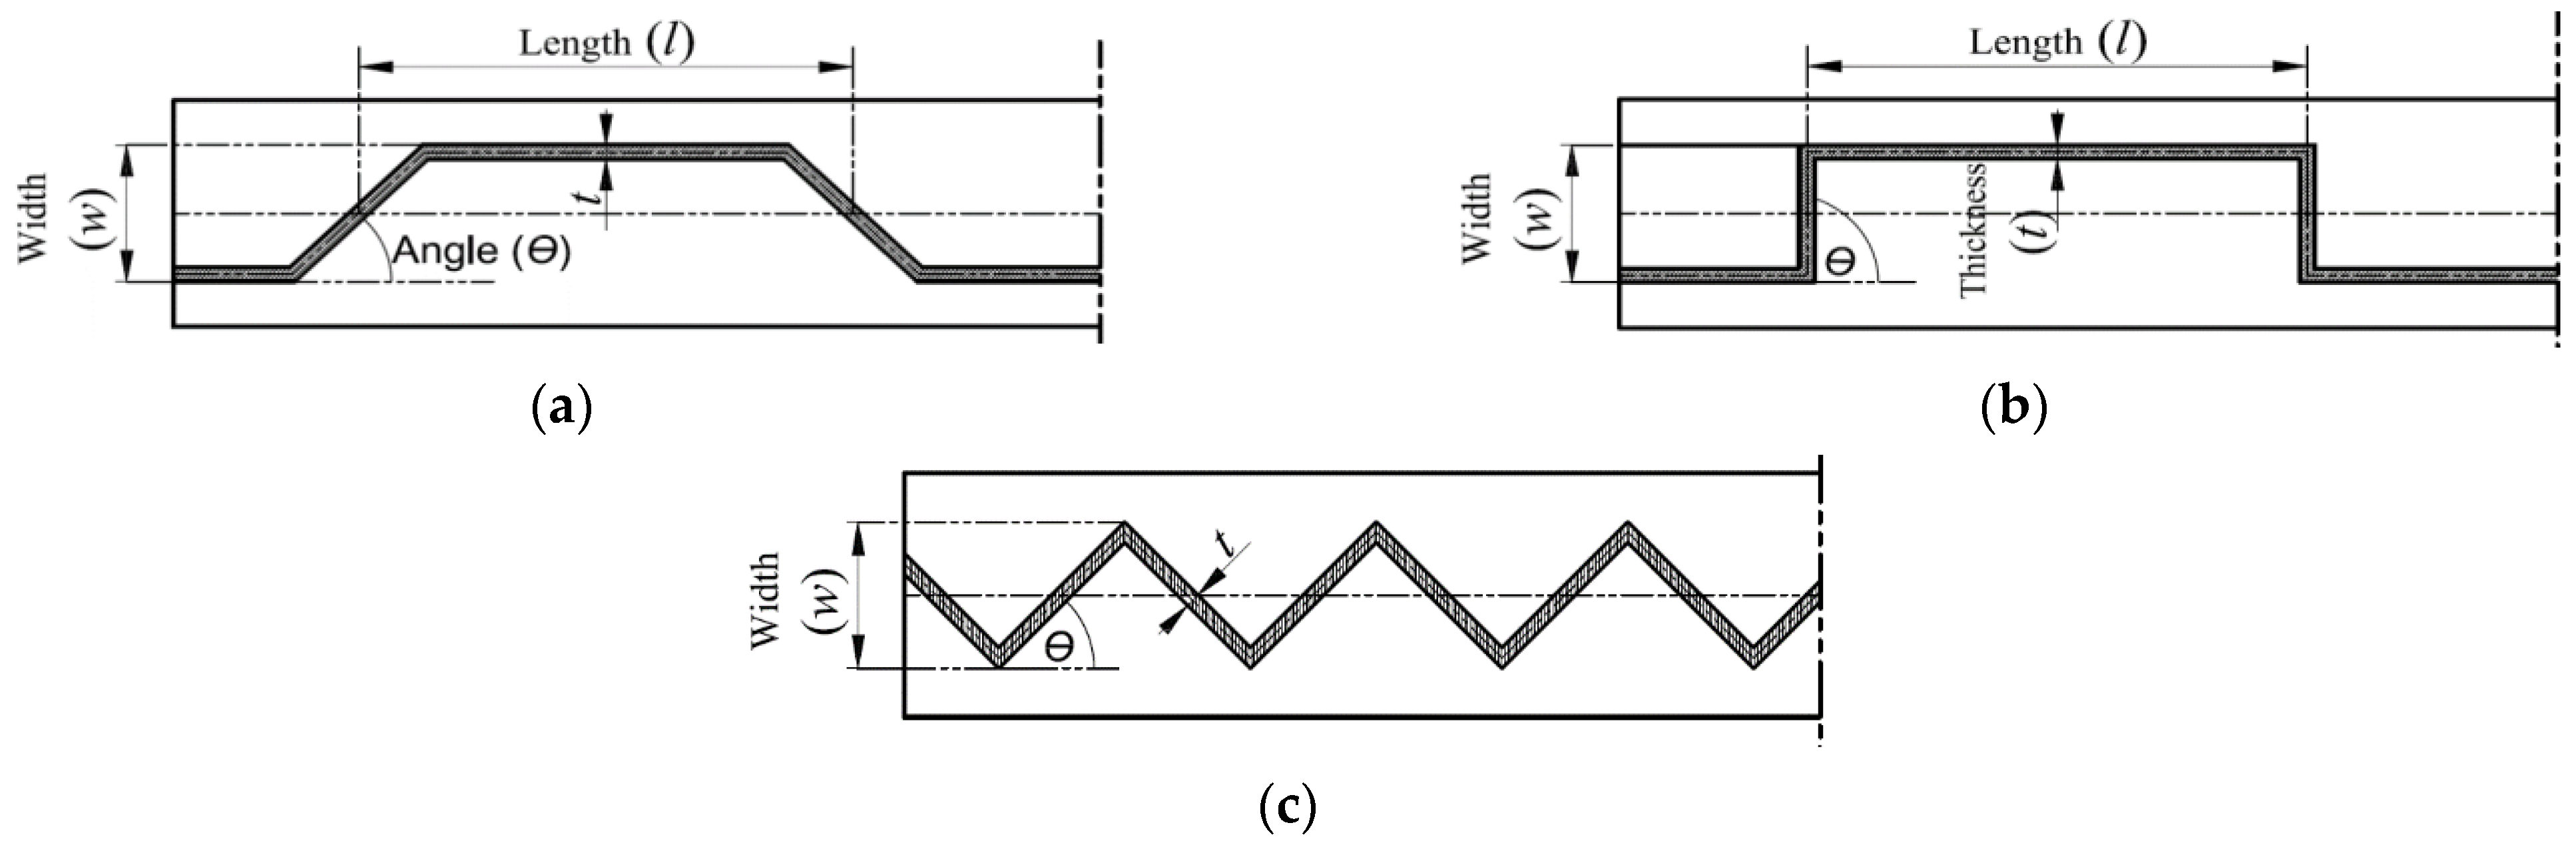
3.1. Experimental Test Specimens

A simply supported, two-steel I-section beam with a flat web with a total span of 2550 mm was chosen to create the different scenarios of modal parameters, such as natural frequencies and modal shapes. The cases studied were for beams with and without stiffeners. The elevation and cross-section of the beams are presented in Figure 1. The specimens were modally tested using free vibration to measure the modal parameters’ response, and the beam was instrumented with accelerometers installed vertically on the centerline of the top flange surface at eight positions with a spacing of 350 mm, as shown in Figure 1 and Figure 2.
The tested beams were excited every 60 s by induced pulses generated by the impact of a manual rubber hammer. The duration of the transient signal for each test was about 300 s. The excitation point has been carefully chosen, and many response points have been measured. The recorded files were treated with signal data processing software. The record with the most appropriate signals was then used to generate the modal parameters.
Uniaxial piezoelectric accelerometers, type BK 4507 B004, were used in this study. The accelerometers have a resonant frequency of more than 18 kHz, and frequencies range from 0.2 ×10⁻³ to 6 kHz. This type of accelerometer was chosen because it is lightweight, which reduces the effect of its weight on the modal properties of the tested model. Moreover, it has a high resolution, which is necessary for low-amplitude measurements. A multi-channel digital data acquisition system was used to collect data from accelerometers simultaneously, as shown in Figure 2. All steel beam specimens were tested in Civil Engineering Department Lab, King Saud University, Riyadh, KSA.
These beams were tested for flexure scenarios of displacement mode shapes. As a first step, flat web steel beams were tested to serve as a reference to verify the efficiency and accuracy of using numerical analysis in predicting the response of steel beams with the corrugated web.
In the second step, to obtain the mechanical properties of the steel material used in the experimental test, three standard steel specimens cut from the web in accordance with American Society for Testing and Materials ASTM A370 [39] underwent a standard tensile test. All steel specimens were tested using a tensile loading machine (Civil Engineering Department Lab, King Saud University, Riyadh, KSA) with a capacity of 300 kN. The mechanical properties are obtained from experimental tensile tests. The average yield stress was 347.62 MPa, and the ultimate stress was 403.13 MPa. The average failure strain was 0.1272, and the average modulus of elasticity was 211 GPa. These data are introduced into the ANSYS program to identify the materials used in the numerical analysis.

3.2. Finite Element Modeling

One type of element was considered in the numerical model of the steel beams: SHELL 181 from ANSYS-15 [40]. The SHELL 181 elements, with four nodes and 6 DOF per node, were adopted to model the studied beam as they allow the use of certain properties related to the inelastic behavior of materials, such as plasticity and hardening, hyper-elasticity, stiffening of stress, creep, larger capabilities of strain, and contact nonlinearities. Furthermore, it allows simulating the deformations of elastoplastic materials. The mechanical response and the elastic modulus are dependent on experimental test sample properties as well as on the application scenarios. The FE material models are defined as: structural, nonlinear, inelastic, rate-independent, kinematic hardening plasticity, Mises plasticity, and bilinear. After that, the properties of the used steel material were entered according to the tensile test results that were conducted on samples from the web of the steel beam, where values of the yield stress, ultimate stress, strain, and the modulus of elasticity were recorded, while a Poisson’s ratio of 0.3 was used [30,35,41]. The FE modeling analysis type was modal after defining the mode extraction method by choosing the number of modes to extract and expand. After that, the start and the end of frequency were defined.
The numerical FE simulation was carried out on 23 steel beams with variable geometrical web thicknesses and different corrugated shapes and sizes, as shown in Figure 3. Two of these steel beams with a flat web will be used as control specimens. The control specimens are required for verification by comparing them with the experimental results and validating the accuracy of the numerical analysis in the modeling. They were also used to explore the effect of changing the shape of the steel web from flat to corrugated on both natural frequencies and displacement mode shapes. The 21 steel beams were divided into three groups based on the corrugated steel web shape. Three different corrugated steel web shapes (trapezoidal, rectangular, and triangular) and three thickness measurements with three corrugated web widths and lengths and three corrugated web angles were noted, as illustrated in Table 1. The weld seam between the web and the flanges was considered a perfect bond connection.

3.3. Selecting the Optimum Element Size

This study aims to determine the most appropriate FE meshing for analysis while minimizing the number of elements with acceptable accuracy. This could be obtained by changing the mesh density and then observing its effect on the displacement at point 5. Consequently, trials for the analysis of steel beams with the flat web without stiffener were carried out for different mesh densities through varying the maximum length of the elements from 2.5 to 20 mm. Figure 4 shows the variation of the number of elements versus the numerical to experimental ratios for 1st flexure displacement mode shapes. Small changes in displacement ratios were recorded for the number of elements greater than 78,540. The last value will be adopted in the analysis of tested samples hereafter. Therefore, the FE model mesh was divided into elements having a maximum size of 5 × 5 × 5 mm (height × width × length).

4. Experimental and Numerical Results and Discussion

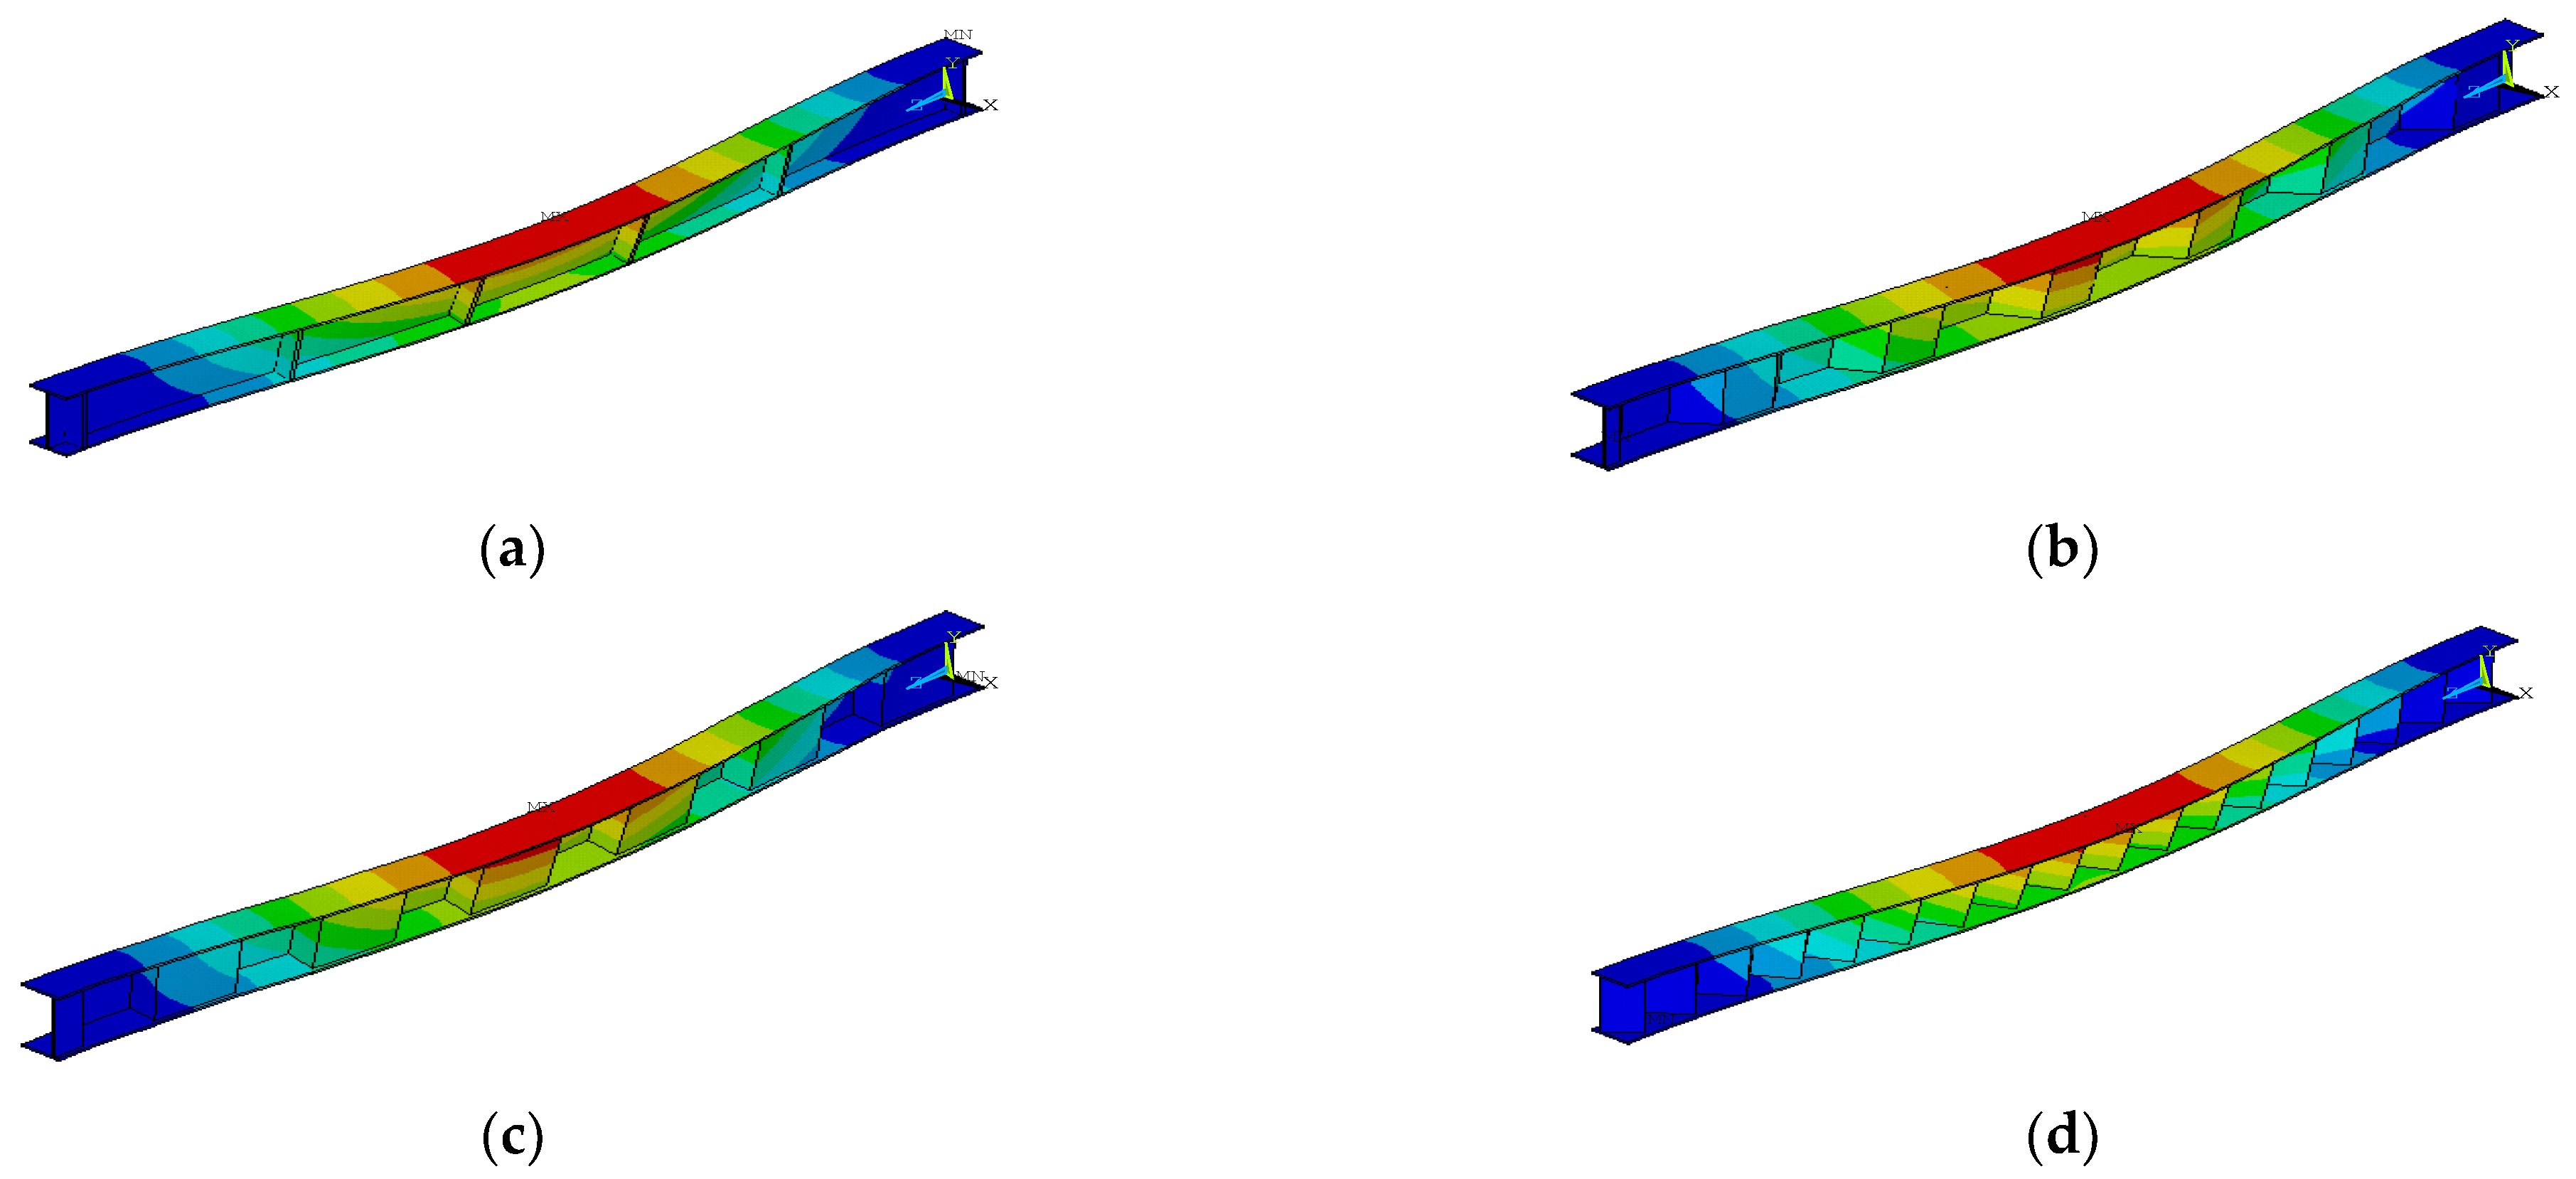
4.1. Experimental Results and Comparison with FE Analysis

Figure 5 presents the flexure mode shape changes obtained from the experimental tests and numerical FE analysis for the flat web beam without stiffeners (Figure 5a) and the beam with stiffeners (Figure 5b). Three types of flexure displacement mode shapes were recorded, and cases are labeled as 1st, 2nd, and 3rd mode shapes. A FE numerical analysis was implemented for the same steel beams, and experimental results revealed no changes in the flexure mode shapes. These displacements were measured at the same eight points as in the experimental test. Normalization for these displacements was performed with respect to the maximum displacement value recorded in the experimental tests. Consistent and similar results were obtained from the experimental and FE numerical analyses for two steel flat web beams, as shown in Figure 5. Using the experimental data results, an exhaustive verification process was carried out. Table 2 and Table 3 summarize the normalized and natural frequencies’ values for both experimental tests and FE numerical analysis. A proportionality ratio between the FE numerical analysis and the experimental tests was calculated for normalized displacements and natural frequencies. The average values and the coefficient of variation (COV) were then calculated for each beam type.
The results illustrated (in tables and figures) for the flat web steel beam without stiffeners showed that the average normalized ratio between numerical and experimental results for 3-mode shapes at 8 points was 0.99, with a COV equal to 5.60%. For natural frequencies, the ratio was 0.98. For the flat web steel beam with stiffeners, the average normalized ratio was 1.00 with a COV equal to 5.89%, and the ratio of natural frequencies was 1.01. In a statistical context, these values show that the FE simulation has high accuracy for all steel beams with or without stiffeners.

4.2. Pattern of Flexure Displacement Mode Shapes

From the FE numerical test of steel beam specimens, patterns of flexure mode shape change were found in three shapes: 1st, 2nd, and 3rd mode shapes, as shown in Figure 6, Figure 7 and Figure 8. Figure 6 shows the 1st mode shape of the steel beam specimens with a flat web and different forms of corrugated webs. This type of pattern has the largest values of displacement that occurred at mid-span and the lowest values of natural frequencies for any type of steel web. Figure 7 presents the 2nd mode shape of the steel beam specimens with a flat web and different forms of corrugated webs. This type of pattern contains the medium values of displacement that occurred at a quarter of the span and the medium values of natural frequencies for any type of steel web. However, Figure 8 shows the 3rd mode shape of the steel beam specimens with a flat web and different forms of corrugated webs. This type of pattern afforded the lowest values of displacement that occurred at one-third and the middle of the span and the largest values of natural frequencies for any type of steel web.
For all the different types of the web (Figure 6, Figure 7 and Figure 8), whether flat or corrugated, it was remarked that they have the same mode shape pattern but have different values of displacement and accompanying natural frequencies. The FE numerical analysis measured the maximum flexure displacement for each type of mode shape and the natural frequencies associated with all flat or corrugated steel web beams. All these values have been normalized to the maximum displacement and the natural frequencies associated with the flat web steel beam without stiffeners. The amounts of decrease for the control steel beams with the flat web without stiffeners compared to the other tested steel beams with a corrugated web were distinctive, as shown in Table 4.

4.3. Flexure Mode Shape Changes

The results shown below are expressed in terms of how flexure mode shapes changed as a function of corrugated web thickness, width, length, and angle.

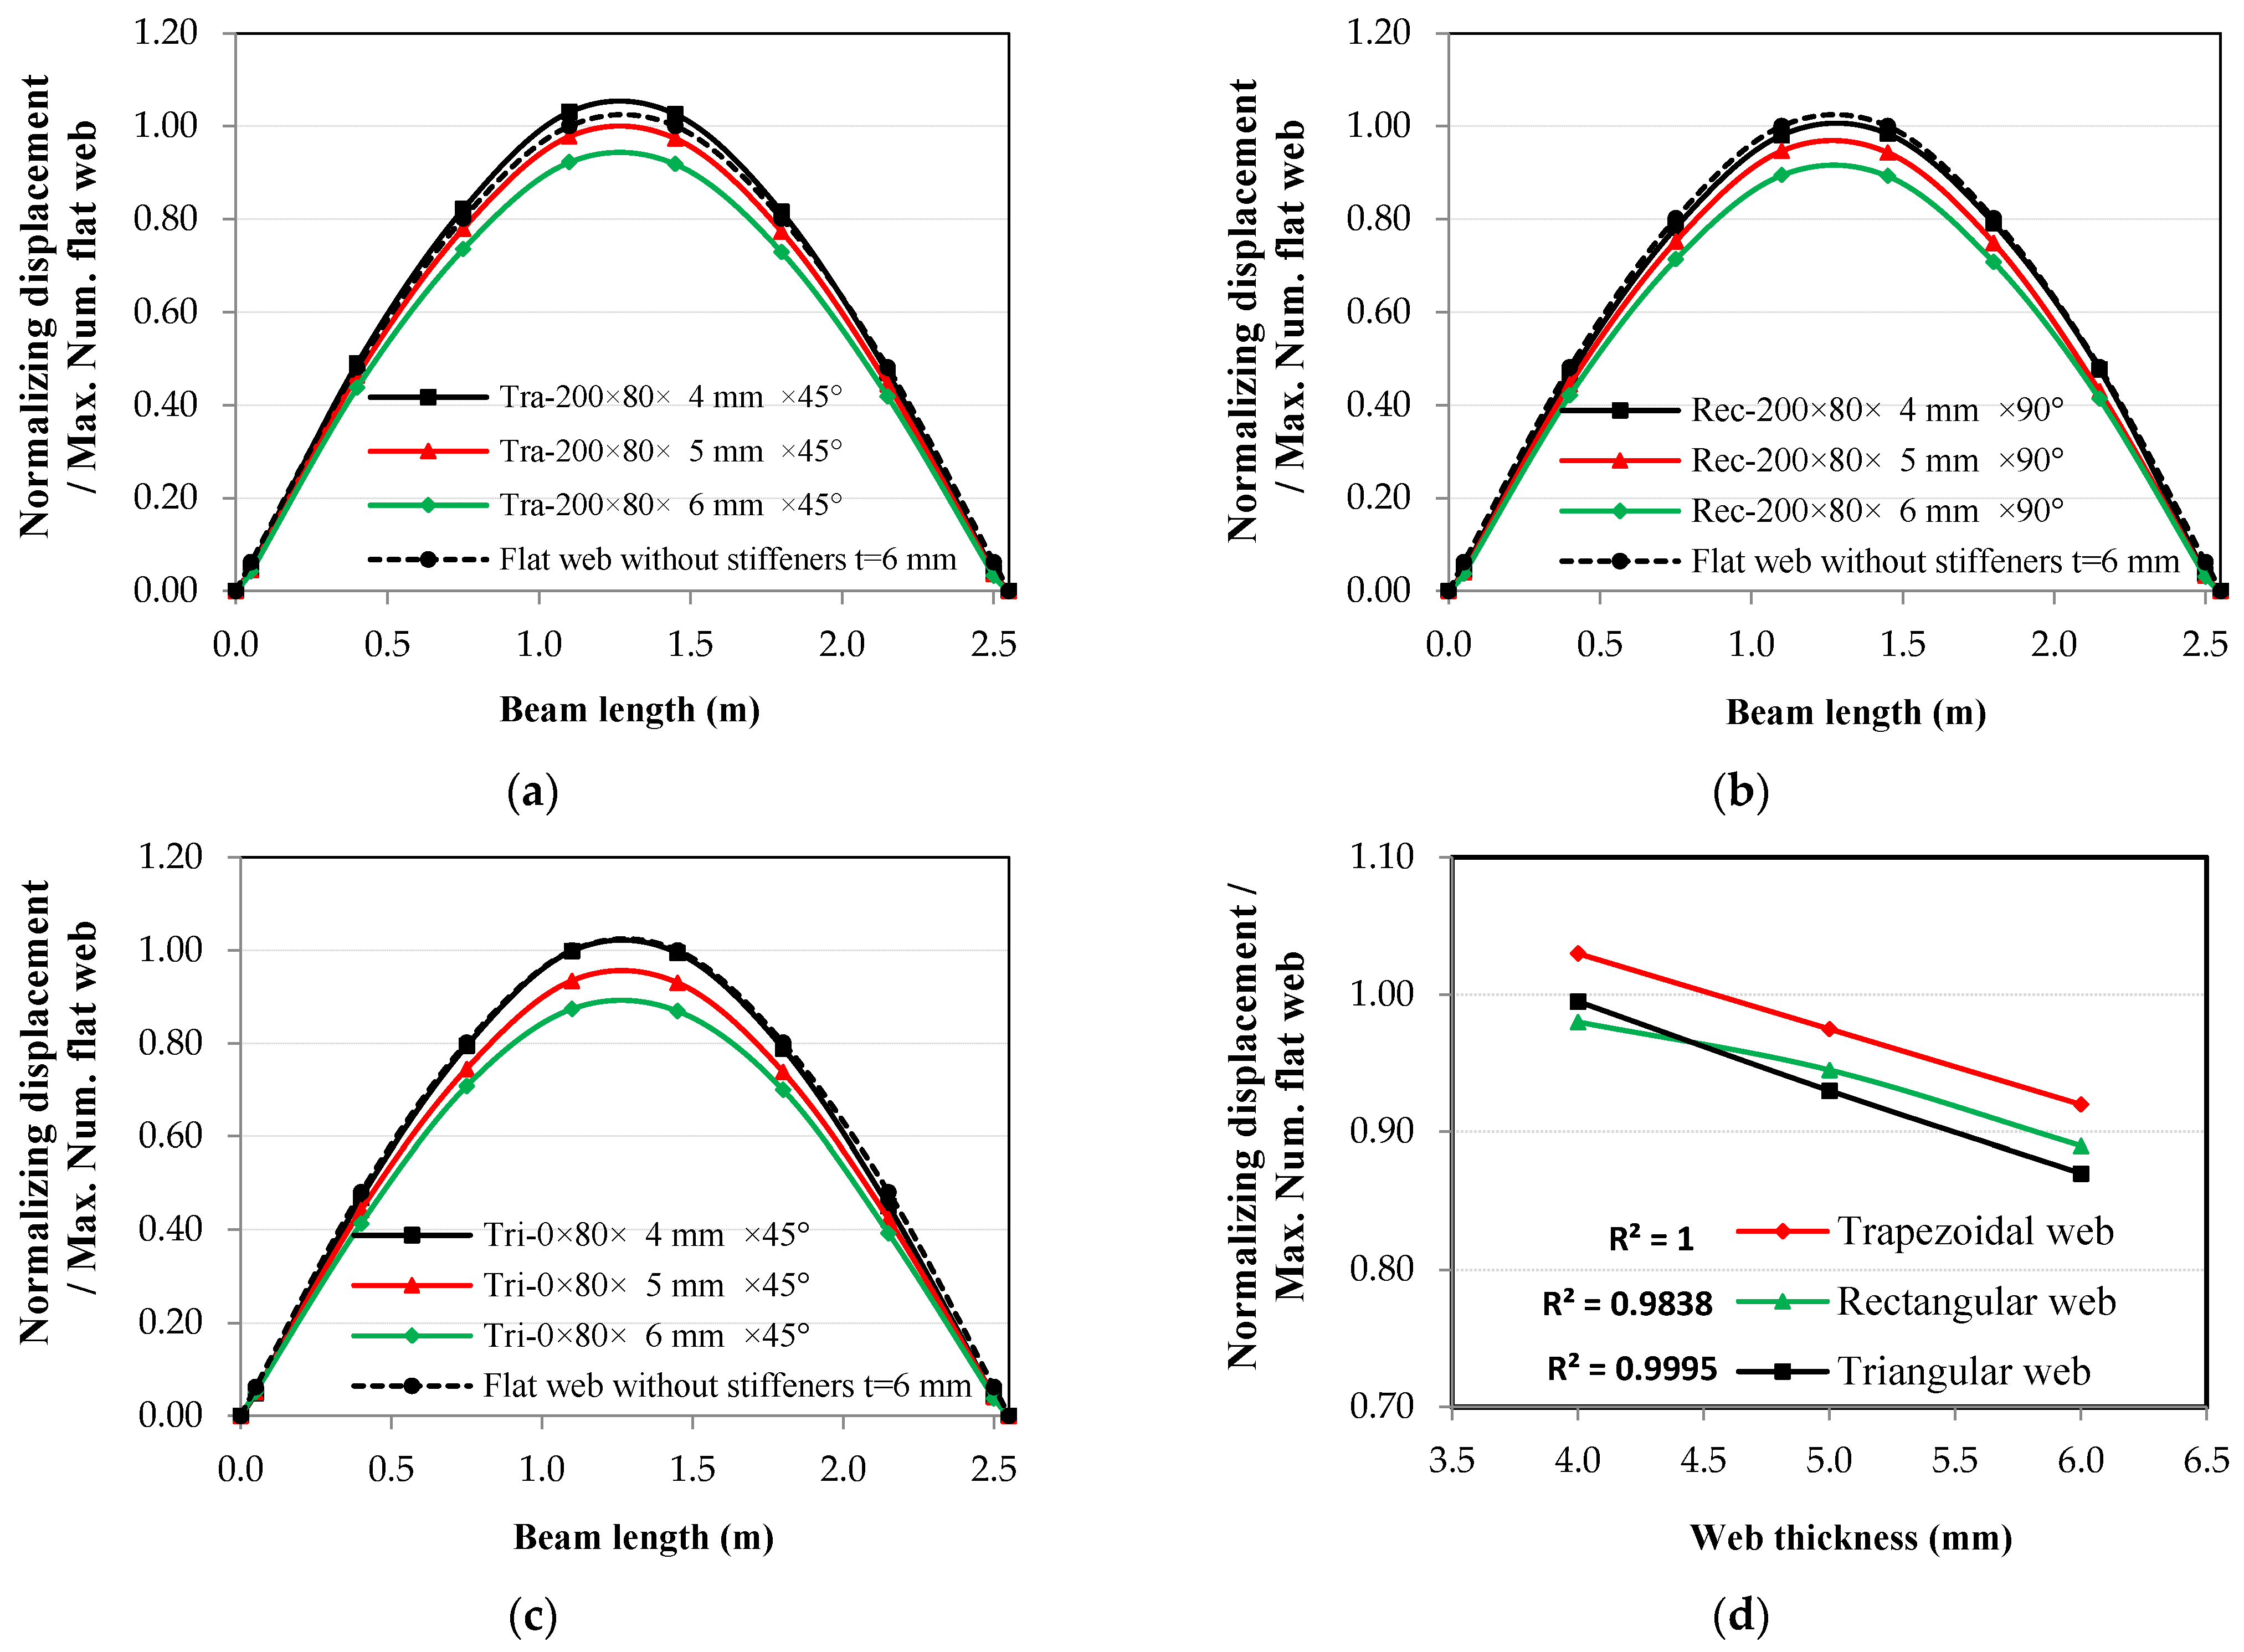
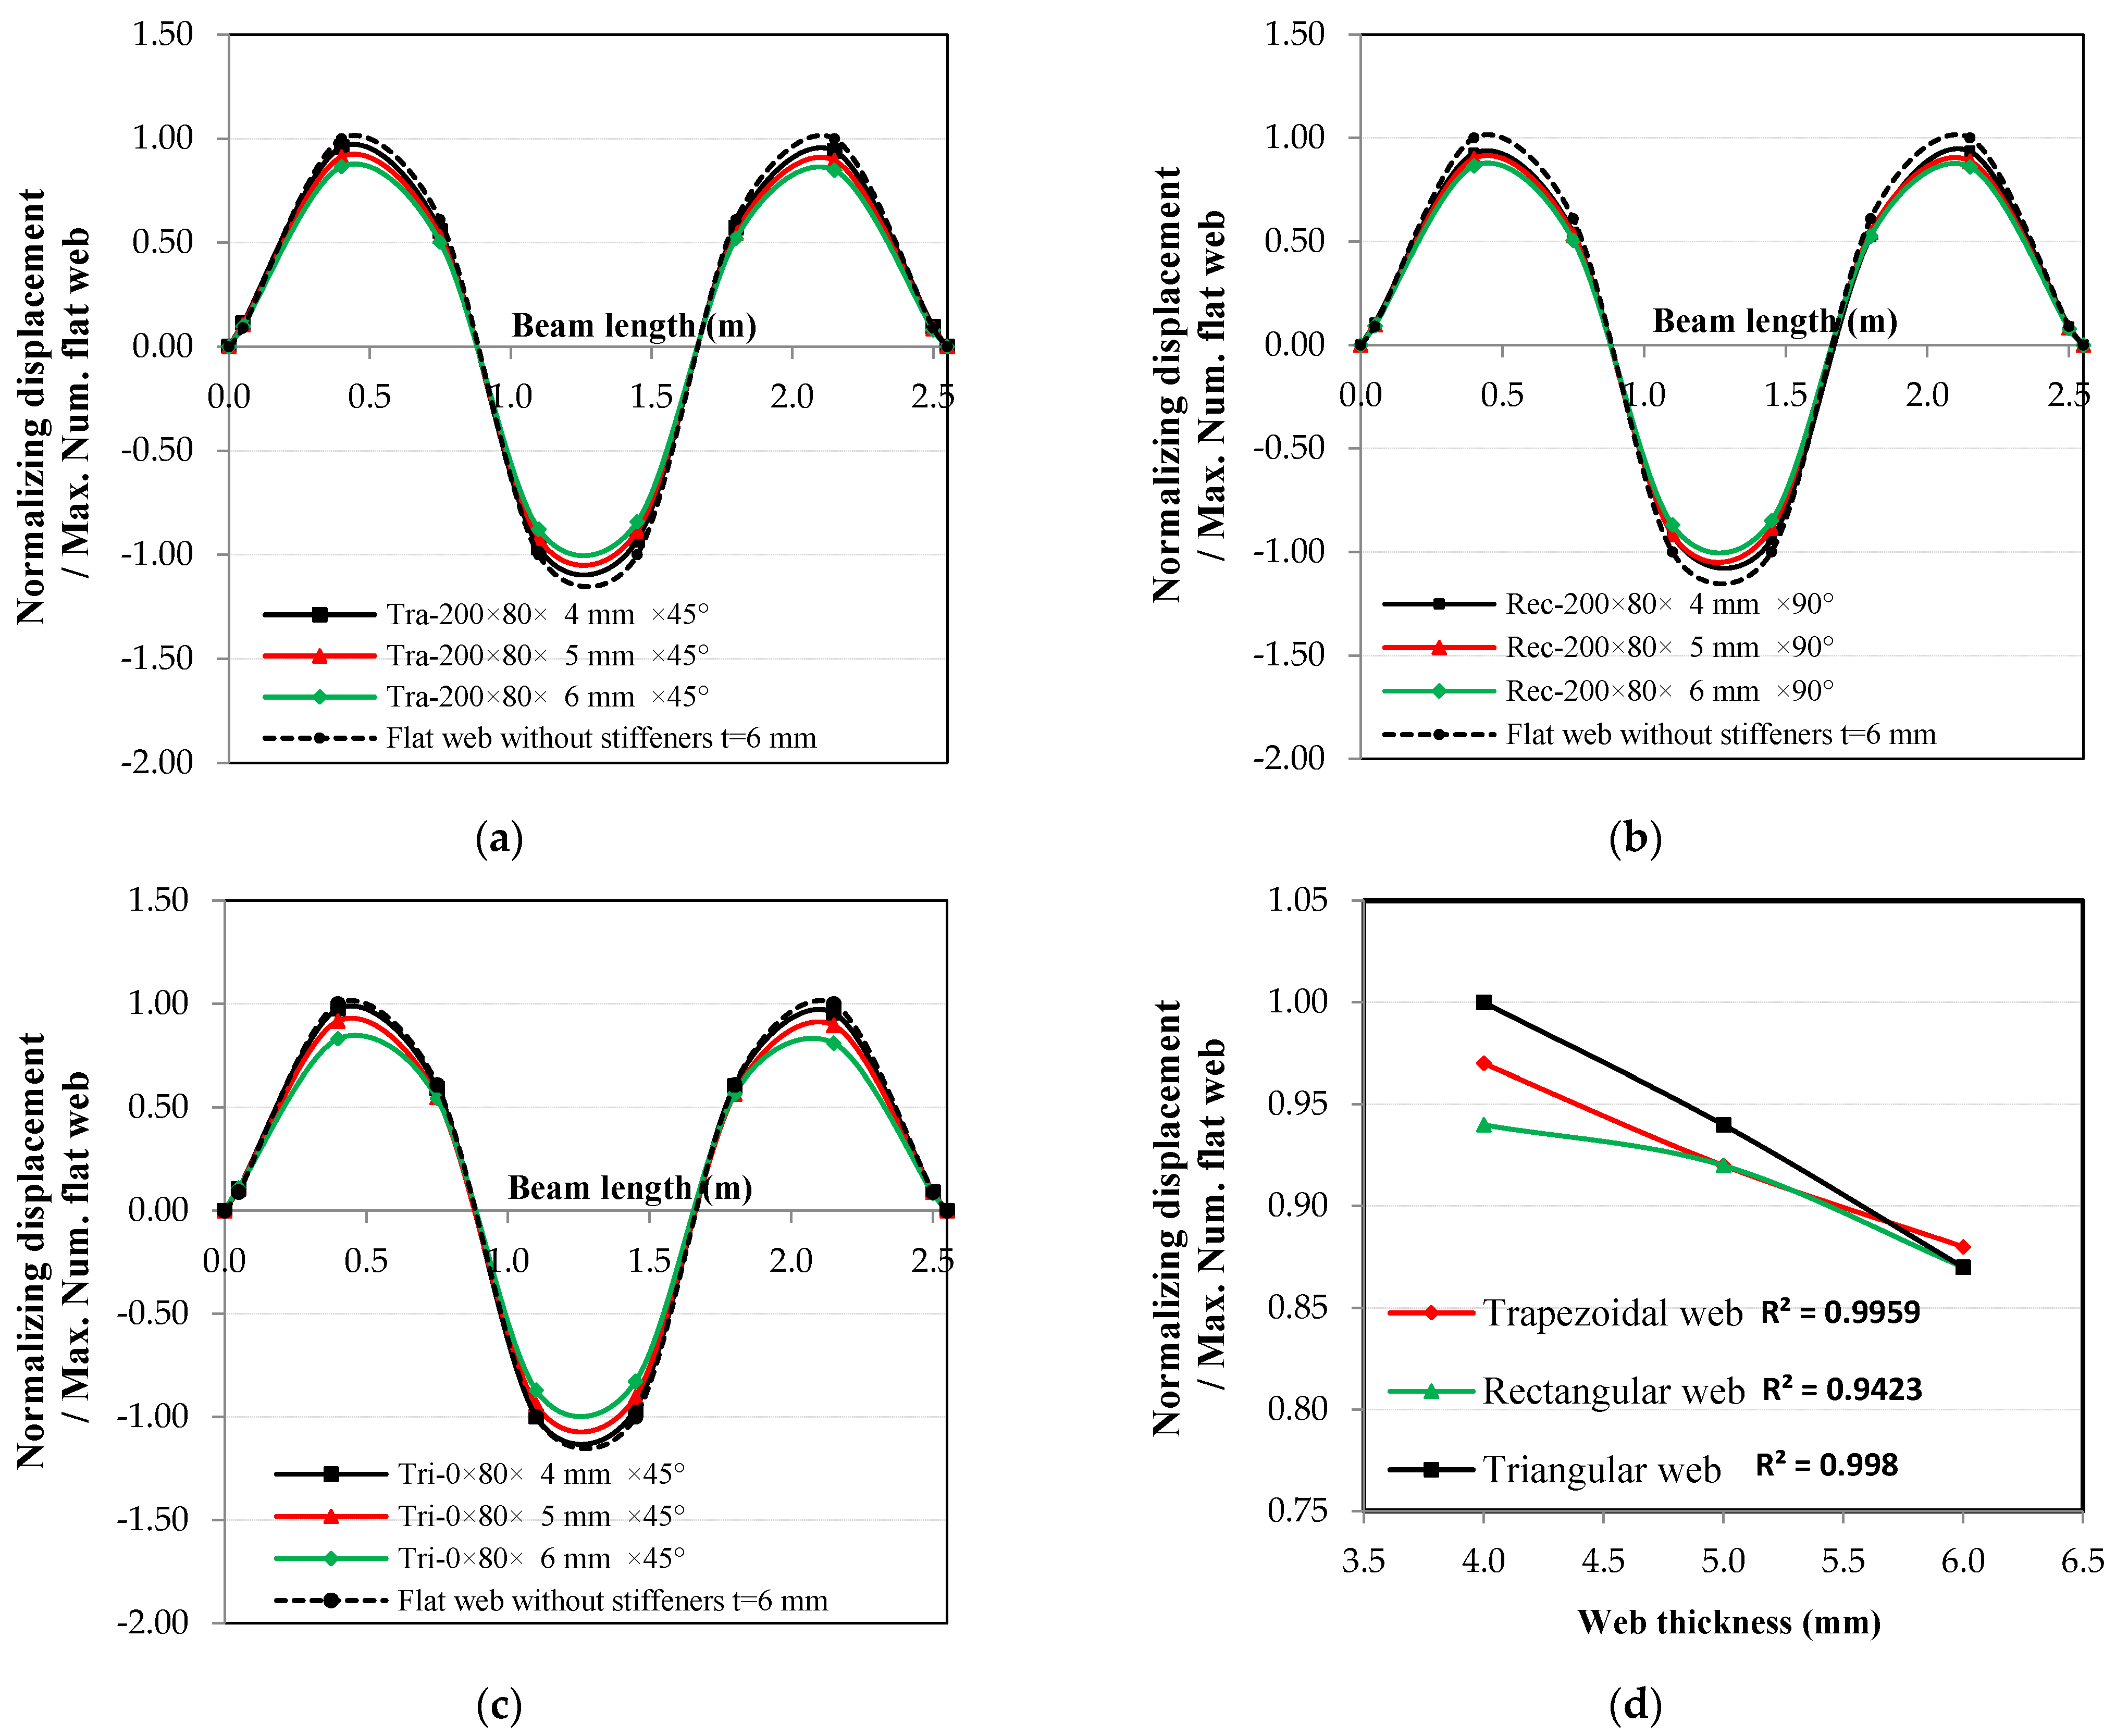
4.3.1. Thickness of Corrugated Web

The thickness of the steel web has an important effect on the resistance of the steel section and its stiffness, as shown in Figure 9, Figure 10 and Figure 11. When the thickness of the web increases in all types of corrugated web, the displacements of the same mode shape decrease in the 1st, 2nd, and 3rd mode shapes. It was also noticed that the effect was almost linear for all types of corrugated web, as the value of the coefficient of correlation r = 1.00. However, on the other hand, the effect of the shape of the corrugated web affects the percentage of decrease that occurs for the same thickness. It follows that for the 1st mode shape case—when the thickness of the corrugated web equals the thickness of the flat web, 6 mm—it was found that the best type of corrugated web was the triangular one, followed by the rectangular, and then the trapezoidal, where the ratio of decrease reached 0.87, 0.89, and 0.92, respectively. This finding agreed with results reported in the literature [1,2,6].
For the case of the 2nd mode shape (Figure 10d), it was observed that the best type of corrugated web was the rectangular one, followed by the triangular, and then the trapezoidal, where the ratio of decrease reached 0.68, 0.79, and 0.90, respectively.
For the case of the 3rd mode shape (Figure 11d), it was found that the best type of corrugated web was the rectangular one, followed by the triangular, and then the trapezoidal, with the ratio of decrease reaching 0.87, 0.87, and 0.88, respectively. It is also clear from Figure 9, Figure 10 and Figure 11 that it was possible to obtain the same displacement values for the three mode shapes, with the thickness of the corrugated web being 33% less than that of the flat web, and this finding showed the efficiency of the corrugated web over that of the flat web.

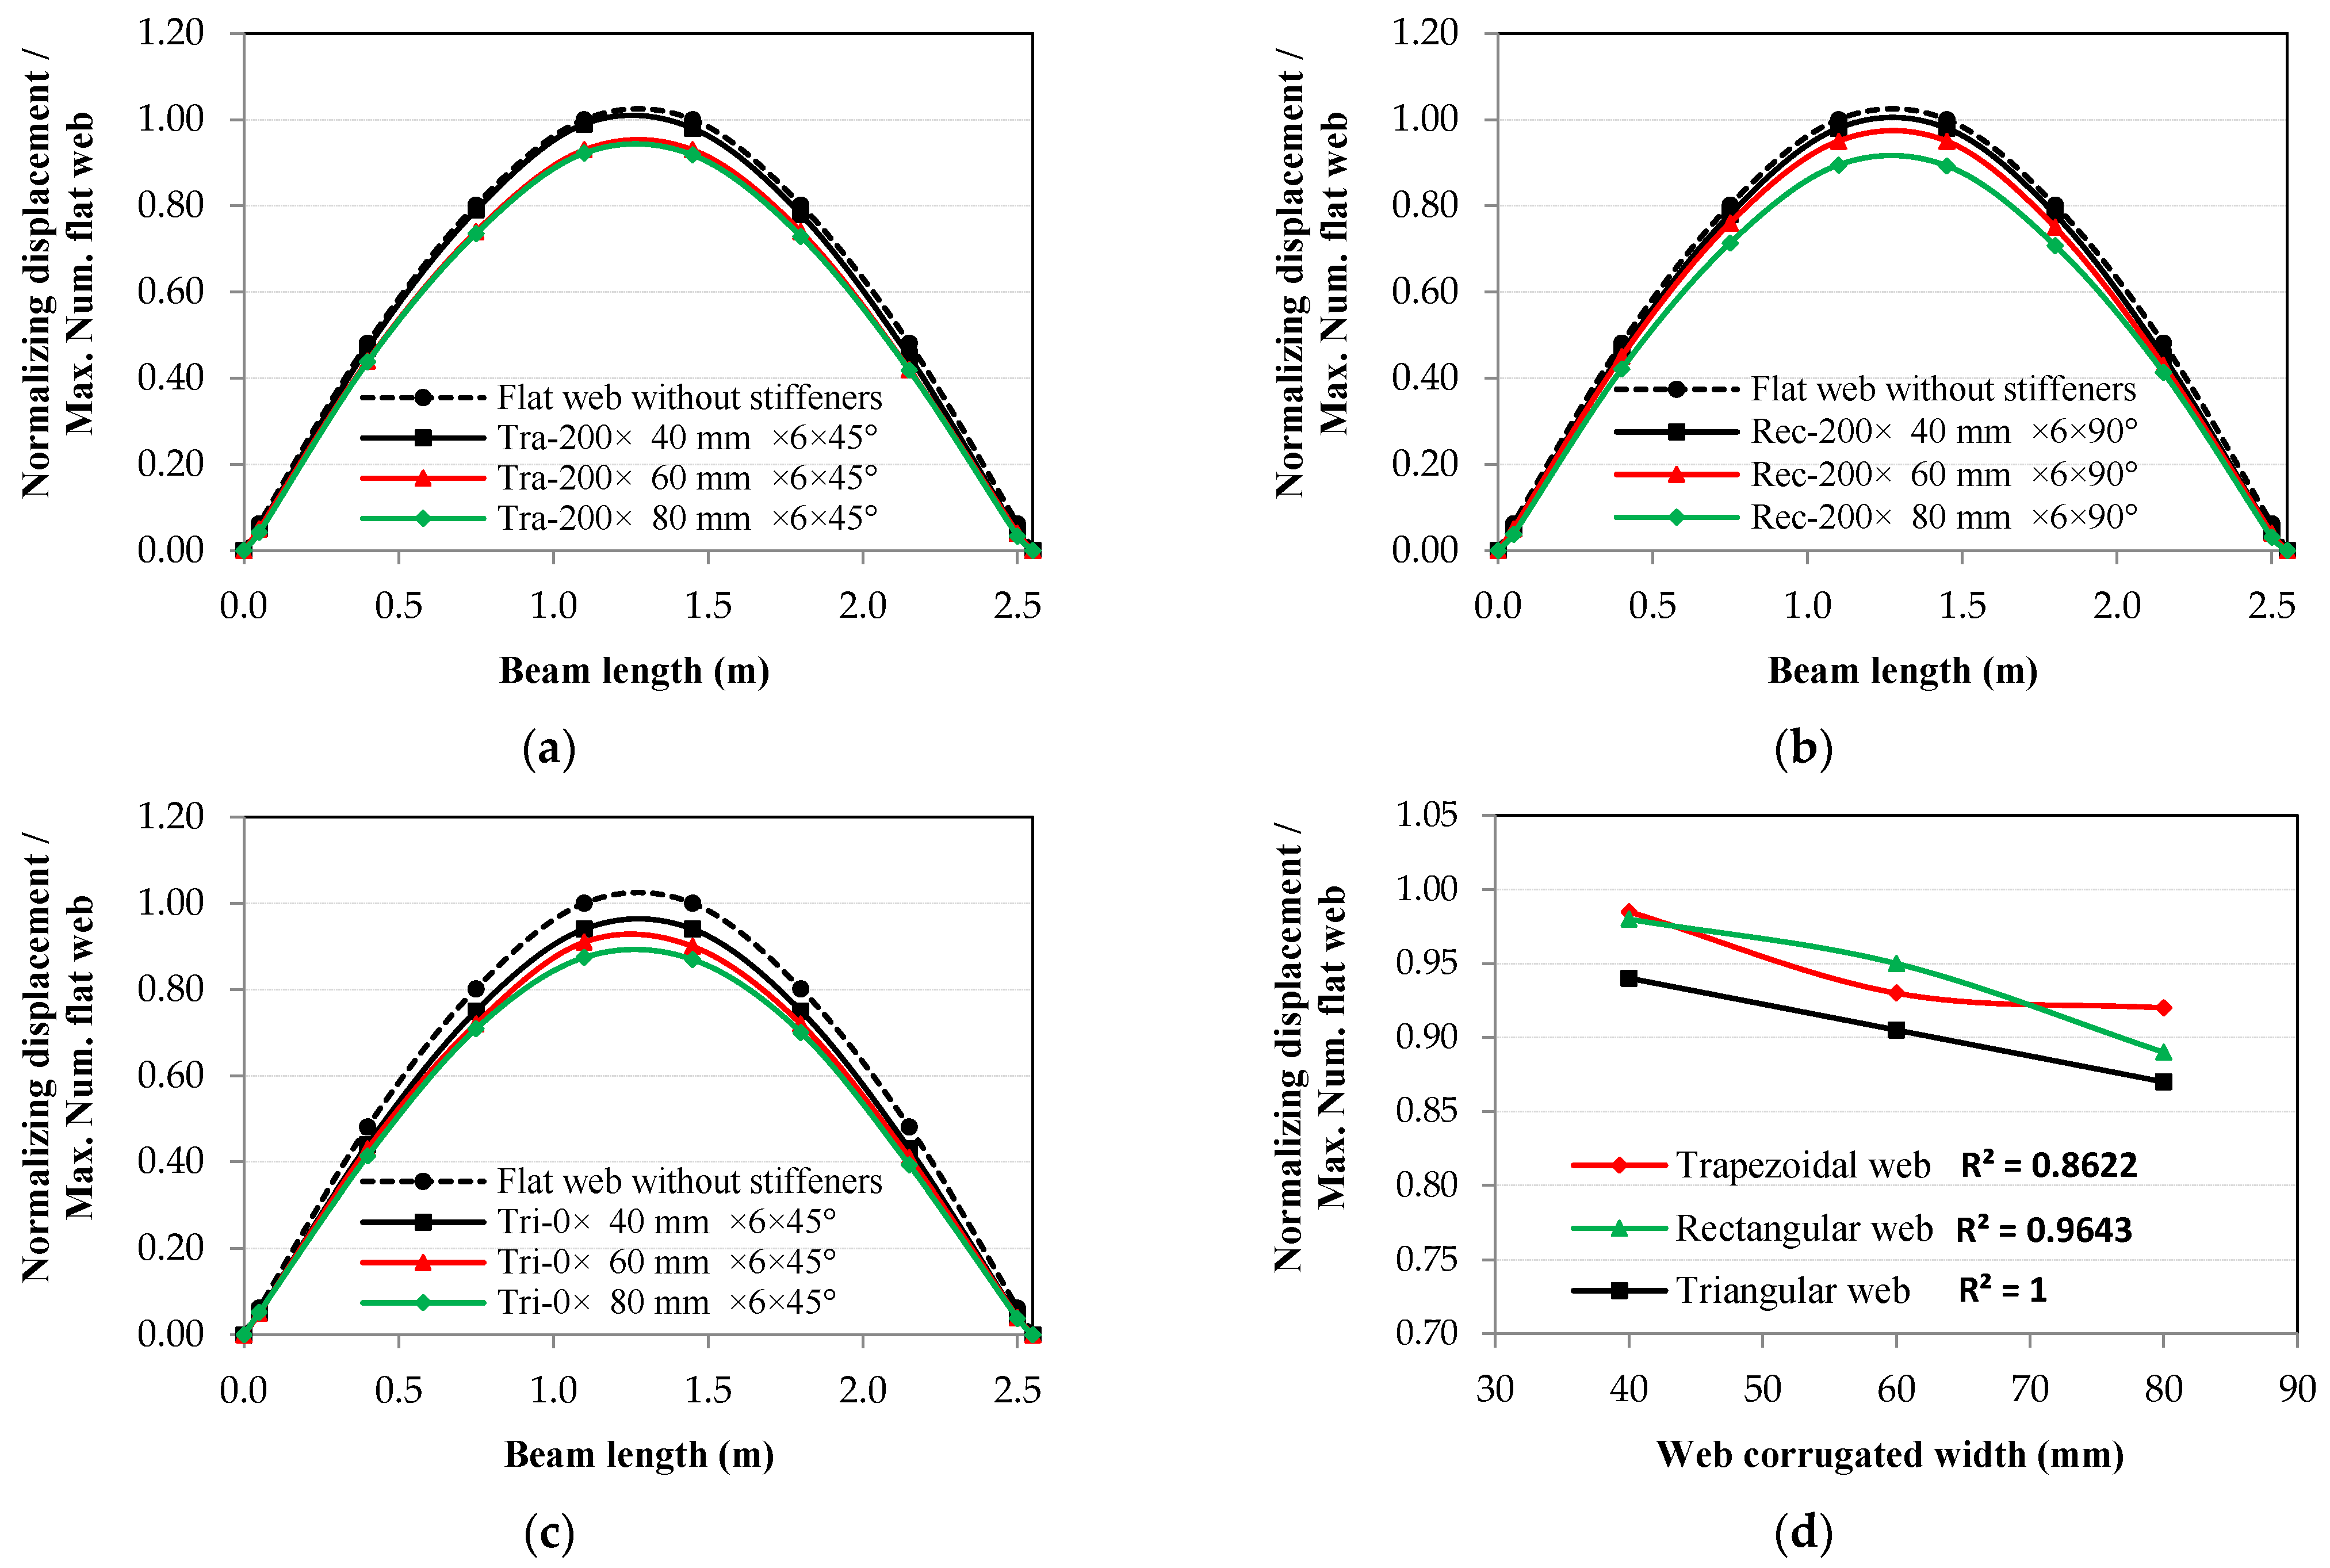
4.3.2. Width of Corrugated Web

The effect of the corrugated web’s width is no less significant than the effect of thickness. When the corrugated web’s width increases in all types of corrugated web, the displacements of the same mode shape decrease in the 1st, 2nd, and 3rd mode shapes, as shown in Figure 12, Figure 13 and Figure 14. It was also reported that the effect was linear only for the triangular corrugated web in the 1st mode shape and trapezoidal in the 2nd mode shape, as the value of the coefficient of correlation r = 1.00. Furthermore, the effect of the shape of the corrugated web affects the values of decrease that occur at the same corrugated width.
Figure 12d showed that for the case of the 1st mode shape, the more efficient type of corrugated web was the triangular one, followed by the rectangular, and then the trapezoidal, with the ratio of decrease reaching 0.87, 0.89, and 0.92, respectively, for a width of the corrugated web equal to 80 mm. Figure 13d for the case of the 2nd mode shape showed that the best type of corrugated web was the rectangular one, followed by the triangular, and then the trapezoidal, and the ratio of decrease reached 0.68, 0.79, and 0.90, respectively.
In the case of the 3rd mode shape in Figure 14d, it was observed that the best type of corrugated web was the rectangular one, followed by the triangular, and then the trapezoidal, where the ratio of decrease reached 0.87, 0.87, and 0.88, respectively.
All the results agree with the literature review findings [1,2,6]. In fact, for all values of the corrugation width (Figure 12, Figure 13 and Figure 14), the section resistance to displacements in all types of mode shapes was positively affected, even if its effects were not as large as for corrugated web thickness.

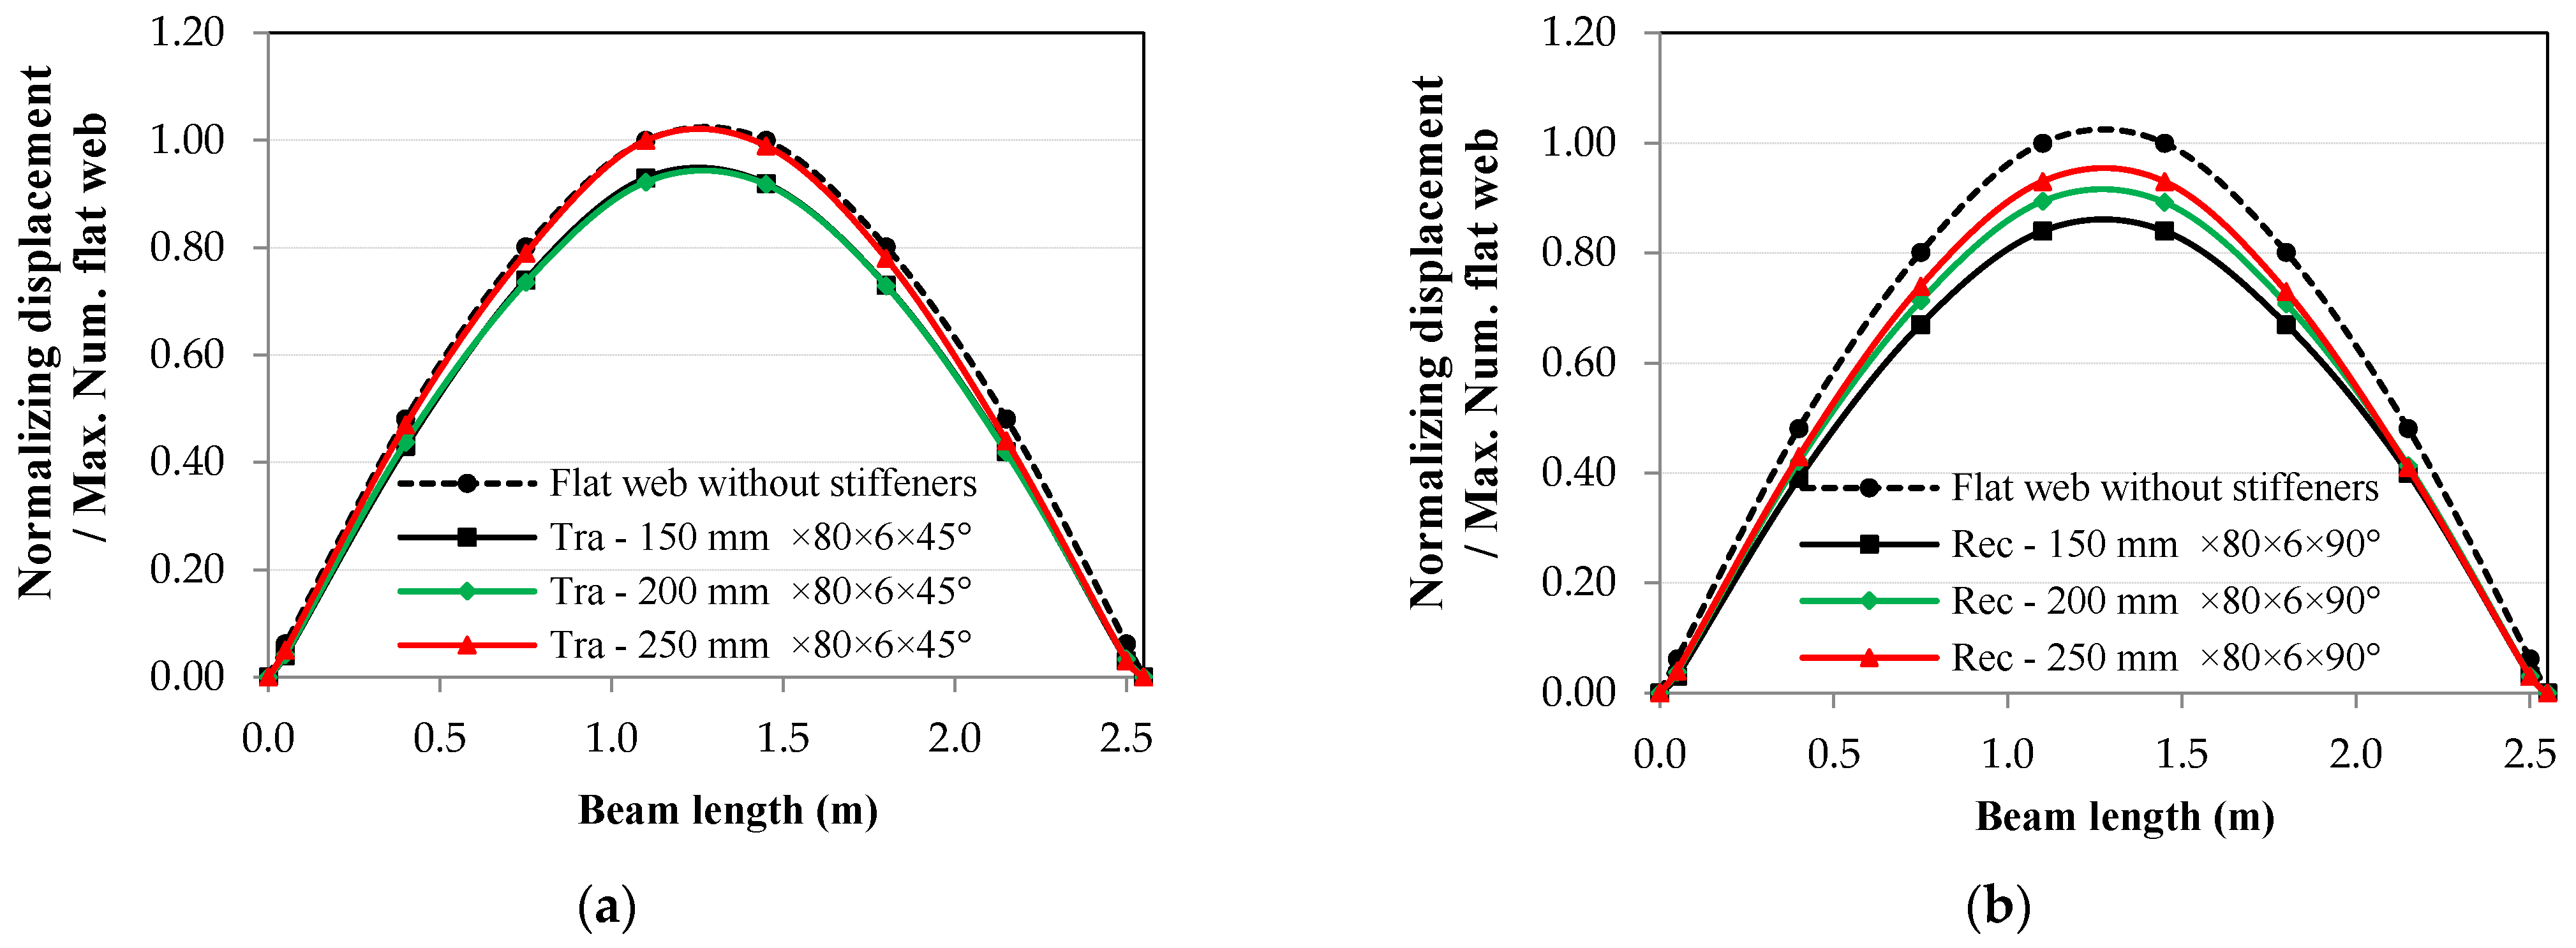
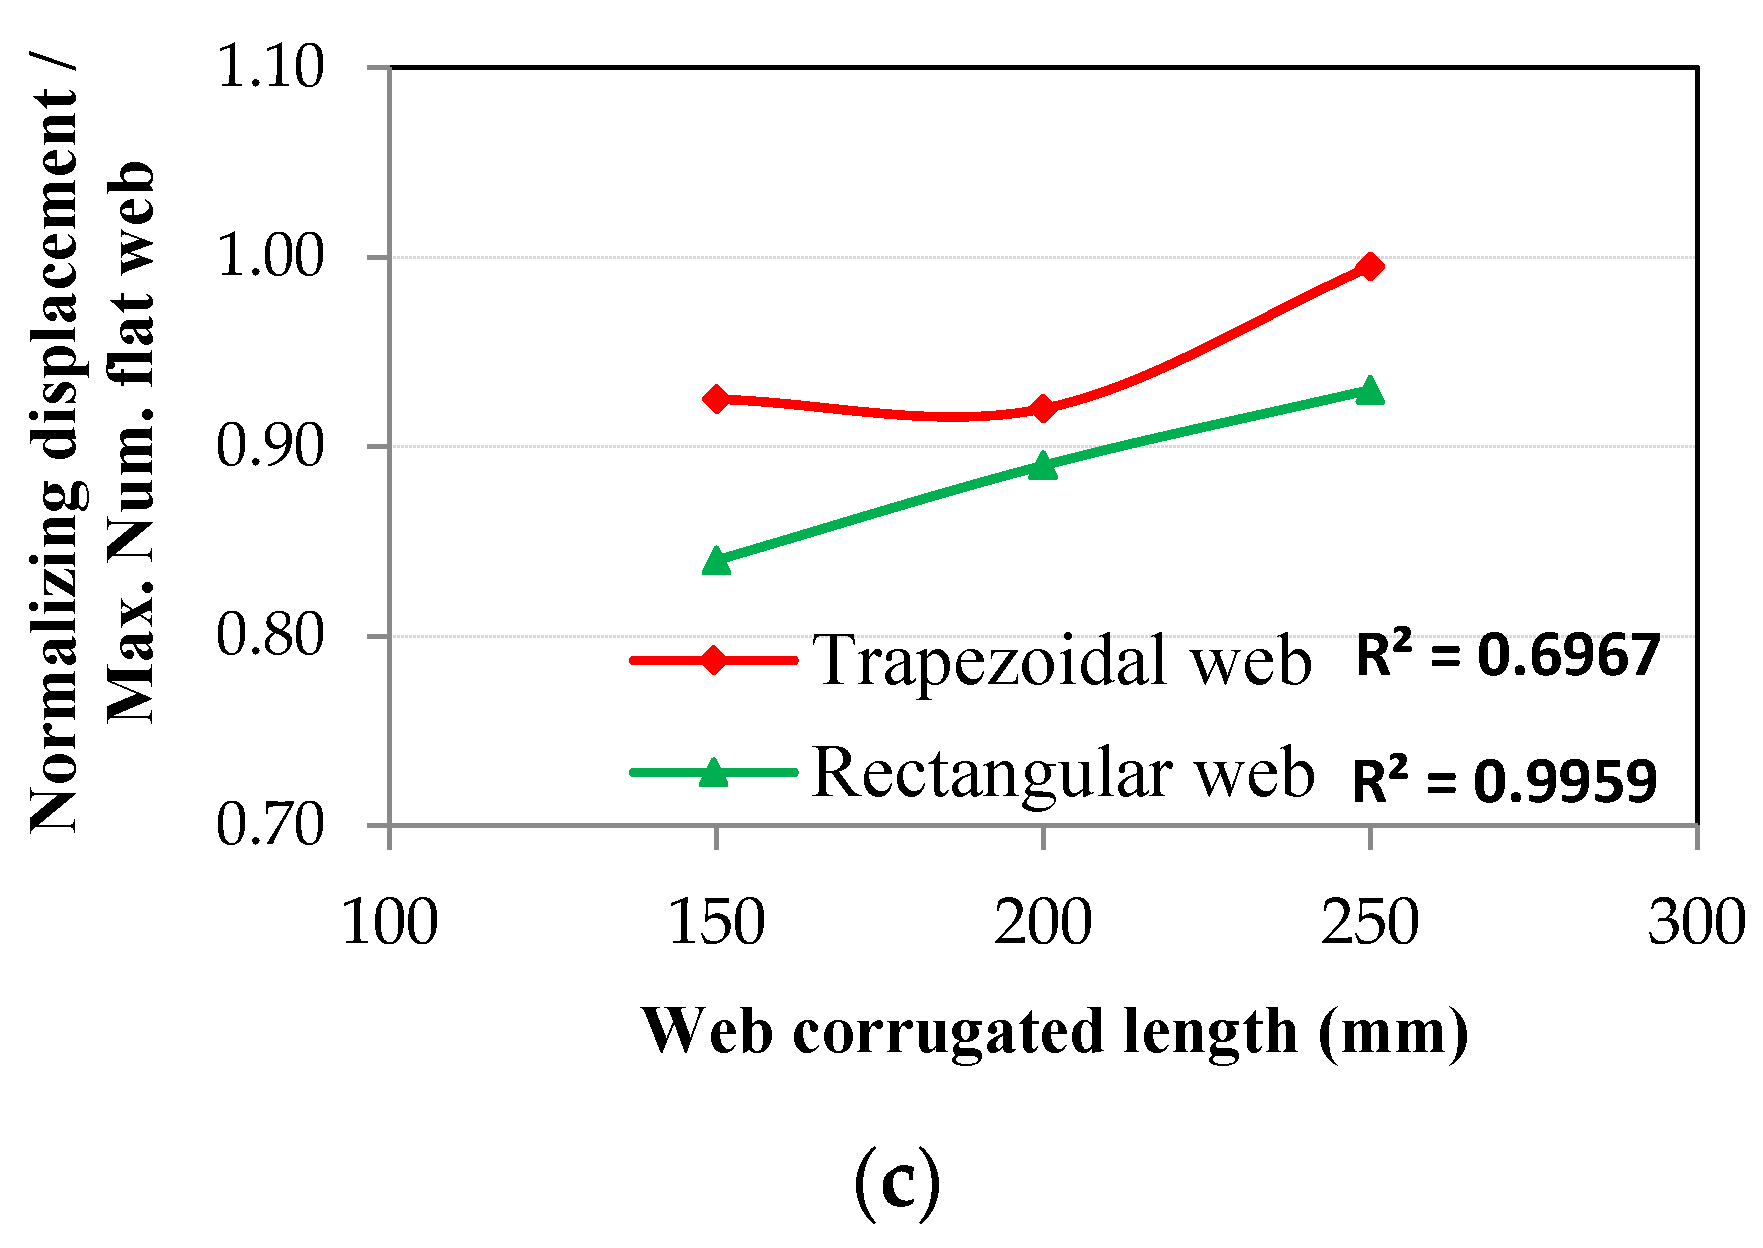
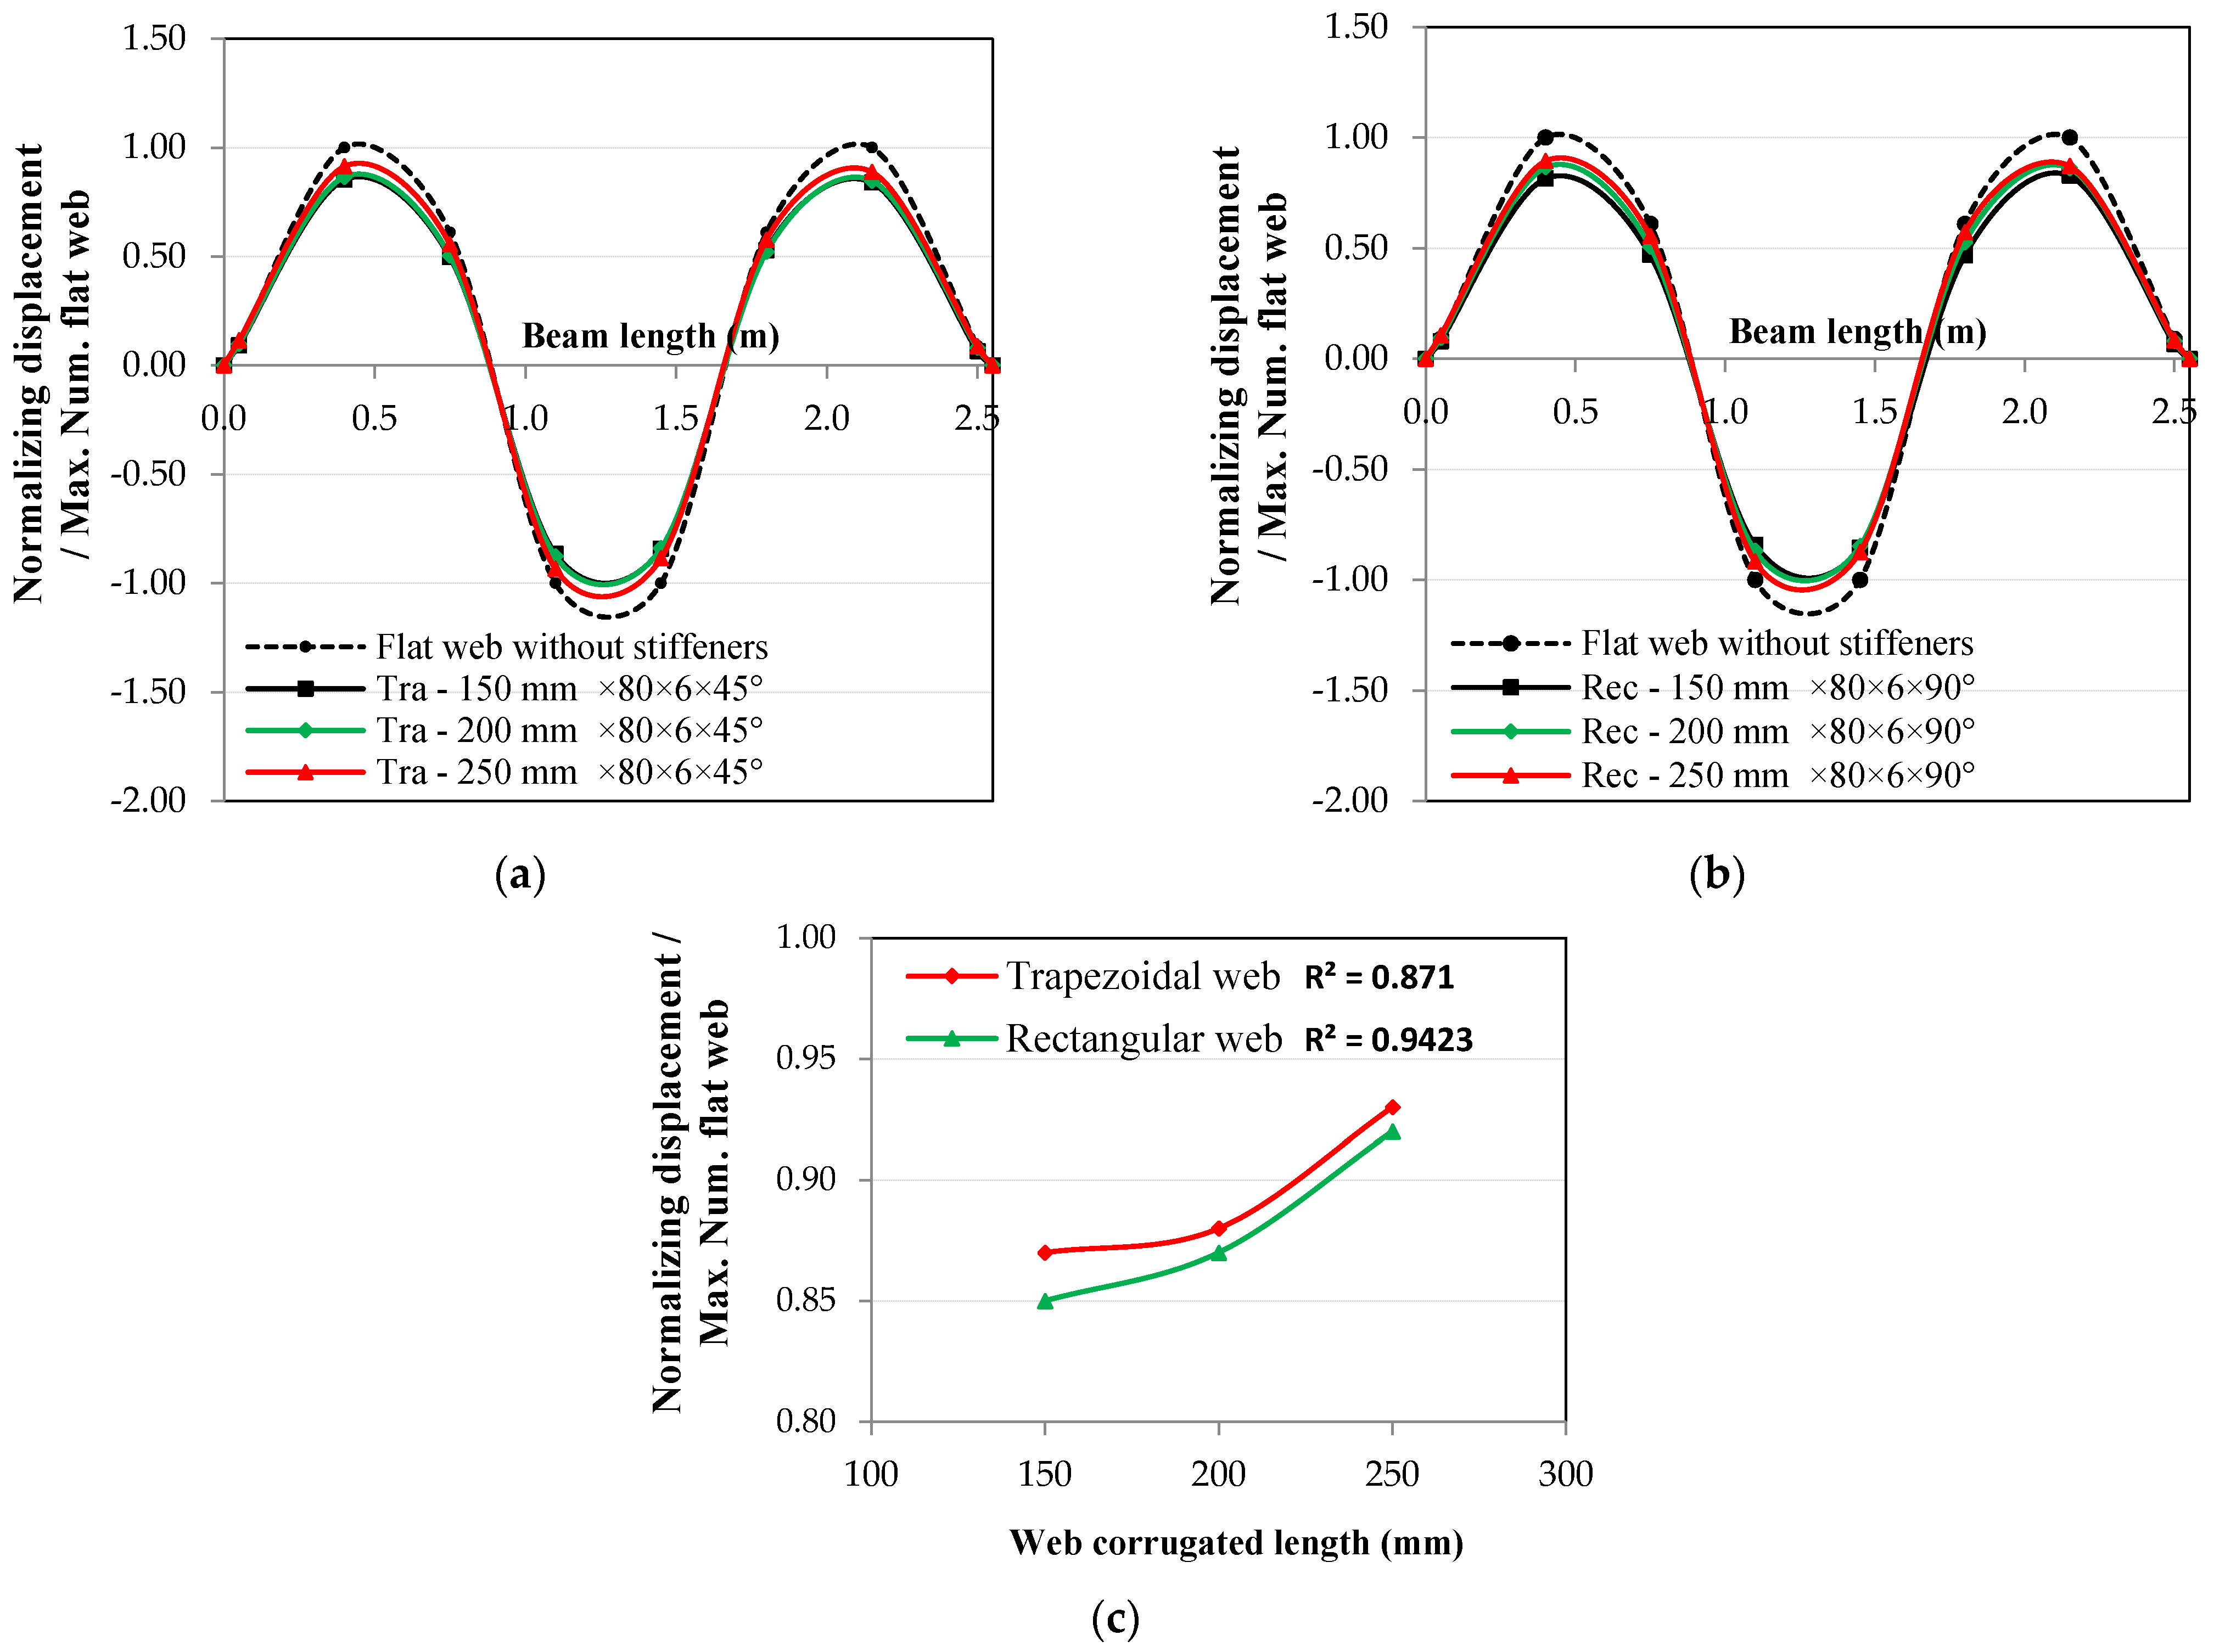
4.3.3. Length of Corrugated Web

The effect of the length of the corrugated web is almost the same as the effect of the width. However, this effect is overturned when decreasing the length of the corrugated web and increasing the density or the stiffness of the steel beam. The decrease in length for all types of the corrugated web induced a decrease in displacements in the three mode shapes, as shown in Figure 15, Figure 16 and Figure 17. It was also noticed that the effect was linear only for the rectangular corrugated web in the 1st mode shape, as the value of the coefficient of correlation r = 1.00. For the 2nd and 3rd mode shapes, the effect was asymptotic to linear, with a value of the coefficient of correlation, r, equal to 0.97. In addition to that, the effect of the shape of the corrugated web affected the extent of decrease recorded for the same corrugated length. For the length of corrugated web equal to 150 mm, as reported in Figure 15c, Figure 16c and Figure 17c, it was found that the best type of corrugated web was the rectangular one, where the ratio of decrease reached 0.84, 0.59, and 0.85 for the 1st, 2nd, and 3rd mode shapes, respectively. The decrease recorded for the trapezoidal web was much more than the earlier type. In fact, the ratio of decrease was 0.92, 0.89, and 0.87 for the 1st, 2nd, and 3rd mode shapes, respectively. These findings agreed with the previous studies [1,2,6]. Figure 15, Figure 16 and Figure 17 show that for any value of the corrugation length, the section resistance to displacements in all types of mode shapes was improved.

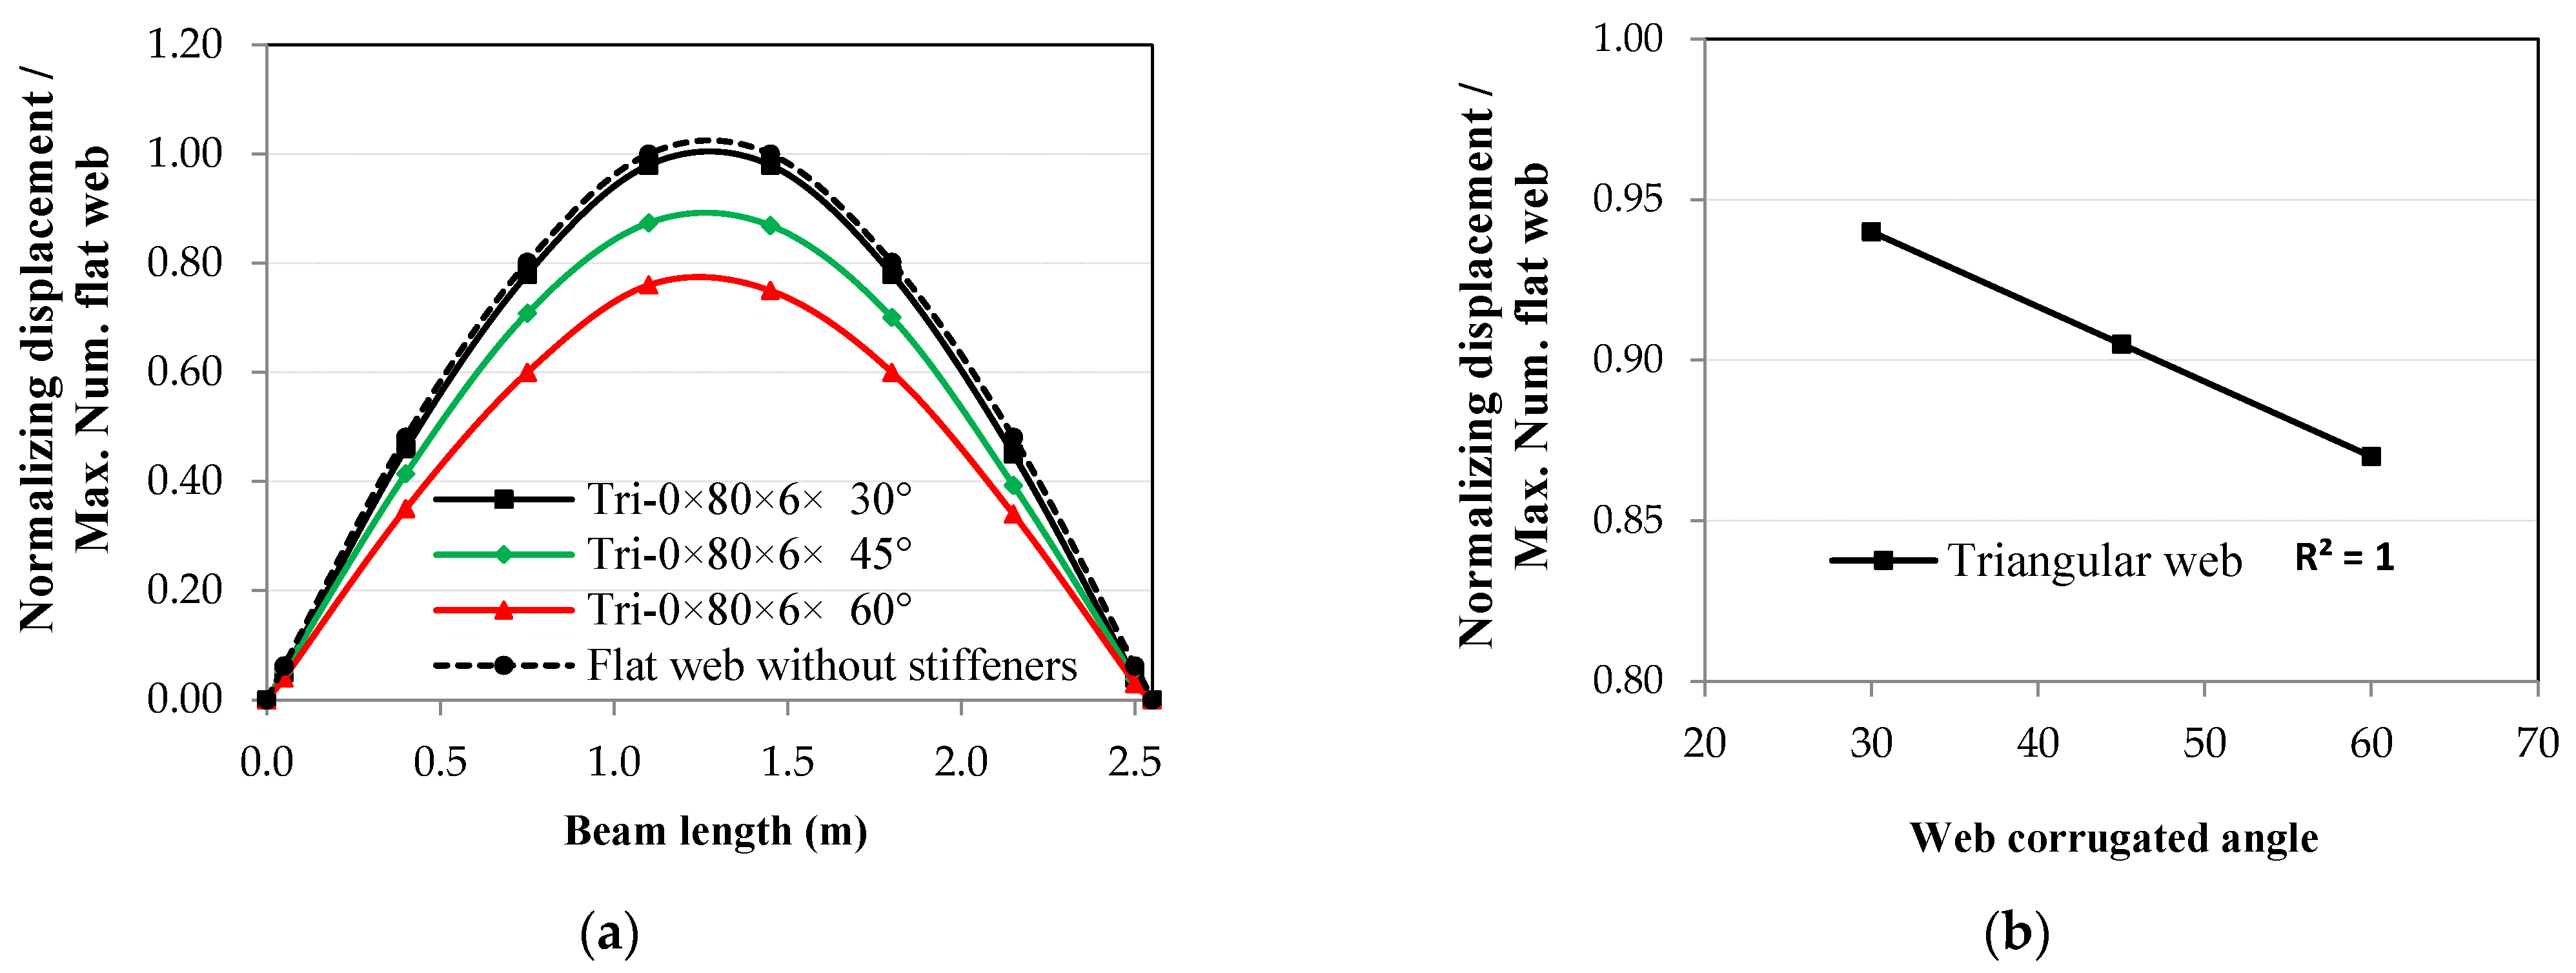
4.3.4. Angle of Corrugated Web

One of the most critical parameters in the corrugated web is the corrugation inclination angle, especially for triangular shapes. When the corrugated web angle increased, the displacements of the same mode shape decreased in the 1st, 2nd, and 3rd mode shapes, as shown in Figure 18, Figure 19 and Figure 20. The effect was linear only for the triangular corrugated web in the 1st and 2nd mode shapes, with a coefficient of correlation, r, equal to 1.00, but asymptotic to linear for the 3rd mode shape, with r = 0.97. From Figure 18b, Figure 19b and Figure 20b, for the triangular corrugated web, the ratio of decrease reached 0.87, 0.60, and 0.74 for the 1st, 2nd, and 3rd modes shapes, respectively, when the angle of the corrugated web was equal to 60°. Figure 18, Figure 19 and Figure 20 show that the section resistance to displacements in all mode shapes was enhanced for any value of the corrugation angle.

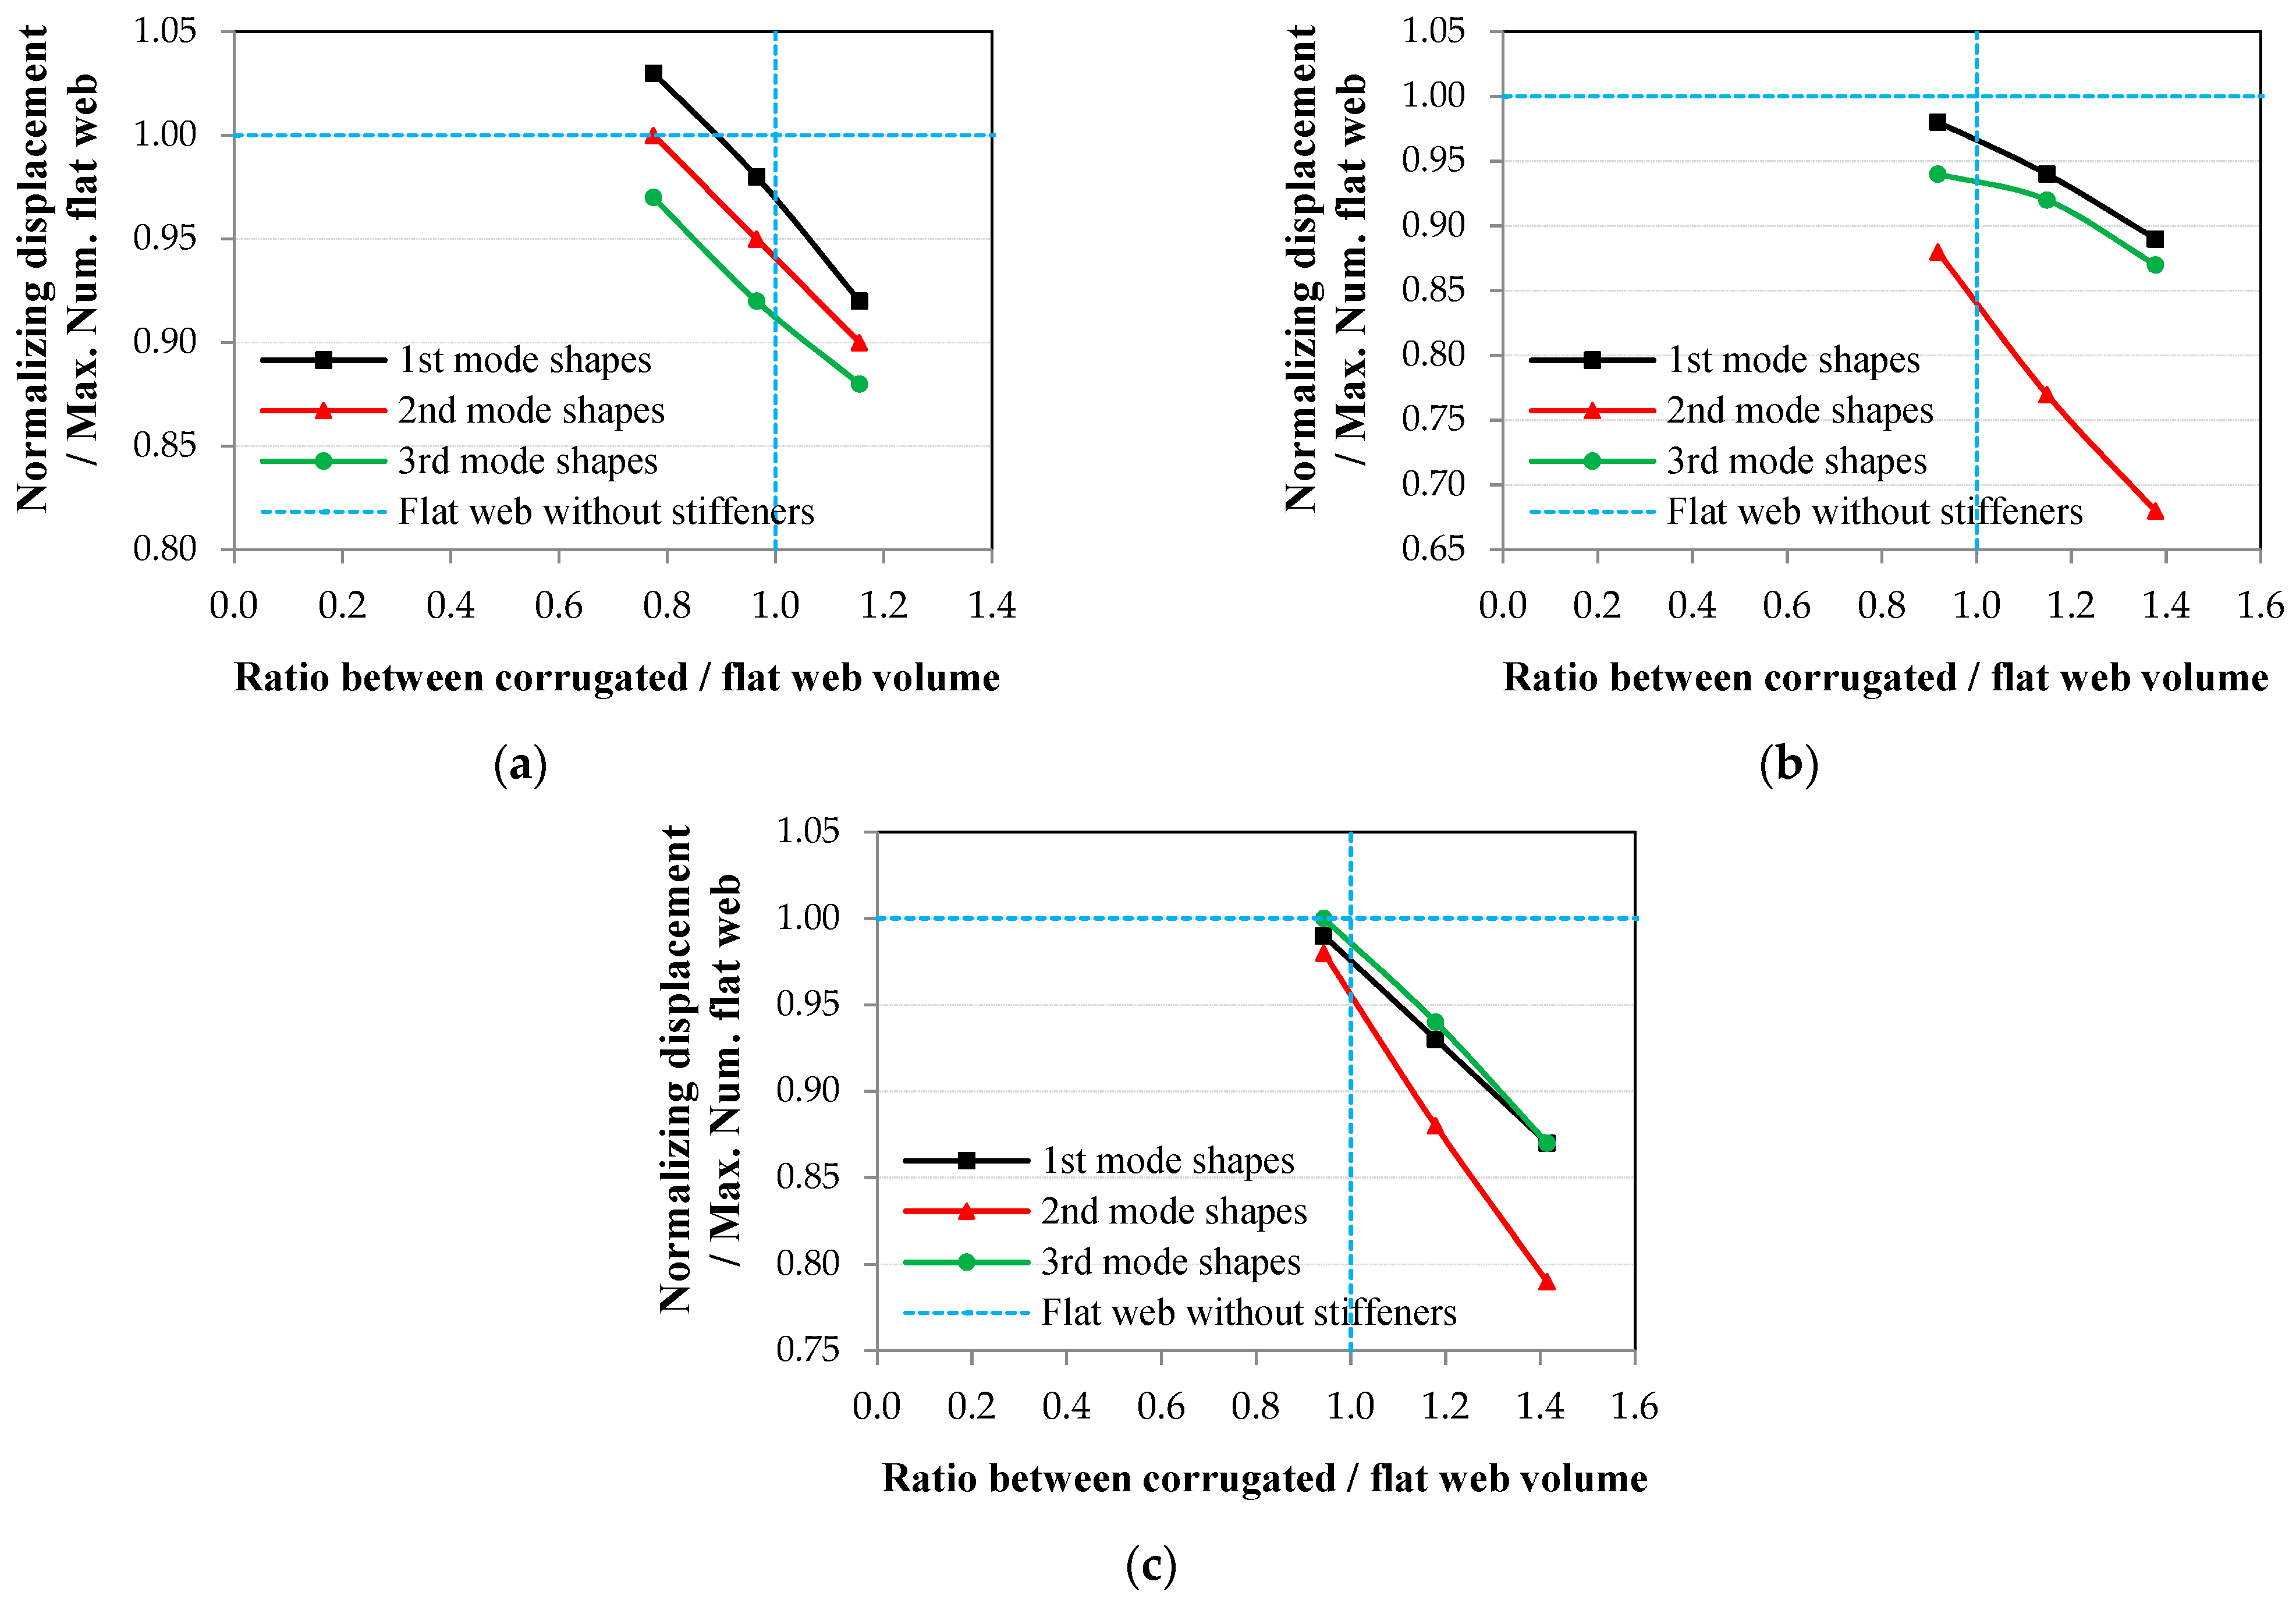
4.3.5. Corrugated Web Volume Effect

The primary purpose of using steel beams with corrugated webs in their different shapes is to save on the volume of materials used to make these webs. When using a corrugated web with a thickness equal to the thickness of the flat web, the volume of the corrugated web will be greater than the volume of the flat web, so it always positively affects the efficiency and resistance of the steel beams. However, with the use of the corrugated web system, a web volume less than a flat web can be obtained by reducing the thickness of the corrugated web. However, steel beams with high efficiency in resisting free vibrations can be obtained. Figure 21 represents the relationship between the normalized displacement with the ratio of the volume of the corrugated web to the volume of the flat web without stiffeners. Through Figure 21a for the trapezoidal corrugated web, it was found that it was possible to obtain a corrugated web with a volume less than the flat web by 0.774 to obtain a resistance for the 1st, 2nd, and 3rd mode shapes equal to 1.03, 1.00, and 0.97, respectively, compared to the beam with a flat web. Through Figure 21b for the rectangular corrugated web, it was found that it was possible to obtain a corrugated web with a volume less than the flat web by 0.918 to obtain a resistance for the 1st, 2nd, and 3rd mode shapes equal to 0.98, 0.88, and 0.94, respectively, compared to the beam with a flat web. Through Figure 21b for the triangular corrugated web, it was found that it was possible to obtain a corrugated web with a volume less than the flat web by 0.943 to obtain a resistance for the 1st, 2nd, and 3rd mode shapes equal to 0.99, 0.98, and 1.00, respectively, compared to the beam with a flat web.
Through Figure 21, it can be noted that the reason for the increase in the efficiency and resistance of the steel beams to resist free vibrations is due to two things. The first is using a corrugated web with a volume greater than or equal to the volume of a flat web. This results when using different types of corrugated webs with a thickness equal to the thickness of the flat web. Secondly, when using the corrugated web, it works to provide repeated stiffeners due to the transverse part on the axis of the steel beam. It works as a stiffener. Therefore, these two reasons can combine with each other, and this causes a significant increase in the efficiency and resistance of the steel beam, or the second reason can occur only when using a corrugated web with a thickness less than the flat web.

4.4. Natural Frequencies (Free Vibration)

One of the essential features of the beam section is its resistance to free vibrations, given that the higher the rigidity of the beam section, the higher its resistance to natural frequencies will be. After that, the records have shown that natural frequencies are a function of corrugated web thickness, width, length, and angle.

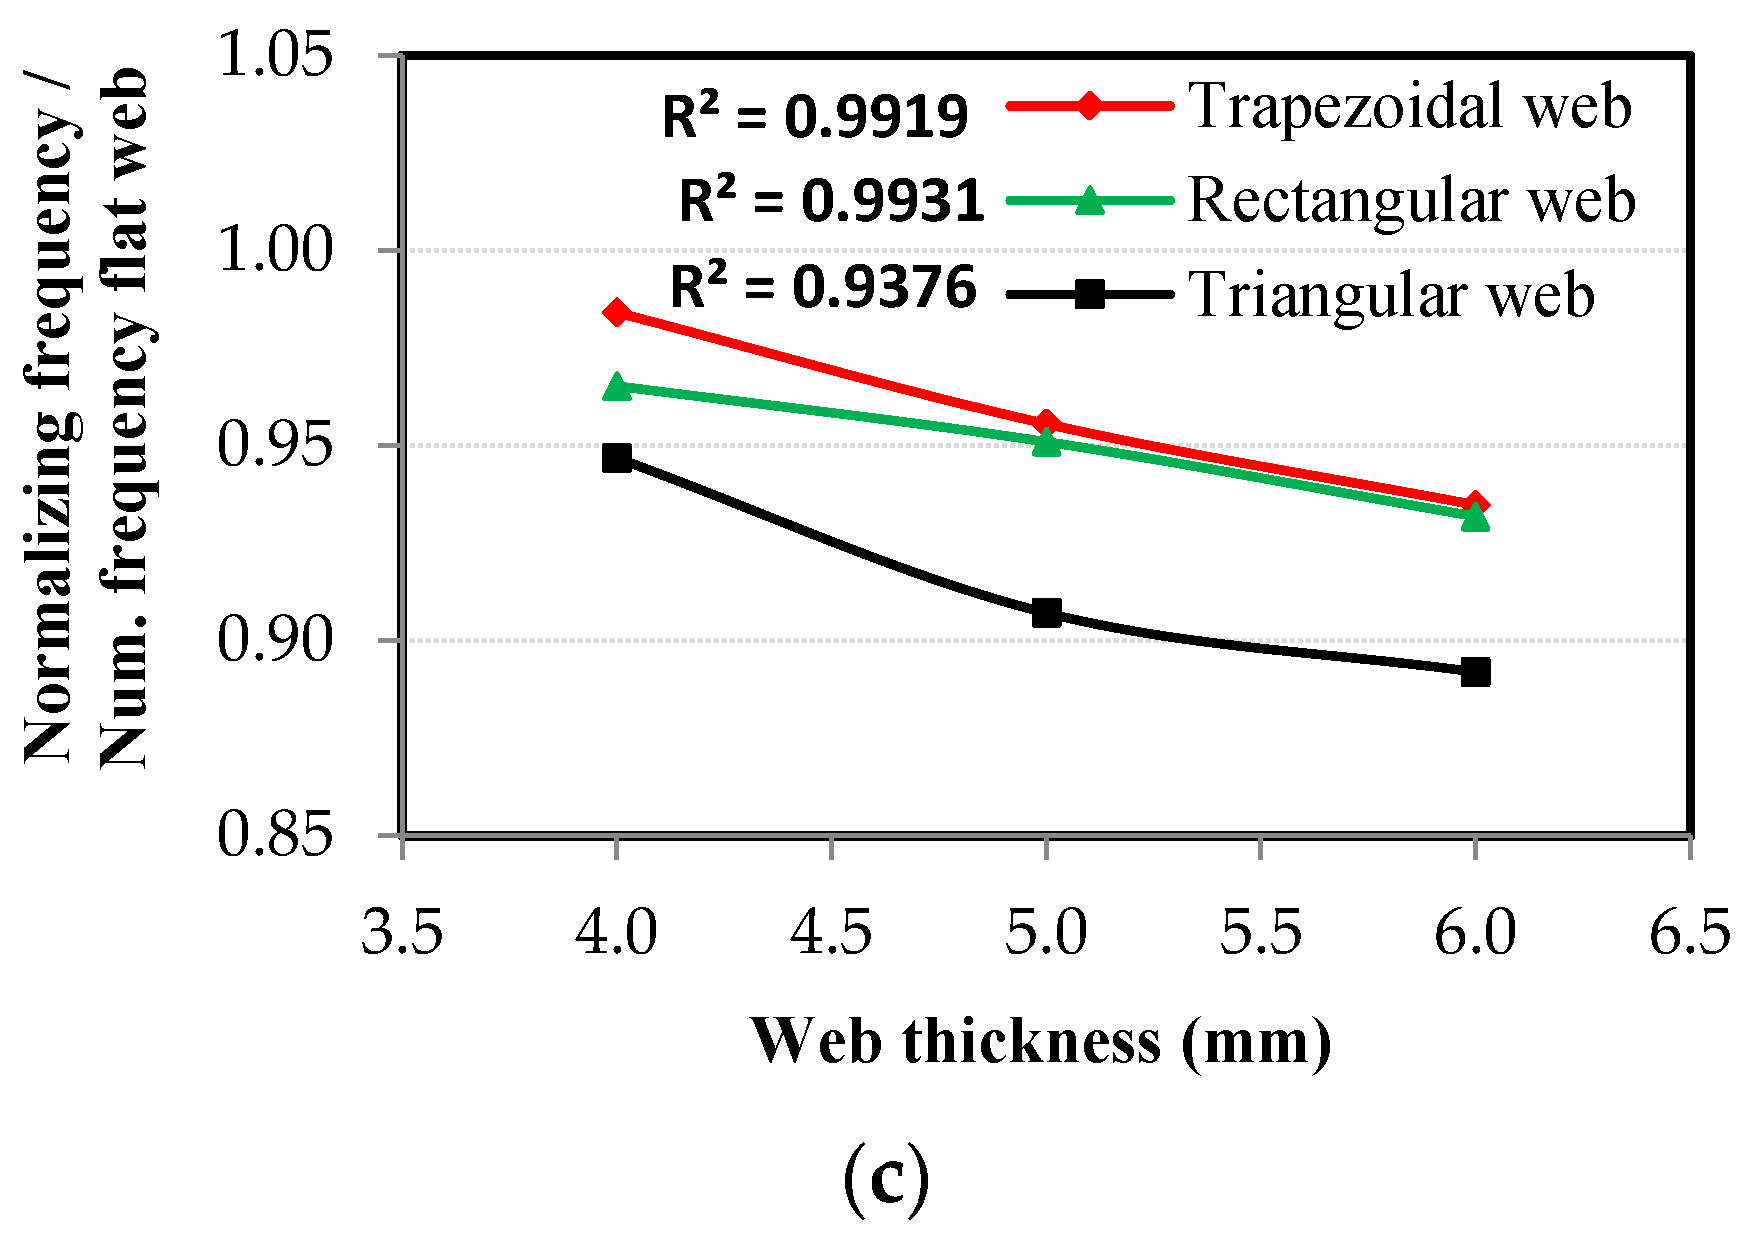
4.4.1. Thickness of Corrugated Web

The thickness of the steel web has a noticeable effect on the stiffness of the steel section and natural frequencies (Figure 22). While the thickness of the web increased in all types of corrugated web, the natural frequencies of the same mode shape decreased in the 1st, 2nd, and 3rd mode shapes. The effect was almost linear for the trapezoidal type of corrugated web, with the coefficient of correlation r = 1.00, but asymptotic to linear at r = 0.97 for the triangular and rectangular types of corrugated web. The effect of the shape of the corrugated web affects the values of decrease for the same thickness. For the case of the 1st mode shape (Figure 22a), it was found that the optimum type of corrugated web was the triangular one, followed by the rectangular, and then the trapezoidal, where the ratio of decrease reached 0.88, 0.91, and 0.92, respectively, when the thickness of the corrugated web was equal to the thickness of the flat web, 6 mm. Figure 22b for the 2nd mode shape case shows that the ratio of decrease reached 0.89, 0.94, and 0.94 for triangular, rectangular, and trapezoidal, respectively. For the case of the 3rd mode shape (Figure 22c), the ratio of decrease reached 0.89, 0.93, and 0.93 for triangular, rectangular, and trapezoidal, respectively. It is also clear from Figure 22 that it is possible to see that the natural frequency values decreased by 0.99, 0.97, and 0.96 for the trapezoidal, rectangular, and triangular webs, respectively, with the thickness of the corrugated web being 33% less than that of the flat web. This result shows the efficiency of the corrugated web over that of the flat web.

4.4.2. Width of Corrugated Web

As the corrugated web width increased for all types of corrugated web, the natural frequencies of the same mode shape decreased in the 1st, 2nd, and 3rd mode shapes, as shown in Figure 23. The effect was linear only for triangular in the 2nd mode shape and rectangular in the 3rd mode shape, as the value r = 1.00. The effect of the shape of the corrugated web affects the values of decrease that occur at the same corrugated width. In Figure 23a, for the case of the 1st mode shape, the best type of corrugated web was the triangular, followed by the rectangular, and then the trapezoidal, and the ratio of decrease reached 0.88, 0.91, and 0.92, respectively, when the width of the corrugated web was equal to 80 mm. In Figure 23b, for the case of the 2nd mode shape, the ratio of decrease reached 0.89, 0.94, and 0.94 for triangular, rectangular, and trapezoidal, respectively. In Figure 23c, for the case of the 3rd mode shape, the ratio of decrease reached 0.89, 0.93, and 0.93 for triangular, rectangular, and trapezoidal, respectively. Figure 23 shows that an enhancement of the section resistance to natural frequencies in all mode shapes was achieved for any value of the corrugation width.

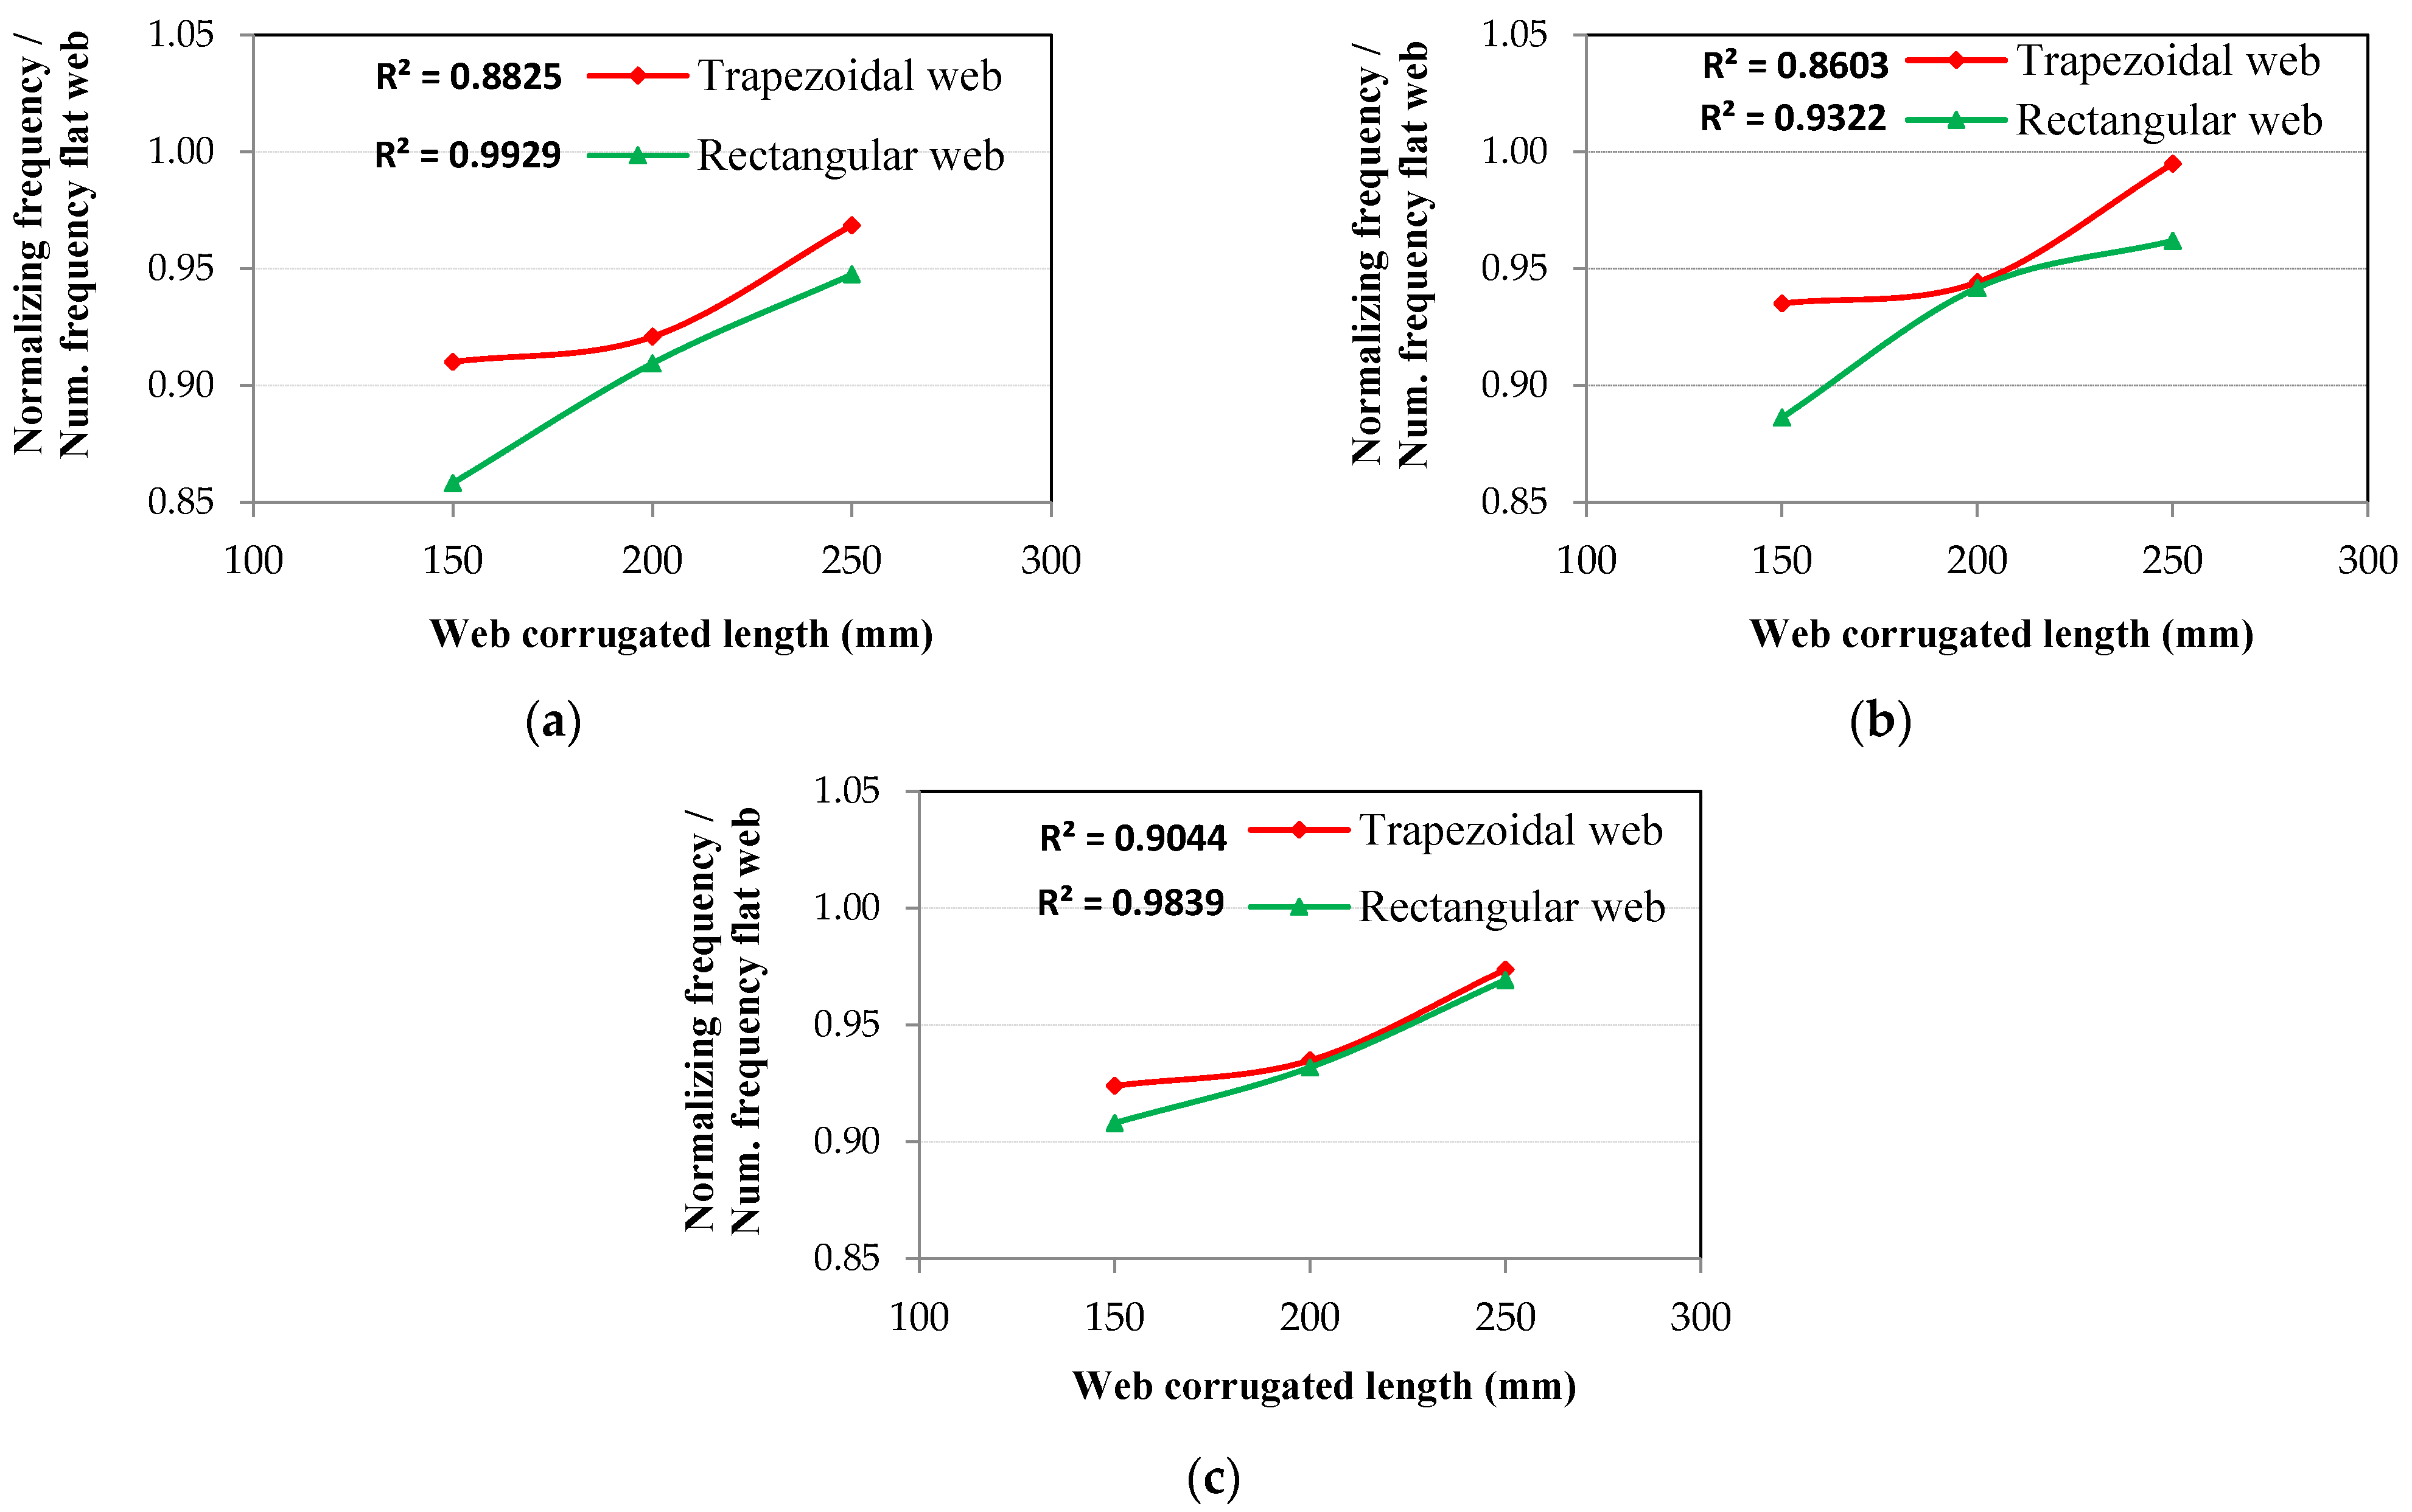
4.4.3. Length of Corrugated Web

As the corrugated web length decreases in all types of corrugated web, the natural frequencies of the same mode shape decrease in the 1st, 2nd, and 3rd mode shapes, as shown in Figure 24. The effect was linear only for the rectangular corrugated web in the 1st mode shape, as measured by r = 1.00, but asymptotic to linear at r = 0.97 for the 2nd and 3rd mode shapes. The shape effect of the corrugated web affects the values of the decrease that occurs at the same corrugated length. From Figure 24, the best type of corrugated web is rectangular, where the ratio of decrease reached 0.86, 0.89, and 0.91 for the 1st, 2nd, and 3rd mode shapes, respectively, when the length of the corrugated web was equal to 150 mm. For the trapezoidal web, the decrease ratio reached 0.91, 0.94, and 0.92 for the 1st, 2nd, and 3rd mode shapes.

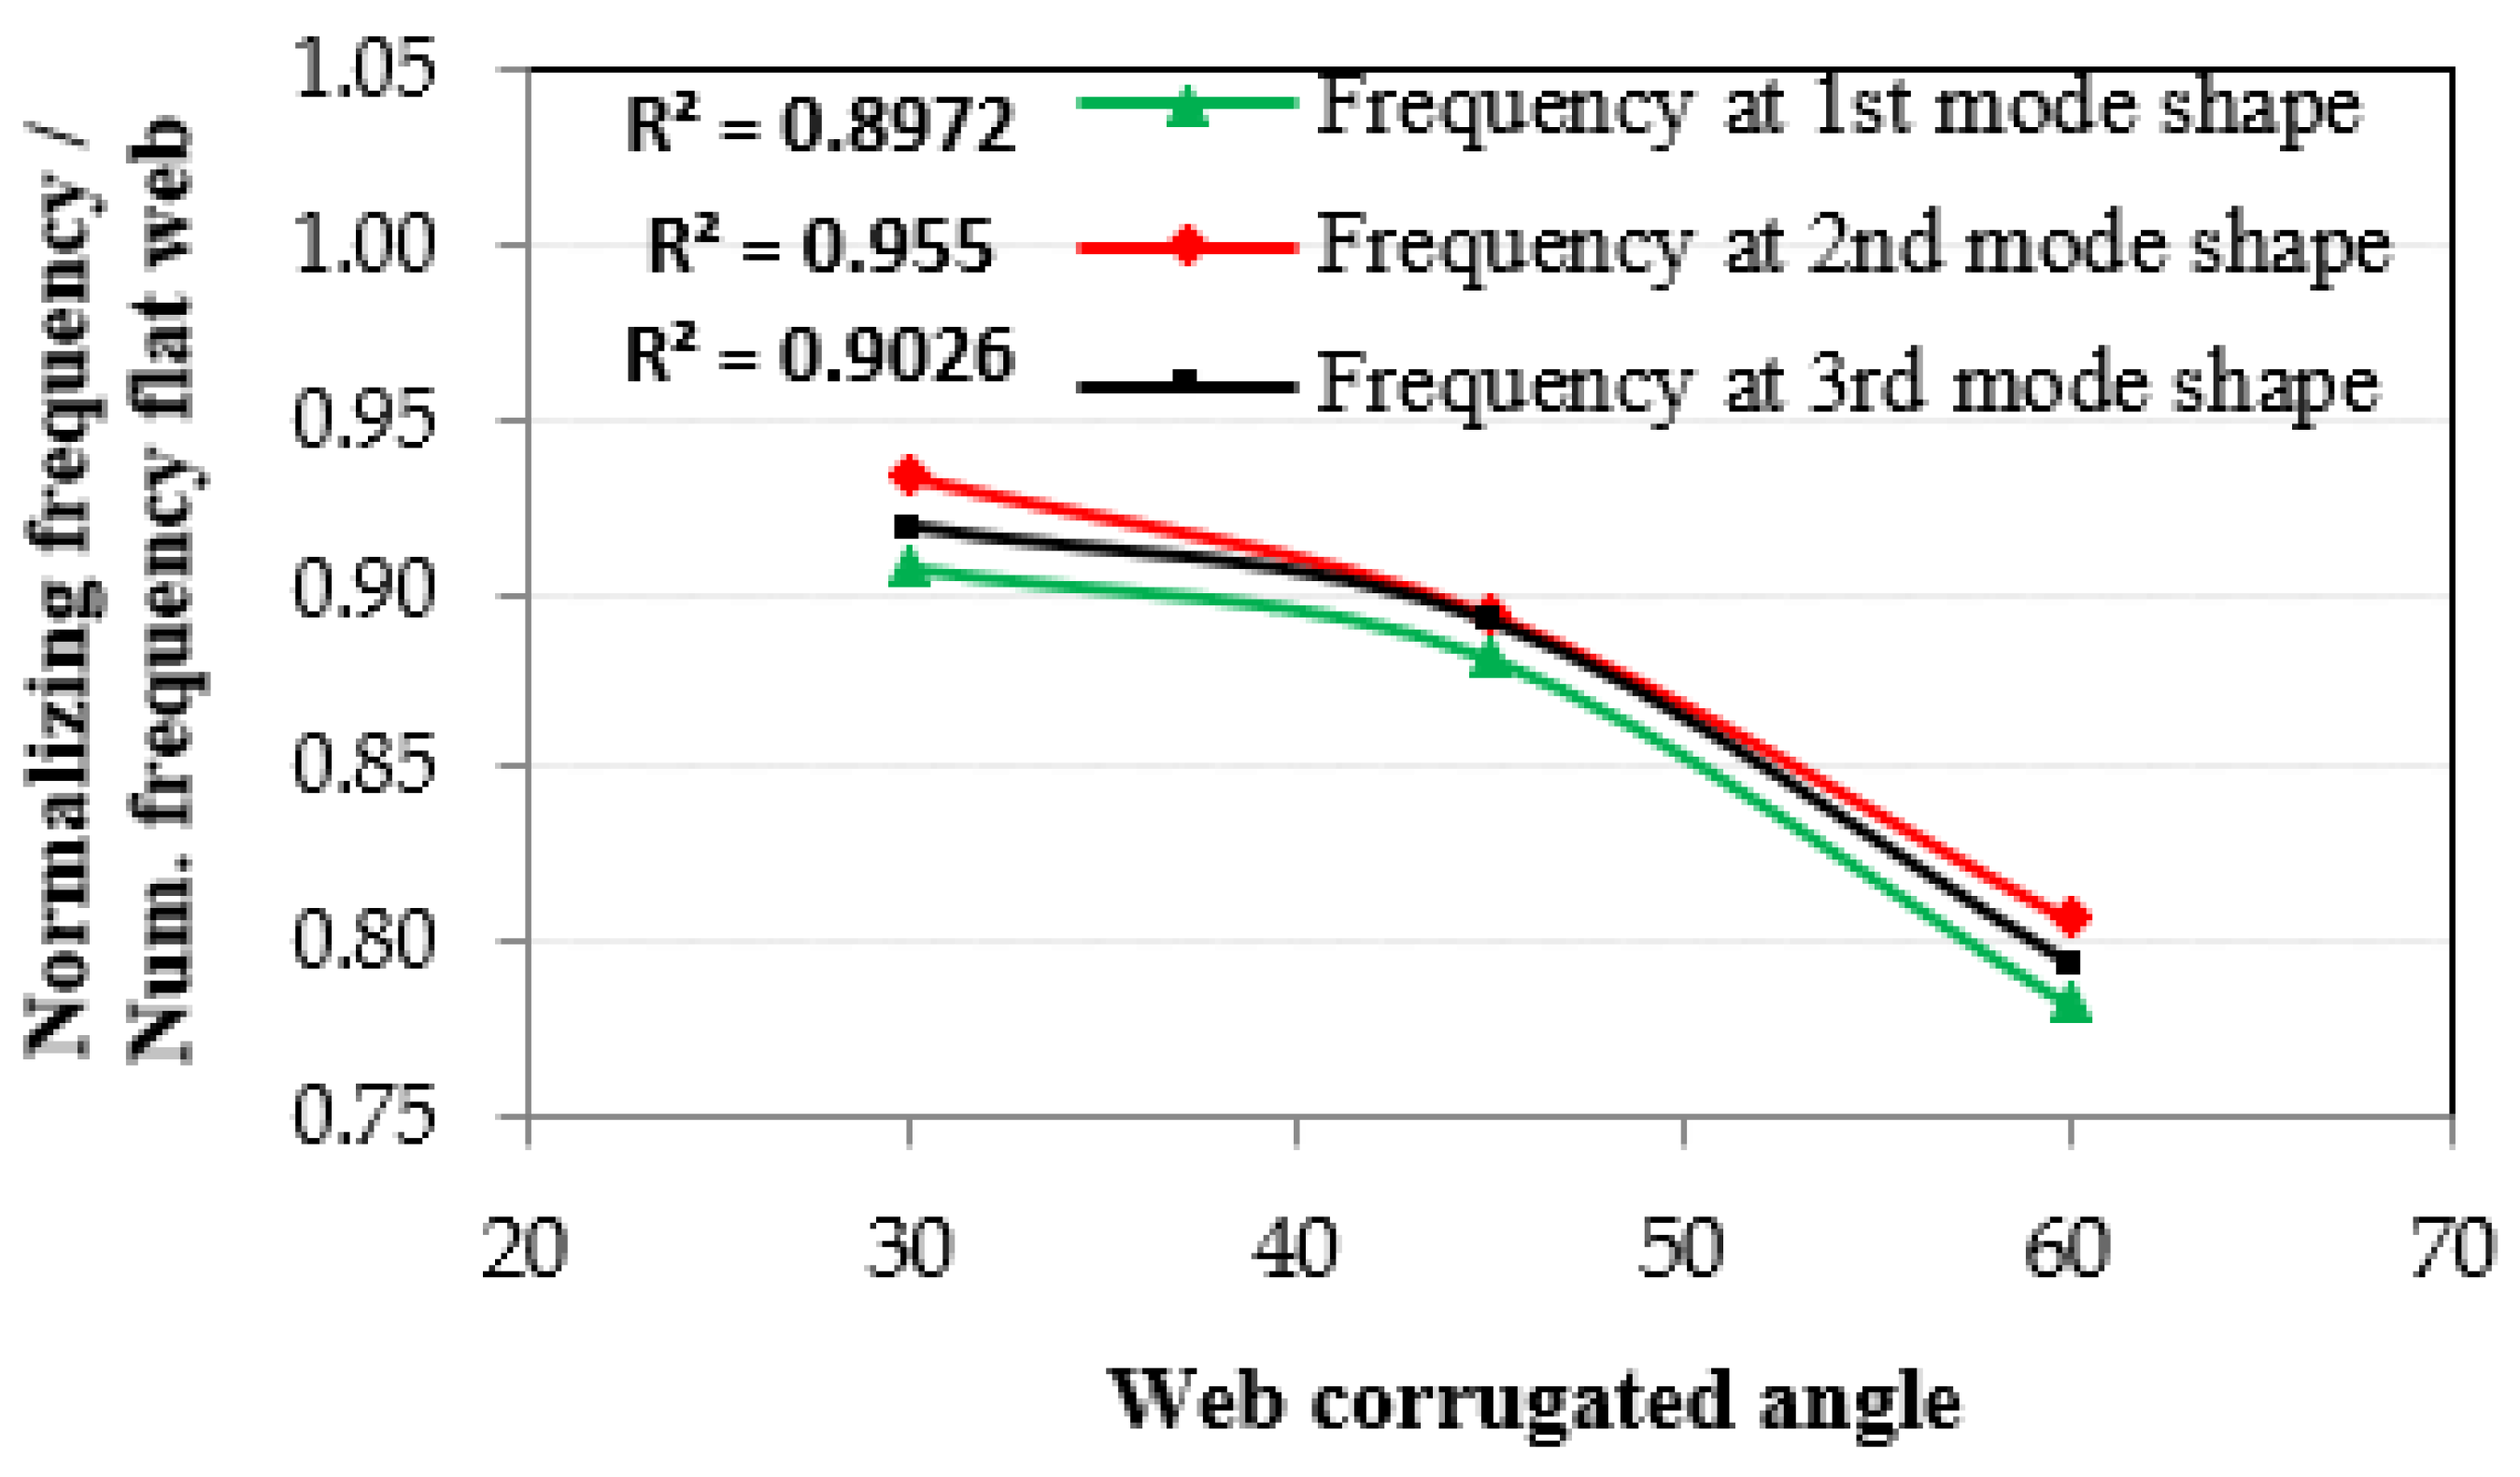
4.4.4. The Angle of Corrugated Web

As the corrugated web angle increases, the natural frequencies of the same mode shape decrease in the 1st, 2nd, and 3rd mode shapes, as shown in Figure 25. From Figure 25, for the triangular corrugated web, the ratio of decrease reached 0.78, 0.81, and 0.79 for the 1st, 2nd, and 3rd mode shapes, respectively, when the angle of the corrugated web was equal to 60°. Figure 25 shows that the section resistance to natural frequencies was improved for any value of the corrugation angle.

5. Conclusions

The effect of the corrugated web steel beam on flexure mode shape changes and natural frequencies was studied using FE numerical analysis. To verify the accuracy of the FE numerical analysis, experimental tests were conducted on two flat web steel beams with and without stiffeners, and the results were compared with the same type of beams from the FE numerical analysis. The results showed high accuracy in predicting flexure mode shape changes as well as natural frequencies. The results acquired from the study of the beams with corrugated webs are listed as follows:
  • Using a corrugated web increases the stiffness of the beam, which reduces both the flexure displacement mode shapes and natural frequencies compared to a flat web with the same thickness, where the decrease ratio reached 0.59 and 0.78, respectively.
  • In the 1st flexure displacement mode shapes, the best corrugated web was the triangular one, followed by the rectangular, and then the trapezoidal.
  • In the 2nd and 3rd flexure displacement mode shapes, the best corrugated web was the rectangular one, followed by the triangular, and then the trapezoidal.
  • In terms of natural frequency resistance, the best corrugated web was the triangular one, followed by the rectangular, and then the trapezoidal for any mode shape.
  • It is possible to obtain a section resistance for the same values of displacement mode shapes and natural frequencies while saving on the thickness of the web by 33% when using the corrugated web instead of the flat web.
  • The effect of the angle of the corrugated web in the triangular type is very effective on the resistance of displacement mode shapes and natural frequencies, where the ratio of decrease reached 0.60 and 0.78, respectively, for an angle of 60°.
Through these conclusions, it is possible to replace the flat webs of the steel beams with other corrugated webs of different shapes to increase the efficiency or use the corrugated webs to obtain the same efficiency while saving on the materials used to make the webs. In future studies, the same methodology can be used to study the effect of damage on the components of the steel beams in the webs and flanges, and to study the effect of these damages on the efficiency of the steel beams under the influence of free vibrations. Through these studies, it is possible to find mathematical relationships or recommendations in the design codes for the use of these types of corrugated webs in the steel beams to increase their efficiency.

Author Contributions

Conceptualization, A.M.S.; methodology, A.M.S. and Y.G.E.; software, A.M.S.; validation, A.M.S., Y.G.E. and O.E.; formal analysis, A.M.S.; investigation, A.M.S. and O.E.; resources, A.M.S.; data curation, A.M.S. and Y.G.E.; writing—original draft preparation, A.M.S.; writing—review and editing, Y.G.E. and O.E.; visualization, A.M.S.; supervision, A.M.S.; project administration, A.M.S., Y.G.E. and O.E. All authors have read and agreed to the published version of the manuscript.

Funding

This research received no external funding.

Institutional Review Board Statement

Not applicable.

Data Availability Statement

The data presented in this study are available upon request from the corresponding author.

Acknowledgments

The Deanship of Scientific Research, Majmaah University, deserves special thanks for his generous support for the accomplishment of this task under Project Number R-2022-52.

Conflicts of Interest

The authors declare no conflict of interest.

References

  1. Luo, R.; Edlund, B. Ultimate strength of girders with trapezoidal corrugated webs under patch loading. Thin Walled Struct. 1996, 24, 135–156. [Google Scholar] [CrossRef]
  2. Li, G.Q.; Jiang, J.; Zhu, Q. Local buckling of compression flanges of H-beams with corrugated webs. J. Constr. Steel Res. 2015, 112, 69–79. [Google Scholar] [CrossRef]
  3. Chan, C.L.; Khalid, Y.A.; Sahari, B.B.; Hamouda, A.M.S. Finite element analysis of corrugated web beams under bending. J. Constr. Steel Res. 2002, 58, 1391–1406. [Google Scholar] [CrossRef]
  4. Sayed-Ahmed, E.Y. Lateral stability of plate girders with corrugated steel webs. In Proceedings of the 31st Canadian Society for Civil Engineering Conference: Building our Civilization, Moncton, NB, Canada, 4–7 June 2003; pp. 1244–1253. [Google Scholar]
  5. Kazemi nia Korrani, H.R. Lateral bracing of I-girder with corrugated webs under uniform bending. J. Constr. Steel Res. 2010, 66, 1502–1509. [Google Scholar] [CrossRef]
  6. Al-Kanon, M.A.A.; Suhiel, I.A. Flexural behavior of steel beam with corrugated web. Int. J. Sci. Technol. Res. 2019, 8, 3004–3009. [Google Scholar]
  7. Moon, J.; Yi, J.W.; Choi, B.H.; Lee, H.E. Lateral-torsional buckling of I-girder with corrugated webs under uniform bending. Thin Walled Struct. 2009, 47, 21–30. [Google Scholar] [CrossRef]
  8. Al-Mawashee, H.S.; Al-Kannoon, M.A.A. Flexural strength of castellated beams with corrugated webs. J. Phys. Conf. Ser. 2021, 1973, 1–10. [Google Scholar] [CrossRef]
  9. Abbas, H.H.; Sause, R.; Driver, R.G. Simplified analysis of flange transverse bending of corrugated web I-girders under in-plane moment and shear. Eng. Struct. 2007, 29, 2816–2824. [Google Scholar] [CrossRef]
  10. Driver, R.G.; Abbas, H.H.; Sause, R. Shear behavior of corrugated web bridge girders. J. Struct. Eng. 2006, 132, 195–203. [Google Scholar] [CrossRef]
  11. Moon, J.; Yi, J.; Choi, B.H.; Lee, H.E. Shear strength and design of trapezoidally corrugated steel webs. J. Constr. Steel Res. 2009, 65, 1198–1205. [Google Scholar] [CrossRef]
  12. Kövesdi, B.; Dunai, L. Fatigue life of girders with trapezoidally corrugated webs: An experimental study. Int. J. Fatigue 2014, 64, 22–32. [Google Scholar] [CrossRef]
  13. Anami, K.; Sause, R.; Abbas, H.H. Fatigue of web-flange weld of corrugated web girders: 1. Influence of web corrugation geometry and flange geometry on web-flange weld toe stresses. Int. J. Fatigue 2005, 27, 373–381. [Google Scholar] [CrossRef]
  14. Wang, S.; Liu, Y.; He, J.; Xin, H.; Yao, H. Experimental study on cyclic behavior of composite beam with corrugated steel web considering different shear-span ratio. Eng. Struct. 2019, 180, 669–684. [Google Scholar] [CrossRef]
  15. Shimizu, N.; Kanno, R.; Ikarashi, K.; Sato, K.; Hanya, K. Cyclic behavior of corrugated steel shear diaphragms with end failure. J. Struct. Eng. 2013, 139, 796–806. [Google Scholar] [CrossRef]
  16. Emami, F.; Mofid, M.; Vafai, A. Experimental study on cyclic behavior of trapezoidally corrugated steel shear walls. Eng. Struct. 2013, 48, 750–762. [Google Scholar] [CrossRef]
  17. Brownjohn, J.M.W.; Dumanoglu, A.A.; Severn, R.T. Ambient vibration survey of the fatih sultan mehmet (second Bosporus) suspension bridge. Earthq. Eng. Struct. Dyn. 1992, 21, 907–924. [Google Scholar] [CrossRef]
  18. Brownjohn, J.M.W.; Magalhaes, F.; Caetano, E.; Cunha, A. Ambient vibration re-testing and operational modal analysis of the humber bridge. Eng. Struct. 2010, 32, 2003–2018. [Google Scholar] [CrossRef] [Green Version]
  19. Zhong, S.; Oyadiji, S.O. Crack detection in simply supported beams without baseline modal parameters by stationary wavelet transform. Mech. Syst. Signal Process. 2007, 21, 1853–1884. [Google Scholar] [CrossRef]
  20. Zhong, S.; Oyadiji, S.O. Detection of cracks in simply-supported beams by continuous wavelet transform of reconstructed modal data. Comput. Struct. 2011, 89, 127–148. [Google Scholar] [CrossRef] [Green Version]
  21. Whalen, O.T.M. The behavior of higher order mode shape derivatives in damaged beam-like structures. J. Sound Vib. 2008, 309, 426–464. [Google Scholar] [CrossRef]
  22. Jiang, X.; Ma, Z.J.; Ren, W.X. Crack detection from the slope of the mode shape using complex continuous wavelet transform. Comput. Aided Civ. Inf. 2012, 27, 187–201. [Google Scholar] [CrossRef]
  23. Pandey, A.K.; Biswas, M.; Samman, M.M. Damage detection from changes in curvature mode shapes. J. Sound Vib. 1991, 145, 321–332. [Google Scholar] [CrossRef]
  24. Maia, N.M.M.; Silva, J.M.M.; Almas, E.A.M. Damage detection in structures: From mode shape to frequency response function methods. Mech. Syst. Signal Process. 2003, 17, 489–498. [Google Scholar] [CrossRef]
  25. Rucevskis, S.; Janeliukstis, R.; Akishin, P.; Chate, A. Mode shape-based damage detection in plate structure without baseline data. Struct. Control Health Monit. 2016, 23, 1180–1193. [Google Scholar] [CrossRef]
  26. Chaudhari, T.D.; Maiti, S.K. A study of vibration of geometrically segmented beams with and without crack. Int. J. Solids Struct. 2000, 37, 761–779. [Google Scholar] [CrossRef]
  27. Dimarogonas, A.D. Vibration of cracked structures, a state-of-the-art review. Eng. Fract. Mech. 1996, 55, 831–857. [Google Scholar] [CrossRef]
  28. Lele, S.P.; Maiti, S.K. Modeling of transverse vibration of short beams for crack detection and measurement of crack extension. J. Sound Vib. 2002, 257, 559–583. [Google Scholar] [CrossRef]
  29. Khiem, N.T.; Tran, H.T. A procedure for multiple crack identification in beam-like structures from natural vibration mode. J. Vib. Control 2014, 20, 1417–1427. [Google Scholar] [CrossRef]
  30. Sayed, A.M. Numerical analysis of single-angle steel member under tension load with damage in the unconnected leg. Structures 2020, 25, 920–929. [Google Scholar] [CrossRef]
  31. Jaishi, B.; Ren, W.X. Damage detection by finite element model updating using modal flexibility residual. J. Sound Vib. 2006, 290, 369–387. [Google Scholar] [CrossRef]
  32. Ren, W.X.; Peng, X.L. Baseline finite element modeling of a large span cable-stayed bridge through field ambient vibration tests. Comput. Struct. 2005, 83, 536–550. [Google Scholar] [CrossRef]
  33. Chang, C.C.; Chang, T.Y.P.; Zhang, Q.W. Ambient vibration of long-span cable-stayed bridge. J. Bridge Engrg. ASCE 2001, 6, 46–53. [Google Scholar] [CrossRef]
  34. Lu, W.; Mäkeläinen, P.; Outinen, J. Finite element modeling of single lap shear screw connection in steel sheeting in fire. Open Constr. Build. Technol. J. 2008, 2, 257–261. [Google Scholar] [CrossRef] [Green Version]
  35. Sayed, A.M. Numerical analysis of the perforated steel sheets under uni-axial tensile force. Metals 2019, 9, 632. [Google Scholar] [CrossRef] [Green Version]
  36. Gao, F.; Hu, B.; Zhu, H.P. Parametric equations to predict LJF of completely overlapped tubular joints under lap brace axial loading. J. Constr. Steel Res. 2013, 89, 284–292. [Google Scholar] [CrossRef]
  37. Gao, F.; Hu, B.; Zhu, H.P. Local joint flexibility of completely overlapped tubular joints under in-plane bending. J. Constr. Steel Res. 2014, 99, 1–9. [Google Scholar] [CrossRef]
  38. Gao, F.; Hu, B. Local joint flexibility of completely overlapped tubular joints under out-of-plane bending. J. Constr. Steel Res. 2015, 115, 121–130. [Google Scholar] [CrossRef]
  39. American Society for Testing and Materials (ASTM). ASTM Standards A370-08a; Standard Test Methods and Definitions for Mechanical Testing of Steel Products. American Society for Testing and Materials (ASTM): West Conshohocken, PA, USA, 2008. [Google Scholar]
  40. ANSYS, Inc. ANSYS User’s Manual; Version (15); Swanson Analysis Systems, Inc.: Cannonsburg, PA, USA, 2015. [Google Scholar]
  41. Seif, M.; Main, J.; Weigand, J.; McAllister, T.P.; Luecke, W. Finite element modeling of structural steel component failure at elevated temperatures. Structures 2016, 6, 134–145. [Google Scholar] [CrossRef]
Figure 1. Flat web beams’ elevation, cross-section, and arrangement of stiffeners and accelerometers.
Metals 12 00938 g001
Figure 2. Multi-channel digital data acquisition system and arrangement of accelerometers on the top flange of the beam.
Metals 12 00938 g002
Figure 3. Corrugated web shapes and location of the abbreviations used: (a) Trapezoidal web, (b) rectangular web, and (c) triangular web.
Metals 12 00938 g003
Figure 4. Mesh sensitivity analysis.
Metals 12 00938 g004
Figure 5. Curves showing the normalized displacements’ mode shapes gained from both experimental and FE simulations: (a) flat web without stiffeners and (b) flat web with stiffeners.
Metals 12 00938 g005
Figure 6. Pattern of 1st flexure displacement mode shapes: (a) flat web with stiffener, (b) trapezoidal web, (c) rectangular web, and (d) triangular web.
Metals 12 00938 g006
Figure 7. Pattern of 2nd flexure displacement mode shapes: (a) flat web with stiffener, (b) trapezoidal web, (c) rectangular web, and (d) triangular web.
Metals 12 00938 g007
Figure 8. Pattern of 3rd flexure displacement mode shapes: (a) flat web with stiffener, (b) trapezoidal web, (c) rectangular web, and (d) triangular web.
Metals 12 00938 g008
Figure 9. Thickness effect on the relationship between normalized displacement and beam length for the 1st mode shape: (a) trapezoidal web, (b) rectangular web, (c) triangular web, and (d) thickness effect at the 1st mode shape.
Metals 12 00938 g009
Figure 10. Thickness effect on the relationship between normalized displacement and beam length for the 2nd mode shape: (a) trapezoidal web, (b) rectangular web, (c) triangular web, and (d) thickness effect at the 2nd mode shape.
Metals 12 00938 g010
Figure 11. Thickness effect on the relationship between normalized displacement and beam length for the 3rd mode shape: (a) trapezoidal web, (b) rectangular web, (c) triangular web, and (d) thickness effect at the 3rd mode shape.
Metals 12 00938 g011
Figure 12. Corrugated width effect on the relationship between normalized displacement and beam length for the 1st mode shape: (a) trapezoidal web, (b) rectangular web, (c) triangular web, and (d) width effect at the 1st mode shape.
Metals 12 00938 g012
Figure 13. Corrugated width effect on the relationship between normalized displacement and beam length for the 2nd mode shape: (a) trapezoidal web, (b) rectangular web, (c) triangular web, and (d) width effect at the 2nd mode shape.
Metals 12 00938 g013aMetals 12 00938 g013b
Figure 14. Corrugated width effect on the relationship between normalized displacement and beam length for the 3rd mode shape: (a) trapezoidal web, (b) rectangular web, (c) triangular web, and (d) width effect at the 3rd mode shape.
Metals 12 00938 g014
Figure 15. Corrugated length effect on the relationship between normalized displacement and beam length for the 1st mode shape: (a) trapezoidal web, (b) rectangular web, and (c) length effect at the 1st mode shape.
Metals 12 00938 g015aMetals 12 00938 g015b
Figure 16. Corrugated length effect on the relationship between normalized displacement and beam length for the 2nd mode shape: (a) trapezoidal web, (b) rectangular web, and (c) length effect at the 2nd mode shape.
Metals 12 00938 g016
Figure 17. Corrugated length effect on the relationship between normalized displacement and beam length for the 3rd mode shape: (a) trapezoidal web, (b) rectangular web, and (c) length effect at the 3rd mode shape.
Metals 12 00938 g017
Figure 18. Corrugated angle effect on the relationship between normalized displacement and beam length for the 1st mode shape: (a) triangular web and (b) angle effect at the 1st mode shape.
Metals 12 00938 g018
Figure 19. Corrugated angle effect on the relationship between normalized displacement and beam length for the 2nd mode shape: (a) triangular web and (b) angle effect at the 2nd mode shape.
Metals 12 00938 g019
Figure 20. Corrugated angle effect on the relationship between normalized displacement and beam length for the 3rd mode shape: (a) triangular web and (b) angle effect at the 3rd mode shape.
Metals 12 00938 g020
Figure 21. The relationship between normalized displacement and the ratio between corrugated to flat web volume for the 1st, 2nd, and 3rd mode shapes: (a) trapezoidal web, (b) rectangular web, and (c) triangular web.
Metals 12 00938 g021
Figure 22. The relationship between normalized frequencies and corrugated web thickness: (a) frequency at the 1st mode shape, (b) frequency at the 2nd mode shape, and (c) frequency at the 3rd mode shape.
Metals 12 00938 g022aMetals 12 00938 g022b
Figure 23. The relationship between normalized frequencies and corrugated web width: (a) frequency at the 1st mode shape, (b) frequency at the 2nd mode shape, and (c) frequency at the 3rd mode shape.
Metals 12 00938 g023
Figure 24. The relationship between normalized frequencies and corrugated web length: (a) frequency at the 1st mode shape, (b) frequency at the 2nd mode shape, and (c) frequency at the 3rd mode shape.
Metals 12 00938 g024
Figure 25. The relationship between normalized frequencies and the corrugated web angle.
Metals 12 00938 g025
Table 1. List of flat and corrugated steel web beams assessed using FE modeling.
Web ShapeSteel Beam SpecimenSteel Web CharacteristicsWeb Longitudinal Section Volume
Shape-l × w × t × Ɵl
(mm)
w
(mm)
t
(mm)
Ɵ(mm3)Corrugated/Flat without Stiffeners
Flat webFlat web without stiffeners6 3,060,0001.000
Flat web with stiffeners6 4,188,0001.369
TrapezoidalTra-150 × 80 × 6 × 45°15080645°3,685,2971.204
Tra-200 × 80 × 6 × 45°20080645°3,533,3031.155
Tra-250 × 80 × 6 × 45°25080645°3,421,2511.118
Tra-200 × 80 × 4 × 45°20080445°2,367,3950.774
Tra-200 × 80 × 5 × 45°20080545°2,953,8580.965
Tra-200 × 40 × 6 × 45°20040645°3,279,6991.072
Tra-200 × 60 × 6 × 45°20060645°3,408,9341.114
RectangularRec-150 × 80 × 6 × 90°15080690°4,569,6001.493
Rec-200 × 80 × 6 × 90°20080690°4,214,4001.377
Rec-250 × 80 × 6 × 90°25080690°3,948,0001.290
Rec-200 × 80 × 4 × 90°20080490°2,809,6000.918
Rec-200 × 80 × 5 × 90°20080590°3,512,0001.148
Rec-200 × 40 × 6 × 90°20040690°3,590,4001.173
Rec-200 × 60 × 6 × 90°20060690°3,902,4001.275
TriangularTri-0 × 40 × 6 × 45°040645°4,327,5051.414
Tri-0 × 60 × 6 × 45°060645°4,327,4801.414
Tri-0 × 80 × 6 × 45°080645°4,327,5441.414
Tri-0 × 80 × 4 × 45°080445°2,884,9990.943
Tri-0 × 80 × 5 × 45°080545°3,606,2471.179
Tri-0 × 80 × 6 × 30°080630°3,523,3101.151
Tri-0 × 80 × 6 × 60°080660°6,110,9151.997
Table 2. Comparison of experimental and numerical results for the flat web beam without stiffeners.
Analysis TypeMode ShapeNormalized Displacement/Maximum Exp. Flat Web Beam Without StiffenerAverageCOV
%
Frequency
12345678Value HzNum./Exp.
Experimental1st0.070.510.820.971.000.780.500.07 104.16
Numerical1st0.060.480.811.011.010.810.480.06 100.99
Num./Exp.0.900.950.981.031.011.040.960.930.985.06 0.97
Experimental2nd0.180.911.000.38−0.36−0.88−0.91−0.20 324.09
Numerical2nd0.190.870.970.39−0.39−0.97−0.87−0.19 322.18
Num./Exp.1.070.960.971.021.091.100.960.971.025.97 0.99
Experimental3rd0.101.020.56−0.93−1.000.620.920.10 671.21
Numerical3rd0.090.970.59−0.97−0.970.590.970.09 662.18
Num./Exp.0.920.951.051.040.970.951.060.970.995.39 0.98
Table 3. Comparison of experimental and numerical results for the flat web beam with stiffeners.
Analysis TypeMode ShapeNormalized Displacement/Maximum Exp. Flat Web Beam with StiffenerAverageCOV
%
Frequency
12345678Value HzNum./Exp.
Experimental1st0.070.460.841.000.970.770.530.06 92.38
Numerical1st0.060.500.831.031.030.830.500.06 95.03
Num./Exp.0.931.080.991.031.061.070.940.951.016.11 1.03
Experimental2nd0.080.781.000.37−0.38−0.87−0.87−0.08 305.40
Numerical2nd0.070.850.960.39−0.39−0.96−0.85−0.07 311.24
Num./Exp.0.971.090.961.051.031.100.980.961.025.69 1.02
Experimental3rd0.120.930.42−0.77−0.690.391.000.12 600.30
Numerical3rd0.110.980.40−0.73−0.730.400.980.11 594.19
Num./Exp.0.911.050.950.951.061.030.980.920.985.99 0.99
Table 4. Comparison of experimental and numerical results for the flat web beam with stiffeners.
Steel Beam SpecimenNormalized Displacement/Maximum Num. Flat Web without StiffenerFrequency (Hz)Normalized Frequency/Num. Flat Web without Stiffener
1st 2nd 3rd 1st 2nd 3rd 1st 2nd 3rd
Flat web without stiffeners1.001.001.00100.99322.18662.181.001.001.00
Tra-150 × 80 × 6 × 45°0.920.890.8791.91301.28611.800.910.940.92
Tra-200 × 80 × 6 × 45°0.920.900.8893.00304.19619.000.920.940.93
Tra-250 × 80 × 6 × 45°0.990.980.9397.82320.54644.760.970.990.97
Tra-200 × 80 × 4 × 45°1.031.000.9798.81319.67651.690.980.990.98
Tra-200 × 80 × 5 × 45°0.980.950.9295.59311.03632.790.950.970.96
Tra-200 × 40 × 6 × 45°0.981.000.9798.52314.88640.280.980.980.97
Tra-200 × 60 × 6 × 45°0.930.950.9493.07305.08620.410.920.950.94
Rec-150 × 80 × 6 × 90°0.840.590.8586.67285.54601.250.860.890.91
Rec-200 × 80 × 6 × 90°0.890.680.8791.85303.42617.040.910.940.93
Rec-250 × 80 × 6 × 90°0.930.900.9295.70309.92641.830.950.960.97
Rec-200 × 80 × 4 × 90°0.980.880.9498.30312.54639.180.970.970.97
Rec-200 × 80 × 5 × 90°0.940.770.9295.71309.90629.710.950.960.95
Rec-200 × 40 × 6 × 90°0.980.950.9497.87311.46646.450.970.970.98
Rec-200 × 60 × 6 × 90°0.950.860.9393.88304.57630.250.930.950.95
Tri-0 × 40 × 6 × 45°0.940.950.9695.67307.77619.510.950.960.94
Tri-0 × 60 × 6 × 45°0.910.860.9490.48296.55599.670.900.920.91
Tri-0 × 80 × 6 × 45°0.870.790.8789.01287.88590.650.880.890.89
Tri-0 × 80 × 4 × 45°0.990.981.0094.95310.69626.980.940.960.95
Tri-0 × 80 × 5 × 45°0.930.880.9490.62297.18600.700.900.920.91
Tri-0 × 80 × 6 × 30°0.940.960.9291.61300.58608.420.910.930.92
Tri-0 × 80 × 6 × 60°0.870.600.7479.05259.87526.000.780.810.79
Publisher’s Note: MDPI stays neutral with regard to jurisdictional claims in published maps and institutional affiliations.

